


Abstract
We examine the origin of radial and vertical gradients in the age/metallicity of the stellar component of a galaxy disc formed in the APOSTLE cosmological hydrodynamical simulations. Some of these gradients resemble those in the Milky Way, where they have sometimes been interpreted as due to internal evolution, such as scattering off giant molecular clouds, radial migration driven by spiral patterns, or orbital resonances with a bar. Secular processes play a minor role in the simulated galaxy, which lacks strong spiral or bar patterns, and where such gradients arise as a result of the gradual enrichment of a gaseous disc that is born thick but thins as it turns into stars and settles into centrifugal equilibrium. The settling is controlled by the feedback of young stars; which links the star formation, enrichment, and equilibration time-scales, inducing radial and vertical gradients in the gaseous disc and its descendent stars. The kinematics of coeval stars evolve little after birth and provide a faithful snapshot of the gaseous disc structure at the time of their formation. In this interpretation, the age-velocity dispersion relation would reflect the gradual thinning of the disc rather than the importance of secular orbit scattering; the outward flaring of stars would result from the gas disc flare rather than from radial migration; and vertical gradients would arise because the gas disc gradually thinned as it enriched. Such radial and vertical trends might just reflect the evolving properties of the parent gaseous disc, and are not necessarily the result of secular evolutionary processes.
1 INTRODUCTION
The ages and metallicities of disc stars in the Milky Way (MW) show well-established radial, vertical, and kinematic gradients. In the solar neighbourhood, for example, the velocity dispersion of stars increases with age (e.g. Wielen 1977; Quillen & Garnett 2001; Holmberg, Nordström & Andersen 2009), and age correlates, in turn, with total metallicity and, in particular, with the abundance of α elements at given [Fe/H] (e.g. Freeman & Bland-Hawthorn 2002; Haywood et al. 2013). In the disc mid-plane, the average age, and metallicity of stars decline with increasing cylindrical radius, R (e.g. Boeche et al. 2013; Hayden et al. 2014). The radial age trend is preserved but the metallicity gradient appears to reverse when considering stars at fixed vertical distances, |z|, away from the disc symmetry plane (e.g. Anders et al. 2014; Bergemann et al. 2014; Martig et al. 2016; Ness et al. 2016).
At fixed R, the vertical scale height of stars increases with decreasing metallicity or increasing age (e.g. Mikolaitis et al. 2014; Casagrande et al. 2016); these gradients depend on R and become steeper at smaller radii (Hayden et al. 2014). Finally, at fixed metallicity, the vertical scale height of stars increases (‘flares’) from the centre outwards, especially for stars with low [α/Fe] ratios; the flare depends on metallicity, becoming more pronounced at lower [Fe/H] (Bovy et al. 2016).
Although the detailed form of each of these correlations vary somewhat from study to study, their qualitative nature seems robust. Their physical origin, however, is still a matter of debate. One possibility is that, to first order, the differences between old (metal-poor) stars and young (metal-rich) stars are driven by the integrated effect of secular evolutionary processes, such as orbital scattering off molecular clouds, radial migration induced by non-axisymmetric disc features, or dynamical heating by accretion events, external perturbations, and disc instabilities. These processes naturally affect older stars more, inducing vertical gradients and systematic trends between age/metallicity and kinematics that resemble the observed ones (for a review, see Rix & Bovy 2013, and references therein).
A contrasting view is that stellar gradients are largely imprinted at birth, and thus reflect the properties of the parent (gaseous) disc at the time of formation of each coeval stellar population. In this scenario, the star formation and enrichment history of the disc are linked to the evolution of its vertical structure and to the time-scale of its dynamical equilibration (Brook et al. 2012; Bird et al. 2013; Stinson et al. 2013; Grand, Kawata & Cropper 2015; Miranda et al. 2016; Grand et al. 2017; Ma et al. 2017). At early times the gaseous disc was thick and metal poor, but it enriched as it thinned down, leaving behind a strong vertical gradient in the age and metallicity of the stars at each fixed radius, in a process reminiscent of the classic Eggen, Lynden-Bell & Sandage (1962) dissipative collapse picture. Radial gradients arise in this model simply because the gaseous disc assembles inside out and is denser near the centre, leading to faster transformation of gas into stars and more rapid enrichment than in the outskirts.
Each of these views has its pros and cons. For example, secular evolution models have difficulty accounting for the radially increasing scaleheight (‘flare’) of stars, since kinematic perturbations are expected to be weaker at larger radii on account of lower densities, and to proceed more slowly there because of longer orbital times. Birth models, on the other hand, have difficulty explaining why the vertical settling and enrichment time-scales needed to explain the data are so much longer than the local dynamical time-scale, which would naively be expected to set the collapse and equilibration time-scale of the disc.
In the Milky Way, a further complication is the presence of an apparent ‘gap’ in the α versus Fe abundances of stars at fixed R, which has often been interpreted as signalling the presence of two disc populations of possibly distinct origin: a relatively old, α-rich ‘thick’ disc mixed with a younger, α-poor ‘thin’ population of overlapping [Fe/H] (see e.g. Venn et al. 2004; Bensby et al. 2005; Navarro et al. 2011; Recio-Blanco et al. 2014, and references therein).
These complexities explain why ‘chemodynamical’ models resort to features from both formation scenarios in order to reproduce the structure of the Milky Way disc(s). Radial migration; external accretion; self-enrichment; gas outflows; and inflows; these are some of the mechanisms invoked to reproduce the peculiar kinematic and chemical structure of the Galactic thin and thick discs (see e.g. Matteucci & Francois 1989; Chiappini, Matteucci & Romano 2001; Minchev, Chiappini & Martig 2013, 2014; Schönrich & McMillan 2017, and references therein). The specificity of such models, however, hinders their general applicability to understanding the relative importance of various physical mechanisms in a typical disc galaxy.
Direct cosmological hydrodynamical simulations of disc galaxy formation offer a complementary approach, where, modulo the algorithmic choices for simulating star formation and feedback, the roles of evolutionary effects and of conditions ‘at birth’ may be contrasted and assessed in statistically significant samples. The price to pay is that very few, if any, of the models will reproduce the detailed structure of the Milky Way, implying that the physical origin of observed Galactic trends must be inferred from judicious application of lessons learned from simulated galaxies that might not necessarily resemble our Galaxy in detail.
We adopt this approach here, where we analyse the formation of a disc galaxy in the APOSTLE1 suite of cosmological hydrodynamical simulations of the Local Group (Fattahi et al. 2016; Sawala et al. 2016). Our analysis focusses on the physical origin of vertical and radial gradients of disc stars, on how they reflect the properties of the gaseous disc from which they descend, and on the effect of secular evolutionary processes that operate after their formation. Our paper is organized as follows. We describe briefly the APOSTLE numerical simulations in Section 2. Our main results are presented in Section 3. A toy model meant to illustrate how these results may be used to interpret the physical origin of vertical gradients is presented in Section 4. We end with a brief summary of our main conclusions in Section 5.
2 NUMERICAL SIMULATIONS
2.1 The APOSTLE project
The APOSTLE suite of zoomed-in ΛCDM cosmological hydrodynamical simulations evolves 12 volumes from a large cosmological box selected to resemble the main characteristics of the Local Group (LG). Each volume is centred on a pair of dark matter haloes of combined virial2 mass of the order of ≈2 × 10¹² M⊙. The pairs at lookback time t = 03 are at a relative distance of ≈800 ± 200 kpc, approach with radial velocity of up to ≈250 km s−1, have relative tangential velocities <100 km s−1, and have no other haloes of comparable mass within ≈2.5 Mpc. Details of the selection procedure are presented in Sawala et al. (2016); Fattahi et al. (2016).
All APOSTLE volumes were evolved with the same code developed for the eagle project (Crain et al. 2015; Schaye et al. 2015), which has been calibrated to reproduce some general properties of the galaxy population, such as the galaxy stellar mass function and the average size of galaxies as a function of mass. APOSTLE extends the eagle project to LG-like volumes and higher resolutions, using the fiducial choice of parameters (i.e. the ‘Ref’ model in the nomenclature of Schaye et al. 2015).
Each APOSTLE volume is resimulated at three different numerical resolutions, differing by successive factors of ≈10 in particle mass (labelled L1 to L3 in order of decreasing particle count). Our analysis will focus on the most massive of the two main galaxies in volume AP-4-L2, using the nomenclature introduced by Fattahi et al. (2016). For that run, the high-resolution particle masses are 5.9 × 10⁵ M⊙ (dark matter) and 1.2 × 10⁵ M⊙ (gas). These particles interact with a gravitational potential softened with a Plummer-equivalent spline kernel length fixed at 307 pc for z < 3 and constant in comoving units at higher redshifts.
APOSTLE runs assume a WMAP-7 cosmology throughout, with parameters ΩM = 0.272, ΩΛ = 0.728, Ωb = 0.0455, h = 0.704, and σ8 = 0.81 (Komatsu et al. 2011).
2.2 The simulated galaxy
Dark matter haloes are identified using a friends-of-friends (FoF; Davis et al. 1985) algorithm run with linking length 0.2 times the mean interparticle separation. Individual self-bound structures within these haloes are then identified recursively by the groupfinding algorithm SUBFIND (Springel et al. 2001; Dolag et al. 2009). The galaxies inhabiting the main subgroup of each FoF halo are referred to as ‘centrals’ and the rest as its ‘satellites’, if found within the virial radius of the central halo.
As stated above, we focus our analysis on a single galaxy, the more massive of the pair of central galaxies in APOSTLE volume AP-4-L2. This galaxy was selected because, at t = 0, it (i) has a prominent stellar disc; (ii) shows no obvious morphological peculiarities; (iii) has formed stars steadily throughout its history; (iv) has had a relatively quiet recent merging history; and (v) has a gas/stellar mass ratio not unlike that of the Milky Way. We emphasize that this galaxy is not a model of the Milky Way. The properties of this galaxy are representative of other disc-dominated galaxies in APOSTLE selected using similar criteria; however, since our analysis involves the detailed tracking of individual star particles it is easier to illustrate our main results by focusing on a single galaxy. Fig. 1 shows face-on and edge-on views of the galaxy, in a box ≈50 kpc on a side.
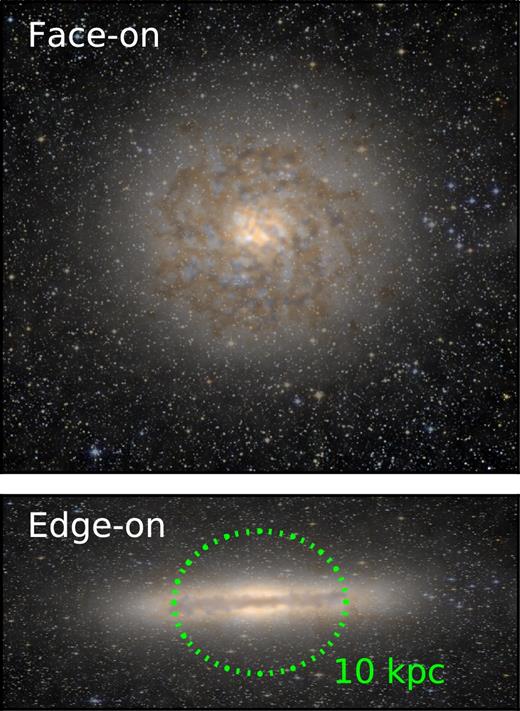
Mock image of the simulated galaxy at t = 0 seen face-on and edge-on. False colours use g, r, i broad bandpasses, as well as a simple prescription for dust absorption based on gas density and metallicity. The image is superposed on a artificial stellar field that mimics an image from the Hubble Space Telescope.
3 RESULTS
3.1 The assembly of the galaxy
The top panel of Fig. 2 shows the mass assembly history of the galaxy, as measured by the total mass of each component within a radius of 25 kpc (physical) from the centre of the progenitor halo. Most of the galaxy mass within that radius is assembled quickly: |$50\,\,\rm{per\,\,cent}$| of the dark matter mass was already in place 11.5 Gyr ago; the corresponding lookback time for the baryonic component is t ≈ 9.5 Gyr.
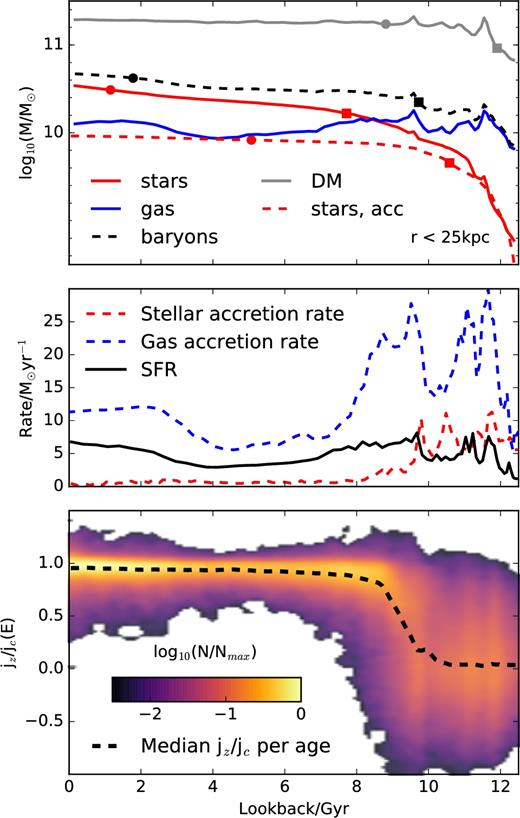
Top panel: mass of various components of the galaxy within a fixed radius of 25 (physical) kpc from the galaxy centre, as a function of lookback time. Mass components include dark matter (grey solid line), baryons (black dashed), stars (red solid), accreted stars (red dashed), and gas (blue solid). The squares and circles in each curve indicate the time when, respectively, |$50\,\,\rm{per\,\,cent}$| and |$90\,\,\rm{per\,\,cent}$| of the final mass was in place. Middle panel: gas (blue) and stellar (red) accretion rates, as a function of lookback time. The solid black line indicates the in situ star formation rate. Bottom panel: stellar age versus circularity (εJ = jz/jcirc(E)) for all stellar particles in the galaxy at t = 0. Each pixel of the heat map is coloured according to a logarithmic function of particle number. Note that some particles have εJ that slightly exceed unity; these are particles with |z| > 0 whose energies are compared with those of the midplane circular orbit at the same R. The black dashed line indicates the median circularity.
Most baryons are accreted as gas and then turn gradually into stars, as shown in the middle panel of Fig. 2. Gas is delivered to the centre of the galaxy during an early period of rapid merging that is essentially over ≈9 Gyr ago. The last episode of early accretion is depicted in Fig. 3, where we see that the accretion of a substantial amount of gas along a filamentary structure accompanies a minor merger that happened roughly 10 Gyr ago.
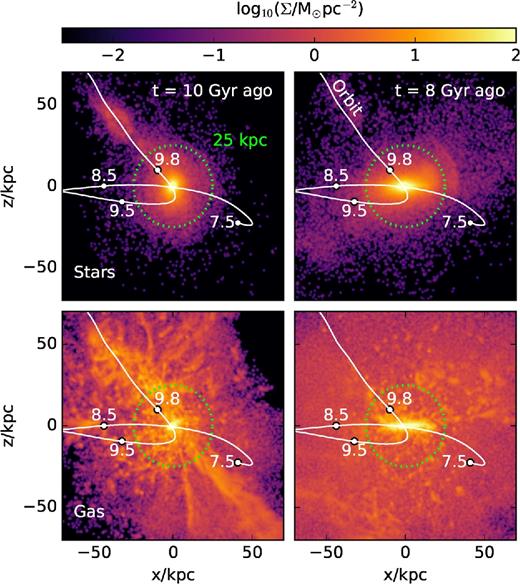
Top row: projected distribution of stellar mass at two selected lookback times. The white solid line indicates the trajectory of the last large accreted satellite (a minor merger); labels indicate the location at given lookback time. Bottom: As top row, but for the gaseous component. The accreted satellite is part of a filamentary structure that accreted roughly at the same time, substantially increasing the gas mass of the galaxy. The satellite trajectory is as in the top row.
After that accretion event the evolution of the galaxy is largely quiescent, except for an episode of gas accretion that started roughly 3 Gyr ago. This late accretion adds ≈1010 M⊙ of gas, but not many stars. This addition increases the final baryonic mass of the galaxy by |${\approx } 40\,\,\rm{per\,\,cent}$|, but nearly doubles its gas mass at the time of accretion. The extra gas (which is of relatively low metallicity) serves to ramp up the star formation rate of the galaxy and to decrease its average metallicity at late times.
The middle panel of Fig. 2 also makes clear that the large majority of stars in this galaxy were born in situ:4 fewer than |${\approx } 25\,\,\rm{per\,\,cent}$| of all star particles at t = 0 formed in other systems, and roughly |$90\,\,\rm{per\,\,cent}$| of those were accreted more than ≈9 Gyr ago.
The quiet late merging history of the galaxy, together with the fact that most baryons are accreted in gaseous form, favour the formation of a centrifugally supported disc, as may be seen in the bottom panel of Fig. 2. This panel shows the circularity parameter of star particles, εJ = jz/jcirc, measured at t = 0, as a function of their formation time. The parameter εJ is defined as the z-component of the specific angular momentum of a star in units of that of a circular orbit of the same binding energy, and it therefore varies between ±1 for stars in the mid-plane. Some stars may have εJ slightly exceeding unity if they are outside the disc mid-plane. The z axis of the disc is defined at all times as the direction of the angular momentum vector of star particles younger than 3 Gyr old.
Star particles older than 10 Gyr formed before the early merging period of the galaxy was over: indeed, |$80\,\,\rm{per\,\,cent}$| of them are accreted and all together they have no net sense of rotation. Over the next ≈2 Gyr, however, a disc gradually forms and the average circularity climbs to unity. Stars formed during that epoch (i.e. ages between 8 and 10 Gyr) have a broad distribution of circularities, and the great majority (more than |$70\,\,\rm{per\,\,cent}$|) formed in situ. Stars younger than ≈7 Gyr, on the other hand, nearly all formed in situ and are found in approximately circular orbits in a thin coplanar disc (i.e. εJ ≈ 1).
The various panels of Fig. 4 show a few snapshots5 of the evolution of the galaxy. Here, from right- to left-hand panels, each column shows different orthogonal projections of star particles formed, within a narrow interval of time, 10, 8, 4, and 0 Gyr ago, respectively. The first two rows show each coeval population of stars at t = 0. The third and fourth rows, on the other hand, show them at the time of their formation. The gas component of the galaxy is shown in the bottom two rows, for each time.
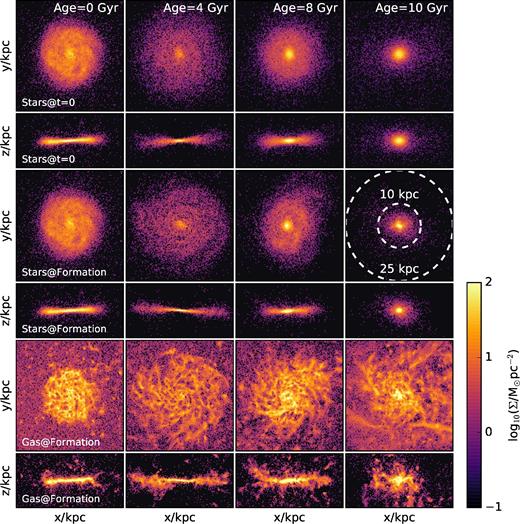
Face-on and edge-on projections of star and gas particles at selected times. Top two rows show, at t = 0, stars with ages (±0.5 Gyr) given in the legend of each box. Middle rows show the same star particles as in the top rows, but as they were at the time of formation. Bottom rows indicate the gas component at each of the selected times. Note how the gas slowly assembles into a gradually thinning disc largely broken up into star forming clumps.
Fig. 4 shows that, as expected, star particles trace, at the time of formation, the densest regions of the gaseous disc. Interestingly, however, the spatial configuration of stars evolves little after formation, and remains similar at t = 0. The stars of the simulated disc, therefore, seem to provide today a relatively faithful tracer of the properties of the gaseous disc at the time of their formation. This is the central result of our study, and will be a recurrent theme in the analysis that follows.
3.2 Age and metallicity gradients
The evolution of the gaseous disc discussed in the previous subsection leaves discernible gradients in the age and metallicity of its descendent stars at t = 0. We show this in Fig. 5, where the heat maps show, as a function of the cylindrical coordinates, R and z, the average age and metallicity of star particles. The gradients shown are characteristic of the ‘inside-out/upside-down’ disc formation scenario described in earlier work (see e.g. Bournaud, Elmegreen & Martig 2009; Brook et al. 2012; Bird et al. 2013; Stinson et al. 2013; Miranda et al. 2016; Ma et al. 2017).
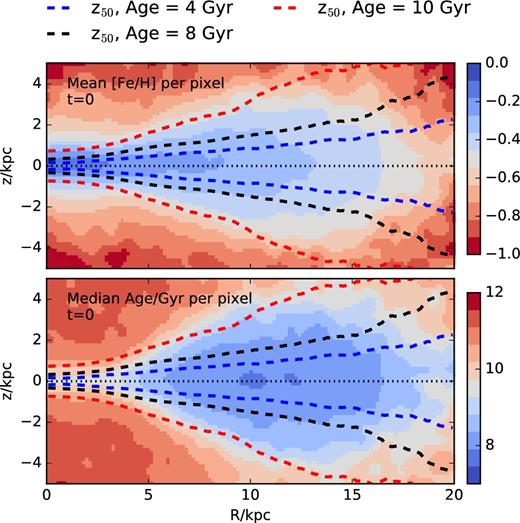
Average stellar metallicity (top panel) and age (bottom panel) of star particles at the present time, as a function of the cylindrical coordinates R and z (colour labels on right-hand side). Note that the disc is strongly flared, and that younger star particles delineate a thinner structure than their older counterparts. Dashed curves with different colours in both panels indicate the half-mass scale height of stars of ages 10, 8, and 4 Gyr. The origin of the strong radial and vertical gradients seen in this figure is the main focus of this paper.
In the disc mid-plane, the average age and metallicity decrease monotonically with increasing R. At fixed R, the ages of star particles increase and their metallicities decrease with increasing |z|. These gradients are steeper near the centre of the galaxy than in its outskirts, implying that the characteristic scale height of stars of fixed metallicity (or age) ‘flares’ outwards. This flare is the reason why the radial metallicity gradient at fixed |z| away from the plane ‘inverts’: for example, at fixed |z| ≈ 2 kpc, the metallicity increases with R, a trend opposite to that seen in the mid-plane.
3.3 The origin of radial and vertical gradients
The origin of the gradients highlighted in the previous subsection may be elucidated by contrasting the properties of stars at t = 0 with those of their parent gaseous disc at the time of their formation. We do this in Fig. 6, selecting for analysis star particles formed between 4 and 10 Gyr ago. This period is simpler to analyse because it is characterized by a single major accretion episode, which, as discussed in Section 3.1, delivered a relatively large amount of gas to the forming galaxy. The accreted gas quickly assembles into a thick disc structure that slowly thins down as it forms stars (see e.g. Fig. 4).
![Left-hand column: surface density (top panel), half-mass scale height (middle panel), and average metallicity (bottom panel) radial profiles of the gas component of the simulated galaxy, at various times, as indicated by the colour bar at the top. Note that the gas gradually enriches itself as it settles vertically and makes stars. The thick dashed line in the top panel indicates the surface density profile of all star particles at the present time, t = 0. Right-hand column: same as left-hand column, but for star particles at t = 0, grouped by age. Note the tight correspondance between stellar gradients as a function of age and those of the gas at the time of their formation. Open circles and squares highlight populations of fixed metallicity, [Fe/H] = −0.1 and +0.2, respectively. (See Fig. 7 for further discussion.)](https://oup.silverchair-cdn.com/oup/backfile/Content_public/Journal/mnras/476/3/10.1093_mnras_sty497/2/m_sty497fig6.jpeg?Expires=1750058922&Signature=TraqNwUey39xrgcQnGpYBS6zIg3aCrNuEj61q5WxfyouWZLK-pg5aje7SBwivShs~EjzL9WE9ZJKXLfiZjOar4BwDzGBGtKsiH85ajaj8D6h0oF6DeCg6LkZJLrbRQDsTSNm2zP2FVdMBWc4IUfZAFy8-WTMF6QpqC61TsD2yZySbsgQk4L0kGvTRAxDYUO12g2LDVm8EyAVHCWWUDLY2F-lBJofsL29uLCAHIpcxs7VZP5AyfB0zotj8iLYphHaoizaF73yCAPhcei1lHD-vv4FC8buTEE0P0~7zHW6bbuTFOSOaoGXJVWQWwkq~TJ8oK96ppo3SiqVOBhO2zmvCw__&Key-Pair-Id=APKAIE5G5CRDK6RD3PGA)
Left-hand column: surface density (top panel), half-mass scale height (middle panel), and average metallicity (bottom panel) radial profiles of the gas component of the simulated galaxy, at various times, as indicated by the colour bar at the top. Note that the gas gradually enriches itself as it settles vertically and makes stars. The thick dashed line in the top panel indicates the surface density profile of all star particles at the present time, t = 0. Right-hand column: same as left-hand column, but for star particles at t = 0, grouped by age. Note the tight correspondance between stellar gradients as a function of age and those of the gas at the time of their formation. Open circles and squares highlight populations of fixed metallicity, [Fe/H] = −0.1 and +0.2, respectively. (See Fig. 7 for further discussion.)
This evolution is depicted in the left-hand column of Fig. 6, where, from top to bottom, we show the gas surface density profile, Σ(R), its half-mass scale height profile, z50(R), and its average metallicity profile, [Fe/H](R), coloured as a function of time. These three panels show the evolution of a self-enriching, slowly thinning, flared gas disc that gradually transforms most of its gas into stars.
Interestingly, as shown in the right-hans column of Fig. 6, stars show, at t = 0, a very similar structure to the gas in the radial and vertical directions, when selecting their ages to correspond to the same times chosen for the gas in the left-hand panels. The clear correspondence between gas and stars as a function of time/age indicates that the origin of the stellar gradients lies in the evolving structure of the gaseous disc. Stars inherit the gas properties at birth and, to first order, preserve them until t = 0.
Note that because the gaseous disc is flared at all times, and thins down as it enriches, stars of fixed metallicity form at different times at different radii and with different scale heights. The flare of stars of fixed metallicity thus reflects the flaring of the gas disc, modulated by the gradual thinning that occurs at each radius.
The open circles and squares in Fig. 6 illustrate this. These symbols track two different metallicities, [Fe/H] = −0.1 and +0.2, respectively. In the bottom left-hand panel, the colour underneath each symbol indicates at what lookback time, as a function of radius, the average gas metallicity reached each of those values. In the bottom right-hand panel, on the other hand, the colours indicate, as a function of radius, the average age of star particles with each of those metallicities, at t = 0. The good agreement between gas and stars demonstrates that most stars have not migrated far from the radii where they were formed.
The lookback times (for the gas) and ages (for the stars) mentioned in the preceding paragraph are then used in the middle panels of Fig. 6 to indicate the half-mass scale height of the gas at each of those times (left-hand panel) or the half-mass scale height of the stars of each of those ages at t = 0. Again, the close resemblance between the flare of gas and stars selected in this way indicates that the stellar gradients originate in the properties of the gaseous disc at the time of the formation of each coeval stellar population.
One consequence of this resemblance is that, at t = 0, star particles of fixed metallicity are flared (see Fig. 7). The steepness of the flare depends on a combination of several factors: how strong the gas disc flare is, how quickly the gas self-enriches, and how fast the disc thins down at various radii.
![Red curves indicate the t = 0 half-mass scale height, z50, as a function of radius R, for stars within 0.05 dex of [Fe/H] = −0.1 (left-hand panel) and +0.2 (right-hand panel). These correspond to the open circles and squares highlighted in the bottom panels of Fig. 6. Shaded bands indicate the rms scatter about the mean. The z50 radial dependence of each of those populations is in close agreement with the scale height of the gas at the time when, at each radius R, the average metallicity matched the selected value (see blue curves). This indicates that the ‘flare’ in stars of fixed metallicity is inherited from the properties of the gaseous disc at the time of their birth and evolves little thereafter.](https://oup.silverchair-cdn.com/oup/backfile/Content_public/Journal/mnras/476/3/10.1093_mnras_sty497/2/m_sty497fig7.jpeg?Expires=1750058922&Signature=SMf0aeFIjWOUMUdXqC2N66vve~M7Cy4YEEycZnHKbmojSp9khGiauE7lc-sxfTSrNoWKjwkdWo1o7pm9WO5ylo3d7elbz3hBQon4WXhQcvxjagARKEJt-725suQnu~SrqSpW89u7jwtTVjG-zaRJieADzNKTF9S2qhNBumQHkPkZJA7Vw3-IjKzsE5ZGlyNO4Ehb4RvCXc7YbyJDLWIoZV0LfhZThebchLw8td1SZNWPkNv1SM9DjQy8HBoJUT2G~NmD2Fun1WFJWOWW65rNcU3mH-WqcLuESg15Esayp4MDqocLGLS7FUJ00ADF8iOQOvv2egzN0zmI87GKIC5BYg__&Key-Pair-Id=APKAIE5G5CRDK6RD3PGA)
Red curves indicate the t = 0 half-mass scale height, z50, as a function of radius R, for stars within 0.05 dex of [Fe/H] = −0.1 (left-hand panel) and +0.2 (right-hand panel). These correspond to the open circles and squares highlighted in the bottom panels of Fig. 6. Shaded bands indicate the rms scatter about the mean. The z50 radial dependence of each of those populations is in close agreement with the scale height of the gas at the time when, at each radius R, the average metallicity matched the selected value (see blue curves). This indicates that the ‘flare’ in stars of fixed metallicity is inherited from the properties of the gaseous disc at the time of their birth and evolves little thereafter.
Had the disc thinned down much more rapidly, for example, so that at late times the scale height in the outskirts was similar to that of the inner regions at early times, the flare in stars of fixed metallicity would be much weaker, or might even disappear altogether. This interplay between thinning, enrichment, and the flare of the original gaseous disc explains also why the flaring depends on metallicity. Taking stars of [Fe/H] = 0.2 and repeating the exercise, we find that the flare is less pronounced than that of [Fe/H] = −0.1 at t = 0 (see the right-hand panel of Fig. 7).
The same exercise also explains the origin of vertical metallicity gradients at fixed R. This is shown in Fig. 8, where the red curves indicate the half-mass scale height of stars as a function of metallicity, at the present time, and for two different radii, R = 4 kpc (left-hand panel) and R = 8 kpc (right-hand panel). The negative gradients (scale heights decrease with increasing [Fe/H]) result from the fact that the parent gaseous disc was gradually thinning down as it enriched.
![Half-mass scale height, z50, as a function of metallicity, for stars found at the present time at two selected radii; R = 4 (red curve in left-hand panel) and 8 kpc (red curve in right panel). As in Fig. 7, the blue curves in each panel indicate the evolution of the scale height of the gas, measured at the time when the average metallicity at each radius matched the value of [Fe/H] along the x-axis. The close agreement between gas and stars indicates that the vertical stellar gradient is due to the gradual enrichment of a slowly thinning gaseous disc. Stars inherit the properties of the gas at birth and largely preserve them to the present time.](https://oup.silverchair-cdn.com/oup/backfile/Content_public/Journal/mnras/476/3/10.1093_mnras_sty497/2/m_sty497fig8.jpeg?Expires=1750058922&Signature=2IrwyFy1k0~5qtNJ8IJoyl-CwyRIELlDKxuNJ4gcNmNoY5479P3uAEjAwTIDLKGE2qoOBOvxNFHr6UTZLDQOH4R8FfyUVVd3XOsboZeKIcTX7rXBTQ7wtNUm33-iJJsgNp~-J5cHC3HVbhfeXuIVJ8XrWFW65E-MI1D3WqZ8WvKGXIGbl8tW~TFzfgi~mxTZGbS7MrwE3G2BRdfMLfcsBX99HTF0vIRR-TDqjEL0LRD4cq12x8~~GkdN4LmLNw5rz42Xkc9wDbMboAWjmFD-EhtbhwkL1oxd49z4OHqIMBTineCVx3MZbB6iKfiSS40m0tA69Z0E0wBLrDxJx~oJ9Q__&Key-Pair-Id=APKAIE5G5CRDK6RD3PGA)
Half-mass scale height, z50, as a function of metallicity, for stars found at the present time at two selected radii; R = 4 (red curve in left-hand panel) and 8 kpc (red curve in right panel). As in Fig. 7, the blue curves in each panel indicate the evolution of the scale height of the gas, measured at the time when the average metallicity at each radius matched the value of [Fe/H] along the x-axis. The close agreement between gas and stars indicates that the vertical stellar gradient is due to the gradual enrichment of a slowly thinning gaseous disc. Stars inherit the properties of the gas at birth and largely preserve them to the present time.
This is confirmed by the blue curves in Fig. 8, which indicate the half-mass scale height of the gas disc at the time when its average metallicity at that radius reached the value listed in the abscissa of Fig. 8. In other words, [Fe/H] is a proxy of time for the gas, and, in the absence of substantial accretion, tracks the enrichment process of the gaseous disc. The excellent agreement between the vertical gas evolution and the stellar gradients at t = 0 indicate, again, that stars provide, to first order, a snapshot of the properties of the gas disc at the time of their formation.
3.4 Stellar migration after formation
The previous discussion suggests that the kinematics of star particles evolve little after their formation. We show this quantitatively in Fig. 9, where the top panel shows, as a function of initial cylindrical birth radius, Rbirth, and for different stellar age bins, the average net change in distance from the galaxy rotation axis. The net changes are rather small (|$<\!\!20\,\,\rm{per\,\,cent}$| over the whole radial extent of the disc), indicating that little net migration has happened since stars were born. More importantly, the rms radial change is also rather small (as seen in the bottom panel of Fig. 9), dropping from |${\sim } 50\,\,\rm{per\,\,cent}$| near the centre to |${\sim } 20\,\,\rm{per\,\,cent}$| in the outskirts of the disc, even for stars as old as 8 Gyr.
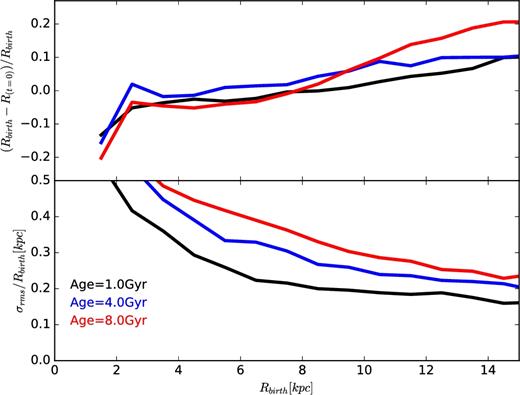
Radial migration of stars in the simulated disc. For particles within |z| < 1 kpc from the disc, grouped in 2 Gyr-wide age bins, we show, as a function of their cylindrical birth radii, Rbirth, their average radii at t = 0 (top panel) and the rms of their radial deviations (bottom panel).
The changes induced on radial gradients by migration are consequently rather small. We demonstrate this explicitly in Fig. 10, where we show the radial profiles of the vertical scale height (top panel) and of the metallicity (bottom panel) of stars formed at two different lookback times. Dashed lines indicate the properties of such stars at t = 0 and solid lines the same at the time of their formation. This figure shows explicitly that there is little radial mixing of stars after their formation: the radial metallicity gradients of stars of given age are essentially the same at t = 0 as at the time of formation (bottom panel). There is also little ‘heating’ in the vertical kinematics of stars after formation: the vertical gradients are again very similar at the time of formation as at t = 0 (top panel).
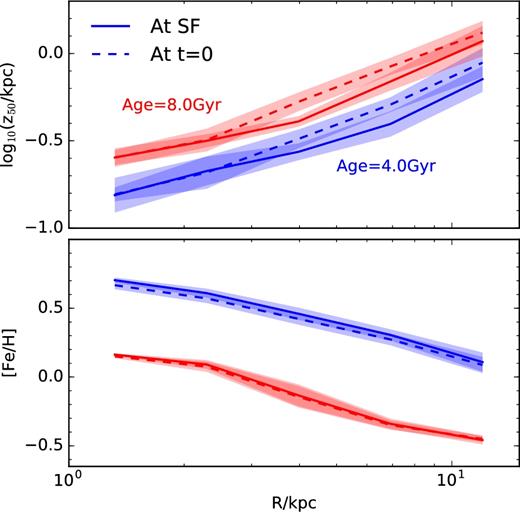
Radial profiles of the vertical half-mass scale height (z50; top panel) and metallicity (bottom panel) of stars shown at the time of their formation (solid line) and at the present (i.e. lookback time t = 0; dashed line). Red and blue correspond to stars with age (at t = 0) of 4 and 8 Gyr, respectively. The weak changes with time indicate that the present-day properties of stars were imprinted largely at birth, and evolved little since their formation.
Since the simulated disc lacks a prominent bar, massive spiral arms, or dynamical analogues of giant molecular clouds, it is perhaps not unexpected that secular evolutionary processes such as radial migration play a minor role in the disc's dynamical evolution. Migration in galaxies with stronger spiral patterns (and, in particular those where the pattern recurs periodically; see e.g. Vera-Ciro et al. 2014) is expected to be more important, and our results thus do not exclude that migration may have played an important role in the Milky Way. This, however, does not affect our main result: the radial and vertical trends in the simulated disc reflect the conditions of the gaseous disc at birth, with secular evolutionary processes playing a minor role.
3.5 Vertical thinning of the gas disc
The results presented above indicate that star particles of fixed age faithfully trace the properties of the gaseous disc at the time of their formation: their vertical and radial gradients are set at birth, and evolve little thereafter. This elicits two important questions: (i) what determines the vertical scale height of the gas, its outward flare, and the time-scale of its thinning?; and (ii) since, unlike the gas, stars are not subject to hydrodynamical forces, why do stars trace the properties of the gas so closely?
Note that, in general, we expect isothermal exponential gas discs with flat circular velocity curves to ‘flare’ outwards, since, in that case, the thickness would be ∝ R if non-self-gravitating, and ∝ Σ−1 if self-gravitating.
We compare in Fig. 11, the above expectation with the gas disc half-mass scale heights measured at two different lookback times, ≈10 and ≈4 Gyr ago. The thick grey curve shows the result of the simulation, whereas the SG and NSG scale heights are shown with dotted and dashed red curves, respectively. We use the mid-plane sound speed to account for the density-dependent EAGLE equation of state; as a result, the effective sound speed in equa-tion (2) depends (weakly) on R. The solid red line is the actual expected value when considering the disc and halo combined vertical forces. Clearly the simulated disc is much thicker than expected given these considerations, at essentially all radii.
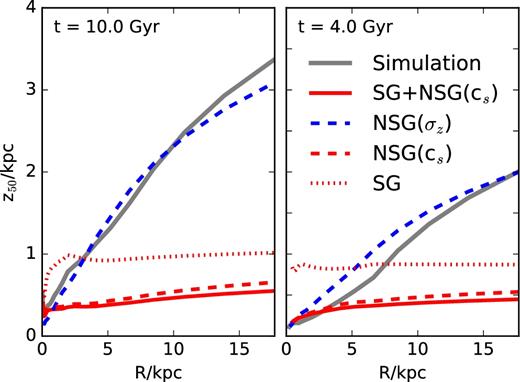
The (strongly flared) vertical half-mass scale height profile of the gas at t = 10 Gyr and t = 4 Gyr (thick grey solid line). Expected scale heights assuming vertical hydrostatic equilibrium with thermal pressure are indicated for the case of a self-gravitating disc (SG, red dotted) and non-self-gravitating disc (NSG, red dashed). These are generally much smaller than the actual thickness of the simulated disc, which is well matched by the NSG solution but where the ‘pressure’ support is given by the vertical velocity dispersion of the gas particles (σz) rather than by the mid-plane thermal sound speed (cs). The disc is largely kept thick by the feedback-induced bulk motions of the gas. (See the text for a full discussion.)
Indeed, what sets the thickness of the disc is actually the balance between the vertical forces and the ‘pressure’ provided by random bulk motions in the gas. The blue dashed curves in Fig. 11 show again the NSG solution, but replacing the sound speed, cs, with the vertical velocity dispersion of the gas particles, σz, in equa-tion (2). The agreement between this curve and the simulation results indicates that the gas disc is kept thick by the vertical random motions of the gas, and, in particular, of the star-forming gas clouds that may be clearly seen in the bottom panels of Fig. 4, especially at early times.
These random motions should be quelled in a couple of dynamical time-scales, but, as seen in the right-hand panel of Fig. 11, they still dominate in the outskirts of the disc after 6 Gyr of evolution, or more than ≈20 circular orbit periods at R = 10 kpc. (Orbital times as a function of radius, as well as circular velocity profiles of the simulated galaxy are provided in the Appendix.) The gas disc is actually kept thick by the feedback energy provided by evolving stars – this is deposited as thermal energy in the disc, where it is able to blow bubbles and to push gas outside the disc quite efficiently, especially when star formation rates are high.
We show this in Fig. 12, where we plot the half-mass scale height evolution of a gas disc formed in an idealized simulation which evolved a system tailored to match approximately the mass, size, and angular momentum of the gaseous disc at t = 10 Gyr (see Fig. 6). In this simulation, gas is allowed to cool and collapse from a ≈2 kpc-thick rotating ‘slab’ embedded in a spherical Navarro–Frenk–White (NFW, Navarro, Frenk & White 1996, 1997) dark matter halo potential with parameters chosen to match the circular velocity profile of the galaxy at that time (Fig. A1).

Scale height evolution, at two different radii, of an idealized gas disc simulation with (dashed lines) and without (solid lines) the effects of star formation and feedback. Note that the disc is much thicker when including star formation, demonstrating the key role of feedback in stirring up the vertical motions that keep the gas disc thick. See the text for details on the idealized simulation.
The solid lines in Fig. 12 indicate the evolution of the half-mass scale height at two different radii (R = 4 and 8 kpc), when the system is evolved in the absence of star formation or feedback. As expected, the disc quickly collapses vertically to a pressure-supported disc roughly ≈200 pc thick. The simulation is ended after just ≈700 Myr because the disc breaks into massive self-bound clumps, making estimates of its thickness unreliable. When star formation is included, however, the gaseous disc settles into a much thicker structure which is supported by the gas bulk motions induced by the feedback energy released by evolving stars. (See dashed lines in Fig. 12.)
Interestingly, the idealized disc with feedback is still thinner than the APOSTLE galaxy (compare with the left-hand panel of Fig. 11), suggesting that there may be an additional source of vertical support in the APOSTLE simulation, possibly related to bulk motions induced by the continuous gas accretion, which is not included in the idealized runs. In any case, Fig. 12 shows clearly that the thickness of our simulated disc is largely set and controlled by feedback-induced vertical motions in the gas, whose effective pressure far exceeds the thermal support.
Feedback is thus a critical ingredient for understanding the origin of vertical gradients in our simulations, connecting the star formation history at each radius and its consequent enrichment with the evolving thickness of the star-forming disc. In this scenario, the disc thins down as the gaseous disc is depleted, star formation abates, and feedback (and, possibly, accretion) heating becomes less effective. A strong prediction is then that the star formation, enrichment, and thinning time-scales should all be linked at all radii, as it may have already been observed in the inner Galaxy (see e.g. Freudenburg et al. 2016).
The same scenario explains why the vertical structure of stars tracks so closely that of the gas at the time of their formation. This is because the star-forming gas is best described as a collection of dense clouds with appreciable bulk velocities, rather than as a fluid in vertical hydrostatic equilibrium supported by thermal pressure. Indeed, had star particles been born of gas in thermal hydrostatic equilibrium the stellar disc would be much thinner than its parent gas disc due to the loss of vertical pressure (see Benitez-Llambay et al. 2017). In our simulations, however, star particles inherit the bulk motions of the gas clouds from which they are born. Since these motions are dominant over thermal pressure forces there is little difference between gas clouds and newly formed stars, explaining why stars trace faithfully the properties of the gas at the time of their formation.
We end this discussion with a caveat by noting that, when feedback is included, the gaseous disc thickness exceeds that of the thin disc of the Milky Way (see Fig. 12). This elicits questions as to whether a more realistic star formation/feedback model would yield radial and, in particular, vertical trends similar to those we report here. A definitive answer to this question will need to wait until our modelling improves to match the observed disc thickness of Miky Way-like spirals. However, supporting evidence for our conclusions may be gleaned from simulations that yield much thinner discs than ours but, qualitatively, the same trends we report here (see e.g. Ma et al. 2017, and references therein). We are planning to revisit this issue in future work.
4 A MODEL FOR THE ORIGIN OF METALLICITY GRADIENTS
The scenario discussed above, where gradients result from the intertwined evolution of the gaseous disc's star formation, enrichment, and vertical structure, may be encapsulated in a simple model that can be used to interpret the origin of various chemical and kinematical trends in the Galaxy. The model assumes that stars inherit the properties of the gas at the time of formation and preserve them to the present. It also requires, at a minimum, a characterization of the disc surface density profile, Σ(R), its thickness profile, z50(R), and its average metallicity profile, 〈[Fe/H]〉(R), as a function of time.
4.1 Gas disc evolution parametrization
We compare these parametrizations with the evolution of the simulated disc in Fig. 13, for three different radii. The thinning and enrichment time-scales that best approximate the simulated disc are τz = 14 Gyr and τZ = 9 Gyr, respectively. This figure shows that the functional forms adopted above are adequate, at least for t > 4 Gyr. At more recent lookback times the disc accretes a substantial amount of metal-poor gas (see middle panel of Fig. 2), lowering the average metallicities at all radii. This non-monotonic behaviour cannot be reproduced by our simple formulation.
Evolution with lookback time of the gas scale height (left-hand panel) and average metallicity (right-hand panel) at three different radii: R = 10, 7, and 4 kpc. The solid circles indicate the result of the simulation, the thick lines are fits using the parametrization given in equations (4) and (5).
4.2 Application to the milky way
Given the assumptions of the parametrization adopted above, the radial and vertical gradients that result will be largely set by the flaring profile and metallicity gradient adopted for the gaseous disc at t = 0, as well as by the ratio between the thinning time-scale, τz, and the enrichment time-scale, τZ. Some intuition may be gained from considering hypothetical cases when one time-scale is much longer than the other.
For example, if enrichment proceeded much faster than thinning, then all populations, regardless of metallicity, would have the same flaring profile (that of the gaseous disc), and there would be no vertical metallicity gradient at fixed R. If, on the other hand, thinning proceeded much faster than enrichment, then we would expect strong vertical gradients to develop at fixed R. In this case, the flaring profile of stars of fixed metallicity would depend in detail on the gas disc flare, as well as on the ratio of thinning and enrichment time-scales. Depending on these parameters, stars of given Z might show no flare even though the gaseous disc is always flared.
We illustrate this next with a simple application to the Milky Way. We emphasize that this is not meant to be quantitative model of the chemical evolution of the Milky Way disc(s) but rather an illustration of how the results discussed in the previous subsections may be used to interpret the data.
The model requires the present-day gas MW density/metallicity profiles. We show these in the left-hand panels of Fig. 14: the top two show the vertical gas scale height profile taken from the fits to 21-cm data presented by Kalberla & Dedes (2008). The gas disc is clearly flared, and can be well approximated, at t = 0, by equation (4) (z50, 0 = 0.06 kpc and Rz = 9.8 kpc), as shown by the bue lines. The bottom left-hand panel shows the Cepheid metallicity profile from Genovali et al. (2014), which we shall take to represent the present-day radial metallicity profile of the Galaxy midplane, and which we approximate with Z0 = 0.5 and α0 = −0.06 dex kpc−1. This gradient can also be approximated by the parametrization adopted in equation (5), as shown by the blue lines in that panel.
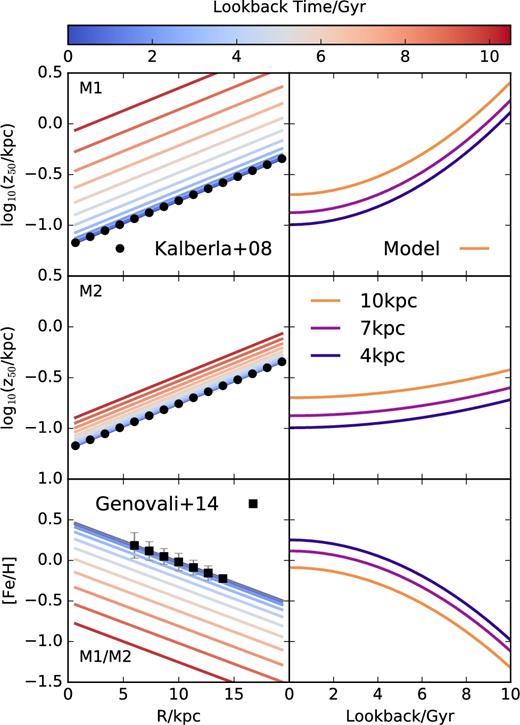
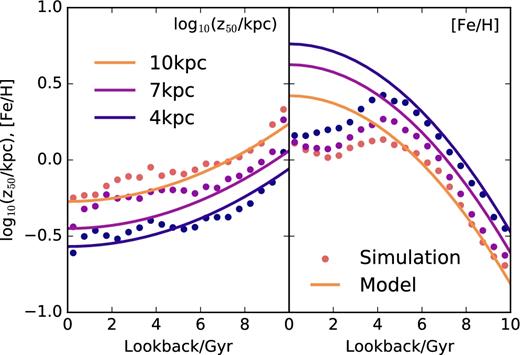
Left-hand column: top and middle panels illustrate the evolution of the gas half-mass scale height profile, z50(R), assumed in model 1 (M1) and model 2 (M2), respectively. Bottom panel is analogous, but for the average metallicity profile. The shapes of the final profiles have been chosen to match the exponential fit of Kalberla & Dedes (2008) (top left-hand panel) and the Cepheid metallicity gradient of Genovali et al. (2014). Right-hand column: scale height evolution at three different radii; R = 10, 7, and 4 kpc, for M1 (top panel) and M2 (middle panel). Bottom panel shows the evolution of the average metallicity at the same radii, which is the same for both models.
The only remaining parameters are τz and τZ. We choose two cases, again mainly for illustration. Model 1 (M1) assumes τz ≈ τZ; i.e. τz = 9.5 Gyr, and τZ = 9.0 Gyr. Model 2 (M2), on the other hand, assumes that thinning proceeds on a much longer time-scale than enrichment; i.e. τz = 19 Gyr, and τZ = 9.0 Gyr. Note that the two models differ only in the thinning time-scale.
The evolution of both thickness and average metallicity is shown for three different radii; R = 10, 7, and 4 kpc, in the right panels of Fig. 14. In M1, the disc thins down quickly from a much thicker earlier configuration to its final state, whereas it evolves much more gradually in M2. The metallicity evolution is identical in both models, which assume that the disc has enriched at all radii by more than one dex6 in the past ≈10 Gyr.
The effect of these two different evolutionary patterns on the flaring profile of stars of fixed metallicity is shown in the left-hand panels of Fig. 15. In the case of Model 1, the enrichment and thinning time-scales are comparable and, for the flaring profile of Kalberla & Dedes (2008), leads to populations of stars that show no flare at fixed metallicity.
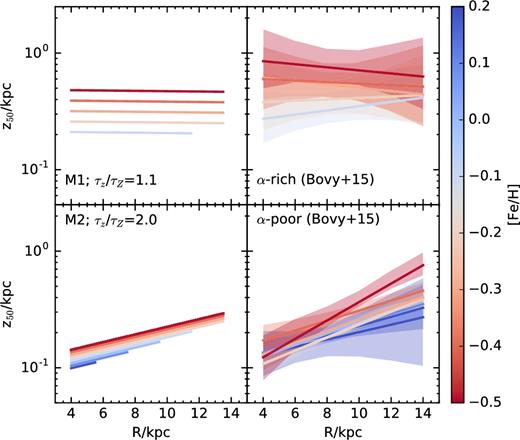
Left-hand column: scale height profiles of stars of fixed-metallicity formed out of gas discs evolving as in model 1(top) or model 2 (bottom). Stars are assumed to inherit and preserve the properties of the gaseous disc at birth. Right-hand column: a summary of the scale height profiles for stars of fixed metallicity, taken from Bovy et al. (2016). Top panel shows that fixed-metallicity stars in the α-rich (‘thick’) disc show no obvious flares. Stars of the α-poor (‘thin’) component, on the other hand, flare outward. Either of these trends can be reproduced by models M1 and M2, by adjusting a single parameter, the ratio of enrichment-to-thinning time-scale, τZ/τz. See the text for a detailed discussion.
Model 2, on the other hand, leads to well-defined flares in populations of fixed metallicity, as shown in the bottom left-hand panel of Fig. 15. Interestingly, both trends are seen in the Milky Way disc, where there is compelling evidence for the presence of two chemically-distinct populations (Bovy et al. 2016): an α-rich disc (the traditional ‘thick disc’) with no flares (like M1), and an α-poor (‘thin’) disc whose subpopulations clearly flare outwards (like M2). (See right-hand panels of Fig. 15.)
Although the presence of these flares has been taken as evidence for the effects of radial migration, our results argue that such flares might also result from the gradual thinning of the gaseous disc. This should not be viewed as implying that radial migration does not occur in the Milky Way; only that the mere presence of a flare does not guarantee that it has been caused by radial migration, and that other explanations should also be considered (see e.g. Schönrich & Binney 2009; Loebman et al. 2011; Minchev et al. 2012; Kubryk, Prantzos & Athanassoula 2013; Roškar, Debattista & Loebman 2013; Vera-Ciro et al. 2014; Grand, Kawata & Cropper 2015; Vera-Ciro, D'Onghia & Navarro 2016; Kawata et al. 2017, for a more comprehensive discussion of the role of radial migration on disc flaring).
5 SUMMARY AND DISCUSSION
We use a cosmological simulation from the APOSTLE project to study the origin of radial and vertical gradients in the age and metallicity of disc stars. We focus our analysis on one particular galaxy selected because of its overall resemblance to the Milky Way: most stars at lookback time t = 0 are in a well defined, coplanar, centrifugally supported disc component; it has formed stars throughout its history; it has had no recent major mergers; has no major morphological peculiarities; has had a quiet recent merger history; and has formed most of its stars in situ.
Some radial and vertical trends in the simulated galaxy resemble those of the Milky Way. In particular, average stellar ages and metallicities decrease with increasing radius in the disc mid-plane; at fixed R, metallicity decreases and age increases with increasing |z|; and the disc exhibits a pronounced ‘flare’ (i.e. the scale height of stars of fixed age or metallicity increases monotonically outwards).
We trace the origin of these gradients to the properties of the parent gaseous disc, which first assembles into a thick, slowly rotating, flared structure and then gradually thins down, settles, and cools kinematically as gas turns into stars and enriches itself in the process. The disc is denser near the centre, and therefore enrichment and thinning proceed more rapidly there than in the outskirts.
Stars inherit the properties of the gas disc at the time of their formation, and evolve little thereafter. In other words, the resulting gradients are predominantly imprinted at birth, and are not the result of secular evolutionary processes such as radial migration or disc instabilities.
The similarity in the vertical structure of stars at late times and that of the gas at the time of their formation results because the gaseous disc is not in thermal hydrostatic equilibrium. Rather, its vertical structure is largely set by the bulk motions of star-forming gas clouds, which are, in turn, induced and sustained by the feedback energy of evolving stars and, possibly, energy injected by continuous gas accretion. As a result, the time-scales of star formation, enrichment, and equilibration are all intertwined, and leave behind clear radial and vertical gradients in the gaseous disc and its descendent stars.
Our results suggest that some trends that are often ascribed to secular evolutionary processes may actually be the result of the gradual equilibration process of a star-forming, self-enriching disc. This should not be taken to imply that secular evolution plays no role in the establishment of such gradients in the case of the Milky Way, where the bar and spiral patterns, which are lacking in our simulated disc, are expected to lead to some radial and vertical redistribution of stars after formation. Rather, our results simply demonstrate that such gradients, per se, should not be regarded as necessarily due to secular evolution.
Our simulation is the latest of a number of cosmological simulations of disc galaxy formation that argue that the conditions ‘at birth’ play a critical role in our understanding of the origin of Galactic gradients (see e.g. Brook et al. 2012; Bird et al. 2013; Stinson et al. 2013; Grand et al. 2015; Miranda et al. 2016; Ma et al. 2017; Grand et al. 2017, and references therein). Although the simulations differ in their details, the qualitative scenario they recount is common to all: a feedback-thickened, star-forming, flared gaseous disc that gradually turns itself into stars as it equilibrates and settles down, results in a disc galaxy that resembles the Milky Way in a surprising number of ways. These simulations also show that internal evolutionary processes (such as migration and vertical thickening) do matter, but are neither responsible for the main structural properties of the galaxies, nor for the origin of their gradients.
This scenario offers a theoretical template that may be used to interpret observations, such as those that will result from ongoing and upcoming surveys of the Milky Way. Its crucial prediction is that locally the time-scales of star formation, enrichment, equilibration, and thinning should all be connected through a simple physical model of feedback and accretion. The relations between these time-scales and their observational consequences need to be spelled out in more detail by future work to yield falsifiable predictions that may be used to assess the validity and general applicability of this scenario.
6 ACKNOWLEDGEMENTS
The research was supported in part by the Science and Technology Facilities Council Consolidated Grant (ST/F001166/1), and the European Research Council under the European Union's Seventh Framework Programme (FP7/2007-2013)/ERC Grant agreement 278594-GasAroundGalaxies. CSF acknowledges ERC Advanced Grant 267291 COSMIWAY. This work used the DiRAC Data Centric system at Durham University, operated by the Institute for Computational Cosmology on behalf of the STFC DiRAC HPC Facility (www.dirac.ac.uk). The DiRAC system was funded by BIS National E-infrastructure capital grant ST/K00042X/1, STFC capital grants ST/H008519/1 and ST/K00087X/1, STFC DiRAC Operations grant ST/K003267/1, and Durham University. DiRAC is part of the National E-Infrastructure. This research has made use of NASA's Astrophysics Data System.
Footnotes
A Project Of Simulating The Local Environment.
The virial properties of a dark matter halo are computed within spheres of mean density 200 × the critical density for closure, |$\rho _{\rm crit}=3H_0^2/8\pi G$|. Virial quantities will be indicated with a ‘200’ subscript.
We shall hereafter use lookback time, t, to quote simulation results, in order to prevent confusion between ‘redshift’ and the vertical coordinate, z.
At very early times, when only a small fraction of the final galaxy has been assembled, the main progenitor is not well defined. This leads to temporary uncertainties in the assignment of in situ versus accreted stars. These uncertainties have no discernible consequences on our main conclusions.
This figure was inspired by fig. 1 of Ma et al. (2017).
We note that the latter result differs from the solar neighbourhood, where the age–metallicity relation has large scatter and is relatively flat in the age range 0–8 Gyr (Nordström et al. 2004; Haywood et al. 2013). We emphasize again that our simulated galaxy is not meant to be a model for the Milky Way, but rather a basic illustration of how our results may be applied to gain insight into the Milky Way evolution.
REFERENCES
APPENDIX
We present in this brief appendix, for the sake of completeness and reference, the circular velocity profile of the galaxy at various times (Fig. A1), as well as the vertical density profile of star particles at a cylindrical radius R = 4 kpc (Fig. A2). The former shows that our galaxy has a reasonably flat circular velocity profile, as commonly observed for spiral galaxies. The latter shows that, as for the Milky Way (Gilmore & Reid 1983), the vertical density profile of stars is not well approximated by a simple exponential law, but can be described by the superposition of a ‘thick’ and a ‘thin’ disc.
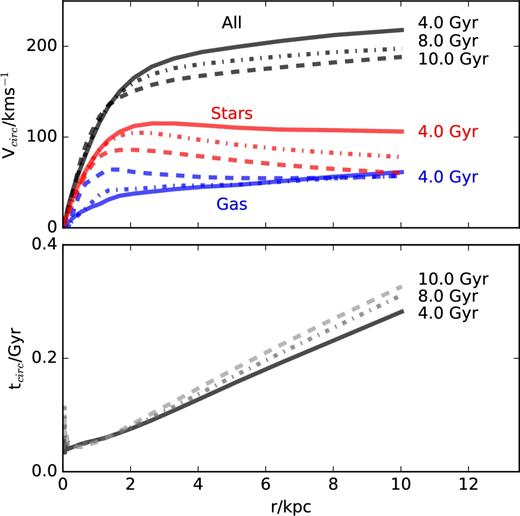
Top panel shows circular velocity profiles (assuming spherical symmetry), Vcirc(R) = (GM(R)/R)1/2, at t = 0 and selected lookback times (7.5 and 9.5 Gyr ago). Bottom panel shows the circular orbital time as a function of spherical radius, assuming |$t_{\rm circ}=2\pi r/V_{\rm circ}$|, at the same lookback times.
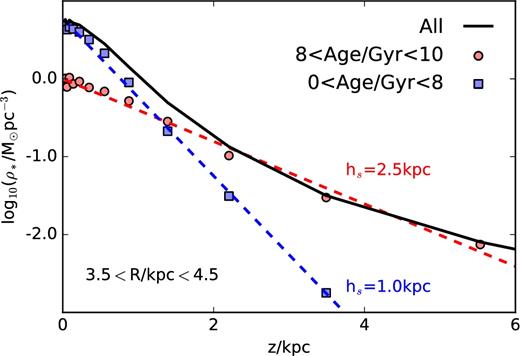
Vertical density distribution, ρ(z), for all disc stars with radii 3.5 < R/kpc < 4.5 (black line). Old stars contribute mostly to a ‘thick’ disc; young stars to a ‘thin’ disc, each well approximated by a simple exponential law.
