


Abstract
We present a multiwavelength analysis of galaxies selected at 450 and 850 μm from the deepest SCUBA-2 observations in the Extended Groth Strip (EGS) field, which have an average depth of σ450 = 1.9 and σ850 = 0.46 mJy beam− 1 over ∼70 arcmin2. The final sample comprises 95 sources: 56 (59 per cent) are detected at both wavelengths, 31 (33 per cent) are detected only at 850 μm, and 8 (8 per cent) are detected only at 450 μm. We identify counterparts for 75 per cent of the whole sample. The redshift distributions of the 450 and 850 μm samples peak at different redshifts with median values of |$\bar{z}=1.66\pm 0.18$| and |$\bar{z}=2.30\pm 0.20$|, respectively. However, the two populations have similar IR luminosities, SFRs, and stellar masses, with mean values of 1.5 ± 0.2 × 10¹² L⊙, 150 ± 20 M⊙ yr−1, and 9.0 ± 0.6 × 10¹⁰ M⊙, respectively. This places most of our sources (≳85 per cent) on the high-mass end of the main sequence of star-forming galaxies. Exploring the IR excess versus UV-slope (IRX-β) relation we find that the most luminous galaxies are consistent with the Meurer law, while the less luminous galaxies lie below this relation. Using the results of a two-dimensional modelling of the HSTH160-band imaging, we derive a median Sérsic index of |$n=1.4^{+0.3}_{-0.1}$| and a median half-light radius of r1/2 = 4.8 ± 0.4 kpc. Based on a visual-like classification in the same band, we find that the dominant component for most of the galaxies at all redshifts is a disc-like structure, although there is a transition from irregular discs to discs with a spheroidal component at z ∼ 1.4, which morphologically supports the scenario of SMGs as progenitors of massive elliptical galaxies.
1 INTRODUCTION
Since their discovery, submillimeter-selected galaxies (hereafter SMGs) have revolutionized the field of galaxy formation and evolution. These sources were detected, for the first time, by the first submillimeter (850 μm) surveys taken with the James Clerk Maxwell Telescope (JCMT, Smail, Ivison & Blain 1997; Barger et al. 1998; Hughes et al. 1998), revealing that at least a fraction of the previously detected cosmic infrared background (CIB) by the space-based Cosmic Background Explorer (COBE; Puget et al. 1996; Fixsen et al. 1998) came from dust-enshrouded galaxies. These results changed immediately our understanding of the cosmic star formation history, and implied that surveys at both ultraviolet (UV)/optical and infrared (IR)/millimetre are necessary to completely understand it.
Thanks to the extensive follow-up studies carried out during the last two decades, we know that these are typically high-redshift galaxies (〈z〉 ∼ 2–3, e.g. Aretxaga et al. 2003, 2007; Chapman et al. 2005; Michałowski et al. 2012a; Yun et al. 2012), with high star formation rates (SFRs, ≳ 300 M⊙ yr− 1), large far-infrared (FIR) luminosities ( ≳ 1012 L⊙), large gas reservoirs ( ≳ 1010 M⊙), and orders of magnitude higher number density than local ultra-luminous infrared galaxies (see reviews by Blain et al. 2002; Casey, Narayanan & Cooray 2014a). Furthermore, these galaxies are considered to be the progenitors of massive elliptical galaxies (e.g. Lilly et al. 1999; Smail et al. 2002; Simpson et al. 2014; Toft et al. 2014). For these reasons, this population is very important in our general comprehension of the stellar mass assembly, and therefore, in our understanding of the formation and evolution of galaxies over cosmic time. However, despite these significant efforts, our knowledge of this population of galaxies is still not complete, since most of the samples come from single-dish telescope observations with large beam-sizes ( ≳ 15 arcsec) at just one wavelength. This introduces several biases: (1) due to selection effects, observations at a single wavelength are not representative of the whole population of galaxies (Casey et al. 2013; Zavala, Aretxaga & Hughes 2014); (2) the poor angular resolution results in large position uncertainties leading to some misidentifications, as revealed by interferometric observations (Hodge et al. 2013); (3) the high confusion noise caused by the large beam-sizes prevents from detecting galaxies with LFIR ≲ 1012 L⊙ at high redshifts.
Follow-up interferometric observations at submillimetre bands exist now for more than a hundred SMGs (e.g. Iono et al. 2006; Younger et al. 2007, 2009; Wang et al. 2011; Smolčić et al. 2012a; Hodge et al. 2013; Ikarashi et al. 2015; Miettinen et al. 2015; Simpson et al. 2015; Brisbin et al. 2017), which alleviate the problem of positional uncertainty and source blending. Recent deep blank-field observations taken with the Atacama Large Millimeter/submillimeter Array (ALMA) have allowed the detection of galaxies with SFRs <100 M⊙ yr−1 (e.g. Hatsukade et al. 2016; Dunlop et al. 2017; Umehata et al. 2017). These sources are also detected in small amplified samples towards clusters of galaxies thanks to gravitational amplification (e.g. Pope et al. 2017). However, due to the small surveyed areas only a handful of galaxies are typically detected. Additionally, these observations are taken at just one wavelength and may be not representative of the whole population. The achievement of wide-area surveys at different wavelengths which are necessary to solve these problems, as those planned with TolTEC1 on the LMT or in a small scale with ALMA, will take several years. In the meanwhile, new deep single-dish telescope observations are coming along to minimize the biases in order to increase our knowledge of SMGs.
The SCUBA-2 Cosmology Legacy Survey (S2CLS; Geach et al. 2017) exploits the capabilities of the SCUBA-2 camera (Holland et al. 2013) on the JCMT, efficiently achieving large and deep (confusion limited) maps at both 450 and 850 μm simultaneously, allowing us the detection of galaxies with LFIR ≲ 1012 L⊙ up to z ∼ 3 (see Section 4.2.1). The higher angular resolution at 450 μm results in a positional uncertainty of ∼1–2 arcsec, and therefore, in high accuracy associations than previous studies based on sample of galaxies selected from single-dish telescope observations. Previous SCUBA-2 studies (including those from the S2CLS) have taken these advantages to characterize the physical properties of faint SMGs (Chen et al. 2013; Geach et al. 2013; Roseboom et al. 2013; Hsu et al. 2016; Koprowski et al. 2016; Cowie et al. 2017; Michałowski et al. 2017), although some of these studies have been focused on samples of either 450- or 850-μm selected galaxies. Here, we present a multiwavelength counterpart analysis of a sample built from both 450- and 850-μm selected galaxies, in order to minimize selection effects and to investigate any differences in the physical properties of these galaxies.
This paper is organized as follows: sample selection and multiwavelength data are described in Section 2. The counterpart matching and identification process are reported in Section 3. In Section 4, we derive the physical properties, such as redshifts, luminosities, SFRs, stellar masses, dust properties, and discuss the location of our galaxies in the star-forming main sequence. The morphology classification as well as a possible morphological evolution is also discussed in Section 4. Finally, our results are summarized in Section 5.
All calculations assume a standard Λ cold dark matter cosmology with |$\Omega _\Lambda =0.68$|, Ωm = 0.32, and H0 = 67 km s−1 Mpc−1 (Planck Collaboration et al. 2014).
2 MULTIWAVELENGTH DATA
2.1 S2CLS
The main data for this study comes from the deep 450 and 850 μm observations taken with the SCUBA-2 camera in the EGS field as part of the S2CLS. The characteristics of observations and the data reduction process are described in the first paper of this series (Zavala et al. 2017), where the source catalogues and number counts are also reported. These observations have a mean depth of σ450 = 1.9 and σ850 = 0.46 mJy beam− 1 (including instrumental and confusion noise) at 450 and 850 μm, respectively, within an area of ∼70 arcmin2. Along with other SCUBA-2 surveys (see Section 1), these are some of the deepest observations taken at these wavelengths with a single-dish telescope, enabling the detection of relatively faint galaxies (i.e. 0.6 ≲ S850 μm ≲ 6 mJy) that were unreachable by previous blank-field surveys. For comparison, the sources detected in the LABOCA ECDFS submillimetre Survey (LESS; Weiß et al. 2009), one of the largest and deepest contiguous map at submillimetre wavelengths before the achievement of the S2CLS, were limited to S870 μm ≳ 4 mJy. Finally, the angular resolution at 450 μm is θFWHM ≈ 8 arcsec and ≈14.5 arcsec at 850 μm.
2.2 Ancillary data
Thanks to the All-wavelength Extended Groth Strip International Survey (Davis et al. 2007, AEGIS2), this field has a panchromatic data set from X-rays to radio wavelengths. We use these observations, among other catalogues described below, to identify the counterpart galaxies and to study their multiwavelength properties.
The radio and IR images are used as an intermediate step to associate each galaxy in our catalogue with an optical counterpart (see Section 3.1) For this purpose we use the VLA/EGS 20 cm (1.4 GHz) survey described by Ivison et al. (2007b). These observations have an angular resolution of FWHM ≈3.8 arcsec with a 5σ detection limit of 50 μJy in the deepest region. As IR constraints, we use the catalogue derived from Spitzer/MIPS observations at 24 μm which are part of the Far-Infrared Deep Extragalactic Legacy Survey (FIDEL3). The 3σ detection limit is 30 μJy and it has an angular resolution of 5.9 arcsec. In addition, the 8 μm catalogue derived using Spitzer/IRAC observations (Barro et al. 2011a) is also exploited for this purpose, with a 5σ limit of 22.3 mag and an angular resolution of 2.2 arcsec.
We use the multiwavelength catalogues compiled by the 3D-HST team (Brammer et al. 2012; Skelton et al. 2014; Momcheva et al. 2016) to finally associate our radio or IR counterpart with an optical galaxy. These catalogues are built mainly using H-band selected galaxies from HST(F160W) imaging with a median 5σ depth of 26.4 mag (AB) and include photometry from the u band to 8 μm. We also use an Spitzer/IRAC 3.6+4.5 μm selected catalogue (Barro et al. 2011a; Barro et al. 2011b) which contains photometry from the ultraviolet to 70 μm. The catalogue includes sources up to 5σ of 23.9 mag at 3.6 μm. As discussed in Sections 4.1 and 4.3 these catalogues include redshift information and stellar-population parameters, which are used to understand the physical properties of our sample.
To investigate the AGN contamination in our sample, the catalogue of the AEGIS-X Deep (AEGIS-XD) survey4 (Nandra et al. 2015) is used. This program combines deep Chandra observations in the central region of EGS with previous Chandra observations of a wider area (AEGIS-X Wide; Laird et al. 2009), achieving a total nominal exposure depth of 800ks in the central region. This makes this program one of the deepest X-ray survey in existence.
To extract far-infrared photometry, we use Herschel observations obtained with the Photodetector Array Camera and Spectrometer (PACS; Poglitsch et al. 2010) and the Spectral and Photometric Imaging Receiver (SPIRE; Griffin et al. 2010) instruments, which are part of the PACS Evolutionary Probe (PEP; Lutz et al. 2011) and the Herschel Multi-tiered Extragalactic Survey (HerMES; Oliver et al. 2012) programs. We obtained the Herschel fluxes of each SCUBA-2 source as in Michałowski et al. (2017) in the following way. We extracted 120 arcsec wide stamps from all five Herschel maps around the position of each SCUBA-2 source. Then we processed the PACS (100 and 160 μm) maps by simultaneously fitting Gaussian functions with the FWHM of the respective resolution of the maps, centred at the positions of all 24 μm sources located within these cut-outs, and at the positions of the SCUBA-2 IDs. Then, to deconvolve the SPIRE (250, 350, and 500 μm) maps in a similar way, we used the positions of the 24 μm sources detected with PACS (≥3σ), the positions of all SCUBA-2 ID positions (or the submillimetre positions if no radio or mid-IR ID had been secured). The errors were computed from the covariance matrix of the fit, in which the free parameters are simply the heights of the Gaussian beams fitted at each input position. Then the confusion noise of 5.8, 6.3, and 6.8 mJy beam−1 at 250, 350, and 500 μm, respectively (Nguyen et al. 2010) was added in quadrature. The fitting was performed using the IDL Mpfit5 package (Markwardt 2009).
3 SOURCE IDENTIFICATION
For this study, we limit our sample to those sources detected at >3.75σ at 450 or 850 μm. At this threshold, the contamination due to false-detections is expected to be ≲ 5 per cent (Zavala et al. 2017), which is acceptable for the goals of this paper. On the other hand, sources detected at two (or more) bands have a higher effective S/N, for example, a source detected at 3σ at two different wavelengths has an effective S/N of ∼4σ. For this reason, we also include all the sources detected at both wavelengths with S/N >3.0. A source is considered detected at both wavelengths if the separation between the 450 and 850 μm position is ≲ 7 arcsec, which corresponds to 2.5σ the joined expected positional uncertainty added in quadrature according to the beam-size and S/N (Ivison et al. 2007a).
Following these criteria, our final sample consist of 95 sources: 56 (corresponding to 59 per cent of the total sample) are detected at both wavelengths, 31 (33 per cent) are detected only at 850 μm, and 8 (8 per cent) are detected only at 450 μm.
3.1 Counterpart matching
Traditionally, the first step to find a SMG counterpart is to associate it with a radio or IR source, since the source density at optical wavelengths is much higher and therefore many potential counterparts lie within a typical search radius.
The radio band (1.4 GHz) is chosen because it also traces recent star formation via synchrotron radiation and there is a well-known FIR–radio correlation (Yun & Carilli 2002; Barger et al. 2014). On the other hand, 24 μm observations are sensitive to the warm dust emission and SMGs have been found to be bright at this wavelength (e.g. Pope et al. 2006). Additionally, the surface density of sources is relatively low at these bands and consequently the probability for a misidentification is expected to be low, although some ALMA studies reported a misidentification fraction of up to ∼30 per cent (Hodge et al. 2013). Over the last decade, observations at 8 μm have also been used for counterpart identifications (e.g. Ashby et al. 2006; Pope et al. 2006; Biggs et al. 2011; Michałowski et al. 2012a; Yun et al. 2012) since these trace the emission from the older and mass-dominant stellar populations in this kind of galaxies and, although the surface density is higher, these observations are usually deeper than those at 24 μm, increasing the fraction of identifications.
Using these three wavebands independently, we search for counterparts with a variable search radius equal to 2.5σ (corresponding to an ∼96 per cent probability), where σ is the positional uncertainty of each galaxy based on its S/N and the FWHM of the beam, as described by Ivison et al. (2007a), and giving preference to the 450 μm position (if available). We also imposed a minimum search radius of 4 arcsec to account for systematic astrometry differences between catalogues and for the positional uncertainties of the NIR/radio sources. In addition, this minimum search radius might help us to increase the fraction of identifications, since it has been found that some SMGs detected with relatively high S/N lie outside of their nominal 2.5σ positional uncertainties (Hodge et al. 2013). Then, if a potential counterpart is found, we estimate the statistical significance of the association or in other words, the corrected Poisson probability, p, that the counterpart candidate has been selected by chance, following the method described by Downes et al. (1986) (see also Dunlop et al. 1989 and Ivison et al. 2007a).
An empirical value of p < 0.05–0.1 to define robust counterparts for SMGs is commonly adopted in the literature (e.g. Pope et al. 2006; Chapin et al. 2009b; Yun et al. 2012), however, using ALMA observations Chen et al. (2016) showed that there is no statistical difference between the accuracy if we adopt p < 0.05 or p < 0.1 (i.e. consistent within the error bars) but a better completeness if we select the later. Therefore, we adopt as probable counterparts those galaxies with p < 0.1. For the case of galaxies with multiple candidates (20 out of 71), we select the one with the lowest p-value, following Michałowski et al. (2017), who have shown that this procedure recovers the galaxy with the dominant contribution to the submillimetre flux density in most cases (∼86 per cent).
Using these criteria, and after rejecting six candidates based on their discrepant FIR photometric redshifts (see Section 4.1), we achieve a successful identification rate of ∼75 per cent (71 out of 95) for the whole sample. In terms of the SCUBA-2-band detections, the successful identification rate is 82 per cent for those galaxies detected at both wavelengths, 88 per cent for those detected only at 450 μm, and 62 per cent for those detected only at 850 μm. The lower detection rate for the 850 μm-only detected galaxies may reflect the higher redshift nature of these galaxies (see Section 4.1), albeit the larger beam-size and the source blending translate into a larger positional uncertainty, which can also explain the lower fraction of counterparts.
Once we have the radio/IR counterparts, we match these sources with the 3D-HST catalogue (Skelton et al. 2014; Momcheva et al. 2016) using a search radius of 1.5 arcsec (although all the matches lie within 1 arcsec). For those galaxies which lie outside of the 3D-HST coverage (13 out of 71), we use instead the IRAC catalogue (Barro et al. 2011a,b). All the 71 galaxies with radio/IR counterparts also have an optical counterpart in these catalogues. All properties are summarized in Table A1.
3.2 Reliability of galaxy identifications
Before deriving the physical properties of the sample, it is important to test the reliability of our identification methodology and to quantify the misidentification fraction. It is clear that submillimetre/millimetre interferometry represents the best way of identifying counterparts correctly (e.g. Younger et al. 2007, 2009; Wang et al. 2011; Barger et al. 2012; Smolčić et al. 2012b; Hodge et al. 2013). However, the archival submillimetre/millimetre interferometry data are scarce in this field (which is, furthermore, inaccessible to ALMA). From the PHIBSS survey (Tacconi et al. 2013), we found six fields targeted with IRAM Plateau de Bure millimeter interferometer (PdBI) whose detections lie close (<10 arcsec) to sources in our catalogue. These observations were designed to map the 12CO(3–2) transition in massive (M* > 2.5 × 10¹⁰ M⊙), main-sequence star-forming galaxies at z ∼ 1.2 and 2.2. Since it has been shown that SMGs are bright in CO emission (e.g. Greve et al. 2005) and giving the properties of the PHIBSS targeted galaxies, we can assume that the CO emission is associated with an SMG. Moreover, the probability of finding by chance a CO line emission close to our SMGs is low, based on the results from blind CO surveys (Walter et al. 2016). Assuming then that these six 12CO(3–2)emission lines come from the SMGs, we can test our galaxy identifications. We find that for five galaxies we have identified the correct counterpart with our method. The remaining source is one of those with only 850 μm detection, which has a larger positional uncertainty. Alternatively, the CO line might have been too faint to be detected by PHIBSS. Based on these results, we estimate a correct counterpart accuracy of ≳ 83 per cent.
On the other hand, Casey et al. (2013) estimated the counterpart contamination when using the SCUBA-2 450 μm position based on the reduced beam size with respect to 850 μm, assuming a reduction in counterpart contamination proportional to the reduction in sky area searched for potential counterparts, and adopting an ∼30 per cent of incorrect associations for the 850 μm sources (Hodge et al. 2013). Based on this, they inferred a ∼5 per cent of misidentifications for 450 μm sources. Using these values, and considering that only 33 per cent of our sample lack 450 μm positions, we estimate that ∼13 per cent of the sample could have incorrect identifications.
Finally, we compare the IRAC colours of our identified galaxies with the IRAC colour–colour space diagram proposed for SMG counterpart identification by Yun et al. (2008). Securely identified SMGs (with radio or submillimetre interferometric observations) are known to lie within this proposed diagram (Alberts et al. 2013), and may help us to inquire into the reliability of our identifications. As shown in Fig. 1, most of our identified counterparts (∼95 per cent) lie on this space (and the remaining sources lie very close to the edges), which further supports the associations.
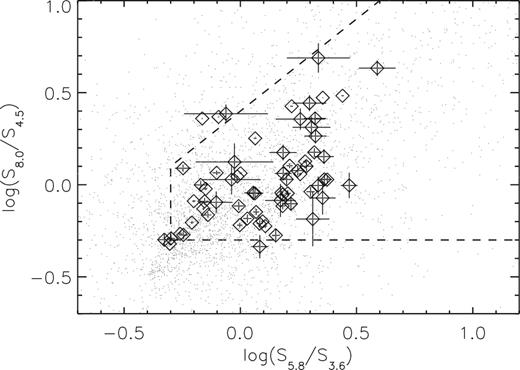
Spitzer/IRAC |$S_{5.8_{\mu \rm m}}/S_{3.6_{\mu \rm m}}$| versus |$S_{8_{\mu \rm m}}/S_{4.5_{\mu \rm m}}$| colour–colour diagram for the associated counterparts to our SMGs (black diamonds). The dashed lines enclose the IRAC colour cuts suggested for SMG counterpart identification by Yun et al. (2008), where most of our identified SMGs lies. The grey dots represent other galaxies in the 3D-HST catalogue in the same field.
In summary, based on these three independent tests, we infer that our identification method recovers the correct counterpart with an accuracy of ≳ 85 per cent, which is acceptable for an statistical characterization of the population.
4 DERIVED PROPERTIES
4.1 Redshift distribution
The optical catalogues described above include redshift estimations for most of the sources. For those galaxies with identified counterparts in the 3D-HST catalogue, we use the combined ‘Z-BEST’ redshift information (hereafter zopt). The best redshift is: (1) spectroscopic long-slit redshift, if available in the compilation by Skelton et al. (2014); (2) spectroscopic HST grism redshift (Momcheva et al. 2016), if there is no archive spectroscopic redshift and if the grism spectrum is not flagged as faulty; or (3) optical photometric redshift derived from the EAZY code (Brammer, van Dokkum & Coppi 2008). For the small fraction of sources with no 3D-HST counterpart, we use the photometric redshifts reported in the IRAC catalogue (Barro et al. 2011b). Although these redshifts have been estimated using the Rainbow code (Barro et al. 2011a), the authors have shown that there is a good agreement with the values estimated using EAZY. The typical uncertainty for the grism-based redshifts is Δz/(1 + z) ≈ 0.003 (Momcheva et al. 2016), and Δz/(1 + z) ≲ 0.04 for the photometric redshifts derived from EAZY or Rainbow (Barro et al. 2011b; Skelton et al. 2014) with a catastrophic failure rate of less than ∼10 per cent, when considering only z > 0.5 sources (although, most of them are optically selected galaxies). However, when considering only the galaxies in our catalogue, we find a median uncertainty of Δz/(1 + z) = 0.05 for the photometric redshifts.
On the other hand, we estimate photometric redshifts for the whole sample using the rest-frame FIR photometric data provided by Herschel 100, 160, 250, 350, 500 μm, and our SCUBA-2 observations at 450 and 850 μm (hereafter zFIR). Though this method is not as accurate as the optical photometric redshifts, it allows us to estimate the redshift for sources with no counterparts, and therefore, to derive a complete redshift distribution. We fit an average SMG SED template (Michałowski, Hjorth & Watson 2010) to the flux density measured at these wavelengths. This is the average SED of 70 SMGs with spectroscopic redshifts, where GRASIL models (Silva et al. 1998) were fitted to the photometry and then averaged. During this procedure the adopted flux calibration errors are 2 per cent and 4 per cent at 100 and 160 μm,6 4 per cent for the SPIRE bands (Bendo et al. 2013), and 10 per cent and 5 per cent for the SCUBA-2 450 and 850 μm (Dempsey et al. 2013). In case of non-detections, we incorporate the upper limits into the fitting through a survival analysis (Isobe, Feigelson & Nelson 1986) following the same procedure as in Aretxaga et al. (2007). For some sources, only lower limits on redshifts could be derived (identified with upward arrows in Fig. 2) due to the high number of non-detections. These zFIR values are compiled in Table A1.
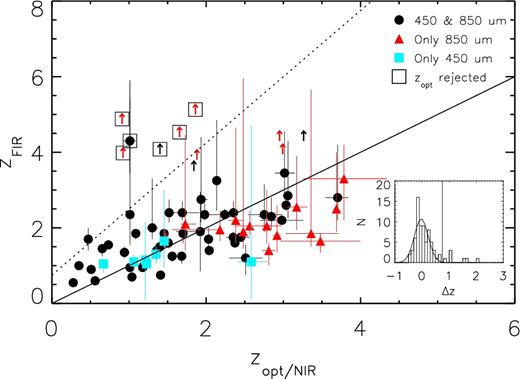
Comparison between FIR photometric redshifts, derived from Herschel and SCUBA-2 observations (zFIR), and optical-infrared spectroscopic or photometric redshifts (zopt) of the counterparts (see Section 4.1). Those sources with only lower limits are marked with upward arrows. The inset plot shows a histogram of the relative difference (Δz = (zFIR − zopt)/(1 + zopt)) between the two estimations, which is well fitted with a Gaussian distribution. The sources with a discrepant redshift above 3σ of the Gaussian distribution (represented by the dotted line) are rejected given the potential of misidentification (see Section 4.1). The colours indicate if the source is detected at both wavelengths (black symbols) or only in a single band (blue and red symbols for 450 or 850 μm, respectively).
In order to investigate the reliability of these photometric redshifts, we compare the zFIR with the optical redshifts described above for those galaxies with optical counterparts. As can be seen in Fig. 2, there is generally a good agreement between both estimations within the large scatter. The relative difference between these methods (Δz = (zFIR − zopt)/(1 + zopt)) is well fitted with a Gaussian function (see inset plot in Fig. 2) with a standard deviation of 0.25. However, there are six sources (marked with squares in the figure), for which the two redshift estimations differ dramatically (zFIR = 4–5 versus zopt ∼ 1). This may reflect an optical misidentification due to a nearby galaxy in the line of sight (e.g. Bourne et al. 2014) or because the identified optical galaxy is in fact lensing a more distant submillimetre source (e.g. Geach et al. 2015). All of these galaxies have S/N >5 and a low probability of being a false detection. For these reasons, we reject these optical associations (hence also their zopt) for the rest of the analysis, in order to avoid introducing any bias (following Koprowski et al. 2016 and Michałowski et al. 2017).
A trend can be seen in Fig. 2, where our zFIR is systematically lower than the optical redshift at zopt > 2. This may reflect the fact that our SED template is represented by a single temperature and reveals a relation between redshift and dust temperature, where warmer temperatures are necessary at higher redshifts to correct for this effect. The same trend was actually found in the photometric redshift of red Herschel sources (Ivison et al. 2016). However, due to the small number of photometric measurements for some sources in our catalogue and to the large scatter of this trend, we decide to keep our single dust temperature template for this purpose. As described below, these results are only used to complete the redshift distribution of all the sources in our catalogue. The rest of the analyses in the paper are focused only on those galaxies with optical counterparts. A detailed discussion of the dust temperature evolution is presented in Section 4.2.2.
The final redshift distributions for all the 450- and 850-μm selected galaxies are shown in Fig. 3. These include optical spectroscopic redshifts (36 sources, including HST grism-derived redshifts), optical photometric redshifts (35 galaxies), and FIR redshifts for those sources with no counterparts (24 sources). Individual values are reported in Table A1. In order to take into account the uncertainties in our values, the redshift distributions have been estimated by stacking the redshift likelihood distribution of each source. The stacked redshift distributions expand between 0 < z < 6, although, as expected due to the k-correction at NIR and radio wavelengths, all the galaxies with identified counterparts lie at z < 4. The median redshifts of the distributions are zmed = 1.66 ± 0.18 and 2.30 ± 0.20 (with the errors derived from a bootstrap method) for the 450- and 850-μm selected galaxies, respectively. This supports the statement that galaxies selected at different wavelengths have different redshift distributions as previously reported (e.g. Zavala et al. 2014; Béthermin et al. 2015b). Actually, all (but one) of the galaxies detected only at 450 μm (i.e. with no 850 μm detection) lie at z ≲ 1.5, while all the galaxies detected only at 850 μm lie at z ≳ 1.5. As described in the next sections, this is the main difference between the galaxies detected at only one of the two wavebands.
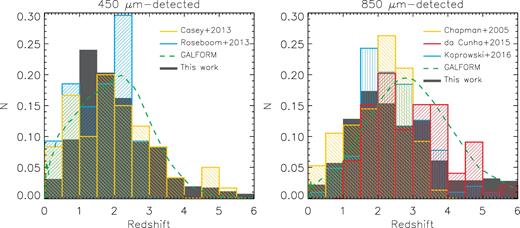
The normalized redshift distributions of our 450 and 850 μm-detected sources (left and right, respectively) are represented by the grey histograms. The 450 μm distribution has a median redshift of zmed = 1.66 ± 0.18 and the 850 μm one a median of zmed = 2.30 ± 0.20. For comparison, the results from previous observational studies are plotted in each panel (Chapman et al. 2005; Casey et al. 2013; Roseboom et al. 2013; da Cunha et al. 2015; Koprowski et al. 2016), as well as the theoretical predictions of the GALFORM model (Lacey et al. 2016) matched to the mean S2CLS/EGS depth.
4.1.1 Comparison with previous surveys
We compare our redshift distributions with those derived from previous similar studies in Fig. 3.
Roseboom et al. (2013) studied a sample of 450-μm selected galaxies from the S2CLS observations in the UDS and COSMOS fields with a depth similar to this work, although with a S/N threshold of 4. Their median redshift of 1.4 ± 0.2 is close to our value of 1.66 ± 0.18, however, as it can be seen in the figure, they have no sources with z > 3. This is expected since their redshift distribution is limited to those galaxies with optical counterparts, and therefore, the highest redshift galaxies are missing. On the other hand, Casey et al. (2013) presented an analysis for 450 and 850 μm galaxies on the COSMOS field covered with SCUBA-2 observations. For the 450 μm sample, they reported a median redshift of z = 1.95 ± 0.19. This value is slightly higher than the one found in this work, however, their sample comes from larger but shallower observations selecting, therefore, brighter galaxies that are not present in our smaller field (i.e. sources with |$S_{450\,\mu \rm m}>20\rm \ mJy$|). This is consistent with the picture that galaxies with higher fluxes are located preferentially at higher redshifts as suggested by previous studies (e.g. Pope et al. 2005; Koprowski et al. 2014). Finally, we also compare our 450 μm redshift distribution with theoretical predictions of the galform semi-analytical model (Lacey et al. 2016) for galaxies with S450 > 7 mJy. This flux density limit corresponds to the average limit of our sample (S/N >3.75). The model predicts a median redshift of 1.97, which is consistent with our value within ∼1.7σ. This model also includes the rare bright galaxies that our relatively small map cannot constrain, which could account for the mild difference between the redshift distributions. Actually, the predictions of the model are in better agreement with the results of Casey et al. (2013), where, as mentioned before, the brightest galaxies are better sampled due to the larger area mapped.
At 850 μm, Casey et al. (2013) reported a median redshift of =2.16 ± 0.11, which is just below but consistent with our median value of 2.3 ± 0.2. Nevertheless, our distribution shows a flat high-redshift tail between 4 < z < 6 that is not present in the Casey et al. result. This is not surprising since their redshift distribution is limited to those galaxies with optical counterparts. On the other hand, da Cunha et al. (2015) presented the redshift distribution of sources with 870 μm fluxes above 4 mJy (a factor of ∼2 larger than our threshold) derived from magphys SED modelling, which has a median redshift of 2.7 ± 0.1. In contrast to our distribution, they have no sources at z < 1 (Fig. 3). This may reflect the fact that we are using the 450 μm information to select faint sources below our formal detection limit, increasing the completeness of our sample. As in this work, Koprowski et al. (2016) used deep S2CLS observations to study the properties of 850 μm galaxies in the COSMOS field. Their redshift distribution with a median of 2.38 is in very good agreement with our result, as can be seen from Fig. 3. On the theoretical side, the galform model predicts a median of 2.88 for galaxies with S850 > 1.5 mJy. This value is higher than ours but consistent within 3σ.
In general, our results are in broad agreement with previous studies and show a trend where longer wavelength observations select, on average, higher redshift galaxies.
4.2 IR luminosities, SFRs, and dust properties
4.2.1 Luminosity
In Fig. 4, we plot the IR luminosity (8–1000 μm) as a function of redshift for our sources with optical counterparts, and the detection limit (taking the best case between the 450 and 850 μm limit at each redshift) assuming a modified blackbody with Td = 47 K (the average temperature of the sample) and Td increasing with redshift (as measured in our data, see Section 4.2.2). As it can be seen, the detection limit predicted by the fixed dust temperature SED does not reproduce our estimations, overpredicting the LIR limit at low redshift and underpredicting it at high redshift. This effect was also noticed by Ivison et al. (2016). On the other hand, the expected detection limit for a modified blackbody with dust temperature increasing with redshift is in much better agreement with our measurements. This provides additional evidence of a relation between Td and z (see Sections 4.1 and 4.2.2).
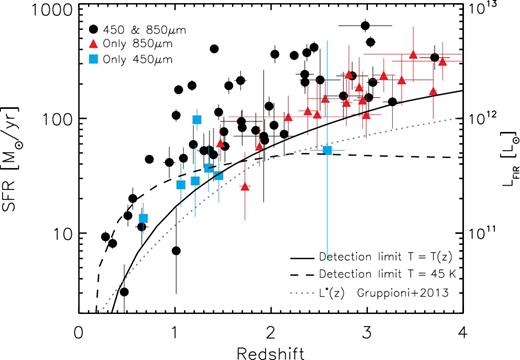
SFR (∝ LIR) as a function of redshift for galaxies with optical counterparts. The solid line represents the sensitivity limit of our survey (considering both wavelengths) assuming a modified blackbody with a dust temperature increasing with redshift (see Section 4.2.2), and the dashed line a model with fixed dust temperature at Td = 47 K (the average temperature of our sample). As can be seen, the expected detection limit predicted by the SED with variable temperature is in better agreement with the measurements. The depth of our survey allows us to detect galaxies with SFRs down to ∼ 50 M⊙ yr− 1 at z ≈ 1–2 and we are sensitive to |$\rm SFR>150\ \rm M_{\odot }\ {\rm yr}^{-1}$| at any redshifts. The dotted line is L*(z) as reported by Gruppioni et al. (2013), which is slightly below (less than a factor of 1.5) our detection limit.
Our survey is deep enough to detect galaxies down to an IR luminosity of LIR ∼ 1.5 × 10¹² L⊙ at any redshift below z ∼ 4 (see Fig. 4), which corresponds to an SFR of 150 M⊙ yr−1, assuming the Kennicutt 1998 relation for a Chabrier 2003 IMF. This highligths the depth of our survey, which actually allows us to detect several galaxies with 20 < SFR < 100 at 1 < z < 2 (as other recent deep S2CLS studies, e.g. Koprowski et al. 2016; Bourne et al. 2017). This population of galaxies was unreachable by previous submillimetre surveys with single-dish telescopes in blank fields. Also shown in Fig. 4 is the evolution of the knee of the IR luminosity function (L*, Gruppioni et al. 2013), which is slightly fainter (less than a factor of 1.5) than our sensitivity limit.
The mean IR luminosity of our sample is 1.5 ± 0.2 × 10¹² L⊙ which corresponds to a mean SFR of 150 M⊙ yr−1 (where the errors have been estimated by a bootstrapping method), covering a range from LIR = 0.3 × 10¹¹ − 7.4 × 10¹² L⊙ (SFR = 3–740 M⊙ yr−1). We notice that at a fixed redshift, the galaxies detected at both wavelengths (black circles in Fig. 4) are, on average, more luminous than those detected at only one wavelength (blue and red circles for 450 and 850 μm-only detected sources, respectively), as expected.
4.2.2 Dust temperature
The mean dust temperature for the whole sample is 〈Td〉 = 47 ± 15 K, which is in agreement with previous studies. For example, da Cunha et al. (2015) found, using the magphys code (da Cunha, Charlot & Elbaz 2008), an average dust temperature of T = 43 ± 2 K for the 870 μm ALMA-detected sources from the ALESS survey (Hodge et al. 2013; Karim et al. 2013), which cover a similar range of redshifts and flux densities. On the other hand, Roseboom et al. (2013) derived a mean temperature of Td = 42 ± 11 K for |$450\text{-}{\mu m}$| selected galaxies from the S2CLS in COSMOS and UDS, which have roughly the same depths as our maps. These temperatures are, however, hotter than the ones derived by Swinbank et al. (2014) for the ALESS sample when using modified blackbody fits, which have a median value of ≈ 32 K. These differences may be partially due to differences in the modified blackbody distributions, i.e. optically thin versus optically thick, dissimilar emissivity indices, etc., as discussed in Section 4.2.
As shown in Fig. 5, the dust temperature follows the well-known temperature–luminosity relation found in previous studies (e.g. Chapman et al. 2005; Kovács et al. 2006; Chapin, Hughes & Aretxaga 2009a; Magnelli et al. 2012; Symeonidis et al. 2013; Swinbank et al. 2014; Hodge et al. 2016). Our results are consistent with the relation found by Chapman et al. (2005) (|$T_{\rm d}\propto L_{\text{FIR}}^{0.28}$|; solid line in the figure). This slope is steeper than the one reported by Casey et al. (2012) (|$T_{\rm d}\propto L_{\text{FIR}}^{0.14}$|; dashed line in Fig. 5), however, their sample peaks at lower redshift (∼0.85 versus ∼2.3) and it is selected at shorter wavelengths, so the differences can be explained by selection effects (see discussions by Chapin et al. 2011, Marsden et al. 2011, and Casey et al. 2012).
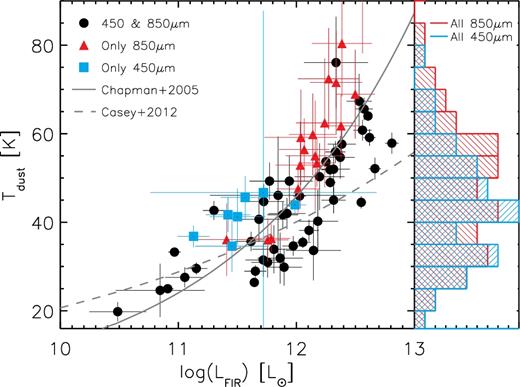
Left: Relation between dust temperature (Td) and IR luminosity (LIR), derived from a modified blackbody SED fitting at fixed redshift. The solid line is the relation reported by Chapman et al. (2005), which qualitatively reproduces our measurements, and the dashed line represents the relation found by Casey et al. (2012). Right: Dust temperature distributions for all the 450 and 850 μm-detected sources represented by the blue and red histograms, respectively. The mean dust temperature for each sub-sample is 〈Td〉 = 43 ± 12 K and 49 ± 15 K for the 450 and 850 μm galaxies, respectively.
Interestingly, if we inquire into the dust temperature of the 450 and 850 μm-detected galaxies independently, we find that both sub-samples show similar values. The dust temperature distributions for the 450 and 850 μm-detected galaxies are represented in the right side of Fig. 5. These distributions are not statistically different from each other, with mean dust temperatures of 〈Td〉 = 43 ± 12 K and 49 ± 15 K for the 450 and 850 μm galaxies, respectively. This supports the idea that the redshift is the main difference between both populations.
We also find an evolution of the dust temperature, with higher temperatures at higher redshifts, as is clearly seen in Fig. 6. This evolution has been reported in previous observational works (Magdis et al. 2012; Magnelli et al. 2014; Genzel et al. 2015; Kirkpatrick et al. 2015; Hodge et al. 2016), as well as in theoretical predictions (Lagos et al. 2012; Cowley et al. 2017). The best-fitted linear model to our data is described by Td = 12(1 + z) + 11 K (see Fig. 6), although with large scatter. As a comparison, we also plot in the figure the relations found by other authors (Casey et al. 2013; Béthermin et al. 2015a). With this evolution we can reproduce the luminosity detection limit seen in our data (see Fig. 4), and this also explains the systematic bias between our FIR photometric redshifts and the optical redshifts zopt (see Section 4.1).
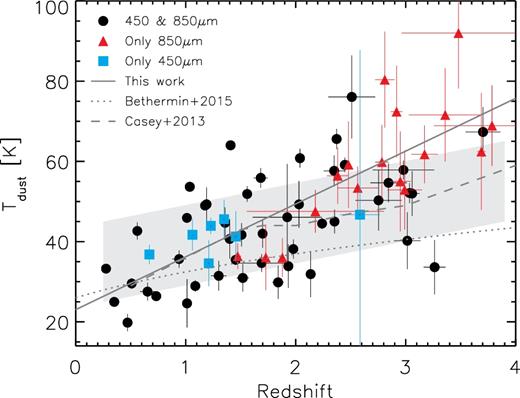
Dust temperature against redshift for sources with optical counterparts. The dust temperature has been estimated through a greybody SED fitting at fixed redshift with fixed β = 1.6. The dashed line represents the best linear fit for our sample, with dust temperature increasing with redshift (see discussion in Section 4.2.2). As it can be seen, the galaxies detected at just one single band (blue and red circles for 450 and 850 μm-only detected sources, respectively) follow the same trend that those detected at both wavelengths (black circles). For comparison, we also plot the relation found by Casey et al. (2013) and Béthermin et al. (2015a). The grey shaded region represents the apparent evolution of dust temperature with redshift originated by selection effects, specifically, due to the combination of our luminosity detection limit and the dust temperature–luminosity relation (see the main text for details of the simulation). However, this effect cannot totally explain the correlation found in the data, which implies a real evolution of dust temperature with redshift.
However, our luminosity detection limit is not flat at all redshifts. This selection effect along with the temperature–luminosity relation may produce an aparent redshift-temperature evolution in our sample, with a similar trend as the one in Fig. 6, since the less luminous galaxies (which have colder dust temperatures) can only be detected at low redshift. To discard that this evolution is not produced only by selection effects, we perform the following simulation. First, we assume the dust temperature–luminosity relation of Chapman et al. (2005), which reproduces well our measurements (Fig. 5). Secondly, we estimate the flux density at 450 and 850 μm for each simulated source based on the dust temperature, luminosity, and redshift, using equation 1. The redshift of each source is chosen randomly (i.e. without any dependence on dust-temperature or luminosity) from a distribution that resembles those described in Section 4.1. Then, we impose our flux detection limit at each wavelength to consider only those sources that would be detected in our observations and, finally, we look for any relation between the dust temperature and redshift caused by selection effects. The results of these simulations are represented by the grey region in Fig. 6. Indeed, the combination of our detection limit and the dust temperature-luminosity relation introduces a trend between dust temperature and redshift, however, the relation found in the real data is much steeper (Fig. 6) and cannot be explained only by selection effects.
This implies that there is a more fundamental relation between LIR, z, and Td (and probably other parameters such as Mdust or sizes). This should be targeted in future studies of complete samples of galaxies with spectroscopic redshifts in order to understand the physical processes behind this evolution. Some possible explanations include different metallicities at different redshifts (e.g. Magnelli et al. 2014), evolution of the size of the star-forming region where galaxies at high redshifts are more compact and then hotter (e.g. Hodge et al. 2016; Zavala et al. 2018), or a combination of different effects (e.g. Cowley et al. 2017).
4.3 Stellar masses and the main sequence
In this section, we explore the connection between star formation rate and stellar mass for our galaxies. We adopt the stellar masses from the 3D-HST catalogue (Skelton et al. 2014; Momcheva et al. 2016), which are derived from SED fitting with FAST (Kriek et al. 2009) using the ‘Z-BEST’ redshifts (see Section 4.1). The SEDs are based on Bruzual & Charlot (2003) stellar population synthesis (SPS) models with a Chabrier (2003) IMF. For the small fraction of sources which are outside of the 3D-HST coverage (13 out of 71), we use the stellar mass reported by Barro et al. (2011b) derived using the same SPS models and the same IMF. A comparison between the stellar mass derived for the SCUBA-2 common sources in these catalogues shows that both estimations are in reasonable agreement with an average log (M*3DHST/M*Barro2011) ≈ 0.2 (without any systematic offset).
The mean stellar mass for the galaxies with optical counterpart is 9 ± 0.6 × 10¹⁰ M⊙, and >90 per cent of these galaxies have M* ≳ 1 × 10¹⁰ M⊙. This is in good agreement with the estimations of the ALESS sources by da Cunha et al. (2015), with a median stellar mass of 8.9 ± 0.1 × 10¹⁰ M⊙, as well as with other studies of galaxies with similar flux densities (e.g. Aguirre et al. 2013; Simpson et al. 2014; Koprowski et al. 2016; Michałowski et al. 2017). This is also in agreement with the values found by Dunlop et al. (2017) for the sources detected in the ALMA image of the Hubble Ultra Deep Field, where ∼80 per cent of the sources have M* ≳ 1 × 10¹⁰ M⊙, even though the ALMA map is deeper and was done at 1.3 mm.
In Fig. 7, we plot the SFR as a function of stellar mass for sources in two redshift bins (1.0 ≤ z < 2.5 and 2.5 ≤ z < 4.0). This shows the place occupied by our galaxies relative to the main sequence of star-forming galaxies, for which we adopt the parametrization reported by Speagle et al. (2014) based on a compilation of several studies from the literature covering a wide range of stellar masses up to z ∼ 6. In the low-redshift bin (1.0 ≤ z < 2.5), we are sensitive down to SFR∼50 M⊙ yr−1 and M* ∼ 3 × 10¹⁰ M⊙, and in the high-redshift bin down to SFR∼150 M⊙ yr−1. This allows us to sample the typical parameter space of the main sequence of star-forming galaxies (for these redshifts and stellar masses) and hence to study the nature of our galaxies in this context. It can be seen that at these redshifts, most of our galaxies (∼85 per cent) lie on the high-mass end of the main sequence within a factor of ±3σ, where we assume as 1σ the 0.2 dex intrinsic scatter reported by Speagle et al. (2014). This result is consistent with previous studies (e.g. Michałowski et al. 2012b; Koprowski et al. 2016; Dunlop et al. 2017; Michałowski et al. 2017; Schreiber et al. 2017), and it has been predicted by some cosmological simulations (e.g. Davé et al. 2010; Narayanan et al. 2015). On the other hand, we can also represent the main sequence of star-forming galaxies in terms of the specific SFR (sSFR = SFR/M*), and take into account its evolution with redshift. This is shown in Fig. 8, from which it is clearly seen that our galaxies (even those at z < 1) lie on this relation and follow the same redshift evolution.
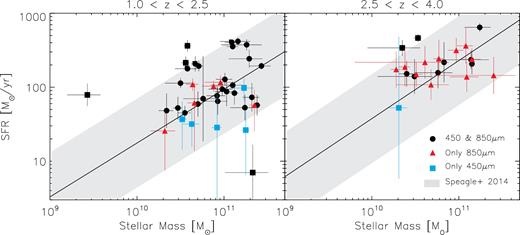
The SFR as a function of stellar mass for those galaxies with optical counterparts in two different redshift bins indicated at the top of the of each panel. The solid line represents the main sequence of star-forming galaxies at z ∼ 1.5 (left) and z ∼ 3 (right) derived from a compilation of different studies by Speagle et al. (2014) and the shaded area shows the ±3σ scatter over the defined average. As it can be seen, most SMGs lie within a factor of ±3σ of the main sequence, represented by the grey shaded region.
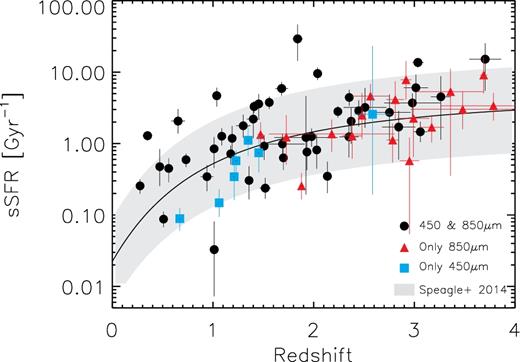
sSFR as a function of redshifts for all the galaxies with optical counterparts. The solid line represents the main sequence of star-forming galaxies for M* = 9 × 10¹⁰ M⊙ (Speagle et al. 2014). Most of our galaxies (∼85 per cent) lie within a factor of ±3σ of the main sequence (indicated by the grey shaded region).
Only a small fraction ( ≲ 15 per cent) of our faint SMGs are above the main sequence. Actually, from the eight sources above it three have at least another optical galaxy within our search radius, and therefore, their exceeded SFR may be explained by the blending of multiple sources. This fraction would be even lower if we adopt the 0.3 dex observed scatter of the main sequence instead of the intrinsic one (Speagle et al. 2014). This suggests that most SMGs can be fully explained as the most massive star-forming main-sequence galaxies, as also discussed by Michałowski et al. 2017.
4.4 The IRX-|$\boldsymbol {\beta }$| relation
The infrared excess (IRX = log [LIR/LUV]) to UV-slope (β, fλ ∝ λβ) relation, links the amount of dust absorption measured in the UV to the amount of infrared re-emission. It has been shown that local starburst galaxies follow a tight IRX-β relation (e.g. Meurer, Heckman & Calzetti 1999; Calzetti et al. 2000), which may be used to infer dust obscuration, and hence total SFRs, when IR data are not available. However, this relation is uncertain at high redshifts, with some studies reporting galaxies consistent with the local relation (e.g. Reddy et al. 2012, To, Wang & Owen 2014; Bourne et al. 2017) while others showing sources above (e.g. Penner et al. 2012, Oteo et al. 2013) and below (e.g. Capak et al. 2015; Álvarez-Márquez et al. 2016; Bouwens et al. 2016; Pope et al. 2017) of this relationship. These high-redshift studies have been done with samples selected with different criteria (e.g. UV-selected versus IR-selected galaxies), which could introduce some extra effects (Casey et al. 2014b). Here, we use our deep survey to constrain the dust absorption properties of faint SMGs in the context of the IRX-β relation. For this analysis we limit the sample to those sources detected within the 3D-HST catalogue, which provides estimations for the UV spectral slope. This quantity is determined from a power-law fit of the form fλ ∝ λβ (Skelton et al. 2014). The IRX is determined as the ratio between the SFR determined from the IR data (see Section 4.2.1) and the SFR derived from the rest-frame 1600 Å luminosity (not corrected for dust attenuation, Skelton et al. 2014).
Fig. 9 shows the locus occupied by our galaxies in the IRX-β plane, colour-coded according to their IR luminosities. For comparison, we also plot the Meurer et al. (1999) relation usually adopted for starburst galaxies (see also Calzetti et al. 2000) and its revised version corrected for aperture effects (Takeuchi et al. 2012), along with the relation found in the Small Magallanic Cloud (SMC; Pettini et al. 1998). This figure suggests that there is a variation in the IRX-β relation as a function of IR luminosity (∝ SFR), where galaxies with LIR ≳ 1 × 10¹² L⊙ (the most luminous objects) lie above of the corrected starburst relation, while source with LIR ≲ 1 × 10¹² L⊙ preferentially lie below it, in better agreement with the SMC relation (although with a large scatter). In Fig. 9, we also plot as comparison other IR-detected galaxies with IR luminosity similar to our less luminous sources (Capak et al. 2015; Pope et al. 2017), which show similar results. The same trend as a function of IR luminosity was reported by Casey et al. (2014a) with a break luminosity of ≈1011.5, and by da Cunha et al. (2015) who show tentative evidence of lower dust attenuation for the lowest luminous galaxies. Exploring other dependencies, we also find a variation as a function of dust temperature and sSFR, which is not surprising given the correlation between these parameters and the IR luminosity.
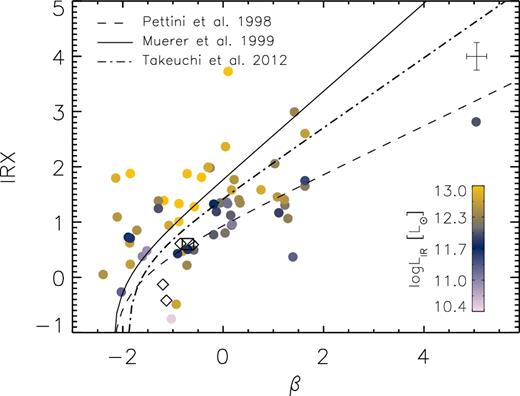
Infrared excess (IRX) versus the UV-continuum slope (β) for galaxies with optical counterpart. The points are colour-coded by their infrared luminosity. The solid line shows the original IRX-β relation for starburst galaxies (Meurer et al. 1999), which was then aperture-corrected by Takeuchi et al. (2012) (dot–dashed line), while the dashed line represents the SMC extinction curve (Pettini et al. 1998). The typical uncertainty of our values is represented on the top right-hand corner. The small diamonds represent ALMA observations of z ∼ 5 galaxies with similar luminosities (LFIR ≈ 3 × 10¹¹ L⊙, Capak et al. 2015), and the square is the measurement of a lensed galaxy at z ≈ 4.1 with LFIR ≈ 1 × 10¹¹ L⊙ detected by the LMT (Pope et al. 2017).
The explanation for this deviation from the nominal relation is not entirely clear. The interpretions of different observational results and some theoretical models span different scenarios. For example, a more abundant population of young O and B stars for the bluer galaxies (Casey et al. 2014b), dust composition and enrichment (Mancini et al. 2016; Safarzadeh, Hayward & Ferguson 2016), geometry effects (da Cunha et al. 2015), different star formation histories (Kong et al. 2004), or a combination of these factors (Salmon et al. 2016). Interestingly, some of our galaxies lie below the SMC relation, even when this curve is generally thought to be a limiting case for star-forming galaxies (e.g. Pettini et al. 1998). This could be evidence of older stellar populations in these objects (e.g. Kong et al. 2004; Popping, Puglisi & Norman 2017), however, this scenario is not suitable for the z ∼ 5–6 galaxies reported by Capak et al. (2015) which are expected to be dominated by very young systems. In any case, this implies a non-universal IRX-β relation.
4.5 Morphologies
We use the morphological classification derived by van der Wel et al. (2012) and Huertas-Company et al. (2015a) in order to study the morphological properties of our sample. These studies consist of two-dimensional axisymmetric Sérsic models fitted with galfit (van der Wel et al. 2012), and visual-like classifications estimated using Convolutional Neural Networks (Huertas-Company et al. 2015a). These methods have been applied to the five CANDELS fields (Grogin et al. 2011; Koekemoer et al. 2011) using the HSTH160-band, which probes the optical rest-frame at the typical redshifts of our sources, and therefore, the mass-dominant component, rather than the high surface-brightness features which commonly dominate in the UV.
The visual-like classification of Huertas-Company et al. (2015a), which is based on neural networks trained to reproduce the visual morphologies published by Kartaltepe et al. (2015), are able to predict the results of experts classifiers with a bias close to zero and an ∼10 per cent scatter, with a misclassification fraction less than 1 per cent. Each galaxy has five associated real numbers which correspond to the frequencies at which expert classifiers would have flagged the galaxy as having a spheroid, having a disc, presenting an irregularity, being compact or a point source, and being unclassifiable. Based on these numbers, we show in Fig. 10 the probability of our galaxies to be classified as spheroidal, disc, or irregular (the probability of being classified as point source or unclassifiable is negligible for most of our sources). As it can be seen, most of our galaxies have a larger probability of being classified as a disc at all redshifts, but we note an interesting transition at z ∼ 1.4 with galaxies at high-redshifts showing also a significant probability of being classified as irregulars, or as spheroidals at lower redshifts.
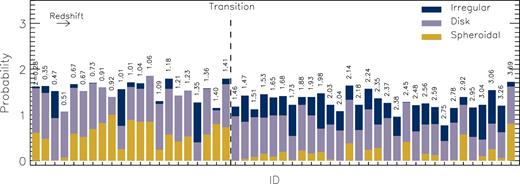
Probability of flagging a galaxy as spheroidal (gold), disc (purple), or irregular (blue), based on a visual-like classification in the H160-band estimated through a neural network algorithm (Huertas-Company et al. 2015a). The probabilities may add up to more than 1 because the categories are not mutually exclusive. The redshift of each galaxy is indicated in the top of each bar and galaxies are sorted from low-to-high redshift. Most of the sources have a higher probability of being classified as discs. However, the higher redshift sources (z ≳ 1.4) show also a significant probability of having some irregularities, while the lowest redshift galaxies (z ≲ 1.4) have also a significant probability of having a spheroidal component. This may be interpreted as evidence of structural evolution of SMGs and supports the idea that these objects are the progenitors of massive elliptical galaxies.
Following the classification example of Huertas-Company et al. (2015b), we defined the following morphological classes based on the aforementioned probabilities:
Pure discs: |$f_{\rm {\rm disc}}>2/3$| AND fsph < 2/3 AND firr < 2/3
Pure bulges: |$f_{\rm {\rm disc}}<2/3$| AND fsph > 2/3 AND firr < 2/3
Irregular discs: |$f_{\rm {\rm disc}}>2/3$| AND fsph < 2/3 AND firr > 2/3
Disc+bulges: |$f_{\rm {\rm disc}}>2/3$| AND fsph > 2/3 AND firr < 2/3
Irregulars/mergers: |$f_{\rm {\rm disc}}<2/3$| AND fsph < 2/3 AND firr > 2/3
where |$f_{\rm {\rm disc}}$|, fsph, firr, are the probabilities of being classified as a disc, spheroidal, or irregular, respectively. Based on this scheme, we can understand the transition in Fig. 10 as a high fraction of irregular discs at high redshifts and a high fraction of discs+bulges at low redshift. This is clearly seen in Fig. 11, where we plot the fraction of pure discs, irregular discs, and disc+bulges, as a function of redshift (we have not found pure bulges or irregular/mergers in our sample). From z ≈ 3–0.5 the galaxies move from being dominated by irregular discs to being dominated by discs+bulges.
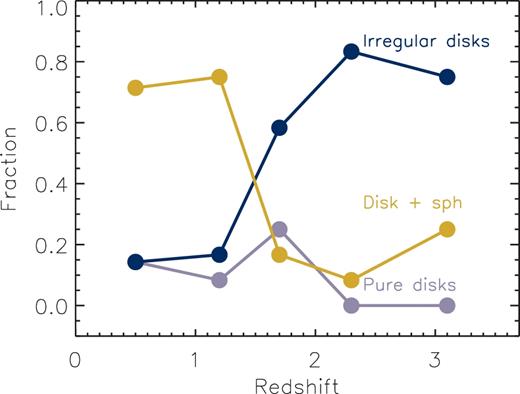
Fraction of galaxies classified as ‘pure discs’, ‘irregular discs’, and ‘discs + spheroids’ (see definitions in the text) based on the visual-like H160-band classification of Huertas-Company et al. (2015a). Although most of the galaxies show a higher probability of being classified as discs, there is a transition from ‘irregular discs’ to discs with a spheroidal component at z ∼ 1.4.
If these galaxies follow the same evolutionary path, this implies a morphological transformation from high to low redshift which results in the growth of a bulge component. This results supports, morphologically, the scenario of SMGs as progenitors of present-day massive elliptical galaxies. This has been inferred before by previous studies based on indirect evidence as the number space density, the star formation history and stellar masses, clustering, etc. (e.g. Lilly et al. 1999; Smail et al. 2002; Takagi, Hanami & Arimoto 2004; Swinbank et al. 2006; Hickox et al. 2012; Simpson et al. 2014). Similar morphological evolution has also been reported in the studies of optically detected massive galaxies (M* ≳ 1 × 10¹¹ M⊙, e.g. Mortlock et al. 2013; Bruce et al. 2014; Huertas-Company et al. 2015b), which supports the scenario that SMGs can be explained as the most massive star-forming main-sequence galaxies (e.g. Michałowski et al. 2017).
One important caveat is that surface brightness and other redshift issues, such as the sampling of different rest-frame wavelengths or the evolution of the galaxies’ apparent sizes, may affect the morphological classification, particularly the detection of bulges at high redshifts (which could lead us to a similar picture to the one presented in Fig. 11). However, Huertas-Company et al. (2015a) have shown that their method is able to reproduce the visual classification with a bias close to zero up to (at least) z ∼ 2.7. Furthermore, the transition occurs abruptly between z ≈ 1–2, where the H160-band is still sensitive to the optical rest-frame from older stars.
Similar results can be obtained using the parameters of the best-fitting Sérsic models. Structural properties (i.e. effective radii and Sérsic indices; Sérsic 1963) are taken from the public catalogue released by van der Wel et al. (2012), which were obtained with galfit and H160-band images. The median Sérsic index of our sample is |$n=1.4^{+0.3}_{-0.1}$| (see Sérsic index distribution in Fig. 12) with a median half-light radius of r1/2 = 4.8 ± 0.4 kpc, where the errors have been estimated via bootstrap resampling. This is in good agreement with the results found by Targett et al. (2013) and Chen et al. (2015), who also studied the morphology of SMGs in NIR bands. They reported median values of n = 1.0 ± 0.1 and r1/2 = 4.1 ± 0.5 kpc, and n = 1.2 ± 0.3 and |$r_{1/2}=4.4^{+1.1}_{-0.5}$| kpc, respectively. These values support the conclusion derived from the visual-like classification, that the dominant component in our galaxies is disc-like, as discussed by Targett et al. (2013).
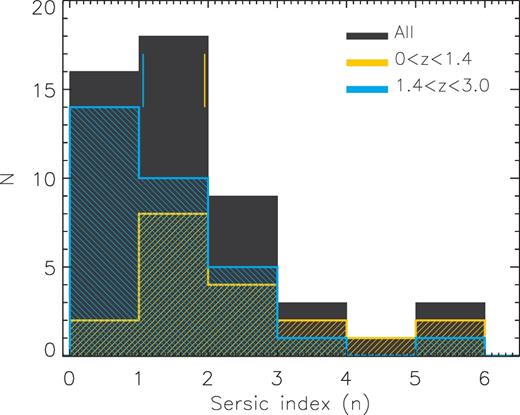
The Sérsic index distribution for our sources with optical counterparts derived from a two-dimensional modelling of the HSTH160-band images (van der Wel et al. 2012). The sources have been divided into two sub-samples: galaxies with z ≤ 1.4 are represented by the blue histogram and the sources with 1.4 < z < 3 by the yellow one. The vertical lines represent the median value for each sub-sample, where the lowest redshift galaxies show larger Sérsic index.
In order to study the morphological transition described above (Fig. 11), we estimate the median Sérsic index in two redshift bins. The galaxies at higher redshifts (z > 1.4) have a median value of n ≈ 1, while the low-redshift galaxies (z ≤ 1.4) show a larger value of n ≈ 2. This increases in the median Sérsic index from high to low redshift also suggests a morphological transformation, which implies the formation of a bulge component. We emphasize that this conclusion is supported by two completely independent morphological classification methods and represents morphological evidence for an evolutionary link in the direction of SMGs evolving towards local elliptical galaxies. The mechanism of bulge formation, however, cannot be deduced from our data, since we cannot discriminate between gas rich major mergers and violent disc instabilities, or other scenarios like minor mergers.
5 CONCLUSIONS
We have used the rich multiwavelength data set available in the EGS field to study the physical properties of faint submillimeter galaxies detected in deep SCUBA-2 observations at 450 and 850 μm (Zavala et al. 2017). This survey, together with other similar deep SCUBA-2 maps, represents one of the deepest blank-field observations achieved with a single-dish telescope, which allows us to detect galaxies with |$\rm SFR\ge 150\ \mathrm{M}_{\odot }\ {\rm yr}^{-1}$| at all redshifts. Our sample consists of both 450- and 850-μm selected galaxies, which increases the completeness and minimizes the selection effects associated with single-band observations (as discussed by Casey et al. 2013). Additionally, this allows us to explore the physical differences between these populations. The final sample includes 95 sources: 56 (59 per cent) are detected at both wavelengths, 31 (33 per cent) are detected only at 850 μm, and 8 (8 per cent) are detected only at 450 μm.
Using radio and IR observations as an intermediate step to associate our SMGs with optical counterparts, we achieved a robust association rate of 75 per cent. Combining optical photometric and spectroscopic redshifts (Barro et al. 2011b; Skelton et al. 2014; Momcheva et al. 2016) with FIR photometric redshifts for those galaxies with no counterpart (see Section 4.1) we derived the redshift distributions for both 450- and 850-μm selected galaxies, which have a median redshift of 1.66 ± 0.18 and 2.30 ± 0.20, respectively. This supports the scenario in which galaxies selected at different wavelengths have different redshift distributions (see also Zavala et al. 2014; Béthermin et al. 2015b). Actually, all (except one) of the galaxies detected only at 450 μm (i.e. with no 850 μm detection) lie at z ≲ 1.5, while all the galaxies detected only at 850 μm lie at z ≳ 1.5.
For those galaxies with optical counterparts we derived infrared luminosities, star formation rates, and dust temperatures. These, combined with their stellar masses, allow us to study the locus occupied by our galaxies relative to the main sequence of star-forming galaxies. Additionally, we also studied the dust absorption properties of these galaxies (in the context of the IRX-β relation) as well as the optical rest-frame morphology. The main conclusions from these analyses are:
The mean IR luminosity of our sample is 1.5 ± 0.2 × 10¹² L⊙, which corresponds to a mean SFR of 150 ± 20 M⊙ yr−1, covering a range from LIR = 0.3 × 10¹¹ − 7.4 × 10¹² L⊙.
The mean dust temperature for the whole sample is 〈Td〉 = 47 ± 15 K, and temperature monotonically increases towards high redshift (see Section 4.2.2). This Td–z relation is supported by: (1) higher dust temperatures at higher redshift (Fig. 6); (2) the luminosity detection limit seen in our data (see Fig. 4) which is well fitted when we consider this evolution, and; (3) a trend where the FIR photometric redshifts are systematically lower than the optical ones at zopt > 2 if a single dust temperature SED is assumed, which can be translated into a difference between the real dust temperature of the source and that of the SED (as reported before by Ivison et al. 2016).
We found that most of our galaxies (∼85 per cent) lie on the high-mass end of the main sequence within a factor of ±3σ, with a mean stellar mass of 9 ± 0.6 × 10¹⁰ M⊙.
In the context of dust absorption, we found a variation in the IRX-β relation as a function of IR luminosity, where galaxies with LIR ≳ 1 × 10¹² L⊙ lie on (or slightly above for the most luminous objects) the Meurer et al. (1999) relation, while sources with LIR ≲ 1 × 10¹² L⊙ are in better agreement with the SMC relation. A similar behaviour can be found as a function of dust temperature and sSFR.
Based on visual-like classifications of the HSTH160-band (Huertas-Company et al. 2015a), we concluded that the dominant component for most of our galaxies is a disc-like structure, although we note an interesting transition at z ∼ 1.4. Galaxies move from being irregular discs-dominated at high redshifts to discs+bulges at low redshift, which morphologically supports the scenario of SMGs being the progenitors of present-day massive elliptical galaxies. Similar conclusion were obtained using 2D axisymmetric Sérsic models (van der Wel et al. 2012), where the highest redshift galaxies have median Sérsic index of n ≈ 1 while the lowest redshift galaxies show a larger value of n ≈ 2.
Acknowledgements
We would like to thank the anonymous referee for a detailed report that has increased the clarity of the paper. This research has been supported by Mexican CONACyT research grant CB-2011-01-167291. JAZ acknowledges support from a CONACyT studentship, and the hospitality at the University of Edinburgh. JAZ also thank the University of Texas at Austin College of Natural Science for support. The James Clerk Maxwell Telescope has historically been operated by the Joint Astronomy Centre on behalf of the Science and Technology Facilities Council of the United Kingdom, the National Research Council of Canada, and the Netherlands Organization for Science Research. Additional funds for the construction of SCUBA-2 were provided by the Canada Foundation for Innovation. This work is based in part on observations made with the Spitzer Space Telescope, which is operated by the Jet Propulsion Laboratory, California Institute of Technology under a contract with NASA. This research has made use of data from HerMES project (http://hermes.sussex.ac.uk/). HerMES is a Herschel Key Programme utilizing Guaranteed Time from the SPIRE instrument team, ESAC scientists and a mission scientist.
Footnotes
REFERENCES
APPENDIX A: TABLES
Counterpart identifications and physical properties of galaxies in our sample. The columns give: (1) and (2) SCUBA-2 850 and 450 μm source names, respectively; (3) and (4) coordinates of the associated optical counterpart; (5) and (6) redshift and the source where it comes froma; (7) stellar mass; (8) IR luminosity (9) dust temperature, (10) UV star formation rate; and (11) UV spectral slope (from Skelton et al. 2014). The coordinates and flux densities at 450 and 850 μm can be found in Zavala et al. (2017).
| 850 μm-ID | 450 μm-ID | RAopt | DECopt | z | |$z_s^a$| | log(M*) | log(LFIR) | Td | SFR 1600Å | β |
|---|---|---|---|---|---|---|---|---|---|---|
| (hh:mm:ss.s) | (°:΄:″) | (M⊙) | (L⊙) | (K]) | (M⊙ yr− 1) | |||||
| 850.001 | 450.02 | 214.910 9 | 52.901 0 | |$2.240_{-0.003}^{+0.001}$| | 2 | 11.10 ± 0.07 | 12.53 ± 0.04 | 40.5 ± 0.9 | 5.5 | −0.43 |
| 850.002 | 450.03 | 214.914 4 | 52.876 0 | |$0.73_{-0.00}^{+0.00}$| | 1 | 10.87 ± 0.10 | 11.62 ± 0.03 | 27.2 ± 0.3 | 30 | 1.11 |
| 850.003 | 450.05 | 214.916 3 | 52.891 3 | |$3.04_{-0.06}^{+0.00}$| | 2 | 10.53 ± 0.04 | 12.76 ± 0.04 | 52.7 ± 1.5 | 21.5 | −0.88 |
| 850.004 | 450.25 | 214.946 7 | 52.910 1 | |$1.01_{-0.09}^{+0.08}$| | 3 | 8.68 ± 0.08 | – | – | 1.3 | −1.49 |
| 850.005 | 450.08 | 214.978 1 | 52.811 5 | |$2.98_{-0.28}^{+0.28}$| | 3 | 11.24 ± 0.17 | 12.87 ± 0.05 | 57.4 ± 1.5 | – | – |
| 850.006 | 450.13 | 214.974 1 | 52.906 0 | |$2.45_{-0.01}^{+0.12}$| | 2 | 11.16 ± 0.21 | 12.67 ± 0.04 | 57.1 ± 1.2 | 17 | −1.18 |
| 850.007 | 450.20 | 214.962 4 | 52.870 3 | |$3.02_{-0.12}^{+0.13}$| | 3 | 10.40 ± 0.09 | 12.20 ± 0.11 | 39.1 ± 4.2 | 12.3 | −2.11 |
| 850.008 | 450.15 | 215.014 4 | 52.901 3 | |$1.176_{-0.006}^{+0.004}$| | 2 | 11.43 ± 0.14 | 12.21 ± 0.04 | 46.3 ± 0.8 | 595 | −0.93 |
| 850.009 | 450.12 | 214.843 7 | 52.911 0 | |$1.45_{-0.03}^{+0.03}$| | 3 | 10.50 ± 0.18 | 12.07 ± 0.05 | 36.2 ± 0.8 | 68.5 | −0.72 |
| 850.010 | 450.14 | 214.919 7 | 52.839 7 | |$1.98_{-0.001}^{+0.29}$| | 2 | 11.01 ± 0.10 | 12.14 ± 0.07 | 37.6 ± 1.5 | 5.0 | 0.31 |
| 850.011 | 450.39 | 214.922 4 | 52.822 0 | |$3.26_{-0.10}^{+0.11}$| | 3 | 10.49 ± 0.42 | 12.16 ± 0.14 | 34.4 ± 3.8 | 124 | −2.39 |
| 850.012 | 450.06 | 214.946 2 | 52.876 1 | |$0.35_{-0.05}^{+0.05}$| | 3 | 9.80 ± 0.04 | 10.80 ± 0.04 | 24.7 ± 0.4 | 3.4 | −1.61 |
| 850.013 | 450.07 | – | – | |$0.95_{-0.00}^{+0.10}$| | 4 | – | – | – | – | – |
| 850.014 | 450.46 | 214.856 2 | 52.928 7 | |$1.69_{-0.22}^{+0.22}$| | 3 | 10.98 ± 0.16 | 11.95 ± 0.08 | 32.3 ± 1.4 | – | – |
| 850.015 | 450.09 | 214.938 1 | 52.874 3 | |$1.56_{-0.01}^{+0.00}$| | 2 | 10.71 ± 0.05 | 12.21 ± 0.06 | 49.2 ± 1.3 | 5.1 | 0.17 |
| 850.016 | 450.56 | 215.007 7 | 52.827 1 | |$1.84_{-0.05}^{+0.05}$| | 3 | 9.43 ± 0.23 | 12.23 ± 0.08 | 38.5 ± 2.3 | – | – |
| 850.017 | 450.11 | 214.898 8 | 52.852 6 | |$2.37_{-0.02}^{+0.00}$| | 2 | 11.26 ± 0.29 | 12.63 ± 0.07 | 63.0 ± 1.7 | 19.8 | −0.57 |
| 850.018 | 450.84 | 214.974 8 | 52.860 6 | |$3.70_{-0.16}^{+0.14}$| | 3 | 10.35 ± 0.40 | 12.62 ± 0.09 | 65.3 ± 3.9 | 0.1 | 0.10 |
| 850.019 | 450.41 | 214.971 0 | 52.957 4 | |$2.353_{-0.003}^{+0.003}$| | 2 | 10.67 ± 0.05 | 12.32 ± 0.09 | 42.0 ± 1.9 | 23.8 | −1.08 |
| 850.020 | 450.23 | 215.031 0 | 52.916 5 | |$1.087_{-0.004}^{+0.001}$| | 2 | 10.55 ± 0.08 | 11.65 ± 0.08 | 29.9 ± 0.9 | 2.9 | −0.13 |
| 850.021 | 450.17 | 215.054 2 | 52.926 0 | |$1.037_{-0.002}^{+0.001}$| | 2 | 10.58 ± 0.15 | 12.13 ± 0.03 | 51.4 ± 0.8 | 0.4 | 1.63 |
| 850.022 | 450.01 | 214.927 6 | 52.848 0 | |$1.408_{-0.000}^{+0.046}$| | 2 | 11.09 ± 0.08 | 12.50 ± 0.03 | 61.9 ± 0.9 | 5.3 | −1.85 |
| 850.023 | 450.65 | – | – | >3.95 | 4 | – | – | – | – | – |
| 850.024 | 450.04 | 214.923 2 | 52.882 2 | |$1.01_{-0.000}^{+0.000}$| | 1 | 11.10 ± 0.25 | 11.95 ± 0.05 | 42.7 ± 0.8 | 1.1 | −0.26 |
– continued
| 850 μm-ID | 450 μm-ID | RAopt | DECopt | z | zs | M* | LFIR | Td | SFR1600 | β |
|---|---|---|---|---|---|---|---|---|---|---|
| (hh:mm:ss.s) | (°:΄:″) | (M⊙) | (L⊙) | (K) | (M⊙ yr− 1) | |||||
| 850.025 | 450.29 | 214.850 6 | 52.866 4 | |$2.14_{-0.01}^{+0.03}$| | 2 | 11.32 ± 0.11 | 11.88 ± 0.13 | 31.7 ± 3.4 | 11.5 | 0.039 |
| 850.026 | 450.31 | – | – | |$2.25_{-0.30}^{+0.35}$| | 4 | – | – | – | – | – |
| 850.028 | 450.69 | 214.876 3 | 52.852 1 | |$2.84_{-0.17}^{+0.02}$| | 2 | 11.14 ± 0.40 | 12.37 ± 0.11 | 49.3 ± 3.0 | 3.8 | −2.14 |
| 850.029 | 450.21 | 214.835 4 | 52.843 8 | |$2.039_{-0.003}^{+0.001}$| | 2 | 10.58 ± 0.04 | 12.50 ± 0.06 | 60.9 ± 1.6 | 35.5 | −0.88 |
| 850.030 | 450.10 | 214.878 0 | 52.876 8 | |$1.52_{-0.06}^{+0.06}$| | 3 | 11.38 ± 0.05 | 11.87 ± 0.09 | 33.9 ± 2.0 | 9.7 | −0.19 |
| 850.031 | 450.49 | – | – | >3.65 | 4 | – | – | – | – | – |
| 850.032 | 450.63 | 214.932 8 | 52.833 0 | |$3.06_{-0.07}^{+0.02}$| | 2 | 11.15 ± 0.04 | 12.40 ± 0.11 | 51.5 ± 3.4 | 70 | −0.81 |
| 850.033 | 450.59 | – | – | |$3.10_{-0.75}^{+2.10}$| | 4 | – | – | – | – | – |
| 850.034 | 450.66 | – | – | >3.6 | 4 | – | – | – | – | – |
| 850.037 | 450.64 | 215.050 2 | 52.853 9 | |$1.30_{-0.07}^{+0.07}$| | 3 | 10.47 ± 0.05 | 11.85 ± 0.11 | 33.8 ± 2.0 | – | – |
| 850.038 | 450.27 | 214.864 7 | 52.899 1 | |$1.93_{-0.01}^{+0.09}$| | 2 | 10.92 ± 0.14 | 11.93 ± 0.12 | 36.4 ± 3.2 | 7.4 | 0.17 |
| 850.039 | 450.40 | 215.038 9 | 52.854 4 | |$2.35_{-0.10}^{+0.10}$| | 3 | 11.29 ± 0.24 | 12.43 ± 0.10 | 56.5 ± 2.5 | – | – |
| 850.040 | 450.22 | – | – | |$3.55_{-0.90}^{+2.00}$| | 4 | – | – | – | – | – |
| 850.041 | 450.16 | 214.992 8 | 52.850 8 | |$1.68_{-0.06}^{+0.06}$| | 3 | 10.56 ± 0.05 | 12.25 ± 0.07 | 54.4 ± 1.7 | 2.2 | −0.3 |
| 850.042 | 450.26 | 214.980 0 | 52.902 5 | |$2.03_{-0.02}^{+0.05}$| | 2 | 11.03 ± 0.14 | 11.91 ± 0.16 | 46.1 ± 3.6 | 2.0 | 1.63 |
| 850.043 | 450.73 | 214.950 1 | 52.938 3 | |$1.51_{-0.01}^{+0.01}$| | 2 | 10.92 ± 0.12 | 11.88 ± 0.11 | 40.1 ± 1.8 | 3.8 | 1.23 |
| 850.046 | 450.38 | – | – | |$1.60_{-0.25}^{+0.15}$| | 4 | – | – | – | – | – |
| 850.052 | 450.76 | 214.827 8 | 52.904 9 | |$1.70_{-0.03}^{+0.04}$| | 3 | 11.12 ± 0.05 | 11.98 ± 0.13 | 43.4 ± 2.2 | 3.6 | 0.07 |
| 850.059 | 450.24 | 214.855 5 | 52.848 9 | |$2.75_{-0.21}^{+0.24}$| | 3 | 10.76 ± 0.27 | 12.30 ± 0.16 | 53.2 ± 4.6 | 5.5 | 1.08 |
| 850.060 | 450.75 | 214.849 5 | 52.938 1 | |$0.94_{-0.06}^{+0.06}$| | 3 | 11.08 ± 0.13 | 11.56 ± 0.11 | 35.5 ± 1.4 | – | – |
| 850.065 | 450.18 | 214.875 5 | 52.866 5 | |$0.28_{-0.02}^{+0.02}$| | 3 | 10.56 ± 0.09 | 10.84 ± 0.05 | 30.7 ± 0.6 | 1.0 | 0.18 |
| 850.069 | 450.44 | 214.954 8 | 52.876 6 | |$0.51_{-0.00}^{+0.00}$| | 1 | 11.21 ± 0.06 | 11.03 ± 0.07 | 29.6 ± 0.8 | 6.1 | 1.39 |
| 850.070 | 450.34 | 214.968 4 | 52.925 1 | |$0.65_{-0.07}^{+0.01}$| | 2 | 9.740 ± 0.04 | 10.99 ± 0.14 | 26.8 ± 1.4 | 0.5 | 0.09 |
| 850.073 | 450.52 | 214.948 0 | 52.840 7 | |$1.358_{-0.003}^{+0.001}$| | 2 | 11.24 ± 0.17 | 11.67 ± 0.14 | 43.3 ± 2.5 | 0.1 | 5.04 |
| 850.078 | 450.82 | 215.037 7 | 52.870 8 | |$0.56_{-0.04}^{+0.03}$| | 3 | 10.65 ± 0.16 | 11.17 ± 0.08 | 39.4 ± 1.4 | 0.4 | 1.63 |
| 850.079 | 450.54 | 215.029 6 | 52.936 4 | |$0.47_{-0.03}^{+0.03}$| | 3 | 9.810 ± 0.09 | 10.41 ± 0.20 | 20.2 ± 1.5 | 17.3 | −1.03 |
| 850.085 | 450.33 | 215.015 8 | 52.856 9 | |$1.40_{-0.06}^{+0.07}$| | 3 | 10.34 ± 0.09 | 11.64 ± 0.19 | 39.3 ± 3.1 | – | – |
| 850.092 | 450.60 | 214.885 2 | 52.815 8 | |$1.92_{-0.31}^{+0.01}$| | 2 | 10.76 ± 0.23 | 11.77 ± 0.47 | 43.3 ± 8.2 | 3.2 | −0.06 |
| 850.095 | 450.37 | 214.996 5 | 52.814 1 | |$1.19_{-0.03}^{+0.03}$| | 3 | 10.70 ± 0.06 | 11.66 ± 0.14 | 49.2 ± 3.0 | – | – |
| 850.097 | 450.71 | 214.920 6 | 52.865 9 | |$1.01_{-0.000}^{+0.000}$| | 1 | 11.33 ± 0.32 | 10.95 ± 0.26 | 27.7 ± 3.3 | 2.3 | −1.52 |
| 850.102 | 450.83 | – | – | |$2.35_{-0.95}^{+3.10}$| | 4 | – | – | – | – | – |
| 850.104 | 450.45 | 214.986 6 | 52.802 1 | |$2.5_{-0.21}^{+0.22}$| | 3 | 10.83 ± 0.06 | 12.30 ± 0.24 | 76.1 ± 7.7 | – | – |
| 850.027 | – | – | – | >5.3 | 4 | – | – | – | – | – |
| 850.035 | – | – | – | |$2.05_{-0.30}^{+0.90}$| | 4 | – | – | – | – | – |
| 850.036 | – | – | – | >3.85 | 4 | – | – | – | – | – |
| 850.044 | – | 215.034 9 | 52.891 4 | |$3.17_{-0.12}^{+0.14}$| | 3 | 11.15 ± 0.13 | 12.40 ± 0.12 | 57.0 ± 4.5 | 1.0 | 0.05 |
| 850.047 | – | 214.859 8 | 52.860 7 | |$3.79_{-0.53}^{+0.56}$| | 3 | 10.97 ± 0.10 | 12.68 ± 0.12 | 75.9 ± 6.1 | 4.2 | −0.72 |
| 850.048 | – | 215.045 4 | 52.894 6 | |$1.89_{-0.01}^{+0.01}$| | 2 | 11.35 ± 0.06 | 11.74 ± 0.15 | 33.7 ± 3.1 | 4.3 | 0.15 |
| 850.049 | – | – | – | >4.75 | 4 | – | – | – | – | – |
| 850.050 | – | 214.996 8 | 52.940 8 | |$2.56_{-0.19}^{+0.41}$| | 3 | 10.51 ± 0.09 | 12.23 ± 0.13 | 52.6 ± 3.4 | 2.6 | 0.22 |
| 850.051 | – | 214.995 1 | 52.906 2 | |$2.78_{-0.06}^{+0.06}$| | 3 | 11.09 ± 0.19 | 12.25 ± 0.16 | 60.9 ± 5.8 | 19.4 | −1.72 |
| 850.053 | – | 214.993 5 | 52.864 4 | |$2.99_{-0.16}^{+0.15}$| | 3 | 10.68 ± 0.40 | 12.12 ± 0.16 | 52.7 ± 6.5 | 0.1 | 1.42 |
| 850.054 | – | 214.874 7 | 52.843 8 | |$1.47_{-0.03}^{+0.03}$| | 3 | 10.66 ± 0.08 | 11.73 ± 0.14 | 33.2 ± 2.0 | 19.6 | −0.58 |
| 850.055 | – | – | – | >4.5 | 4 | – | – | – | – | – |
| 850.056 | – | 215.027 3 | 52.894 6 | |$2.48_{-0.01}^{+0.000}$| | 2 | 10.64 ± 0.08 | 12.04 ± 0.27 | 53.0 ± 6.3 | 4.52 | −1.29 |
| 850.057 | – | 214.996 9 | 52.889 2 | |$3.69_{-0.04}^{+0.03}$| | 2 | 10.28 ± 0.06 | 12.22 ± 0.19 | 56.4 ± 8.8 | 101 | −1.85 |
| 850.058 | – | – | – | >5.0 | 4 | – | – | – | – | – |
| 850.061 | – | – | – | |$2.70_{-0.65}^{+1.40}$| | 4 | – | – | – | – | – |
| 850.062 | – | 215.061 8 | 52.901 0 | |$2.18_{-0.62}^{+0.01}$| | 2 | 10.88 ± 0.13 | 12.03 ± 0.16 | 45.6 ± 3.3 | 0.9 | 1.03 |
| 850.063 | – | – | – | |$1.90_{-0.35}^{+0.65}$| | 4 | – | – | – | – | – |
| 850.064 | – | – | – | >4.4 | 4 | – | – | – | – | – |
| 850.066 | – | – | – | >5.0 | 4 | – | – | – | – | – |
| 850.067 | – | 214.829 3 | 52.894 0 | |$2.95_{-0.10}^{+0.10}$| | 3 | 11.40 ± 0.68 | 12.41 ± 0.18 | 61.4 ± 7.0 | 5.7 | 1.22 |
| 850.068 | – | – | – | >4.15 | 4 | – | – | – | – | – |
| 850.071 | – | – | – | |$2.70_{-0.75}^{+2.00}$| | 4 | – | – | – | – | – |
| 850.072 | – | 215.015 9 | 52.939 5 | |$3.36_{-0.33}^{+0.36}$| | 3 | 10.61 ± 0.81 | 12.46 ± 0.19 | 71.4 ± 7.5 | 5.7 | 0.75 |
| 850.074 | – | – | – | |$3.70_{-1.95}^{+2.05}$| | 4 | – | – | – | – | – |
| 850.075 | – | 214.834 0 | 52.870 1 | |$2.38_{-0.10}^{+0.10}$| | 3 | 10.96 ± 0.18 | 12.17 ± 0.18 | 57.6 ± 4.5 | 5.3 | 0.34 |
| 850.077 | – | 215.029 7 | 52.867 9 | |$3.48_{-0.52}^{+0.52}$| | 3 | 11.08 ± 0.10 | 12.52 ± 0.21 | 80.2 ± 8.4 | – | – |
| 850.080 | – | 214.923 1 | 52.934 7 | |$2.92_{-0.05}^{+0.04}$| | 3 | 10.38 ± 0.07 | 12.23 ± 0.23 | 62.7 ± 6.7 | 44.9 | −1.86 |
| 850.081 | – | 214.954 6 | 52.899 1 | |$1.73_{-0.06}^{+0.14}$| | 2 | 10.32 ± 0.16 | 11.36 ± 0.25 | 32.9 ± 5.0 | 9.6 | −0.91 |
| 850.082 | – | 215.055 7 | 52.882 0 | |$2.81_{-0.09}^{+0.09}$| | 3 | 10.77 ± 0.06 | 12.34 ± 0.22 | 73.6 ± 7.7 | – | – |
| 850.083 | – | – | – | |$2.55_{-0.85}^{+2.75}$| | 4 | – | – | – | – | – |
| - | 450.19 | 214.916 9 | 52.827 4 | |$1.228_{-0.002}^{+0.000}$| | 2 | 11.23 ± 0.16 | 11.89 ± 0.07 | 43.8 ± 1.4 | 8.4 | 1.29 |
| - | 450.28 | 214.945 9 | 52.894 2 | |$1.210_{-0.003}^{+0.005}$| | 2 | 10.92 ± 0.06 | 11.51 ± 0.24 | 35.9 ± 3.2 | 5.4 | −1.89 |
| - | 450.35 | 214.902 4 | 52.863 7 | |$1.061_{-0.000}^{+0.000}$| | 1 | 11.25 ± 0.05 | 11.35 ± 0.16 | 39.7 ± 2.6 | 5.2 | −1.85 |
| - | 450.36 | 214.936 1 | 52.855 9 | |$1.455_{-0.005}^{+0.008}$| | 2 | 10.63 ± 0.10 | 11.56 ± 0.19 | 40.8 ± 3.8 | 1.5 | −0.19 |
| - | 450.42 | 214.905 3 | 52.851 0 | |$0.670_{-0.000}^{+0.000}$| | 1 | 11.18 ± 0.09 | 11.04 ± 0.12 | 34.6 ± 1.6 | 24.8 | −2.03 |
| - | 450.43 | 215.020 4 | 52.929 8 | |$2.59_{-0.18}^{+0.21}$| | 3 | 10.31 ± 0.13 | 11.52 ± 0.55 | 35.7 ± 3.4 | 3.0 | −1.29 |
| - | 450.47 | – | – | |$1.45_{-1.35}^{+2.60}$| | 4 | – | – | – | – | – |
| - | 450.48 | 214.908 7 | 52.927 9 | |$1.349_{-0.002}^{+0.002}$| | 2 | 10.52 ± 0.06 | 11.53 ± 0.18 | 43.5 ± 3.1 | 11.5 | −0.71 |
a(1) Spectroscopic redshift; (2) HST grism redshift; (3) optical photometric redshift; (4) FIR photometric redshift (see Section 4.1).
APPENDIX B: POSTAGE STAMPS
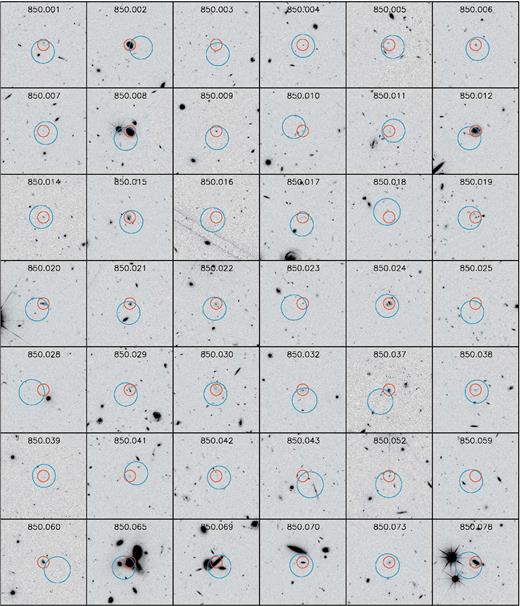
30 arcsec× 30 arcsec postage stamps in the HST/f814w band for our SMGs. The blue circle represents the variable search radius for counterparts in the radio and IR wavelengths (centred at the SCUBA-2 position), and the red circle represents the final optical associated galaxy. The ID of each source is in the top of each panel.
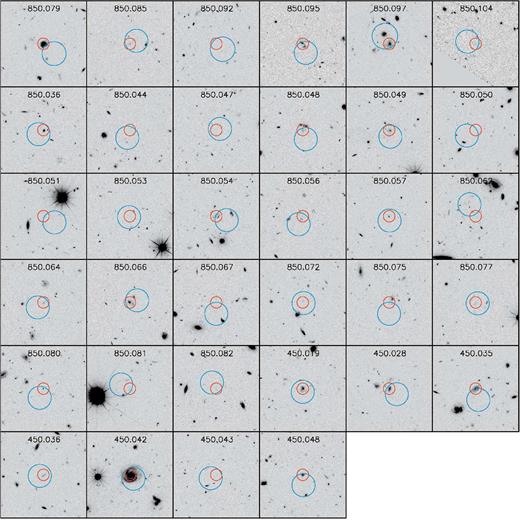
– continued
