


Abstract
Using a state-of-the-art cosmological simulation of merging proto-galaxies at high redshift from the FIRE project, with explicit treatments of star formation and stellar feedback in the interstellar medium, we investigate the formation of star clusters and examine one of the formation hypotheses of present-day metal-poor globular clusters. We find that frequent mergers in high-redshift proto-galaxies could provide a fertile environment to produce long-lasting bound star clusters. The violent merger event disturbs the gravitational potential and pushes a large gas mass of ≳ 105–6 M⊙ collectively to high density, at which point it rapidly turns into stars before stellar feedback can stop star formation. The high dynamic range of the reported simulation is critical in realizing such dense star-forming clouds with a small dynamical time-scale, tff ≲ 3 Myr, shorter than most stellar feedback time-scales. Our simulation then allows us to trace how clusters could become virialized and tightly bound to survive for up to ∼420 Myr till the end of the simulation. Because the cluster's tightly bound core was formed in one short burst, and the nearby older stars originally grouped with the cluster tend to be preferentially removed, at the end of the simulation the cluster has a small age spread.
1 INTRODUCTION
By the interaction of gravity and pressure, gas becomes unstable and collapses to turn into stars. Observationally, we know that most stars form in ‘clustered fashion’, with some stars forming en masse in dense molecular clouds of ≳ 104 M⊙ and others in relatively loose associations (for reviews, see Portegies Zwart, McMillan & Gieles 2010 and Bressert et al. 2010). The fraction of stars that form in bound clusters, often referred to as Γ, is affected by the host galaxy environment, with galaxies with higher star formation activity such as starbursts having higher Γs than local spiral and dwarf galaxies (e.g. Kruijssen 2012; Adamo & Bastian 2015). Simulations of an isolated star clusters in an idealized setup have a long history and can now resolve the formation of individual stars (for recent reviews, see Kruijssen 2013 and Dale 2015). However, they cannot be used to study the formation of a dense environment in a galactic context, in which those star clusters spawn. It is also difficult to utilize this type of calculations in studying how bound versus unbound star clusters form, and how they evolve and survive in a galactic environment. A high-resolution, galaxy-wide simulation is required to address these questions.
However, star clusters have rarely been simulated in a galactic context, with numerical accuracy high enough to resolve their dynamical evolution. Note that in most previous galaxy simulations the mass of each resolution element approximately equates to that of a star cluster. Only after we reach a mass resolution of ≲ 103 M⊙ can we begin to reliably resolve the kinematics amongst the member star particles of a massive ∼105 − 6 M⊙ cluster in a galaxy-scale simulation.1,2 It is also required that realistic physics models be in place which describe star formation and stellar feedback at such high resolution. Most previous galaxy-scale simulations lack such sophisticated physics models.
Recently, however, this is becoming increasingly possible with modern cosmological simulations. In this paper, we use simulations from the FIRE project (Feedback In Realistic Environments; Hopkins et al. 2014)3 to study how star clusters form and evolve in high-redshift merging proto-galaxies. This has been proposed (Whitmore & Schweizer 1995; Schweizer et al. 1996; Schweizer 2006) as a formation channel for the present-day old, metal-poor ‘blue’ globular clusters (GCs) which tend to be distributed throughout the galactic halo (as opposed to metal-rich ‘red’ GCs which are found mostly in galactic bulges). For reviews of their properties and various hypotheses of their origin, see Peebles & Dicke (1968), Harris & Racine (1979), Fall & Rees (1985), Harris (2001), and Brodie & Strader (2006). Our investigation is complementary to other recent studies which have explored alternative GC formation scenarios: for example, in binary merging galaxies at low redshift (e.g. Li, Mac Low & Klessen 2004; Bournaud, Duc & Emsellem 2008; Kruijssen et al. 2011, 2012; Renaud, Bournaud & Duc 2015; Maji et al. 2017), or in primordial mini-haloes at redshift z ≳ 10 (e.g. Kimm et al. 2016; Ricotti, Parry & Gnedin 2016).
Specifically, we carry out an investigation using a cosmological ‘zoom-in’ simulation from Ma et al. (2015) at z ∼ 6, with ∼ pc-scale resolution, run with the FIRE physics that includes star formation only in dense, self-gravitating gas and stellar feedback from supernovae (SNe), stellar winds, photoionization and photoelectric heating, and radiation pressure. Our setup allows us to explicitly follow the formation and evolution of at least the most massive star clusters. We show that, in the simulation, most stars form in unbound associations but some form in resolved, bound clusters. Frequent mergers in high-redshift proto-galaxies provide a fertile environment to produce the latter population by pushing large gas masses (≳ 105 − 6 M⊙) collectively to high density, at which point it turns into stars before stellar feedback can disrupt the clouds. We explore subsequent dynamical evolution, virialization, and the age and metallicity spreads of the resulting clusters.
The remainder of this article is organized as follows. In Section 2 we detail the simulation code and methods. Section 3 presents results of the simulation focusing on the formation and evolution of bound clusters. Finally in Section 4 we summarize our findings and conclusions.
2 METHODOLOGY
The simulation studied in this work is one of a suite of high-resolution cosmological simulations at high redshift from the FIRE project, and is presented and described in detail in Ma et al. (2015, z5m10h run therein). We briefly review its important features for completeness. The simulation was run using the Gizmo code (Hopkins 2015)4 which solves gravity using a tree-particle mesh (TreePM) method with fully adaptive gravitational softenings (scaled to the inter-particle separation), and solves the hydrodynamics using the Lagrangian ‘pressure-energy’ (P-sph) formulation of smoothed particle hydrodynamics with various improvements to alleviate known issues with fluid mixing and shock-capturing in older SPH formulations (see Hopkins 2013; Hopkins et al. 2014). The simulation follows a high-resolution Lagrangian region around a ‘target halo’ of virial mass ∼1010 M⊙ (stellar mass of the ‘target galaxy’ ∼4.7 × 10⁷ M⊙) at z ∼ 6, with fixed mass resolution 800 h−1M⊙ and minimum force resolution 1.4 h−1 pc (proper) for gas (and fixed to 1.4 h−1 pc for star particles). This resolution is high enough to resolve the dynamics between member particles of a relatively massive star cluster studied in this paper (but see also footnote 1). At z = 5 of the original Ma et al. (2015) simulation, we identify a group of long-lasting bound clusters, one of which we hereafter call the cluster ‘A’ (see Figs 1–3). We specifically re-ran the interval from z = 7 to z = 5 of the original simulation to generate more snapshots at finer intervals during ∼80 Myr before and after the cluster ‘A’ formed, in order to study when, where, and how the cluster forms.5
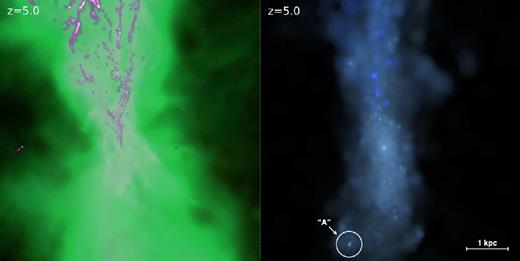
Snapshots of the target galaxy at z = 5, and the star cluster of interest (cluster ‘A’) studied here. Left: gas surface density in a 6 kpc box (proper) centred on the target galaxy, where the brightness indicates projected gas density in a logarithmic scale and the colours encode different temperature ranges (e.g. magenta/white shows T < 103 K cold molecular gas, green 104 < T < 105 K warm ionized gas). Right: mock ugr-composite of stars in the same 6 kpc box. Most stars are distributed in diffuse form, but several dense clusters are visually obvious within the galaxy, including the cluster ‘A’ (white circle).
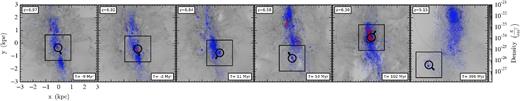
Distribution of star particles in a 6 kpc box (proper), evolving in time from z = 6.97 (left) to z = 5.15 (right). Young star particles that are less than 5 Myr old are coloured red, while the rest of the star particles are coloured blue. The grey background features the density-weighted projection of gas density. Marked with a black circle of radius 300 pc in each panel is the star cluster ‘A’ (or its ‘gas progenitor’ in the first and second panels) with an arrow indicating the direction of its movement. The 2 kpc × 2 kpc square around the cluster corresponds to the region shown in Fig. 3. Shown in the bottom right in each panel is the timestamp where 0 Myr corresponds to the moment the cluster ‘A’ forms. Cluster ‘A’ forms in a proto-galaxy undergoing multiple rapid mergers.
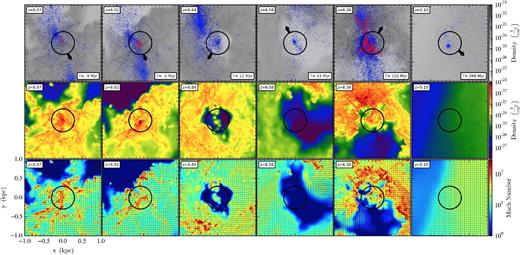
Top: same as Fig. 2 but in a 2 kpc box (proper) always centred on the cluster ‘A’ (or its gas progenitor in the first and second columns from the left), evolving in time from z = 6.97 (left) to z = 5.15 (right). This is a zoomed-in version of Fig. 2 (the square region) in the same style. A black circle of radius 300 pc is centred on the cluster member particles. Middle: gas surface density in the same region. Bottom: density-weighted projection of gas Mach number. An extremely dense cloud forms in a Mach ∼ 100 convergent flow (second column), then rapidly turns into stars within a couple of Myr. The remaining gas is expelled over the next ∼5 − 10 Myr, leaving behind a dense, bound star cluster which persists as long as we run the simulation (∼420 Myr).
Baryonic physics is treated using the FIRE-1 model, described in detail in Hopkins et al. (2014). Briefly, radiative heating and cooling in 10 − 1010 K take into account molecular, atomic, ionized, and metal-line processes (with 11 independently tracked species), and include photoheating by local sources and redshift-dependent ultraviolet background (Faucher-Giguère et al. 2009), and self-shielding. Star formation occurs via spawning of star particles only from gas which meets a series of criteria: it must be locally self-gravitating and Jeans-unstable according to a sink particle criterion (including both thermal and turbulent support; see Hopkins, Narayanan & Murray 2013), molecular (following Krumholz & Gnedin 2011), and denser than a star formation threshold nth = 500 cm−3.6 A new star particle inherits the mass, metallicity, gravitational softening length, and particle ID number from its progenitor gas particle. Once a star particle forms, the simulation explicitly tracks feedback from (1) local and long-range radiation pressure (including single-scattering and multiple-scattering of re-radiated infrared photons), (2) energy, momentum, mass and metal injection from SNe (Types Ia and II) and stellar mass-loss (OB and AGB-star winds), and (3) photoionization and photoelectric heating. The rates for each channel are calculated as a function of the stars’ age and metallicity using a stellar population synthesis model Starburst99 (Leitherer et al. 1999) assuming the Kroupa (2002) initial mass function (IMF).
For more details on how each item above is implemented, we refer the interested readers to section 2 of Hopkins, Quataert & Murray (2012), and section 3 and appendix A of Hopkins et al. (2014). A series of FIRE simulations using cosmological and isolated initial conditions have reported reasonable star formation histories, stellar mass--halo mass relation, Kennicutt–Schmidt relation (Hopkins et al. 2014), mass--metallicity relation (Ma et al. 2016), multiphase interstellar medium (ISM; Hopkins, Quataert & Murray 2011), galactic outflows (Muratov et al. 2015), dense neutral hydrogen content of galactic haloes (Faucher-Giguère et al. 2015, 2016), galaxy structures and metallicity gradients (Ma et al. 2017), among others. These studies validate the ‘realistic’ baryonic physics we adopt in the present study.
3 RESULTS
We start by giving an overview of the simulation result and the two distinct populations of star clusters. Then we discuss the formation, evolution, and composition of long-lived bound star clusters.
3.1 Overview of simulation results: from the host galaxy to the target cluster
Fig. 1 shows the z = 5 snapshot of the target galaxy and the star cluster of interest studied in the present paper (cluster ‘A’ defined in Section 2). Images are rendered as in the way described in Hopkins et al. (2005, 2014). In the left panel, molecular cloud complexes in cold filaments in the upper side of the panel indicate fresh flows of dense gas that has not turned into stars yet. The right panel shows multiple star clusters of masses ranging from 105 to 107 M⊙ scattered around the galaxy. Each of these clusters is dynamically resolved with 102 − 103 star particles within 10 − 102 pc half-mass radii (Fig. 4). Among them, marked with a white circle of radius 300 pc is cluster ‘A’ that forms at z = 6.92 and survives ∼420 Myr afterwards.
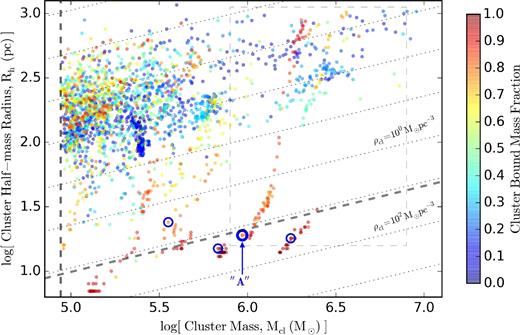
Cluster mass, Mcl, versus half-mass radius, Rh for all star clusters identified by Rockstar in all 76 snapshots finely spaced between z = 7 and z = 5, which survived at least one output interval (e.g. Δ tout ∼ 1.6 Myr at 6.5 < z < 7; see footnote 5). Each data point is coloured by the fraction of member particle masses that are bound to the cluster centre, fbd. The cluster ‘A’ from Figs 1–3 is marked with a thick blue circle at z = 5. Three other thin blue circles indicate the other long-lasting bound clusters identified at z = 5. For references, the thin dotted diagonal lines denote the slope of constant stellar density, while the thick dashed diagonal line marks the star formation threshold density, 500 cm−3 or 12 M⊙ pc−3. The thick dashed vertical line represents the threshold mass to be identified as a star cluster, 8.74 × 10⁴ M⊙. Most of the objects are young, loose associations with stellar densities ∼10−2 M⊙ pc−3 and little bound mass (upper left corner). The few low-density associations with high bound mass fraction represent systems with a bound core and a loosely bound ‘envelope’ (upper right corner). They rapidly evolve to become more dense clusters (blue circles; see Fig. 7 for more information that zooms in on the grey dashed rectangular region).
Fig. 2 reveals the movement of cluster ‘A’ throughout its host galaxy.7,8 The second column captures the moment right before most star particles in the cluster ‘A’ form (red, young star particles inside the black circle) during a major proto-galaxy merger. After the cluster forms, it moves to an orbit with a relatively large radius, piercing through the galactic nucleus at z = 6.30 (fifth column), but later reaching far out into the extended galactic halo at z = 5.15 (sixth column).
To closely inspect the formation site of the cluster ’A’, in Fig. 3 we zoom in on the 2 kpc × 2 kpc region around the cluster ’A’. Before the cluster ’A’ forms, we see a dense gas clump forming in a galactic merger event (first and second columns; Section 3.4). This efficiently forms new star particles in a short time, which then violently disperse the gas via stellar feedback, but only after a large number of star particles have formed (third and fourth columns). Later, we see the cluster pass through the centre of the host galaxy, triggering a mass loss of the cluster (fifth column; Section 3.3).
3.2 Two populations of star clusters
We now examine the population of star clusters formed in our simulation between z = 7 and z = 5. To identify star clusters in the simulated galaxy, we utilize the six-dimensional phase-space halo finder Rockstar (Behroozi, Wechsler & Wu 2013)9 modified to run on star particles instead of dark matter particles.10 To ensure that the identified star clusters are dynamically resolved and are not numerical artefacts, we only consider clusters with more than 100 member particles (or >8.74 × 10⁴ M⊙). We then directly extract the stellar mass, Mcl, and spherical half-mass radius, Rh, of each cluster.11
In Fig. 4 we plot the Mcl–Rh relation of all star clusters identified in 76 snapshots finely spaced between z = 7 and z = 5. We plot only those that survived at least one output interval (e.g. Δ tout ∼ 1.6 Myr at 6.5 < z < 7; see footnote 5). In other words, we plot clusters that were found in two or more snapshots to eliminate spurious transient associations. Each data point is then coloured by the fraction of member particle masses that are bound to the cluster, i.e. bound mass fraction fbd derived from the standard Rockstar output (but see footnote 11). Additionally, four star clusters of mass above 105.5 M⊙ that survived more than 300 Myr are annotated with blue circles. These long-lasting, bound star clusters are identified at z = 5 by considering the mass Mcl, bound mass fraction fbd, and lineage information (see Section 3.3). These clusters are grouped with few gas particles and almost no dark matter particles, thus not associated with dark matter over-densities or galactic subhaloes. Among them, the cluster ’A’, studied extensively here, is marked with a thicker blue circle at z = 5. The force resolution of the simulation is well below the y-axis range (see Section 2), indicating that clusters shown here are not affected by force softening, although they may of course be affected by the finite particle number (i.e. mass resolution).
In this figure various features are prominent. First, a large fraction of the clusters congregate around Mcl ∼ 105.0 − 5.5 M⊙ and Rh ∼ 101.5 − 2.5 pc, giving mean stellar densities, defined as |$\rho _{\rm cl} \equiv 3M_{\rm cl}/(8\pi R_{\rm h}^3)$|, of ∼10−2 M⊙ pc−3. The majority of these clusters are loose ’unbound associations’ with low fbd. These associations, according to our lineage tree analysis (Section 3.3), often dissolve into an extended stellar disc or bulge in 10–30 Myr by rapidly losing their unbound member particles. This behaviour is expected since most of the unbound associations inherit the properties of normal molecular clouds that are only marginally gravitationally bound after turning just a few per cent of the cloud mass into stars. Indeed, their observational counterparts such as OB associations tend to drift apart in a ≳ 10 Myr time-scale. Readers should note that the density of a cluster/association (or its gas progenitor) can be much less than the star formation threshold (500 cm−3 or 12 M⊙ pc−3), because stars form in a small self-gravitating sub-clumps above the threshold density, distributed widely over a lower-mean-density giant molecular cloud (GMC) complex.
A much smaller fraction of the stellar mass is represented by self-gravitating bound clusters that often survive for a longer time. For example, the long-lasting bound clusters identified at z = 5 (blue circles in Fig. 4 and their ancestors) have radii as small as Rh ∼ 10 pc with mean stellar densities as large as ∼102 M⊙ pc−3. Their mean densities are often comparable to or larger than the star formation threshold, and their typical bound mass fractions are higher than 80 per cent (red face colour). In addition, they tend to maintain their locations on the Mcl − Rh plane for ≳ 100 Myr (as indicated by groups of red points crowded around the four blue circles). This second group of star clusters could be categorized as ’bound clusters’, which could potentially become candidates for present-day metal-poor ’blue’ GCs. We note that these numerically formed clusters are similar in their sizes and masses to the objects observed at z ≳ 6 by Vanzella et al. (2017) and conjectured as proto-GCs.
To illustrate the two populations of star clusters, Fig. 5 shows the normalized probability distribution function (PDF) of mean cluster stellar densities. We see a clear bimodal distribution with the majority of mostly unbound associations forming one peak at ∼10−2 M⊙ pc−3, while bound clusters forming another peak at ∼30 M⊙ pc−3. The corresponding surface density for this second bimodal group is ∼103 M⊙ pc−2, as can be seen in the surface density PDF of Fig. 6. It is about an order-of-magnitude larger than that of a typical GMC (∼102 M⊙ pc−2), implying a rather unusual dynamical process by which these bound clusters may have formed and evolved. The bound cluster's surface density also corresponds to the surface density scale at which star formation over Myr time-scales may become highly efficient despite strong stellar feedback (see Section 3.4 and Grudić et al. 2016). In fact, most of these dense objects can be traced through multiple snapshots and are ancestors of just a few bound clusters (see Section 3.3). Note that the second bimodal peak around ∼30 M⊙ pc−3 in Fig. 5 corresponds well with the maximum gas density when the cluster ’A’ formed (red dotted line at z = 6.92). This high gas density was realized when two proto-galaxies merge as can be seen in the second column of Fig. 3, but typically not before or after the merger (black dotted line in Fig. 5 at z = 6.99; representative gas density PDF for a ’normal’ galaxy). We will come back to this discussion in Section 3.4.
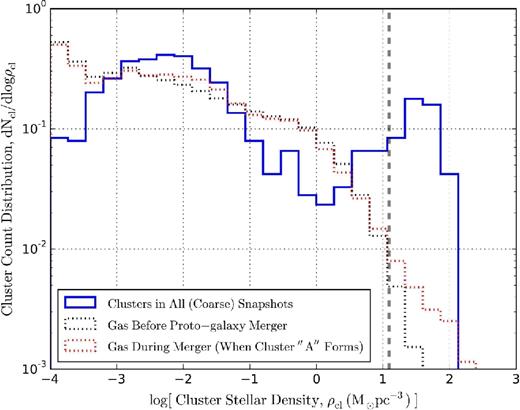
Normalized PDF of mean stellar densities, defined as |$\rho _{\rm cl} \equiv 3M_{\rm cl}/(8\pi R_{\rm h}^3)$| (blue solid line). We display star clusters identified in 31 snapshots coarsely spaced between z = 7 and z = 5 (e.g. Δ tout ∼ 17 Myr for 6 < z < 7; sub-sample of clusters shown in Fig. 4 to keep a roughly constant Δ tout between snapshots; see footnote 5). Also shown are the PDFs of gas densities at z = 6.99 (black dotted line) and z = 6.92 (when the cluster ’A’ formed; red dotted line). For a reference, the thick dashed vertical line marks the star formation threshold density. A bimodal distribution is notable with the majority of mostly unbound associations forming one peak at ∼10−2 M⊙ pc−3, and bound clusters forming another peak at ∼30 M⊙ pc−3. The latter may be a lower limit due to our finite star formation threshold density, but the bimodality is robust.
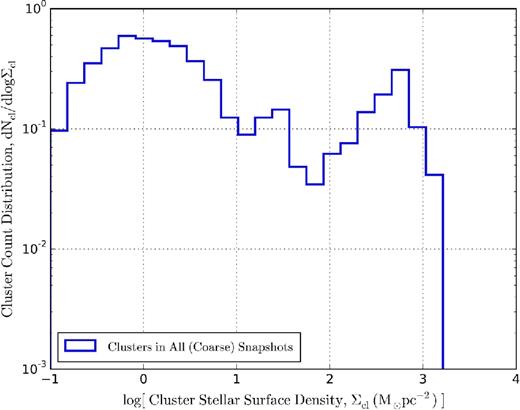
As Fig. 5, but with mean stellar surface densities, defined as |$\Sigma _{\rm cl} \equiv M_{\rm cl}/(2\pi R_{\rm h}^2)$|. Interestingly, the broader peak at ∼1 M⊙ pc−2 corresponds to what one would obtain by converting a few per cent of typical Milky Way GMCs into stars (e.g. Evans et al. 2009), while the other peak at ∼103 M⊙ pc−2 corresponds to the surface density identified by Grudić et al. (2016) as that where feedback begins to become inefficient, allowing an order of unity fraction of gas to turn into stars (Section 3.4).
Figs 5 and 6 indicate that these bound clusters are in a separate group of a distinctive evolutionary process, not simply a tail of a single, unimodal distribution. Of course, because we adopted a finite threshold density for star formation, a patch of gas could have collapsed further – if we had infinite resolution – before forming stars. So the densities of the bound clusters seen here are probably lower limits. This only strengthens our inference of a bimodal population.
3.3 Evolution of a long-lasting bound star cluster
3.3.1 Method and overview
We now focus on how the long-lasting bound star clusters evolve in time. Before moving to discuss the simulation result, a remark on numerical resolution and the ’intra-cluster’ dynamics would be timely. The long-lasting bound clusters such as cluster ’A’ are resolved in mass (with ≳ 103 particles), and the force resolution is also well below their half-mass radii. Therefore, the kinematics amongst the cluster member star particles is numerically resolved. However, this does not mean that our simulation reproduces the phase-space distribution of the actual stars in observed clusters. Partly due to the mass resolution – each particle represents a stellar population of ∼103 M⊙ – we simply cannot resolve a variety of internal, ’intra-cluster’ evolution processes such as stellar two-body relaxation, mass segregation, evaporation, stellar mass loss, or binary interactions (for a comprehensive review, see e.g. Benacquista 2006; Portegies Zwart et al. 2010). Thus, it would be prudent to assume that the reported simulation at best marginally resolves the detailed intra-cluster evolution. With this caveat in mind, in all subsequent analyses, we focus only on globally averaged characteristics of a star cluster, but not on e.g. radial profiles of stellar density or metallicity inside a cluster, which are more severely affected by the intra-cluster evolution.12
In order to trace star clusters evolving in time, we combine the descendant information in standard Rockstar outputs, and supplementary information such as member particle IDs of star clusters selected at z = 5. The selected cluster's ’lineage tree’ – or the main branch of a merger tree – is built by linking the ’main ancestors’ determined by Rockstar. (When a cluster P bequeaths the most particles to a cluster D in the next snapshot, P is defined as D's parent, D as P's descendant. D may have many parents, the most massive of which is defined as the main ancestor.)13 We then draw the lineage tree of the cluster ’A’ in Fig. 7. The ancestor of the cluster ’A’ starts out in the upper right corner, then loses its mass at early times to dramatically evolve to a compact – i.e. smaller Rh and higher mean density – and tightly bound – i.e. higher bound mass fraction – cluster at z = 5. The following section describes this evolution in detail.
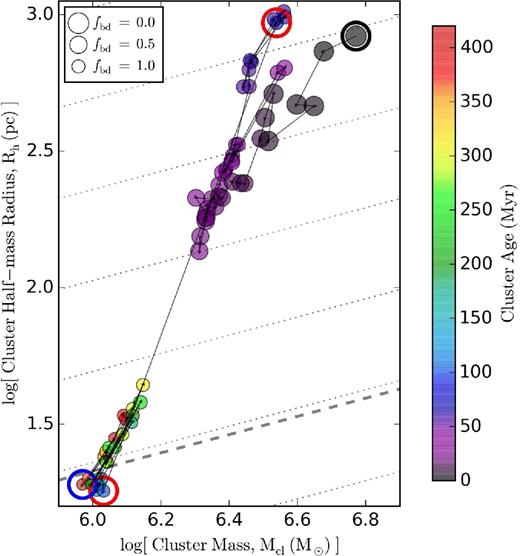
As Fig. 4, but focusing on the evolution of the cluster ’A’ in a sub-region (grey dashed rectangular region in Fig. 4). The thin black line shows the lineage tree of the cluster ’A’ determined by Rockstar. Each data point is coloured by the cluster's age – different from Fig. 4 – with its size inversely proportional to its bound mass fraction fbd. The ancestor of the cluster ’A’ begins in the upper right corner of this figure at z = 6.92 (black circle), then slowly moves towards the lower left corner to become compact and tightly bound at z = 5 (blue circle). Initially, a large fraction of the ’association’ mass is due to nearby pre-existing stars and a low-density ’envelope’ of stars, giving an apparently large cluster size. They are stripped in a mass-loss event between z = 6.4 and z = 6.3 (two red circles), leaving a dense, tightly bound ’cluster’ that survives for ∼420 Myr until the simulation ends.
3.3.2 Three phases of cluster evolution
For a more quantitative evaluation of the simulation results, evolution of the cluster's various characteristics is shown in thick black solid lines in Figs 8–11. For example, Fig. 8 depicts the cluster's mass Mcl, bound mass fraction fbd, and virial ratio Ekin/|Epot|. As in other figures, 0 Myr corresponds to the moment the cluster ’A’ forms. The grey shaded region represents the ∼80 Myr period during which the simulation produced outputs at finer intervals (Section 2).
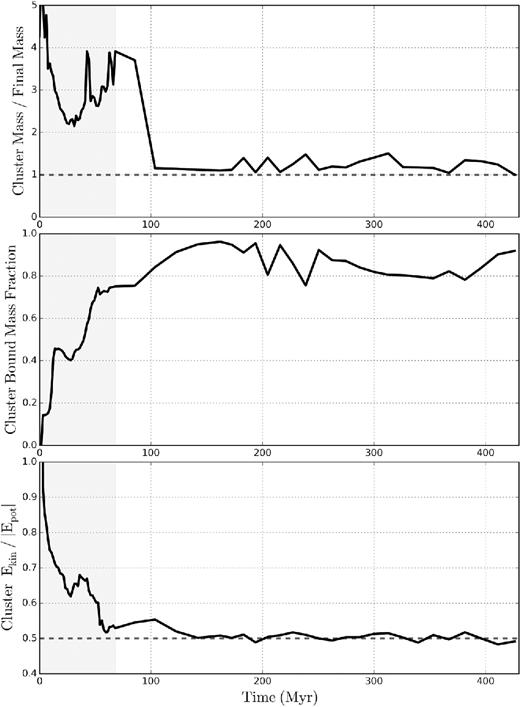
Evolution of the cluster ’A’. Top: cluster mass, Mcl, in units of its final mass at z = 5 (corresponding to the x-axis of Fig. 7). The >70 per cent decrease in mass at ∼100 Myr refers to the period when the cluster pierces through the host galaxy's gravitational centre between z = 6.4 and z = 6.3 (see fifth columns in Figs 2 and 3 and Figs 7 and 10). Middle: cluster bound mass fraction, fbd (corresponding to the colour-code of Fig. 4, or to the inverse of the data point size of Fig. 7). The cluster in general becomes more tightly bound gradually in time. Bottom: cluster virial ratio, Ekin/|Epot|. The cluster asymptotes to a dashed horizontal line denoting a virial equilibrium. 0 Myr refers to the moment the cluster ’A’ forms. The grey shaded region shows the ∼80 Myr period during which the simulation produced outputs at finer intervals (Section 2).
From Figs 7 to 11, three phases of evolution are noticeable:
(1) Phase 1: formation and initial evolution of the cluster. In the first ∼100 Myr of its life (blue to first red circle in Fig. 7), the cluster's mass and radius frequently change (Figs 8 and 9), partly because of its proximity to its host galaxy and neighbouring clusters. In other words, according to our lineage tree analysis in the first ∼100 Myr, the cluster's mass and size change because it loses its loosely bound member particles, or it captures neighbouring particles as it passes by them (but negligible in situ star formation; see Section 3.5). The cluster gradually becomes tightly bound with fbd increasing from <10 per cent to ∼80 per cent, while its virial ratio asymptotes to a virial equilibrium (Fig. 8).14 However, as the bottom panel of Fig. 9 demonstrates, the cluster's core is already very dense at its formation. The evolution in mass, size, and fbd is primarily due to changes among loosely bound old stars initially associated with the newly formed cluster.15
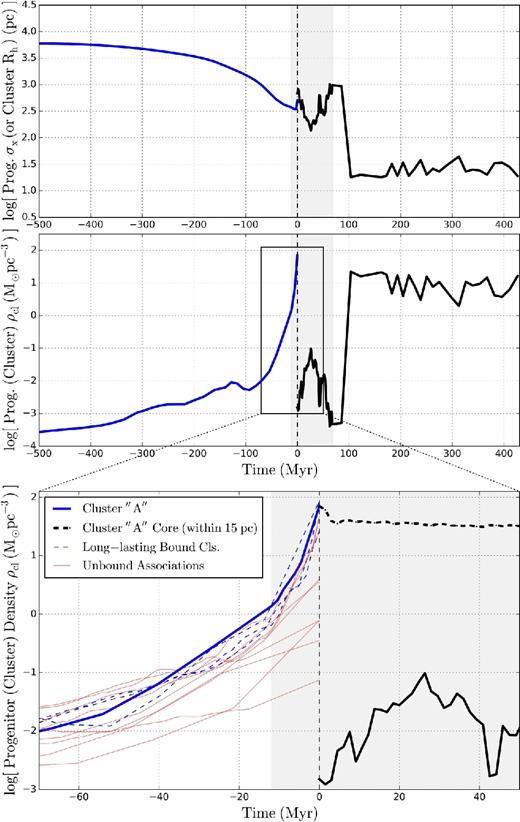
Evolution of the cluster ’A’ and its gas progenitor. Top: the gas progenitor member particles’ dispersion in position, σ (blue), or the cluster's half-mass radius, Rh (black; corresponding to the y-axis of Fig. 7). A vertical dot–dashed line in each panel marks 0 Myr, the moment the cluster forms. The grey shaded region shows the period in which the simulation produced outputs at finer intervals. Middle: the gas progenitor member particles’ mean density, |$\overline{\rho }_{\rm gas}$| (blue), or the cluster's mean stellar density, |$\rho _{\rm cl} \equiv 3M_{\rm cl}/(8\pi R_{\rm h}^3)$| (black). Triggered by a galaxy merger, the gas progenitor's density increases in a short time, causing the gas cloud to collapse and turn a significant portion of its mass, ≳ 105 − 6 M⊙, simultaneously into stars. Bottom: a zoom-in region around the cluster formation time. The discontinuity in densities between the blue and black solid lines at 0 Myr is because the newly formed star cluster grouped by Rockstar includes not only the just born star particles but also nearby pre-existing stars and the low-density ’envelope’ of stars forming from nearby less dense gas. But the gas progenitor's density smoothly transitions to the cluster's core density within 15 pc from its centre (thick black dashed line) that contains almost exclusively newly born star particles. In addition to the gas progenitor of the cluster ’A’ (thick blue line), progenitors of three other long-lasting bound clusters identified at z = 5 are shown (blue dashed lines). Also shown are the progenitors of nine unbound associations at z = 5 which are more massive than 1.5 × 10⁵ M⊙ at z = 5, but did not become long-lasting bound clusters (thin red lines). All the bound clusters follow a similar evolutionary path, with a large mass collectively reaching high densities in a short time-scale (∼10 Myr). Unbound associations typically form from fragmenting sub-regions within lower-mean-density GMC complexes.
(2) Phase 2: mass loss of the cluster. At ∼100 Myr after the cluster's formation (between z = 6.4 and z = 6.3; two red circles in Fig. 7), the cluster's mass decreases by >70 per cent (Fig. 8). This event refers to the period when the cluster pierces through the host galaxy's gravitational centre (fifth columns in Figs 2 and 3), a pericentric approach to the Galactic centre since the cluster's formation with a very high relative velocity (Fig. 10). Strong tidal shocking at the pericentre and tidal interaction with the host galaxy remove a large fraction of the cluster's mass in a short time, leaving the most tightly bound core of the clusters, and bringing its bound mass fraction from ∼80 per cent to >90 per cent (Fig. 8). It showcases that the energy gain by a tidal shock can alter the cluster's binding energy (e.g. Kruijssen et al. 2011). This process preferentially strips the old star particles which existed before the formation of the cluster itself, but were associated with the cluster by Rockstar when the cluster formed. The process thus leaves the core of tightly bound young stars with narrower distribution in particle ages (Sections 3.4 and 3.5). We speculate that a tidal shock-induced process like this may be essential to transform a population of star clusters to leave only tightly bound clusters (e.g. Kruijssen 2015). It is worth noting that the cluster's evolution is driven not only by dynamic relaxation effects of the cluster itself, but also by the embedding galactic contexts such as the cluster passing through strong tidal fields and experiencing mass losses.
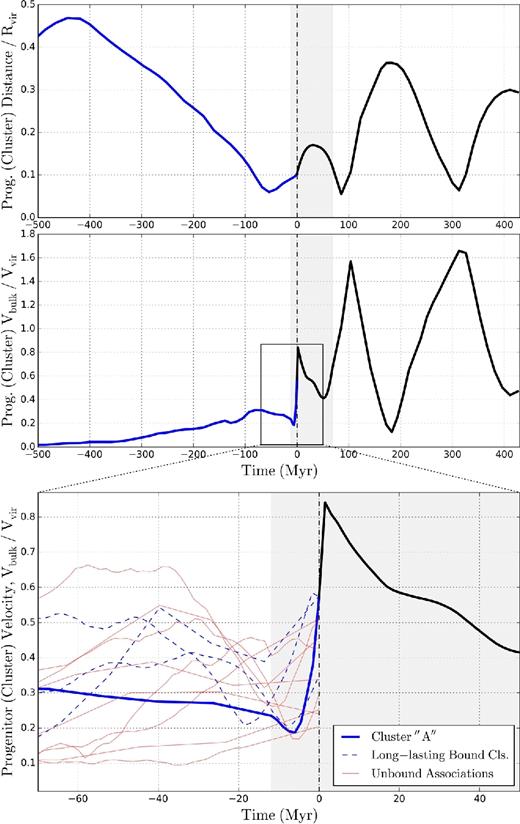
Evolution of the cluster ’A’ and its gas progenitor as Fig. 9, but in different properties. Top: gas progenitor member particles’ (blue) or the cluster member particles’ (black) mean distance to the Galactic centre normalized by the galactic virial radius Rvir, gal. Middle: gas progenitor member particles’ (blue) or the cluster member particles’ (black) bulk velocity with respect to the Galactic centre normalized by the galactic virial velocity Vvir, gal. Bottom: a zoom-in region around the formation time of the cluster ’A’. The cluster formation event is associated with a drastic velocity change around a pericentric passage during a proto-galaxy merger (i.e. strong tidal shock with Mach number ∼100; see Fig. 3).
(3) Phase 3: settling of the cluster. After the mass loss event, the cluster eventually settles in at Mcl ∼ 106.0 M⊙ and Rh ∼ 101.4 pc. The cluster maintains these properties for the next ∼320 Myr. It also preserves most other characteristics such as the bound mass fraction, virial ratio, density, metallicity, and velocity dispersion (Figs 8, 9 and 11). One of the reasons that the cluster could maintain its characteristics is because the cluster has now moved to an orbit with a relatively large radius after a fast velocity increase around the major mass loss event in Phase 2 (Fig. 10). Our observation is broadly consistent with Kruijssen (2015) who argued that external perturbation events such as galaxy mergers could cause clusters to migrate into the halo, and thus limit the duration of the shock-induced disruption phase. The cluster may survive for an extended period of time since it is now less likely to undergo tidal shocks that could disrupt it. It is also interesting that the cluster is ejected from the main concentration of stars into the halo, where Milky Way's metal-poor ’blue’ GCs are indeed found.16
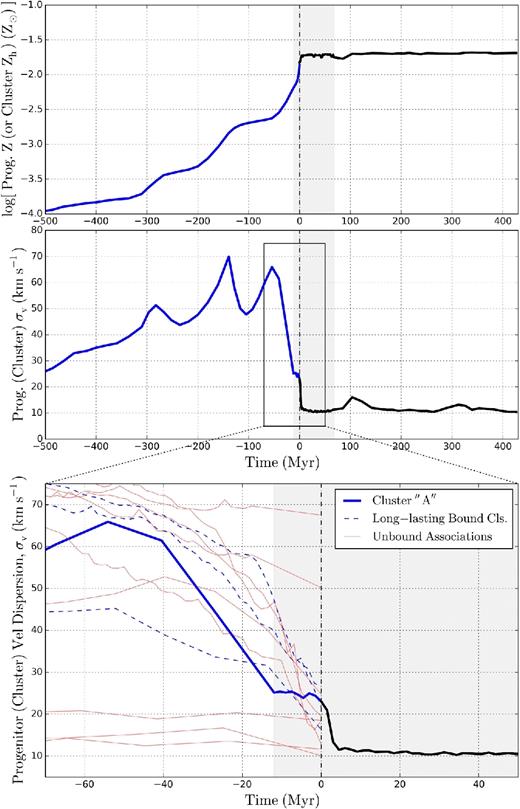
Evolution of the cluster ’A’ and its gas progenitor as Fig. 9, but in different properties. Top: gas progenitor member particles’ (blue) or the cluster's (black) mean metallicity within a half-mass radius, Zh. Middle: gas progenitor member particles’ (blue) or the cluster member particles’ (black) velocity dispersion, σv. Bottom: a zoom-in region around the formation time of the cluster ’A’. The sharp velocity change at the cluster formation time (Fig. 10) is associated with a sharp drop in velocity dispersion, consistent with the tidal compression.
3.4 Formation of a long-lasting bound star cluster
3.4.1 Method and overview
In this section, we go back to the moment when these long-lasting bound star clusters form, and examine the formation conditions of the bound clusters. In particle-based hydrodynamics codes like Gizmo a newly born star particle inherits the unique particle ID number from its progenitor gas particle. Using these unique IDs, we can identify the ’gas progenitor’ of a cluster in an earlier snapshot before the cluster formed. The cluster's ’formation time’ is defined as the moment when 50 per cent of the gas progenitor member particles have turned into star particles. Using such information, in Figs 9 to 11 we present the evolution of the cluster ’A’ and its gas progenitor. In addition to the gas progenitor of the cluster ’A’, progenitors of three other long-lasting bound clusters identified at z = 5 are shown (blue dashed lines in the bottom panels; recall that these three clusters are more massive than 105.5 M⊙ and survived > 300 Myr at z = 5; marked by thin blue circles in Fig. 4). Also shown are the progenitors of nine unbound associations at z = 5 – that are more massive than 1.5 × 10⁵ M⊙ at z = 5, but fail to meet the criteria of a long-lasting bound cluster (thin red lines).
At early times, more than 100 Myr before the formation, the gas progenitor particles of the cluster ’A’ are spread over ≳ kpc, effectively a random sample of the entire galaxy (Fig. 9). About 30 Myr before the formation time, the gas progenitor's mean density reaches ∼10 cm−3 (or ∼10−1 M⊙ pc−3), a typical value of a dense ISM in this relatively dense high-redshift galaxy. Then, for the next 30 Myr, a galaxy merger event disturbs the gravitational potential around the gas progenitor sitting between the two merging proto-galaxies (first and second columns in Figs 2 and 3). This event forces the gas cloud into strong compressive shocks (Fig. 10), forming a self-gravitating cloud with its velocity dispersion decreased to ≲ 20 km s−1 (Fig. 11). The mean density of the gas progenitor accordingly increases quickly to ≳ 103 cm−3 (or ≳ 10 M⊙ pc−3; see Fig. 9, or the red dotted line of Fig. 5). Consequently, the gas cloud collapses and turns a significant portion of its mass (≳ 105 − 6 M⊙, comparable to that of a star cluster) simultaneously into stars in the gas free-fall time-scale, tff ≲ 3 Myr (see also Section 3.5). Due to its high density and compactness, the newly formed cluster remains gravitationally bound. Note that this formation scenario applies also to other long-lasting bound star clusters.
In order to illustrate the nature of gas compression triggering star cluster formation, in Fig. 12 we plot the radial profile of the mass-weighted gas infall velocity when the cluster ’A’ starts to form. The plot is centred on the gas progenitor of the cluster – the location of densest gas within 100 pc from the centre of the gas progenitor – at 10.5 Myr before the cluster's formation time (when the first stars in the cluster begin to form). The negative velocity values indicate the inward motion of the gas. The merger event disturbs the gravitational potential around the progenitor and compresses the gas cloud to high density where it is strongly self-gravitating. Therefore, the actual gas infall speed is of the order of the purely gravitational infall speed at each radius R, |$v_{\rm ff} (R) = \sqrt{8GM_{\rm tot,{\, }<}(R)/(\pi ^2R)}$|, where Mtot, <(R) is the total mass within R. The gas infall speed does occasionally become larger than the purely gravitational collapse speed. This is indicative of a massive gas cloud with little support from rotation or shear, which collapses under self-gravity until it undergoes efficient star formation at high density.
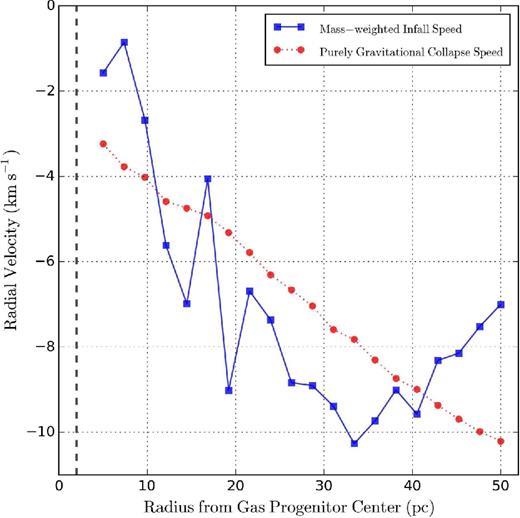
Radial profile of the mass-weighted gas infall velocity around the gas progenitor of the cluster ’A’ when it begins to form (blue solid line; 10.5 Myr before the cluster's formation time). The negative values indicate the inward movement of the gas. Also shown is the purely gravitational infall speed at each radius (red dotted line). The thick dashed vertical line marks the minimum force resolution for gas. The galaxy merger event disturbs the gravitational potential around the progenitor and compresses the gas cloud, making the actual gas infall speed occasionally larger than the purely gravitational collapse speed. For cold, molecular star-forming gas, the compressive velocities here correspond to Mach ∼ 50 flows.
3.4.2 Merger-induced star cluster formation
Overall, our investigation paints a picture of bound star cluster formation when massive clouds reach very high densities – a condition which may be preferentially merger-induced (though in principle similar conditions could occur without mergers). Mergers can produce tidal shocks in regions of strong tidal acceleration (e.g. bridges, tidal tails, induced bars) with velocity jumps of the order of the circular velocity (Fig. 10), corresponding to Mach numbers of ∼50–100, which in turn produces extreme gas compression (e.g. Kim, Wise & Abel 2009). The resulting dense gas clumps efficiently cool and collapse. The free-fall time at the velocities shown in Fig. 12 reaches ∼0.5–1.5 Myr for the clump core with densities ∼103 − 4 cm−3. Therefore collapse occurs before the first SNe explode (which requires a time ∼3–10 Myr). Although radiative feedback and stellar winds are present in our simulation and act on shorter time-scales, the gas densities are sufficiently high such that they are unable to disrupt the cloud until a significant fraction – an order unity – of the gas has been converted into stellar mass (Grudić et al. 2016).17 The resulting, highly efficient star formation allows the cluster to remain bound. This is in line with previous analytic (Fall, Krumholz & Matzner 2010; Kruijssen 2012) and numerical (Grudić et al. 2016) models for the fraction of stars that form in bound clusters.
By disturbing and compressing the system, galaxy mergers provide unique opportunities to make the otherwise normal ISM shock to abnormally high densities. The violent environment is important to push a large gas mass of ≳ 105–6 M⊙collectively to very high density in a short time, rather than letting it fragment into smaller dense pieces. Once at such high density, the cloud promptly turns a significant portion of itself into stars at a small dynamical time-scale, tff ≲ 3 Myr. Since proto-galaxies at high redshift frequently experience mergers, they could have provided a fertile environment to produce multiple long-lasting bound clusters – which we speculate to be candidates for present-day ’blue’ GCs.
We emphasize the critical difference between our merger-induced formation process of long-lasting bound star clusters and the normal turbulent fragmentation. All star particles require a density above nth = 500 cm−3 to spawn in our simulation (Section 2), yet most of them end up in unbound associations. It is because, in a typical star-forming gas clump, only a small fraction of its mass in sub-clumps (with mass ≪105 M⊙) is sufficiently dense to form star particles. The newly born star particles then destroy their parent cloud complex. By contrast, in the cluster formation scenario identified in our simulation, a violent galaxy merger causes a large amount of self-gravitating gas mass – comparable to that of a star cluster – to simultaneously reach high density above the star formation threshold.
3.4.3 Caveats
It is worth discussing a few points about this process:
(1) Since the newly formed star cluster grouped by Rockstar includes not only the just born star particles but also nearby pre-existing ones, the newly formed cluster's mean stellar density could be smaller than that of the gas progenitor of the cluster ’A’ at z = 5. This results in the discontinuity in densities between the blue and black solid lines at 0 Myr in the middle/bottom panels of Fig. 9. In fact, at z = 6.90, just ∼3.2 Myr after its formation, the cluster ’A’ is composed of ∼80 per cent in pre-existing stars, and only ∼20 per cent in stars just born in the past 5 Myr (see Section 3.5 for more discussion). The pre-existing stars are typically in the outskirts of the cluster, and tend to be preferentially removed already by z = 5, leaving only the core of tightly bound young stars (but again, see footnote 15). But notice that if we consider the mean density of the core within 15 pc containing almost exclusively newly born star particles, the gas progenitor's density smoothly transitions to the newly formed cluster's core density at 0 Myr (thick black dashed line in the bottom panel of Fig. 9).
(2) Readers should note that the high-density cluster formation process described above is not a sufficient condition, but only a necessary condition for a long-lasting bound cluster. Among the nine unbound associations shown in Figs 9--11 (thin red lines), three of them broadly followed similar paths as that of the cluster ’A’ when formed. But eventually, they do not become long-lasting bound clusters at z = 5. Other processes after their formation – such as tidal disruption or gravitational capture – interrupt their lives as bound clusters at some points before z = 5. Obviously, however, we cannot exclude the possibility that they could have survived as bound clusters if better numerical resolution had been adopted.
It is also useful to comment on the numerical aspects of our simulation:
(1) As pointed out before (footnote 12), what may not be so robust in our calculation is the quantities like the cluster's final size and density, because the cluster's relaxation effects are only marginally resolved. In contrast, what is indeed physically robust is the fact that a large self-gravitating gas mass of ≳ 105 − 6 M⊙ could reach very high density simultaneously in galaxy mergers, and should very efficiently form stars before any of the various stellar feedback channels intervenes. Based on our arguments above, capturing this in simulations requires the ability to resolve surface densities at least as high as ∼103 M⊙ pc−2. In nature, gas clouds may reach even higher densities before they become self-gravitating and star-forming.
(2) We argue that a numerical simulation with high resolution and a high dynamic range needs to be accompanied by appropriate subgrid physics to properly describe the clustered star formation scenario described here. For example, we find it harder to identify long-lasting bound clusters in the same runs with lower star formation threshold density (e.g. z5m10mr run with nth = 50 cm−3 in Ma et al. 2015, see footnote 6) or without a self-gravity star formation criterion (e.g. z5m10e run in Ma et al. 2015), because in this cases stars artificially form at such low densities that clumps can never reach the critical mean densities described above (i.e. ≳ 103 cm−3).18 This suggests that for the hydrodynamics code adopted in our study, a physically motivated star formation criterion is crucial to depict the Jeans gravitational collapse at the relevant mass and length resolution scales, and to numerically reproduce extraordinary conditions such as merger-induced star cluster formation.
3.5 Composition of a long-lasting bound star cluster at the end of the simulation (z = 5)
Finally we examine the cluster properties at z = 5 focusing on how the cluster formation event is imprinted in its composition. Fig. 13 shows the normalized PDF of the star cluster member particles’ creation times tcr. A small dispersion in member particles’ ages for the cluster ’A’ (clustered at 0 Myr) reinforces the idea that the star formation episode lasted for a very short time. The two other small peaks located at −500 Myr and 100 Myr contribute negligibly to the total cluster mass. For comparison, we also plot the tcr distribution for the cluster ’A’ at z = 6.90, just ∼3.2 Myr after its formation. Even though the cluster was initially grouped with nearby pre-existing stars of varying ages by Rockstar, they are typically in the outskirts of the cluster, and tend to be preferentially removed already by z = 5. This process left only the core of tightly bound young stars with very narrow distribution in particle ages. We also plot the PDF of one of the six unbound associations whose gas progenitors are shown in thin red lines in Figs 9–11, but do not resemble the evolution path of the cluster ’A’ progenitor. Indeed, its tcr distribution reveals multiple generations of member star particles.
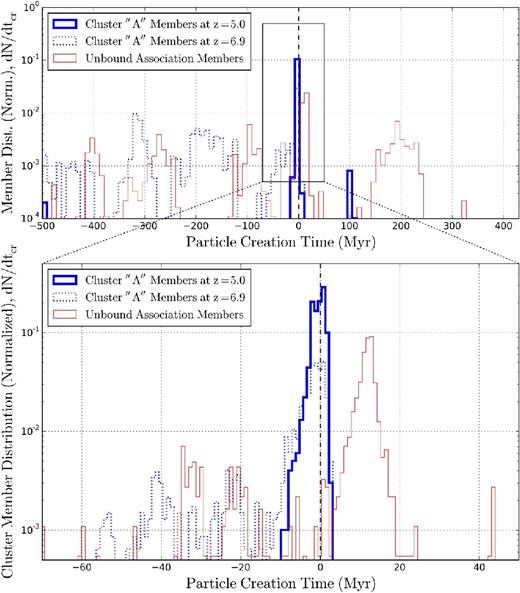
Top: the normalized PDF of the star cluster member particles’ creation times tcr (time bin size = 9.3 Myr). 0 Myr corresponds to the moment each star cluster forms. A thick blue line and a blue dotted line are for the members of the cluster ’A’ at z = 5 and z = 6.90, respectively, while a thin red line is for a representative unbound association (see Section 3.5 for how this unbound association is selected). Bottom: a zoom-in region around the formation time of the cluster ’A’ with finer binning in time (bin size = 0.93 Myr). The x-axis range is kept identical among Figs 8–11 and 13 for easier comparison. Most of the cluster's member particles left by z = 5 were formed in a short burst, within Δ tcr ∼ tff ≲ 3 Myr from the cluster's formation time.
The width of the main spike in the cluster ’A’ members’ formation episode is of the order of the free-fall time (bottom panel of Fig. 13). Approximately 60 per cent of the entire member star particle population were born within an ∼3 Myr period in this main spike. That is, Δ tcr ∼ 3 Myr ∼ tff, which is approximately consistent with the recent observations of young massive clusters (Bastian et al. 2013; Bastian, Hollyhead & Cabrera-Ziri 2014; Cabrera-Ziri et al. 2014).
In Fig. 14 we plot the normalized PDF of the star cluster member particles’ metallicities. This agrees reasonably well with internal abundance variations found in recent observations of metal-poor ’blue’ GCs (e.g. Gratton, Sneden & Carretta 2004; Da Costa et al. 2009; Marino et al. 2015; Roederer et al. 2016). It also shows that the star-forming gas was already enriched up to as high as 10−1 Z⊙, while approximately matching the observed mean abundance value. (One may also speculate that the cluster ’A’ exhibits a slightly narrower distribution than a representative unbound association does.) However, the large spread in the member particle metallicities for the unbound association (larger than the observed [Fe/H] spreads of ≲ 0.05 dex), or equivalently a large noise in the metallicity field, is to a great extent a numerical artefact because we do not include a sophisticated metal mixing scheme in the simulation – that is, presently metals are simply locked into individual particles once deposited by SNe. We plan to investigate if including a subgrid-scale turbulent metal diffusion scheme (e.g. Su et al. 2017) would reduce the artificially enhanced metallicity spread.
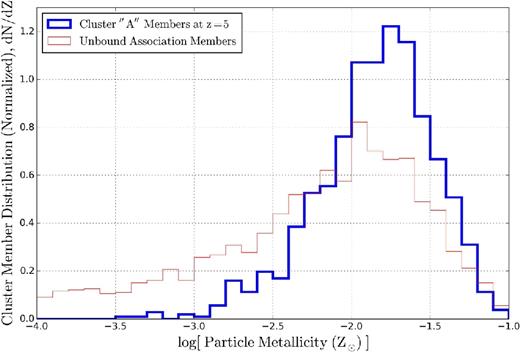
The normalized PDF of the star cluster member particles’ metallicities. The thick blue line is for the cluster ’A’ at z = 5, while the thin red line is for an unbound association (the same one as in Fig. 13). In this simulation, gas particles have fixed metallicity with no inter-particle mixing allowed. The metallicity spread we find should be interpreted as an upper limit of the true metallicity spread – if e.g. turbulence mixes metals on small scales in star cluster-forming regions.
4 SUMMARY AND CONCLUSION
Using a state-of-the-art cosmological simulation of high-redshift merging proto-galaxies from the FIRE project, we have investigated the formation and evolution of star clusters, and in particular explored one formation hypothesis for present-day metal-poor ’blue’ GCs. In the simulation, two populations of clustered star formation emerge. Most stars form in unbound or loosely bound associations with mean stellar densities ∼10−2 M⊙ pc−3, or surface densities ∼1 M⊙ pc−2, corresponding to a typical GMC complex converting a few per cent of its mass into stars. This is the behaviour we have previously shown as ’typical’ in simulations with similar physics at low redshifts (Hopkins et al. 2012) and seen in observations (e.g. Evans et al. 2009). However, a few per cent of stars form in bound clusters with mean stellar densities ∼30 M⊙ pc−3, or surface densities ∼103 M⊙ pc−2 (Section 3.2). At these surface densities, Grudić et al. (2016) showed (in simulations of individual cluster-forming clouds, at sub-M⊙ resolution but with the same physics) that stellar feedback begins to become unable to efficiently expel the cloud before/as it collapses into stars, leading to an order of unity fraction of gas turning into stars. Essentially, the self-gravity of the cloud becomes too large for small-scale feedback channels to overcome, particularly as the dynamical times for collapse become shorter than the massive star's evolution time-scale – and shorter than the time-scale for SNe explosion. A similar threshold was motivated by simple analytic arguments in Fall et al. (2010). Critically, the simulation here see both populations, with sufficient dynamic range to show that the same physics which produces low star formation rates in a galaxy-averaged sense (Hopkins et al. 2014; Orr et al. 2017) and most of the star formation in unbound associations can also produce a reasonable mass fraction in dense, bound, GC-like objects. It is also crucial that the simulation here includes stellar feedback not just from SNe but also from photoheating, radiation pressure, and stellar winds, since the cluster formation time-scales are shorter than ≲ 3 Myr, so SNe do not have the chance to explode before the clusters form (Section 2). In other words, simulations which do not include these other feedback mechanisms could therefore easily overestimate the formation efficiency of dense clusters.
We show that frequent mergers in high-redshift proto-galaxies can provide a fertile environment for the production of this GC-like population. The mergers disturb the gravitational potential and produce tidal shocks with Mach numbers ∼50–100, which rapidly and collectively push (pre-existing) large gas clouds of ≳ 105 − 6 M⊙ to very high densities >103 cm−3 (Section 3.4). Such clouds then cool and collapse to form stars extremely rapidly before stellar feedback can stop star formation. We typically see a dense ‘core’ in these systems, which is tightly bound, surrounded by a lower-density ‘envelope’ of loosely associated stars and nearby pre-existing stars. Those stars are quickly and preferentially stripped – not just by dynamical relaxation effects (which we do not necessarily resolve in the simulations) but also by the cluster passing through the tidal field of its host galaxy (Section 3.3). In the simulation we analysed, the tightly bound core is left behind and survives for ∼420 Myr, until the end of the simulation. This relic core has a very small age spread, and relatively small metallicity spread (Section 3.5).
Of course, the simulation here still suffers from various limitations. Our limited resolution, 800 h−1M⊙, means that we can only follow very massive clusters, and cannot follow detailed intra-cluster evolution (dynamical relaxation, mass segregation, etc; Section 3.3). Next-generation simulations in progress reach ∼30 M⊙ resolution (Wheeler et al., in preparation), and in follow-up studies we can use these new runs to identify cluster-forming regions which are then refined to gain superior resolution. The limited evolution time of the present simulation – stopped at z = 5 – entails that we cannot yet predict the ultimate fate of the clusters (e.g. their locations in a z = 0 Milky Way-like galaxy, into which this progenitor halo should eventually evolve). Future simulations will also address this (Wetzel et al., in preparation), but also methods which replace clusters formed self-consistently with tracer particles which can be evolved for longer times (e.g. Renaud, Agertz & Gieles 2017; Li et al. 2017) could be useful. Improvements to the hydrodynamics and subgrid physics in our new FIRE-2 model (Hopkins et al. 2017) may also influence our predictions, although preliminary comparisons suggest that the hydrodynamic method (e.g. Gizmo’s mesh-free finite-mass mode versus the P-sph mode chosen here) does not significantly affect the conclusions presented here. Future work will include analysing different runs performed with different hydrodynamic solvers and star formation prescriptions to constrain their effects in the stellar distribution and cluster numbers. More accurate treatments of stellar yields (as opposed to the IMF-averaged yields adopted here) and subgrid metal diffusion in the dense ISM will be critical to make testable predictions for the internal abundance patterns within GCs, an obvious frontier for observations.
ACKNOWLEDGEMENTS
The authors thank Tom Abel, Nathan Bastian, Diederik Kruijssen, Joel Primack, and Eros Vanzella for useful discussions and insightful comments during the progress of this study. Ji-hoon Kim acknowledges support from NASA through an Einstein Postdoctoral Fellowship grant PF4-150147 awarded by the Chandra X-ray Center, which is operated by the Smithsonian Astrophysical Observatory for NASA under contract NAS8-03060. He also acknowledges support from the Moore Center for Theoretical Cosmology and Physics at Caltech. He thanks for the support from the computational team at SLAC National Accelerator Laboratory, from Shawfeng Dong at the University of California Santa Cruz, and from Chris Mach at Caltech during the usage of the clusters for simulation analyses. The computing time used for the presented simulations was provided by Extreme Science and Engineering Discovery Environment (XSEDE) allocations TG-AST120025, TG-AST130039, TG-AST140023, and TG-AST140064. XSEDE is supported by the National Science Foundation (NSF) grant ACI-1053575. Philip Hopkins acknowledges support by the Gordon and Betty Moore Foundation through grant 776 to the Caltech Moore Center for Theoretical Cosmology and Physics, by the Alfred P. Sloan Foundation through Sloan Research Fellowship BR2014-022, by the NSF through grant AST-1411920 and CAREER grant 1455342, and by NASA through the ATP grant NNX14AH35G. The Flatiron Institute is supported by the Simons Foundation. Andrew Wetzel acknowledges support by a Caltech-Carnegie Fellowship, in part through the Moore Center for Theoretical Cosmology and Physics at Caltech, and by NASA through grant HST-GO-14734 from STScI. Claude-André Faucher-Giguère acknowledges support by the NSF through grants AST-1412836 and AST-1517491, by NASA through grant NNX15AB22G, and by STScI through grants HST-AR-14293.001-A and HST-GO-14268.022-A. Dušan Kereš acknowledges support by the NSF through grant AST-1412153, and by the Cottrell Scholar Award from the Research Corporation for Science Advancement. Shea Garrison-Kimmel acknowledges support from NASA through an Einstein Postdoctoral Fellowship grant PF5-160136. The publicly available yt code used in the analysis of this work is the product of collaborative efforts by many independent scientists from numerous institutions around the world. Their commitment to open science has helped make this work possible.
Footnotes
We caution that even a simulation with ∼103 M⊙ resolution cannot reproduce the phase-space of actual stars in a cluster. See Section 3.3 for more discussion on numerical resolution and the ‘intra-cluster’ evolution.
The website is http://fire.northwestern.edu/.
The website is http://www.tapir.caltech.edu/~phopkins/Site/GIZMO.html.
For the original Ma et al. (2015), 31 snapshots were produced at intervals coarsely spaced between z = 7 and z = 5; that is, Δ z = 0.1 (Δ tout ∼ 17 Myr) for 6 < z < 7, and Δ z = 0.05 (Δ tout ∼ 13 Myr) for 5 < z < 6. For the presented re-run, we output 76 snapshots at intervals more finely spaced between z = 7 and z = 5, especially around the time of the cluster ‘A’ formation; that is, Δ z = 0.01 (Δ tout ∼ 1.6 Myr) for 6.5 < z < 7, Δ z = 0.1 for 6 < z < 6.5, and Δ z = 0.05 for 5 < z < 6.
Note that Ma et al. (2015) mistakenly stated nth = 1000 cm−3 for the z5m10h run. The correct value is 1000 h2 ≃ 500 cm−3.
In all subsequent analyses we utilize the yt toolkit (Turk et al. 2011, http://www.yt-project.org/, changeset d7f213e1752e), a code-independent analysis platform adopted by the AGORA Initiative (Kim et al. 2014, 2016). To visualize fluid quantities such as gas density in Figs 2 and 3 we employ yt’s in-memory octree to which gas particles are assigned in a scatter step using the particles’ hydrodynamic smoothing kernels (yt parameters |${\small n\_ref} = 4$| and |${\small over\_refine\_factor}=2$|).
The website is https://bitbucket.org/gfcstanford/rockstar/.
For Rockstar to work with its embedding yt, we assume that all star particles have a constant mass, 874 M⊙, the mean of all star particles. In practice, the actual mass difference is less than a few tens of per cent.
Mcl is computed by summing up the real masses of member particles, not the constant masses we assumed for Rockstar. Mcl is thus slightly different from the group mass Mvir, cl found in the standard Rockstar output. Clusters are not necessarily a relaxed structure, but the two masses are different by less than a few tens of per cent particularly if bound (justifying our use of Mvir, cl to calculate the bound mass fraction fbd).
Even some of these averaged characteristics of a simulated cluster should be treated with caution. For example, the mean densities ρ of long-lasting bound clusters seem to eventually settle in at a value only slightly above the star formation threshold (Fig. 9). Meanwhile their sizes, Rh, seemingly asymptote to ≳ 10 pc. But in nature, obviously, even the massive clusters simulated in this study may become much denser, and more compact in size (see e.g. Larsen 2004; Ryon et al. 2015). The exact values of the cluster's density and size, and its evolution and survival, may still likely depend on the choice of numerical resolution.
Or, one may simply locate an ancestor cluster in each snapshot that contains most member particles of the target cluster at z = 5. The two approaches, in most cases, generate identical lineage trees. But in peculiar periods of evolution involving e.g. galactic major mergers or tidal shocking/stripping, the two techniques could be used in a complementary way.
Because of the relatively low fbd one should be careful when comparing Mcl of the objects studied in Figs 4, 7 and 8 with the masses of observed low-redshift GCs for which unbound stars are not included in the calculation of their masses. For example, few data points in Fig. 4 are compatible with the observed GCs since many of them are unbound. Even the ancestors of the cluster ’A’ in Fig. 7 cannot be directly compared with observed GCs as they are yet to be fully tightly bound. Only after the cluster becomes tightly bound with fbd ∼ 90 per cent can their masses be thought of as consistent with the bound masses measured for observed GCs.
We however caution that the description of the cluster's early evolution in Phases 1–2 may be dependent on the specific algorithm and parameters of the cluster finder (Rockstar chosen here; Section 2). Some of the unbound or loosely bound stars in the ’envelope’ may not be physically associated with the cluster, and might have been easily lost on a longer time-scale even without the tidal process described in Phase 2.
Clearly, the limited run time of our simulation prohibits us from predicting the ultimate fate of our simulated high-redshift clusters. An extensive study with more samples would be needed to thoroughly test this hypothesis. For recent studies closely related to this idea, see e.g. Kruijssen (2015) and Adamo & Bastian (2015).
For a cloud core with ∼106 M⊙ inside ∼10 pc (Fig. 7), the escape velocity is ≳ 20 km s−1, so photoionization heating which heats the gas to the thermal speed of only ∼10 km s−1 cannot unbind the cloud. Radiation pressure and stellar winds for a zero-age main-sequence population both carry a momentum flux ∼L/c ∼ 1032 dyne (M⋆/106 M⊙), which is less than the gravity |${\sim } G{\, }M_{\rm cl}{\, }M_{\rm gas}/R_{\rm h}^{2} \sim 10^{32}\ {\rm dyne}{\, }(M_{\rm gas}/10^{6}\ {\rm M}_{{\odot }}){\, }(\Sigma _{\rm cl}/10^3\ {\rm M}_{{\odot }}{\, }{\rm pc^{-2}})$| for a clump surface density ≳ 103 M⊙ pc−2, until most of the gas is turned into stars (see Grudić et al. 2016 for more details).
This result is in line with fig. 10 of Li et al. (2017) where only with high enough star formation threshold can they reproduce the short burst of star formation found in observed young massive clusters.
REFERENCES
Author notes
Einstein Fellow.
Caltech-Carnegie Fellow.
Canada Research Chair in Astrophysics.
