


Abstract
We revisit double neutron star (DNS) formation in the classical binary evolution scenario in light of the recent Laser Interferometer Gravitational-wave Observatory (LIGO)/Virgo DNS detection (GW170817). The observationally estimated Galactic DNS merger rate of |$R_{\rm MW} = 21^{+28}_{-14}$| Myr−1, based on three Galactic DNS systems, fully supports our standard input physics model with RMW = 24 Myr−1. This estimate for the Galaxy translates in a non-trivial way (due to cosmological evolution of progenitor stars in chemically evolving Universe) into a local (z ≈ 0) DNS merger rate density of Rlocal = 48 Gpc−3 yr−1, which is not consistent with the current LIGO/Virgo DNS merger rate estimate (|$1540^{+3200}_{-1220}$| Gpc−3 yr−1). Within our study of the parameter space, we find solutions that allow for DNS merger rates as high as |$R_{\rm local} \approx 600^{+600}_{-300}$| Gpc−3 yr−1 which are thus consistent with the LIGO/Virgo estimate. However, our corresponding BH–BH merger rates for the models with high DNS merger rates exceed the current LIGO/Virgo estimate of local BH–BH merger rate (12–213 Gpc−3 yr−1). Apart from being particularly sensitive to the common envelope treatment, DNS merger rates are rather robust against variations of several of the key factors probed in our study (e.g. mass transfer, angular momentum loss, and natal kicks). This might suggest that either common envelope development/survival works differently for DNS (∼10–20 M⊙ stars) than for BH–BH (∼40–100 M⊙ stars) progenitors, or high black hole (BH) natal kicks are needed to meet observational constraints for both types of binaries. Our conclusion is based on a limited number of (21) evolutionary models and is valid within this particular DNS and BH–BH isolated binary formation scenario.
1 INTRODUCTION
The first ever detection of the gravitational wave signal from coalescing double compact objects (Abbott et al. 2016b) by the Laser Interferometer Gravitational-wave Observatory (LIGO) opened a completely new window on the Universe, providing scientists with a new tool to study the origin of these objects. With increasing sensitivity and a growing number of operating detectors, this tool will bring more information leading us closer to the correct understanding of the physics standing behind their evolution and formation. Each new detection or further non-detection will impose stronger observational limits on the merger rates. This in turn will help to discriminate between evolutionary paths that predict too many or too few detections and better constrain the uncertain phases of the evolution of compact binaries. At the same time, theoretical predictions of the properties of double compact objects merging within the Hubble time (the merging population hereafter) can serve to better tune the detectors, making the search more efficient. It is thus important to identify the factors that affect the rates and the properties of the merging population the most.
In this study, we focus on merging double neutron star (DNS) binaries. There are two essentially different formation channels for merging DNS: isolated (field populations, e.g. Portegies Zwart & Yungelson 1998; Belczynski, Kalogera & Bulik 2002; Voss & Tauris 2003; Belczynski et al. 2007; Bogomazov, Lipunov & Tutukov 2007; Dominik et al. 2012, 2013, 2015; Mennekens & Vanbeveren 2014; Tauris, Langer & Podsiadlowski 2015; Belczynski et al. 2016a,c) where two stars are born together and their evolution is affected only by the interaction between the binary components, and dynamical – occurring in dense environments, where the dynamical interactions between stars are important e.g. in globular clusters or nuclear clusters (e.g. Phinney 1996; Grindlay, Portegies Zwart & McMillan 2006; Ivanova et al. 2008; Petrovich & Antonini 2017). We consider only the isolated channel (from now on we refer only to the DNS that formed in isolation, unless explicitly stated otherwise), aiming to pinpoint the crucial factors that lead to the biggest uncertainties of theoretically predicted rates.
A theoretical, population synthesis-based approach, suffers from a number of uncertainties, arising from different sources: the initial conditions used in the simulations, the input physics, the treatment of weakly constrained phases of stellar and binary evolution, and assumptions about e.g. the history of the star formation and metallicity on the cosmological time-scales, necessary to normalize the merger rates. de Mink & Belczynski (2015) examined the impact of the updated initial binary parameter distributions obtained by Sana et al. (2012) from the spectroscopic measurements of massive O-type stars in young (a few Myr) stellar clusters and associations on the merger rate predictions. They conclude that the updated distributions from which the initial orbital parameters are chosen and variations applied to parameters of the distributions within the observational limits have only a marginal effect on the coalescence rates, unless the slope of the high-mass initial mass function (IMF) is considered, which can shift the rates by a factor of a few. Recently, Moe & Di Stefano (2016) motivated by the recent observational studies analysed the data from numerous surveys of massive binary stars and revised the initial distributions, finding statistically significant correlations between many of the physical parameters of the binaries to date treated separately. The study of the effect of these intercorrelated initial binary parameters on the coalescence rates is underway (Klencki et al., in preparation).
Here, we concentrate on the uncertainties related to the stellar evolution and binary interaction. The description of all of the crucial phases of the evolution of the progenitor of a merging DNS system requires making certain assumptions often expressed in the form of a particular parametrization and deciding upon a particular value of the free parameters, not always well constrained by observations (with an infamous example of the common envelope, CE, e.g. Ivanova et al. 2013). The impact of those choices on the final result (e.g. the estimated merger rate) was studied to some extent by a number of authors and with the use of different population synthesis codes (e.g. Portegies Zwart & Yungelson 1998; Voss & Tauris 2003; Bogomazov et al. 2007; Mennekens & Vanbeveren 2014) also with the StarTrack code (Belczynski et al. 2002; Belczynski et al. 2008), e.g. the study of Dominik et al. (2012) focusing on the CE phase), which we use in this work . However, here we aim to make the whole picture a little bit more complete, examining the impact on the merger rates of the factors related to the recent observational and theoretical progress in the study of the evolution of double compact objects, paying particular attention to the NS–NS binaries.
2 EVOLUTION TOWARDS THE DNS: CRUCIAL PHASES AND BOTTLENECKS
The typical isolated evolution of the progenitor of a merging DNS binary requires the occurrence of two non-disrupting core-collapse events, the interaction between the binary components via mass transfer (MT) phase(s) and the presence of the mechanism capable of severely decreasing the orbital separation that will not lead to the coalescence before the formation of two compact objects. In this section, we discuss the uncertainties related to those phases and the results of the recent studies.
2.1 Core-collapse events and the natal kicks
The progenitor of a merging DNS system encounters two core-collapse events and the first set of ‘evolutionary’ uncertainties is related to the assumptions made to describe the mechanism of the explosion/collapse, e.g. criteria used to identify the progenitors of stars undergoing different types of core collapse [i.e. iron-core-collapse supernova, electron-capture supernova (ECS, e.g. Miyaji et al. 1980), and accretion-induced collapse (AIC, Nomoto & Kondo 1991)] and the magnitude of the related natal kick velocity imparted on the newly formed neutron star (NS, e.g. Gunn & Ostriker 1970; Hobbs et al. 2005). Natal kicks are believed to arise from asymmetries developed during the explosion/collapse, expressed in either asymmetrically ejected mass (Janka & Mueller 1994; Wongwathanarat, Janka & Müller 2013; Janka 2017) or anisotropic emission of neutrinos (e.g. Fryer & Kusenko 2006, or due to both factors acting together).
With an intention to statistically describe the natal kicks, Hobbs et al. (2005) studied the proper motions of young (with characteristic ages of less than 3 Myr) and presumably single field pulsars. They found that the distribution of their velocities can be well described by a Maxwellian distribution with the velocity dispersion of σ = 265 km s−1, which yields an average natal kick magnitude of 420 km s−1. At the same time, there is mounting evidence that some NS form with substantially smaller natal kicks. For instance, Pfahl et al. (2002b) find that the orbital parameters of a certain class of the high-mass X-ray binaries distinguished by relatively long orbital periods (in excess of 30 d) and small eccentricities (e ≲ 0.2) suggest that NSs in these systems must have formed with birth velocities smaller than ∼50 km s−1. Also the orbital parameters of some of the Galactic DNSs seem to require low natal kick at birth (van den Heuvel 2007; Beniamini & Piran 2016). Another commonly quoted argument is the retention of NS in globular clusters (Pfahl, Rappaport & Podsiadlowski 2002a; Ivanova et al. 2008). As these structures typically have escape velocities around 50 km s−1, larger kicks would make it impossible to retain NSs inside their potential well. However, there are many pulsars observed within the globular clusters and we know of two DNS binaries (B2127+11, J1807−2500) contained within them.
To explain the origin of these low-kick NSs, it was postulated that they form when a degenerate ONeMg collapses due to electron-capture, as opposed to a standard iron-core core-collapse supernova (CCSN), either in an ECS or AIC of an accreting, massive white dwarf (WD) to a NS.
Different structures of the progenitors of ECS(AIC) and CCSN just before the explosion are believed to lead to differences in the dynamics of the supernova (collapse) itself. Progenitors of ECS/AIC are claimed to collapse more rapidly than iron-core collapsing stars due to much steeper density gradients at the edge of the core, leading to lower explosion energies and smaller masses of the ejected material (Dessart et al. 2006; Jones et al. 2013; Schwab, Quataert & Bildsten 2015). The most important consequence of these differences is expressed in the magnitude of the natal kick gained by a newly formed NS. In the rapid explosion substantial asymmetries may not be able to develop. Natal kicks are commonly assigned to arise due to these asymmetries, hence the smaller birth velocities expected for ECS than normal CCSN. However, if this differentiation is truly determined by the density gradient at the edge of the collapsing core, lowest mass CCSN progenitors may also form NS with small natal kicks, as their density profiles resemble those expected for ECS progenitors (Jones et al. 2013).
It has been also suggested that the explosions of heavily stripped massive stars which have lost their envelopes via binary interactions may lead to small natal kicks, especially if kicks are primarily due to asymmetries in ejected mass and gravitational interaction of the ejecta with a just-formed NS rather than anisotropic neutrino emission, as argued by (Wongwathanarat et al. 2013). The extreme stripping of the envelope may arise due to interaction with a compact companion star, as in the scenario described by [Tauris et al. (2013, 2015) and Moriya et al. (2017), leading to so-called ultra-stripped supernovae, USSNe; see Appendix A], or with a non-compact companion via the double-core scenario (Brown 1995) as in the variation described by Belczyński & Kalogera (2001), involving the evolution of stars of similar initial masses that pass through the CE combined from the envelopes of both companions and leaving behind the bare CO cores in a compact orbit evolving in parallel. All the ultra-stripped SN scenario, the double-core scenario and electron-capture collapse mechanisms predict that low-kick NSs would form mainly (if not only) in binaries (Podsiadlowski et al. 2004; van den Heuvel 2007).
The standard treatment of natal kicks in population synthesis studies relies on single- or multicomponent Maxwellian distributions to describe the magnitudes of the velocities. In StarTrack, we use the form proposed by Hobbs et al. (2005) as a default. However, in such an approach there is no link between the properties of an exploding star and the velocity that is acquired by the remnant. A number of authors suggested that there should be a connection between the magnitude of the kick and the mass of the ejected material, mass of the remnant NS and/or mass of the collapsing core (Jones et al. 2013; Tauris et al. 2015; Beniamini & Piran 2016; Bray & Eldridge 2016; Janka 2017). Recently Beniamini & Piran (2016, based on the analysis of the observed properties of known DNS binaries) and Bray & Eldridge (2016) suggested a simple, linear relationship between the natal kick velocity and the ratio of the mass ejected during the SN to NS mass, which was further discussed by Janka (2017). None the less, the form of this connection is neither clear, nor is the role of neutrinos in the natal kick development. If it proves to be significant, the above considerations may turn out erroneous.
2.2 Progenitors of the electron-capture supernovae
The magnitudes of the natal kicks as described by the distribution proposed by Hobbs et al. pose a challenge for the formation of DNSs (and binaries with NSs in general), as such velocities are high enough to disrupt the binary, especially at the first supernova when the first compact remnant is formed, as then the orbit is still relatively wide. One can thus presume that the abundance of the merging population of DNS would be sensitive to the assumptions regarding the ECS and AIC channels, potentially allowing for the formation with a small birth velocity.
The ECS/AIC progenitors originate from stars with initial masses from the ‘transition region’ (around 8–9 M⊙ at solar metallicity) between stars that finish their evolution as a WD and NS and form degenerate ONeMg cores after the carbon-burning phase. When such a core approaches the Chandrasekhar mass limit (1.375 M⊙) electron captures on Mg and Ne can trigger the collapse to an NS (e.g. Miyaji et al. 1980; Nomoto & Kondo 1991; Jones et al. 2016).
For single stars, the range of the initial masses allowed for ECS progenitors is very narrow and nearly all NS forming in ECS are believed to originate in binary systems, where the interaction (via MT phases) with a companion star can broaden this range, so that initially less or more massive stars can end up with the same core structure before the supernova explosion (Podsiadlowski et al. 2004; van den Heuvel 2007). However, it is not clear how wide this range can be, in particular the location of the lower limit on the mass of an He core at the beginning of the asymptotic giant branch (AGB) stage for a potential ECS progenitor (or lower and upper limit for the zero-age main-sequence (ZAMS) mass of an ECS progenitor). The upper limit seems to be around 2.5 M⊙ and is due to the fact that in the heavier cores, the oxygen will always be ignited and the star will proceed with the burning of the heavier elements, until an iron core is formed. In StarTrack, we follow the study of Hurley, Pols & Tout (2000) (with the updated mass range based on the results of Eldridge & Tout 2004a,b, see Section 3.2 for details) and use the mass of the core at this stage to decide whether a star will develop a degenerate ONeMg core and thus whether at some point it may collapse due to electron-capture processes (either ECS or AIC). The determination of those limits requires detailed stellar structure modelling and many factors may affect the range, even without invoking the binary evolution. The most important factors seem to be the amount of convective core overshooting and rotational mixing, the treatment of convection and mixing in general, the efficiency of the second dredge-up, the mass-loss rate, even the nuclear reaction rates (Poelarends et al. 2008; Jones et al. 2016; Doherty et al. 2017). In case of binary stars, these are also the initial pericentre distance, which for the fixed mass ratio has a decisive role in determining the type/moment of the interaction (MT) between the components, as well as assumptions about the conservativeness of the MT.
2.3 Mass loss and angular momentum loss
The merging population of DNSs, out of necessity, originates from binaries that are at some point of their evolution close enough to encounter the MT phase/phases (unless the wide, non-interacting binary was severely narrowed due to the favourable direction of the natal kick during the second supernova). These phases, as well as the stellar winds which are important for the evolution of O/B-type progenitor stars of NS, require specifying how much mass is lost from the system and how much angular momentum is carried away by the escaping material, which is crucial for the evolution of the orbital separation during the MT. The latter depends on the adopted physical model of how the matter escapes from the binary – whether it is from the vicinity of the accretor or donor, with relatively low angular momentum loss or it occurs through the second Lagrangian point L2 or is liberated from a circumbinary disc of a certain radius, leading to high angular momentum loss. In theoretical studies, the angular momentum loss during the MT is usually parametrized by the quantity jloss standing for the fraction of angular momentum lost from the system with the escaping matter. The second commonly used MT parameter describes the fraction of the mass lost by the donor star that is accreted by its companion (conservativeness fa, where fa = 1 means fully conservative MT). As argumented by de Mink, Pols & Hilditch (2007), using a single value of fa in a population synthesis study, as we assume in StarTrack using fa = 0.5 as a default, is a very crude approximation. However, the degree to which MT is conservative is rather poorly constrained observationally (de Mink et al. 2007; Pols 2007).
The mass lost by stellar winds in population synthesis studies is usually assumed to be spherically symmetrical and homogeneous (e.g. Belczynski et al. 2008; Mennekens & Vanbeveren 2014), relying on the mass-loss rate description by Vink, de Koter & Lamers (2001) or de Jager, Nieuwenhuijden & van der Hucht (1988) for O/B-type stars and carrying the specific angular momentum of the mass-losing star. However, arguments were raised that the wind may in fact be permeated by small-scale inhomogeneities (so-called clumps) and the above-mentioned prescriptions, which are based on the assumption of homogeneous wind lead to main-sequence mass-loss rates that are overestimated by a factor of 2–3 (see section 2 in Smith 2014, and references therein). At the same time, the wind mass-loss rates for the red supergiants may be higher than it follows from the Vink et al. (2001) prescription for hot stars (van Loon 2000), affecting the late evolution of ∼8–35 M⊙ NS progenitor stars.
2.4 Common envelope with Hertzsprung-gap donors
The CE phase is probably the most problematic stage of the binary evolution, as the criteria for the formation and ejection of the envelope are very uncertain (see e.g. Taam & Sandquist 2000; Ivanova et al. 2013, for the review). At the same time, it provides the mechanism to shrink the orbital separation by even a few orders of magnitude, the decrease that is needed to explain the formation of some of the observed close systems (e.g. low-mass X-ray binaries, Liu, van Paradijs & van den Heuvel 2007) and account for the formation of merging double compact objects without dynamical interactions (e.g. Mapelli, Colpi & Zampieri 2009; Rodriguez, Chatterjee & Rasio 2016) or rapid stellar rotation (de Mink & Mandel 2016; Marchant et al. 2016). The radii of progenitors of compact stars in these binaries typically reach 100–1000 R⊙, which is much larger than the required separation for the merging systems (≲ a few solar radii for DNS binary).
In general, CE forms when the MT rate is too high for the accretor to accommodate all of the transferred material (MT is unstable), giving rise to a short-lived phase during which both stars orbit inside a shared envelope. This is believed to lead to a binary spiral-in due to increased friction and, if the envelope is not ejected beforehand (e.g. at the expense of the orbital energy), may lead to its coalescence that aborts further binary evolution and potential DNS formation.
CE initiated by donor stars at the Hertzsprung gap (HG) deserves a particular attention. It is believed that due to lack of the clear distinction between the core and the envelope structure (no steep density drop at the boundary, see Ivanova & Taam 2004), the CE initiated by HG stars most likely leads to premature merger and hence the significant reduction in the expected double compact object merger rates (Belczynski et al. 2007). We refer to stars being on the HG in the same manner as Hurley et al. (2000). Thus, we consider both the stars with hydrogen-rich envelopes transitioning to the red giant branch after the core hydrogen exhaustion and helium-rich stars at the end of the core helium-burning (CHeB) phase that have lost their hydrogen envelopes (e.g. due to binary interaction or strong stellar winds; so-called helium HG). As a substantial fraction of the merging binaries passes through this kind of CE phase, allowing for its survival gives rise to the optimistic (the highest) estimate for the rates (e.g. Dominik et al. 2012, 2013, 2015; de Mink & Belczynski 2015; Belczynski et al. 2016a). However, these optimistic rates are not supported by the current LIGO estimates of BH–BH merger rates (Abbott et al. 2017a). The recent investigations by Pavlovskii & Ivanova (2015) and Pavlovskii et al. (2017) revealed that in some cases where based on earlier studies one would expect the CE initiated by a massive convective giant donor to ensue, the MT may in fact be stable. This might potentially lead to a much higher orbital separation after the MT. In Pavlovskii et al. (2017), they focus on the MT in progenitor binaries of close BH–BH systems with massive HG donors and stellar-mass BH and conclude that even despite the extreme mass ratio the system evolves through stable MT instead of CE and does not form a merging binary. However, so far their studies, and thus the validity of the conclusions, are limited to only a few values of metallicities and cases of MT with compact accretor (i.e. companion star that is far from filling its Roche lobe).
3 COMPUTATIONAL METHOD
3.1 The reference model and applied variations
Apart from the different initial distributions and αIMF, our reference model is identical to the standard model in Dominik et al. (2012) and follows the assumptions discussed in the papers describing the code Belczynski et al. (2002, 2008). Below, we shortly introduce the relevant standard assumptions and variations applied to this standard approach, motivated by the results of studies discussed in Section 2. In other models, only the factors explicitly given are varied, the rest is kept the same as in the reference model. We simulated 2 × 10⁷ ZAMS binaries for each model and each metallicity, unless the other number is provided in the model description. We draw the mass of the primary from the range 4 < Ma < 150 M⊙ and from 0.08 < Mb < 150 M⊙ for the secondary. Our models are summarized in Table 1.
Short description of the models.
| Model | Natal kick | MT | Other |
|---|---|---|---|
| Reference | Std. (CCSN: Hobbs et al. 2005, | Std. (β = 1,fa = 0.5) | |
| with σ = 265 km s−1 | |||
| ECS,AIC: 0) | |||
| BE1 | CCSN: Bray & Eldridge (2016) | Std. | |
| vnk = (70 |$\rm \frac{M_{ej}}{M_{rem}}$| + 120) km s−1 | |||
| ECS,AIC: 0 | |||
| BE2 | CCSN and ECS: Bray & Eldridge (2016) | Std. | |
| vnk = (70 |$\rm \frac{M_{ej}}{M_{rem}}$|+ 120) km s−1 | |||
| AIC: 0 | |||
| BE3 | CCSN, ECS, AIC: | Std. | |
| Bray & Eldridge (2016) | |||
| vnk = (70 |$\rm \frac{M_{ej}}{M_{rem}}$|+ 120) km s−1 | |||
| BE4 | CCSN, ECS, AIC: | Std. | |
| Bray & Eldridge (2016) | |||
| vnk = (60 |$\rm \frac{M_{ej}}{M_{rem}}$|+ 70) km s−1 | |||
| BE5 | CCSN: Bray & Eldridge (2016) | Std. | |
| vnk = (60 |$\rm \frac{M_{ej}}{M_{rem}}$|+ 70) km s−1 | |||
| ECS, AIC: 0 | |||
| NK1 | CCSN: std. | Std. | |
| ECS: Hobbs et al. (2005), σ = 26.5 km s−1 | |||
| AIC: 0 | |||
| NK2 | CCSN: $\left\lbrace{\begin{array}{l}
{\rm flat} : v_{\rm nk} \le 50\, {\rm km}\,{\rm s}^{-1}\\
{\rm Hobbs}\, {\rm et\, al.}
\end{array}}\right.$ (2005) : vnk > 50km s-1 | ||
| Std | |||
| ECS,AIC: 0 | |||
| EC | Std. | Mcbur1 = 1.63 M⊙ | |
| std. | Mcbur2 = 2.45 M⊙ | ||
| (0.4 M⊙ wider range) | |||
| J1 | High J loss β = 5 | ||
| Std. | fa = 0.5 | ||
| J2 | Low J loss β = 0.2 | ||
| Std. | fa = 0.5 | ||
| J3 | High J loss β = 5 | ||
| Std. | fa = 0 | ||
| Non-conservative | |||
| J4 | Low J loss β = 0.2 | ||
| Std. | fa = 0 | ||
| Non-conservative | |||
| J5 | |||
| Std. | fa = 1 | ||
| Conservative | |||
| J6 | Angular momentum loss | ||
| Std. | during MT with NS | ||
| five-times lower | |||
| J7 | Angular momentum loss | ||
| Std. | during MT with NS | ||
| times-times higher | |||
| W1 | Wind mass-loss rates for | ||
| Std. | Std. | H-rich stars 50 per cent lower | |
| for He-rich stars 50 per cent higher | |||
| W2 | Wind mass-loss rates for | ||
| Std. | Std. | H- and He-rich stars | |
| 50 per cent higher | |||
| P | Thermal MT instead of CE | ||
| Std. | Std. | with HG donor | |
| and NS/BH accretor | |||
| C | CCSN: Bray & Eldridge (2016) | Low J loss | Mcbur2 = 2.45 M⊙ |
| vnk = (70 |$\rm \frac{M_{ej}}{M_{rem}}$|+ 120) km s−1 | β = 0.2 | Mcbur1 = 1.63 M⊙ | |
| ECS,AIC: 0 | fa = 0.5 | ||
| C+P | CCSN: Bray & Eldridge (2016) | Low J loss | Mcbur2 = 2.45 M⊙ |
| vnk = (70 |$\rm \frac{M_{ej}}{M_{rem}}$|+ 120) km s−1 | β = 0.2 | Mcbur1 = 1.63 M⊙ | |
| ECS,AIC: 0 | fa = 0.5 | Thermal MT instead of CE with HG donor and NS/BH accretor |
3.1.1 Core-collapse events and the natal kicks
The treatment of the SN explosion is based on a study by Fryer et al. (2012) (the ‘rapid’ supernova model that reproduces the observed mass gap between NS and BH, Belczynski et al. 2012). For CCSN-formed NS, the magnitudes of the natal kicks are drawn from the Maxwellian distribution with the velocity dispersion σ = 265 km s−1, as proposed by Hobbs et al. (2005), with a random direction. For compact objects formed with partial fallback the magnitude of the kick is lowered according to the formula: Vkick = (1 − f)Vnk, where Vnk is the velocity drawn from the distribution and f is the fraction of the mass of the stellar envelope that fallback. Fallback is important only for BH and the most massive NS. The most massive BH form via direct collapse, with zero natal kick (see Belczynski et al. 2016c, for the detailed discussion of BH kicks in StarTrack). We allow for the formation of the NS via ECS and AIC. In our standard approach, no natal kick is added to such a NS. However, if there is a mass ejected from the system, the centre of mass of a binary still gains an additional velocity after the SN (the Blaauw kick; Blaauw 1961)
3.2 Progenitors of the electron-capture supernovae
To decide whether a star explodes as an ECS, we use its He core mass (MHe) at the beginning of the AGB stage to constrain the fate of its CO core, following the study of Hurley et al. (2000), using masses calculated with the same, but updated evolutionary code (Eldridge & Tout 2004a,b).
If MHe < Mcbur1 = 1.83 M⊙, the star forms a degenerate CO core and finishes its evolution as a CO WD. If MHe > Mcbur2 = 2.25 M⊙, a non-degenerate CO core is formed and the star proceeds with burning of heavier elements until an iron core forms and collapses to an NS/BH. Stars with Mcbur1 > MHe > Mcbur2 form partially degenerate CO cores. If such a core reaches the critical mass of 1.08 M⊙ (Hurley et al. 2000), it ignites CO off-centre and non-explosively burns CO into ONe, forming a degenerate ONeMg core. If this core reaches Mecs = 1.38 M⊙, it collapses to an NS in an ECS, otherwise an ONeMg WD is formed, which still can collapse to an NS if its core exceeds Mecs due to accretion of mass during a subsequent Roche lobe overflow (RLOF) phase (AIC channel).
The NS formed in ECS or AIC are assigned, the masses of Mrem,bar = Mecs, corresponding to gravitational mass of 1.26 M⊙. In model electron-capture, we widen the mass range for the He core that can evolve into a degenerate ONeMg core, setting Mcbur1 = 1.63 and Mcbur2 = 2.45.
3.3 Mass loss and angular momentum loss
We also introduce two models with varied wind mass-loss rates. In W1, we lower the rates by a factor of 2 for main-sequence stars, while increasing them by a factor of 2 for helium-rich stars (mass-loss rates for luminous blue variables are kept the same as in the standard model). Dominik et al. (2012) presented the model with lowered wind mass-loss rates in both cases. Although, as discussed in Section 2, the recent findings favour lower main-sequence wind mass losses, we include also the variation W2 with the rates increased by a factor of 2 for completeness.
3.4 Common envelope with Hertzsprung-gap donors
As the fate of the binaries undergoing CE initiated by HG stars is not yet clear, for each model and metallicity, we show the merger rate computed with earlier exclusion of such binaries (submodel B) and the case where we allow them to evolve through CE with our standard assumptions (submodel A).
Additionally, in model P, we force the binary which is about to start the CE evolution (according to our standard criteria, see section 5 in Belczynski et al. 2008) with HG donor and an NS or BH accretor to initiate a stable thermal MT instead.
We also introduce two ‘combo’ models: C which combines the factors that are expected to lead to increased merger rates for DNSs that is the wider ECS channel electron-capture, BE1 model for the natal kicks (CCSN-born NS natal kick ∝ Mej/M,) and low angular momentum losses J2 and C + P model which apart from all of the variations combined in C includes also P variation.
3.5 The merger rates
In this work, we use three different quantities to provide the estimate of the merger rates. The first requires no additional assumption and is simply the number of DNSs merging within the Hubble time in a given model and for a given metallicity. Secondly, we present Galactic merger rates (number of coalescences per unit time within a galaxy) calculated for a fiducial Milky Way-like galaxy (assuming 10 Gyr of continuous star formation at the rate of 3.5 M⊙ yr−1) for a single metallicity, using the same approach as described in section 4 in Dominik et al. (2012).
For each model, we present the results for three metallicities (solar: Z⊙ = 0.02, Villante et al. 2014, 10 per cent Z⊙, and 1 per cent Z⊙), to show the variation of the merger rates with this property.
As a third estimate, we provide the local merger rate density (number of coalescences per unit time per unit volume in the local Universe, i.e. around redshift = 0), calculated with taking into account the star formation rate (SFR) and metallicity evolution with redshift. We adopt the cosmic SFR(z) as in Madau & Dickinson (2014) and metallicity evolution with redshift following the estimate of Madau & Dickinson (2014), but increased by 0.5 dex to better fit observational data (Vangioni et al. 2015, see equation 2 in Belczynski et al. 2016a ). See Appendix B for the details.
4 RESULTS
Only a small fraction of the simulated ZAMS binaries ends up forming a DNS system that will merge within the Hubble time. Many of them get disrupted during the SN, merge during the CE phases or form other types of binaries. The fate of the simulated systems is summarized in the Fig. 1 which also schematically shows the crucial phases of the evolution of the typical merging DNS progenitor. The numbers given in the figure correspond to the reference model and solar metallicity ( Z⊙ = 0.02), however, the leading evolutionary channel for each model consists of the same phases.
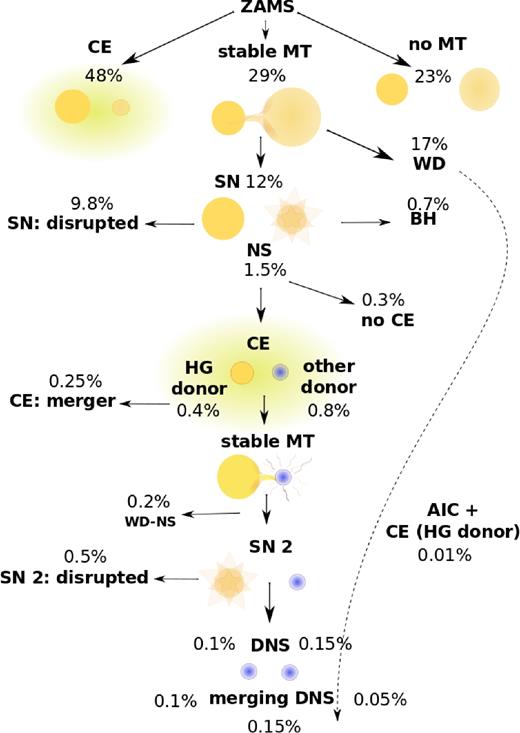
The leading evolutionary channel (in the middle) for the formation of the merging DNS system, shown for the reference model (Section 3.1) and solar metallicity ( Z⊙ = 0.02), simulated with the ZAMS masses from the range 4 M⊙ < Ma < 150 M⊙ and 0.08 M⊙ < Mb < 150 M⊙. The other channels (with the CE or no MT at all before the first SN) produce at most an order of magnitude less merging DNS. We differentiate between the two CE cases: with an HG donor (percentage on the left) and with any other donor (percentage on the right). The latter case constitutes our submodel B, while both contribute to submodel A. All numbers refer to the fraction of the simulated ZAMS binaries. See the text and Appendix C for details.
Most of the merging DNS progenitors encounter stable MT and do not initiate any CE before the first SN. The first SN in such systems is in ∼ 99 per cent [ ∼ 95 per cent] (for submodel B [A]) of cases of electron-capture type. Before the formation of the second NS, the binary passes through the CE phase. We distinguish the case where it was initiated by the HG donor, as it is uncertain whether such a CE should be formed or whether a binary could survive at all (see Section 2.4). The second SN is an iron-core-collapse SN, however, in > 87 per cent of cases the late MT initiated by the expanding naked helium star occurs, which potentially leads to further stripping of the envelope. Only ∼0.15 per cent out of our limited sample of ZAMS binaries (from the simulated mass range 4 M⊙ < Ma < 150 M⊙ and 0.08 M⊙ < Mb < 150 M⊙) ended up as merging DNS formed through the described channel (these binaries comprise the submodel A; ∼0.1 per cent required CE with HG donor and ∼0.05 per cent evolved through the other CE, submodel B). Also a significant number (0.01 per cent of these ZAMS binaries) of the merging DNS forms via AIC of the WD to an NS, yet most of them ( ≳ 90 per cent) require CE with HG donor before the formation of the second NS and thus contribute only to submodel A. Other possible formation channels (requiring CE of any kind or no MT at all before the first SN) produce at least an order of magnitude fewer merging DNS.
Another variation of the main formation channel depicted in Fig. 2 involves a second episode of dynamically unstable MT instead of the stable MT at late stages of evolution of the binary. This variation becomes dominant for subsolar metallicities. Interestingly, we find that the known properties (masses of both NS and mass ratio) of the DNS associated with GW170817 within our simulations are best reproduced with this scenario, as presented with an example shown in Fig. C1.
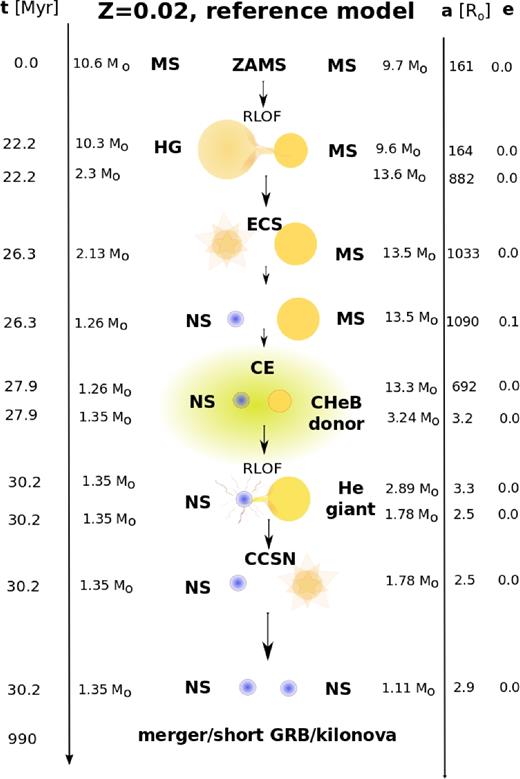
Example evolution of a typical merging DNS progenitor from our simulations, shown for the reference model (see Section 3.1) and solar metallicity ( Z⊙ = 0.02). ZAMS form most likely with relatively small masses ∼10 M⊙ and pass through a stable RLOF phase before the first core-collapse event. The first NS forms in an ECS with no natal kick. The binary passes through the CE phase initiated by CHeB star, shrinking the orbit and leaving behind a helium star, which later on again overfills its Roche lobe and initiates another phase of stable MT. The second supernova occurs and a DNS system is formed, gradually decreasing its separation due to emission of gravitational waves until both stars merge, leading to a strong gravitational wave signal, sGRB and kilonova emission.
4.1 Merger rates
The merger rates calculated for all of the models (number of merging systems, Galactic rates, and local merger rate density and approximate LIGO O3-run detection rates for models where the simulations were performed for all 32 metallicities) are given in Table 2 at the end of this paper. We focus on the differences with respect to the reference model. Fig. 3 shows the comparison between the Galactic rates obtained for different models and metallicities. The shaded regions around the dashed horizontal lines enclose the points corresponding to the Galactic rates with the values within an order of magnitude deviation from the reference model (blue – submodel B which excludes the binaries evolving through HG donor CE, red – submodel A without their exclusion).
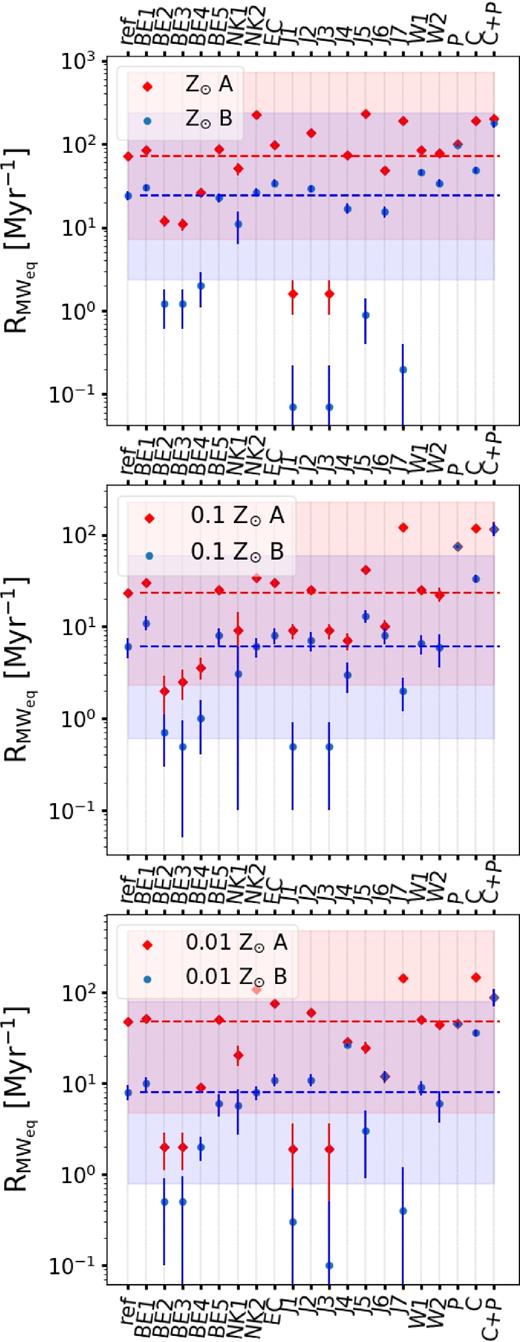
Comparison between the Galactic (Milky Way – equivalent galaxy) merger rates estimated for different models (see Table 1 for the description and Table 2 for the numbers). Panels from top to bottom show the rates for solar metallicity Z⊙, 10 per cent Z⊙, and 1 per cent Z⊙. Blue circles represent the merger rates calculated without the systems undergoing CE initiated by HG donor star, while the red diamonds represents the estimates obtained without their exclusion. The blue (lower) and red (upper) dashed lines show the corresponding rates for the reference model. The vertical error bars mark the Poisson errors. The shaded areas around those lines limit the values located within an order of magnitude deviation from the reference model.
Merger rate – measures for different models and metallicities. The first column specifies the model and the second one metallicity. The third column gives the number of merging DNS systems for solar and two subsolar metallicities. The fourth presents the Galactic rates |$R_{{\rm MW}_{{\rm Eq}}}$| calculated for a Milky Way-equivalent galaxy, also for the three metallicities. The rates given in brackets are calculated with allowing for CE initiated by HG donors, while the other rates were calculated with exclusion of these systems (assuming that they do not contribute to the merging population). For those models where the simulations were performed for all 32 metallicities, the local merger rate density Rlocal is shown in the last column. In the same column, below the local merger rate density, we give the approximate LIGO O3 detection rates Rdet; O3 calculated using 5, assuming the DNS horizon distance of ∼385 Mpc (DNS range 170 Mpc) as discussed in Section 3.5 and the advanced LIGO detection rates Rdet; adv assuming DNS horizon distance of ∼487 Mpc (DNS range 215 Mpc). The number of simulated ZAMS binaries was Nsim = 2 × 10⁷, unless the other number is provided in the first column.
| Rlocal (Gpc− 3 yr− 1) | ||||
|---|---|---|---|---|
| Model | Metallicity | N(Tmr <13.7 Gyr) | |$R_{{\rm MW}_{{\rm Eq}}}$| (Myr−1) | Rdet; O3 (yr− 1) |
| Rdet; adv (yr− 1) | ||||
| Reference | Z⊙: | 8305 [24088] | 24.1 [72.5] | 48.4 [190.4] |
| 10 per centZ⊙: | 2318 [7693] | 6.5 [22.8] | 0.5 [1.8] | |
| 1 per centZ⊙: | 2694 [15830] | 7.6 [48.3] | 0.9 [3.6] | |
| BE1 | Z⊙: | 10798 [28960] | 30.5 [85.5] | 87.0 [244.8] |
| 10 per centZ⊙: | 4157 [10317] | 11.5 [30.4] | 0.8 [2.4] | |
| 1 per centZ⊙: | 3736 [17302] | 10.3 [52.3] | 1.7 [4.8] | |
| BE2 | Z⊙: | 434 [4054] | 1.2 [12.3] | 2.3 [26.0] |
| 10 per centZ⊙: | 218 [805] | 0.7 [2.4] | 0.03 [0.3] | |
| 1 per centZ⊙: | 191 [687] | 0.5 [2.1] | 0.05 [0.6] | |
| BE3 | Z⊙: | 414 [3691] | 1.3 [11.3] | 2.3 [25.9] |
| 10 per centZ⊙: | 215 [836] | 0.6 [2.5] | 0.03 [0.3] | |
| 1 per centZ⊙: | 192 [694] | 0.6 [2.1] | 0.05 [0.6] | |
| BE4 | Z⊙: | 885 [8835] | 2.2 [26.9] | – |
| 10 per centZ⊙: | 400 [1251] | 1.0 [3.5] | ||
| 1 per centZ⊙: | 727 [3010] | 2.0 [9.1] | ||
| BE5 | Z⊙: | 8614 [30087] | 23.4 [88.5] | 79.7 [236.7] |
| 10 per centZ⊙: | 3173 [8737] | 8.5 [25.1] | 0.8 [2.3] | |
| 1 per centZ⊙: | 2534 [17195] | 6.5 [51.9] | 1.6 [4.7] | |
| NK1 | Z⊙: | 359 [1648] | 10.6 [50.8] | – |
| 10 per centZ⊙: | 106 [303] | 3.1 [9.1] | ||
| Nsim = 2 × 10⁶ | 1 per centZ⊙: | 193 [668] | 5.7 [20.6] | |
| NK2 | Z⊙: | 9391 [75536] | 26.5 [229.9] | 45.7 [379.0] |
| 10 per centZ⊙: | 2129 [11678] | 5.9 [35.3] | 0.5 [3.9] | |
| 1 per centZ⊙: | 3013 [35873] | 8.4 [109.6] | 1.0 [7.9] | |
| EC | Z⊙: | 11522 [32589] | 34.0 [98.3] | 64.5 [250.1] |
| 10 per centZ⊙: | 2888 [10214] | 8.0 [30.5] | 0.6 [2.4] | |
| 1 per centZ⊙: | 4083 [25523] | 11.7 [78.4] | 1.3 [4.9] | |
| J1 | Z⊙: | 24 [557] | 0.1 [1.7] | 1.6 [12.4] |
| 10 per centZ⊙: | 181 [3104] | 0.5 [9.5] | 0.02 [0.1] | |
| 1 per centZ⊙: | 64 [612] | 0.3 [1.9] | 0.04 [0.3] | |
| J2 | Z⊙: | 10067 [45532] | 29.3 [137.5] | 61.7 [256.5] |
| 10 per centZ⊙: | 2664 [8751] | 7.4 [25.7] | 0.6 [2.5] | |
| 1 per centZ⊙: | 3928 [20424] | 11.3 [61.8] | 1.2 [5.0] | |
| J3 | Z⊙: | 24 [558] | 0.1 [1.6] | 1.5 [12.0] |
| 10 per centZ⊙: | 181 [3106] | 0.5 [9.5] | 0.02 [0.1] | |
| 1 per centZ⊙: | 64 [614] | 0.1 [1.9] | 0.03 [0.3] | |
| J4 | Z⊙: | 5980 [24572] | 16.9 [73.7] | – |
| 10 per centZ⊙: | 1396 [2509] | 4.0 [7.3] | ||
| 1 per centZ⊙: | 8547 [9304] | 26.5 [28.5] | ||
| J5 | Z⊙: | 350 [77222] | 1.0 [234.7] | 57.5 [294.9] |
| 10 per centZ⊙: | 4784 [14685] | 13.4 [42.4] | 0.6 [3.2] | |
| 1 per centZ⊙: | 1099 [8661] | 3.1 [26.4] | 1.3 [6.5] | |
| J6 | Z⊙: | 5616 [17258] | 15.5 [49.0] | – |
| 10 per centZ⊙: | 2826 [3531] | 8.1 [9.9] | ||
| 1 per centZ⊙: | 4160 [4176] | 12.0 [12.2] | ||
| J7* | Z⊙: | 69 [62536] | 0.2 [191.1] | 16.7 [6.9] |
| 10 per centZ⊙: | 821 [40109] | 2.0 [122.3] | 0.2 [0.1] | |
| 1 per cent Z⊙: | 125 [46946] | 0.4 [143.4] | 0.3 [0.1] | |
| W1* | Z⊙: | 15487 [29027] | 46.6 [86.9] | 52.2 [40.3] |
| 10 per cent Z⊙: | 2337 [8651] | 6.6 [25.5] | 0.5 [0.4] | |
| 1 per cent Z⊙: | 3117 [16776] | 8.9 [51.3] | 1.0 [0.8] | |
| W2 | Z⊙: | 11812 [26860] | 34.7 [80.1] | 53.9 [187.5] |
| 10 per cent Z⊙: | 5911 [15290] | 5.9 [22.3] | 0.5 [1.8] | |
| 1 per cent Z⊙: | 2160 [14580] | 6.2 [44.6] | 1.1 [3.6] | |
| P* | Z⊙: | 16161 [17036] | 96.3 [101.2] | 89.6 [136.4] |
| Nsim = 1 × 10⁷ | 10 per cent Z⊙: | 12580 [12580] | 74.0 [74.0] | 0.9 [1.3] |
| 1 per cent Z⊙: | 7578 [7578] | 45.0 [45.1] | 1.8 [2.7] | |
| C* | Z⊙: | 17026 [65236] | 47.9 [193.0] | 143.3 [448.4] |
| 10 per cent Z⊙: | 11703 [40554] | 33.1 [119.0] | 1.4 [4.4] | |
| 1 per cent Z⊙: | 12721 [50320] | 36.2 [149.5] | 2.8 [8.8] | |
| C+P* | Z⊙: | 6057 [6700] | 180.5 [199.3] | 600.5 [631.4] |
| 10 per cent Z⊙: | 3889 [3890] | 115.2 [116.2] | 5.7 [6.0] | |
| 1 per cent Z⊙: | 3016 [3016] | 90.0 [90.0] | 11.5 [12.1] | |
Notes. *Local merger rate density was calculated with 2 × 10⁶ ZAMS binaries simulated per metallicity).
Three immediate conclusions emerge from this comparison:
In physical models that we consider relevant for the Milky Way (submodels B, Z = Z⊙; see the top panel in Fig. 3, blue), the typical NS–NS merger rates are moderate ∼25 Myr−1 (ref model), with very little variation to increased rates (maximum rates: ∼100 Myr−1: model P and ∼50 Myr−1: models W1 and C), and rather significant potential to decrease rates (min rates: ∼0.1 Myr−1; models J1, J3). None of the applied variations resulted in increase of the NS–NS merger rates with respect to the reference model by an order of magnitude or higher, which we would consider a significant change.
In many cases, the difference between the submodels A and B within the same model is bigger than an order of magnitude, especially in cases with increased angular momentum losses in the J set of models, but also in the models BE2, BE3, and NK2 with non-standard treatment of the natal kicks. An extreme example is the model J7, where this difference for the solar metallicity is ∼103.
Certain variations applied to the standard treatment of the angular momentum loss and the natal kicks can severely decrease the predicted merger rates for NS–NS binaries. The biggest drop with respect to the reference model (over two orders of magnitude) is present at Z⊙ in submodel B for models J1 and J3 with extremely high angular momentum loss during the stable MT with non-degenerate accretor. The change in other direction: models J2 and J4 with very low angular momentum losses, does not reveal a similarly considerable effect on the merger rates.
4.1.1 The reference-like models
There is a group of models for which the Galactic merger rates in all cases, i.e. for all metallicities and in both submodel A and B remain close (within a factor of 3) to the reference model. These are BE1, BE5, NK1, electron-capture, J2, J4, W1, and W2. We refer to them as the reference-like models. The rates predicted for model J6 (with lowered angular momentum losses during MT with NS accretor) always stay close to the reference value in variation B, while for the submodel A the rates drop for subsolar metallicities with respect to the submodel A reference value, so that variations A and B lead to the same results (no CE initiated by HG stars). We consider these deviations from the reference model as small (changes are comparable to the effect of the use of a different normalization) and will not discuss these models in more details.
4.1.2 Models leading to increased rates
We find just two models in which the rates are systematically higher than the reference value by more than a factor of 2 in all cases and it is the model C which combines several factors favouring the formation of the merging DNS (combination of the reference-like models electron-capture, J2, and BE1) and another version of this model called C + P, which incorporates also variation introduced in model P (discussed in Section 4.2). The decreased angular momentum loss during the MT with non-degenerate accretor (J2) pushes more systems to the preferred formation path (see Fig. 1) of the merging DNS, by avoiding CE before the formation of the first compact remnant. The orbit in this case stays relatively wider as the primary star expands and the early interaction is more likely to remain stable.
The wider range for the core mass which can lead to an electron-capture triggered collapse allows more stars to explode in ECS during the formation of the first NS, decreasing the fraction of systems disrupting during the critical first supernova (as there is no natal kick added). The inclusion of BE1 variation additionally increases the number of binaries surviving the second SN. Most of the potential progenitors of the merging DNS are stripped of their outer layers during the late MT phases, thus when the natal kick velocity is assumed to be proportional to the mass of the ejected envelope, the second NS generally forms with smaller birth velocity than in the reference model.
Also relatively high rates (irrespective of the metallicity) are predicted for the submodel J7 A, in which the angular momentum losses during MT with NS accretor were doubled. In this case, all binaries consisting of an NS and an evolving companion that in the reference model would pass through CE and then encounter the stable MT phase initiated by an expanding helium star as the CHeB ceases (‘helium HG’), encounter the second CE instead, which is much more efficient in shrinking the orbit, and thus increasing the number of merging systems. As the donor is an HG star, these binaries always add up to submodel A, as a consequence lowering the rates for the B variation in this model. Similarly in submodel J5A (fully conservative MT) for Z⊙, the rates grow due to increased number of systems encountering two subsequent CE phases after the formation of the first NS. However, this time it is due to the fact that the secondary star gained more mass, while still being on the main sequence (as the whole transferred material is added to the secondary star) during the stable MT. It affects its later evolution so that it initiates the CE during the CHeB phase rather than on the red giant branch, which leads to smaller final separation. This is due to the different value of λ parameter (describing the binding energy of the envelope) at these stages – the value is smaller during the CHeB, so more orbital energy is needed to eject the envelope than in the case of CE with a donor star on the red giant branch. Smaller separation at the end of this CE evolution favours the occurrence of the subsequent CE phase with HG donor (see Dominik et al. 2012, for more thorough discussion of this case).
Model NK2, which forces half of the CCSN to lead to small natal kicks (<50 km s−1) enables to increase the rates only in submodel A, while for B the rates remain very close to the reference values. In this variation, twice more binaries with NS survive the first SN. These ‘additional’ systems are relatively wide and otherwise would be disrupted, or even more widened due to large natal kick, so that they would not interact anymore and not contribute to the merging population. The binaries that received a chance to survive the first SN in this model need to decrease their orbital separation even more than those that would survive under the standard conditions. We find that in order to contribute to the merging population, they have to evolve through the two subsequent CE phases as in the model J5 A and so they increase the number of the merging systems only if the CE with the HG donor is allowed.
4.1.3 Models leading to decreased rates
Similarly, one can distinguish the low-rate group of models which in all cases lead to at least twice lower estimates than the reference model. These are BE2, BE3, and BE4 – models with the natal kicks treated according to the prescription suggested by Bray & Eldridge (2016), but applied to an NS that formed in CCSN, ECS, and in BE4, 3 also AIC, and also the models J1 and J3 with high angular momentum losses during MT with non-compact accretor. In the listed BE variations, the decrease is a consequence of adding a natal kick velocity after the NS formation in an ECS. As can be seen in Fig. 4, in those models which allow for it, the first NS forms with the natal kick close to zero. In the reference model, the first SN in 99 per cent (in submodel B and 95 per cent in submodel A) of the merging DNS binaries was of electron-capture type, where the zero natal kick guaranteed that the binary will remain bound. In BE4(BE2, 3), the natal kick after ECS is at least 70 km s−1 (120 km s−1) and can be higher depending on the mass of the ejected envelope (in our simulations, this mass is within the range 0.12–0.9 M⊙). This causes many potential progenitors of the merging NS–NS binaries to disrupt and hence lowers the rates. Similarly, the drop in the number of merging DNS (albeit smaller) is also present in model NK1, where the natal kicks after ECS are drawn from a Maxwellian distribution with 1D σ = 26.5 km s− 1 peaking around 40 km s−1. In models J1 and J3, the extreme angular momentum loss during the early MT practically quenches the formation channel described in C. The merging DNS progenitors pass through the CE before the first NS can form, where the great majority of them coalesces prematurely.

Comparison of the magnitudes of the natal kick velocities gained by NS that form the merging DNSs. The solid line shows the cumulative distribution of the natal kicks gained after the first SN in the binary, while the dashed one demonstrates the cumulative distribution of these velocities after the second SN. The distribution for model BE2 is nearly identical to the one presented for the model BE3. As before the formation of the first compact object, the orbit is still relatively wide, the first NS in the progenitor of merging DNS system forms with very small natal kick velocity (otherwise the binary is disrupted; note that these velocities can be much bigger after the second SN, when the orbit is much more compact).
The rates in submodels J5 B and J7 B drop due to the reasons discussed in the previous section.
4.2 Model P
In variation P, we force a thermal-time-scale stable MT in place of the CE initiated by an HG donor star, when the accreting star is an NS or BH. This is the very provisional attempt to demonstrate the effect of the recent findings of Pavlovskii & Ivanova (2015) and Pavlovskii et al. (2017) discussed in Section 2.4 and should be treated with caution, as the case of the NS accretor was not studied in detail by the authors and neither the time-scale of the stable MT, nor the exact condition for the eventual onset of the unstable MT are known. Our forced MT, if not completed earlier, may instantaneously finish with the CE when the donor star evolves off the HG, if the standard conditions for the onset of CE are then fulfilled. However, at Z⊙ nearly half of the merging population forms with no CE at all and this fraction is even higher for 10 per cent of the solar metallicity. The MT with a compact accretor is limited by the Eddington rate and if the rate is exceeded, the mass is lost from the binary (non-conservative MT; in the discussed case the MT is highly non-conservative as the Eddington rate is exceeded by a few orders of magnitude) and the excess material escapes from the vicinity of the compact accretor, carrying away significant angular momentum (jloss ∼ Mdonor/Maccretor). Such an MT with NS always leads to decrease in the orbital separation (Mdonor > Maccretor), favouring the formation of the merging system. In fact, we find that the merger rates increased with respect to the reference model and variation A and B lead to nearly the same result, differing only (there still can be a CE with HG donor with non-compact/WD accretor), due to CE initiated by HG donor with WD in the AIC channel.
5 CONFRONTATION WITH THE OBSERVATIONAL LIMITS
5.1 Observational limits for DNS merger rates
There are several astrophysical sources on which the observational limits on DNS coalescence rates can base. The first approach benefits from the fact that, unlike in case of BHNS or BHBH binaries (apart from the merger signatures), we directly observe DNS systems and relies on the investigation of the properties of the Galactic population of DNSs (Kim, Kalogera & Lorimer 2010; O'Shaughnessy & Kim 2010; Kim, Perera & McLaughlin 2015). By properly including the selection effects of the pulsar searches which detected these systems, one can estimate the total rate of merging DNS binaries within the galaxy. To date there are 12 known DNS residing within the Galactic disc, one candidate system3 and two binaries found within globular clusters (see table 1 in Chruslinska et al. 2017, and references therein), where the dynamical formation scenario cannot be excluded and thus they cannot be used to constrain the merger rates for the isolated channel. The most recent estimates that use the disc Galactic sample were obtained by Kim et al. (2015) and are based on three systems B1913+16, B1534+12, and J0737−3039A,B (the double pulsar, both pulsar A and B were used to constrain the rates). The authors provide the range of 7–49 Myr− 1 at 95 per cent confidence, with the median value of 21 Myr− 1 as their best estimate for the NS–NS Galactic merger rates. However, this type of analysis has a number of important caveats. First, the number of observed merging DNS is very scarce and inclusion of a single newly observed system may affect the predicted rates by a factor of a few as revealed by the example of J1906+0746 provided by Kim et al. (2010) which, if included in the analysis, would increase the rates by a factor of ∼2. To our knowledge, these estimates were not revised to evaluate the impact of the most recently discovered systems. One should also bear in mind that such extrapolations assume that the observed sample is representative of the underlying Galactic population. Uncertainties may also arise due to the estimation of the beaming fraction (the fraction of the sky covered by the pulsar radiation beam) and the pulsar age (O'Shaughnessy & Kim 2010). However, probably the biggest uncertainties are related to the treatment of the pulsar luminosity function, necessary to model the selection effects, but weakly constrained by observations (e.g. appendix in O'Shaughnessy & Kim 2010). In fact, different choices for the pulsar luminosity distribution are allowed within the observational limits and these can change the estimated merger rates by an order of magnitude (Mandel & O'Shaughnessy 2010).
Apart from the Galactic population short gamma-ray bursts (sGRB) may provide constraints on DNS merger rates. The binary compact object merger scenario is so far the most successful in explaining the observational properties of sGRB. However, NS–NS mergers are only one of the possible sGRB progenitors and currently other candidates (BH–NS mergers) cannot be excluded (e.g. Berger 2014). As a result, they may contribute to only a fraction of the observed events. Petrillo, Dietz & Cavaglià (2013) estimated the merger rates based on the sGRB observed by SWIFT, restricting the analysed sample to observations with well determined redshift and certain association with an optical counterpart. They obtained the coalescence rates in the local universe ranging from 500 to 1500 Gpc− 3 yr− 1. This result is, however, strongly dependent on the weakly constrained beaming angle θj of the collimated emission from the sGRB, as stressed by the authors (see Fig. 3 therein). Increasing the angle would relax the limits on merger rates. If the angle is a factor of 2 smaller than assumed by the authors, the merger rate could be as high as several thousand Gpc− 3 yr− 1 (θj ∼ 10°), while increasing the angle by a factor of 2 would decrease the rate to around 200 Gpc− 3 yr− 1 (θj ∼ 40°).
The question of the beaming angle and its impact on the merger rates that base on sGRB was also addressed by Fong et al. (2015). They show that using four events for which the measurement of θj was possible would lead to the median θj = 6 ± 1° for sGRB. However, present observations are biased towards the events with small θj, as most of the events fade before the detection of the jet break (necessary for determination of the opening angle) is possible and only allow for a lower limit on θj. The authors include seven events with the lower limits θj ≳ 5° (arguing that shallower lower limits would not have a significant effect on the θj distribution) and show that if the whole range of opening angles is allowed (θj ≤ 90°), the median would shift to |$\theta _{{\rm j}} = 33_{-27^{\circ }}^{+38^{\circ }}$|. Setting the maximum opening angle θj; max = 30° (as suggested by the simulations, e.g. Rezzolla et al. 2011) results in the median of |$\theta _{{\rm j}} = 16_{-10^{\circ }}^{+11^{\circ }}$|. Using this last estimate, Fong et al. (2015) obtain the local merger rate density of |$270^{+1580}_{-180} \ \rm Gpc^{-3} \ yr^{-1}$|.
Another estimate is based on the analysis of a sample of eight sGRB observed by SWIFT with well-determined redshifts and comes from Coward et al. (2012). They infer the rates by relying on single events and correcting for biases of the detector, avoiding the uncertain distributions needed to describe the whole population (e.g. beaming angles and luminosity function). They provide the limits for the local sGRB rate density for two extreme cases: the lower limit assuming isotropic emission and the upper limit using the observed beaming angle of each sGRB or the smallest θj from the data if the measurement is unavailable. The obtained values are |$8^{+5}_{-3}$| and |$1100^{+700}_{-470}$| Gpc− 3 yr− 1, respectively.
Theoretically, one expects a weak optical/near-infrared (NIR) afterglow associated with sGRB, due to radioactive decay of the r-process material produced during the NS–NS/BH–NS merger, so called kilonova (or macronova) (Li & Paczyński 1998). Besides the one associated with the first detection of gravitational waves from merging DNS, so far two observational candidates for kilonovae were reported (Berger, Fong & Chornock 2013; Tanvir et al. 2013; Jin et al. 2016). Using the latter two observations as constraints, Jin et al. (2016) estimated the local compact objects merger rate (NS–NS and/or BH–NS mergers) to be |$\rm 16.3^{+16.3}_{-8.2} \ Gpc^{-3}\, yr^{-1}$| (dependent on the beaming angle). The authors stress, however, that this estimate should be taken as a lower limit. This estimate of course suffers from the very poor number of constraining observations and will likely change when the new observation will be taken into account. Furthermore, the interpretation of these observations as kilonovae was questioned with the recent simulation results of the emission from the r-process ejecta (Fontes et al. 2017). We thus quote the above results for completeness, but focus mainly on the other observational constraints.
Finally, the first detection of gravitational waves from merging DNSs enables to put another constraint on the local merger rate density of these systems (Abbott et al. 2017b), resulting in the range of |$1540^{+3200}_{-1220}$| Gpc− 3 yr− 1.
5.2 Comparison with observations
5.2.1 The Galactic rates
We begin with a comparison of our Galactic merger rates with the limits imposed by the observations of the Galactic population of merging DNS discussed in Section 5.1. As the distribution of the delay times (the difference between the merger time and the birth time; see Fig. 5) for merging DNS in our simulations is strongly peaked at a few hundred Myr and then decreases sharply irrespective of the model, the present-day merging population will be composed mainly of the binaries that formed a few hundred Myr ago. The observational studies of the age–metallicity relation for the Milky Way reveal that this relation is nearly flat until ∼8 Gyr ago (e.g. Bergemann et al. 2014). Although a significant scatter in metallicity around Z⊙ is found at any age, it drops below 30 per cent Z⊙ only at lookback times greater than 8 Gyr.
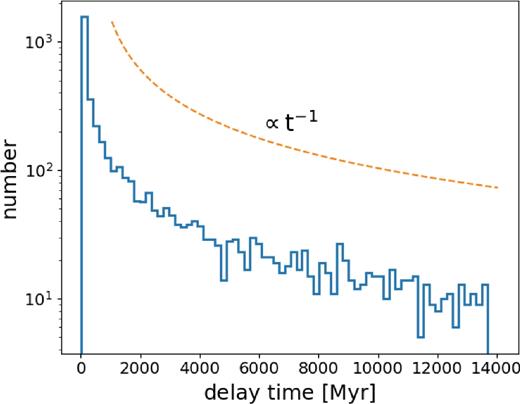
Histogram of the delay times plotted for the reference model and solar metallicity. The line ∝ t−1 is shown for comparison. The distribution of the delay times is strongly peaked at a few hundred Myr and then decreases sharply irrespective of the model.
We thus use the Galactic rates obtained for solar metallicity for comparison with the results obtained by Kim et al. (2015). This comparison is depicted in Fig. 6. The simulations results are shown as red diamonds (submodel A) and blue dots (submodel B) with the dashed lines in the corresponding colours marking the values obtained for the reference model. The vertical ‘error bars’ spreading by a factor of 2 up and down were added to the estimated values, as a conservative limits on the systematic changes (affecting all of the models) of the results due to different calculation of the normalization [e.g. the higher constant Galactic SFR as used by Mennekens & Vanbeveren (2014) would increase all of the rates by a factor of ∼1.3] or different assumptions about the binary fraction [e.g. using low binary fraction fbin = 0.5 as in Dominik et al. (2012) would decrease the rates by a factor of ∼1.8]. The green horizontal line marks the location of the median value obtained by Kim et al. (2015) and the hatched region the uncertainties to their best estimate. Additionally, the shaded green region encloses the merger rate estimates contained within an order of magnitude deviation from the median found by Kim et al., to indicate the potential uncertainties due to different assumptions about the pulsar luminosity distribution [we will refer to these limits as extended limits, to distinguish from the more restrictive bounds provided by Kim et al. (2015) based on their reference model].
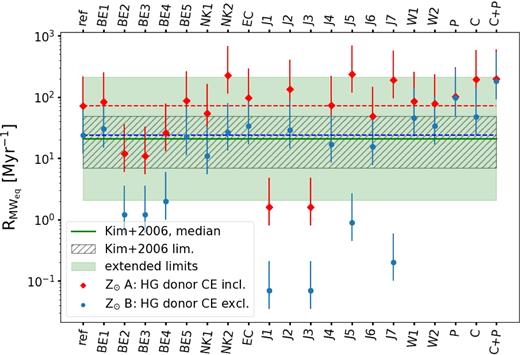
Comparison between the Galactic DNS merger rates estimated for different population synthesis models (see Tables 1 and 2) and the observational limits obtained by Kim et al. (2015). The red diamonds show the rates obtained for submodel A, while blue dots for submodel B, the red and blue dashed lines mark the corresponding values obtained for the reference model. The vertical bars show the spread by a factor of 2 up and down around the estimated merger rate values. The green line marks the best estimate obtained by Kim et al., while the hatched region indicates the reported 95 per cent confidence limits around the median value. The shaded region extends to a factor of 10 up and down around this median, corresponding to the uncertainties due to different assumptions about the pulsar luminosity distribution.
It is found that the Galactic merger rate obtained for our reference model (24 Myr−1) corresponds almost exactly to the median of the most recent DNS merger rate estimate for the Galaxy (21 Myr−1, Kim et al. 2015). Thus, the B submodels of all of the reference-like models are consistent with the observations within the more restrictive limits (the hatched region). These contain also model J6 and submodels BE2, 3, 4 A and NK2 B. The reference value for the submodel A (and most of the rates for other models in this variation) lies outside these restrictive bounds, however, it cannot be excluded as long as the extended limits are considered. Only submodels J1, 3, 7 B with extreme angular momentum losses lie completely outside the extended observational limits.
5.2.2 The local merger rate density
We provide the estimates of the local merger rates calculated as described in Appendix B for 17 out of 21 models presented in this study (for merely technical reasons, as it is computationally expensive to obtain the simulations for the full set of 32 metallicities which are used to calculate the rates). For those models, we confront the calculated rates with the observational limits from sGRB observations and gravitational waves searches. The comparison is depicted in Fig. 7. There is a number of poorly constrained components within our cosmological calculations that are responsible for the build-up of the final uncertainty associated with our estimated NS–NS merger rate density (see Appendix B2.1). These uncertainties are still much smaller than those associated with the evolutionary assumptions, reflected in differences between various models presented in this study. Similarly as in case of the Galactic rates, we put a rough limit on these uncertainties, allowing for a variation within a factor of 2 of our estimates. However, a more careful evaluation of the uncertainties related to such calculations would be desirable. The rates for submodel A and B are plotted as in Fig. 6. We show the limits based on the first detection of gravitational waves from DNS merger (Abbott et al. 2017b, purple lines). We then indicate the short GRB-based limits on the DNS merger rate density as discussed in Section 5.1. The hatched region shows the limits derived by Petrillo et al. (2013) based on sGRB observations, using their standard value of the beaming angle of 20°. Green lines indicate the upper limit estimated by these authors if this angle would be smaller (∼10°) and the lower limit obtained assuming a weakly collimated emission (60°). The orange lines correspond to the limits provided by Fong et al. (2015) and the light blue lines show the upper and lower limits found by Coward et al. (2012). Finally, the lower limit reported by Jin et al. (2016) based on the observations of the potential two kilonova candidates is marked with the brown line.
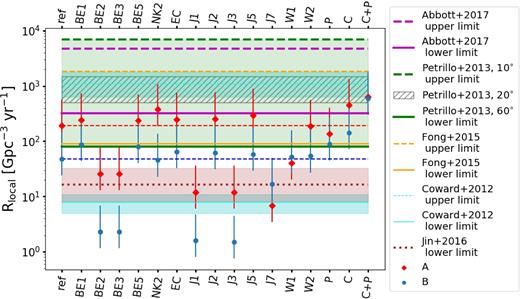
Comparison between the local DNS merger rate density estimated for different population synthesis models (see Tables 1 and 2) and the observational limits on short GRBs and DNS merger rates. The red diamonds show the rates obtained from the simulations for variation A (HG donors in CE allowed), while blue dots for variation B (HG donors in CE not allowed). The red and blue dashed lines mark the corresponding values obtained for the reference model (ref). The vertical bars show the spread by a factor of 2 up and down around the estimated merger rate values. The purple lines mark the upper (dashed) and lower (solid) limits obtained from the first detection of gravitational waves from the merging DNS (Abbott et al. 2017b). The hatched region indicates the range obtained by Petrillo et al. (2013) based on the short GRB observations, with the default value of the beaming angle (20°). The green shaded region spans between the upper limit assuming the beaming angle 10° and the lower limit assuming weakly collimated emission (60°, see fig. 3 in Petrillo et al.). The orange lines mark the upper (dashed) and lower (solid) limits reported by Fong et al. (2015), also based on sGRB observations. The limits from another sGRB study by Coward et al. (2012) are plotted in light blue. The shaded regions in the same colour indicate the uncertainties of these calculations reported by the authors. The brown line indicates the lower limit reported by Jin et al. (2016) based on the observations of the potential two kilonova candidates (the shaded region gives the uncertainty limits; kilonova associated with GW170817 is not included and will likely affect the range).
Only three of the models probed within this study produce enough NS–NS mergers in the local Universe to meet the most constraining observational limits on the local DNS merger rate density that were imposed by the first detection of gravitational waves from coalescing DNSs. These are our combined models: C in variation A and C + P (differing in the treatment of unstable MT with HG donor and NS/BH accretor), as well as submodel NK2 A which introduces a high fraction of CCSN leading to small (≤50 km s−1) natal kicks. A number of other models in variation A is only marginally (within the uncertainty limits) consistent with this observational constraint. These are variations A of the models BE1, 5, ECS, J2, 5, W2, P, and our reference model. The other models, including the most standard one – reference in variation B, fail to meet the constraints based on gravitational waves observations.
The last column of Table 2 contains the approximate LIGO detection rates (number of expected detections per year of observations), calculated using the formula (5) and assuming the detector will reach the maximum expected O3-run DNS range and its intended DNS range for the advanced stage (corresponding to Dh ∼ 385 and ∼487 Mpc, respectively, Abbott et al. 2016a). The three models that fall within the limits from Abbott et al. (2017b) predict ∼8–12 detections per year of operation of the advanced detectors with their full planned sensitivity.
All of the models (A and B, all variations) fall below the upper limits on sGRBs calculated by Petrilo et al., Fong et al., and Coward et al. Our physical models B, including the reference model are mostly below or very close to the sGRB lower limits reported by Fong et al. and Petrillo et al. (which account for the beamed emission from sGRB, in contrast to the very broad lower limit by Coward et al., calculated for isotropic emission). This indicates that our model framework B that seems to well reproduce DNS merger rates in the Milky Way is not sufficient to deliver enough mergers to explain all cosmic sGRB. However, it should be noted that NS–NS mergers are only one of the potential progenitors of sGRB and some fraction of these events may be associated with BH–NS mergers, so it is presently not justifiable to rule out these models on that basis. Most of the models in variation A (apart from BE2, 3, W1, and J1, 3, 7) are above these lower limits. Submodel A is found to overproduce BH–BH mergers (Belczynski et al. 2016a), however, it cannot be ruled out for lower mass stars (DNS progenitors).
Submodels BE2, 3 B (requiring substantial natal kicks after ECS) and J1, 3 B and J7 A (assuming extremely high angular momentum loss during the MT) leading to the lowest estimated rates fall below the lower limit from the study of Jin et al. (2016). Submodels BE2, 3 B are marginally consistent with the broad lower limit reported by Coward et al. (2012), while J1, 3 B are in tension with this estimate. These models can be excluded as non-physical within the framework of our calculations.
6 DISCUSSION
We find that the treatment of the CE remains the main source of evolutionary uncertainties, affecting the predictions of the merger rates for DNSs by even more than two orders of magnitude (e.g. our submodel J7 A and J7 B). The importance of this phase for the merger rates was analysed by a number of authors, who focused on different assumptions regarding the CE evolution. For instance, Voss & Tauris (2003) investigated the effect of changing the critical mass ratio required for the MT with helium stars to become unstable. They find that the changes of this ratio can decrease the DNS rates by a factor of ∼3. Several studies demonstrate the effect of using different, fixed values (although it is generally accepted that this parameter should vary depending on the evolutionary stage of the donor) of the envelope binding energy parameter λ (e.g. Voss & Tauris 2003; Dominik et al. 2012). Using λ = 0.5, Voss & Tauris (2003) find the increase in the rates with respect to their reference model, while Dominik et al. (2012) find that either using very low or very high values decreases the rates. The codes used in both studies use different prescriptions for the parameters of the CE in their reference models, thus the comparison is not straightforward, none the less both identify λ as a factor that can easily shift the DNS rates by an order of magnitude. Dominik et al. (2012) and Mennekens & Vanbeveren (2014) show the influence of varying the second parameter of the CE αCE (efficiency of the ejection of the envelope when decreasing the orbital separation). Both groups show that increasing the αCE five times can affect the rates by a factor of a few (Dominik et al. 2012 find the increase in submodel A and decrease in B, while Mennekens & Vanbeveren 2014 find the rates to increase). Lowering αCE decreases the rates in Mennekens & Vanbeveren (2014, lowering αCE 10 times makes DNS merger rates drop to zero; see their model 6 and 8), while Dominik et al. (2012) find a slight increase (in both variation A and B) when decreasing αCE five times.
Here, motivated by the recent studies by Pavlovskii & Ivanova (2015) and Pavlovskii et al. (2017), we pay particular attention to the case when CE is initiated by the donor star passing through the HG phase. Apart from differentiating between the cases when we allow for the CE in that case to ensue (A) and the case when we exclude those systems (B), assuming that they should not contribute to the merging population, we also include a model P where we force the stable thermal-time-scale MT in place of the CE initiated by an HG star when the companion is an NS or a BH. The results show that the simple exclusion of these systems may not be justified. The stable MT with a compact accretor does not lead to a net expansion of the orbital separation as is often the case with an early MT phase and in fact is able to shrink the orbit enough to allow for the formation of a merging NS–NS system, increasing the Galactic rates by a factor of 4–12 (depending on the metallicity) with respect to the reference model, when submodels B are compared and only slightly affecting the rates for submodel A. We stress that our model is a very crude attempt to address the results of Pavlovskii et al., however it shows the importance of further investigation of the RLOF events initiated by stars with no steep density contrast between the core and the envelope (as HG stars), from both the side of the MT and CE dynamics and from the point of view of the binary evolution and properties of the merging populations. On top of this, in many cases, we find that within the same model the Galactic rates predicted in variation A and B differ by more than an order of magnitude, especially when the assumptions about the angular momentum loss are varied, which is comparable to the largest deviation in the estimated merger rates found between different models studied in this work.
The predicted merger rates are also known to be sensitive to the assumptions related to the natal kicks. Almost every parameter study performed within the population synthesis scheme contains a variation allowing for non-standard (usually smaller velocities drawn from the Maxwellian-like distribution shifted towards lower kicks) magnitudes of the natal kicks gained by the supernova remnants (e.g. Voss & Tauris 2003; Bogomazov et al. 2007; Dominik et al. 2012; Mennekens & Vanbeveren 2014), as generally apart from the observational requirements that some NSs must be able to form with large velocities (even in excess of 1000 km s−1 as revealed by pulsar proper motions) and some must form with small or none natal kicks (to remain bound within a binary or retained within a globular cluster), they constitute another weakly constrained ingredient of the theory of binary evolution. Lowering the natal kicks increases the fraction of binaries that can survive the supernova explosion and thus allows more systems to reach the stage of the DNS. This is generally found to increase the rates by a factor of a few (e.g. Voss & Tauris 2003; Dominik et al. 2012; Mennekens & Vanbeveren 2014; Chruslinska et al. 2017, except for Bogomazov et al. (2007) who find the increase even greater than an order of magnitude, however, when they allow for the formation in a standard CCSN scenario with very low or even zero natal kicks). The increase in the rates is not spectacular even in model NK2 where we allow the half of the CCSN to lead to small natal kicks (≤50 km s−1 chosen from a flat distribution), and present only in submodel A. It helps to avoid disruption, however, the additional binaries (surviving due to this modification) are wide and unless this modification is paired with the enhanced mechanism which will act to decrease the separation, the rates will not grow more than by a factor of a few. Mennekens & Vanbeveren (2014) and Chruslinska et al. (2017) also distinguish the formation channel involving ECS/AIC and modify the assumption in which it leads to no natal kick. Mennekens & Vanbeveren (2014) find the decrease in DNS merger rates by a factor ∼7 when they ‘switch off’ the ECS channel, which probably means that ECS-formed NS receives a standard high kick. The variation from Chruslinska et al. (2017) is also repeated here (model NK1). In this model, ECS-formed NS receives a plausible small natal kick ∼50 km s−1 and the corresponding change in the rates with respect to the reference model is small – within a factor of 2 (even smaller in submodel A).
The significant drop in the rates is present in models where we used the prescription proposed by Bray & Eldridge (2016), in which the magnitude of the natal kick is proportional to the ratio of the masses of the ejected envelope and formed compact remnant, applying it to both CCSN and ECS (and AIC in some variations, although the differences between the models affecting both ECS and AIC and those affecting only ECS are marginal). The Galactic rates for those models when we do not allow for CE with HG donors (BE2, 3, 4 B) are only marginally consistent with the extended observational limits based on the properties of the sample of Galactic DNS. The local merger rate density calculated for the models BE2, 3 B is in tension with the observational limits based on sGRB and potential kilonovae observations. The natal kicks received by ECS-formed NS in these variations are generally bigger than expected, as discussed in Section 2 and if the proposed prescription for the natal kicks is correct (which may not be the case if e.g. natal kicks are primarily due to asymmetric neutrino emission), this case may require a separate treatment. When we apply the natal kicks following the study of Bray & Eldridge (2016) only after CCSN, we find no significant change with respect to our reference model. This prescription generally leads to smaller natal kicks during the second supernova and more binaries can survive the explosion, although for this to have a considerable effect on the number of merging systems one needs more binaries to reach to this stage. Exactly this is achieved by combining several factors which varied separately do not affect the rates in a noticeable way, but acting together lead to one of the highest estimates for the merger rates obtained in this study (model C). This shows the importance of investigating also the simultaneous variations of different parameters within the observationally allowed range while evaluating the evolutionary uncertainties in the merger rates predictions.
Mennekens & Vanbeveren (2014) pointed out that the assumptions regarding the amount of the angular momentum carried away by the material escaping the binary during the non-conservative MT phases may have a significant effect on the predicted merger rates, finding a difference within a factor of ∼20 between the DNS rates obtained using their standard prescription with relatively high angular momentum loss and the smaller losses closer to the standard assumptions in StarTrack. Here, we included a set of models in which we varied the assumptions about the angular momentum loss. The models with extremely high losses (five times increased with respect to the reference model during the MT with non-compact accretor J1, 3 and twice higher during the MT with NS accretor J7 B) lead to the highest decrease in the rates that we find in this study and are inconsistent with the observational limits. The analogous change in the opposite direction – decreasing the angular momentum losses leads to much smaller changes within a factor ≲4 with respect to the reference model. The similar estimates obtained for models J1 and J3 shows that the extent to which the MT is non-conservative has a secondary effect on the predicted merger rates when the high angular momentum loss is involved. The comparison between cases with conservative, half-conservative, and non-conservative case with our standard assumptions about the angular momentum loss was discussed in Dominik et al. (2012).
Generally, the models which led to the biggest changes (decrease) with respect to the reference model required quite extreme modifications of the standard assumptions (very high angular momentum loss or high natal kicks after the ECS/AIC) in the light of the current knowledge. This shows that the estimates of the NS–NS merger rates, apart from being particularly sensitive to the treatment of the CE phase, are robust.
The estimated Galactic merger rates for NS–NS binaries reported by different groups are comparable, ranging from a few to a few tens Myr−1 for the most standard evolutionary assumptions. In the parameter study performed by Voss & Tauris (2003), these rates range from 0.54 to 17 Myr−1, with 1.5 Myr−1 for their reference model. Mennekens & Vanbeveren (2014) report the Galactic rates within the range 0–153 Myr−1, which narrows to ∼2.5–8.5 Myr−1 when the standard evolutionary assumptions are used (e.g. their models 2, 22, and 23). In both cases, the biggest variations (both the lowest and the highest values) are due to modifications applied to the treatment of the CE. Dominik et al. (2012) find the range 0.3–77.4 Myr−1 and 7.6 (23.5) Myr−1 for their reference model in variation B (A), with the lowest and the highest values in their study corresponding to the model with conservative MT. With the NS–NS Galactic merger rates of 24.1 (72.5) Myr−1 in variation B (A), our reference model falls well within this scheme. Within our parameter study, the rates range from 0.1 to 234 Myr−1, where the lowest value corresponds to the model with extremely high angular momentum loss during MT and the highest was found in our conservative model J5 A (see Table 1 for details).
It is interesting to note that the detection rates predicted by these groups, as well as our estimate, all remain at the level of ∼1–3 detections per year for the advanced LIGO when the most standard models are considered. However, different methods were used for their estimation.4 The most optimistic advanced LIGO detection rates predicted within our parameter study yield ∼8–12 events per year of observations (models NK2, C, C + P, see Tables 1 and 2), assuming DNS horizon distance of ∼487 Mpc will be reached.
Our study reveals that models that lead to the highest local NS–NS merger rate densities, and thus remain relatively close (within a factor of 2–3) to the current LIGO/VIRGO observational limits are often marginally consistent with the constraints on the Galactic NS–NS merger rates (e.g. models C, C + P, and NK2). On the other hand, reference-like models that are in perfect agreement with the estimate given by Kim et al. (2015) produce not enough mergers in the local Universe to meet the constraints imposed by gravitational waves observations. However, there is no simple translation between the Galactic rate and the cosmological merger rate density. Our Galactic estimates rely on a single (solar) metallicity, while many different metallicities contribute to the cosmological estimates and many aspects of stellar evolution are metallicity-dependent (e.g. stellar winds). Thus, models leading to similar results in terms of the Galactic rates may differ significantly when cosmological predictions are compared (and vice versa). Moreover, constraints based on the observed sample from our Galaxy and those that base on observations of more distant sources that evolved in different environments do not necessarily need to agree with each other and thus may not be reconciled with the same model.
We also note that the merger rate densities estimated for BH–BH binaries in those models that meet the constraints imposed by gravitational waves observations span from ∼310 to 1000 Gpc−3 yr−1 at z ∼ 0 (see Table 3) and reach up to a few 103 Gpc−3 yr−1 within the current LIGO range. Thus, they exceed the limits of 12–213 Gpc−3 yr−1 based on gravitational waves observations for this type of binaries (Abbott et al. 2017a). This might suggest that either different CE treatment for DNS and BH–BH progenitors or/and presence of high BH natal kicks (both factors largely affecting the BH–BH merger rates; Belczynski et al. 2016a) may be needed to simultaneously meet constraints imposed on both types of binaries. In particular, models that allow for early binary interaction (with the donor on HG) to be either successful CE or thermal time-scale MT can produce DNS merger rates marginally consistent with LIGO/Virgo estimate, while models that have this early interaction lead to a failed CE and low BH natal kicks generate the correct BH–BH merger rates.
Local (z ∼ 0) BH–BH merger rate densities Rlocal; BHBH estimated for the models that lead to DNS merger rate densities marginally consistent with the current observational limits imposed by the first detection of gravitational waves from the merging DNS binary. The rates given in brackets correspond to submodel A, where the CE initiated by an HG donor star is allowed, while the other values were calculated with exclusion of systems that encounter this type of MT.
| Model | C | C+P | NK2 |
|---|---|---|---|
| Rlocal; BHBH (Gpc−3 yr−1) | 32 [310] | 695 [695] | 190 [1072] |
| Model | C | C+P | NK2 |
|---|---|---|---|
| Rlocal; BHBH (Gpc−3 yr−1) | 32 [310] | 695 [695] | 190 [1072] |
7 CONCLUSIONS
We evaluated the impact of various evolutionary assumptions on the estimated merger rates of the DNSs. Employing the population synthesis method, we calculated a suite of physical models motivated by the most recent theoretical and observational results. We estimated the Galactic merger rates for a Milky Way-like galaxy and confronted them with the observational limits based on the properties of the Galactic DNS. For 17 out of 21 presented models, we also show the local merger rate density calculated with an SFR and metallicity varying across the cosmic time as described in Appendix B. These are compared with the limits imposed by gravitational waves and sGRB observations. Our main conclusions are the following:
Our reference model predicts Galactic NS–NS merger rates that are fully consistent with the observational limits based on the observed sample of DNSs. The local merger rate density for this model does not meet the observational constraints imposed by the first detection of gravitational waves from coalescing DNSs, predicting too little NS–NS mergers in the local Universe. It also falls slightly below the limits based on sGRB that account for their beamed emission. However, as a fraction of sGRBs may originate from NS–BH mergers, our reference model does not contradict these observations.
We find only three models that, within the uncertainty limits, are consistent with the current observational constraints from the gravitational waves searches (C A, C + P, NK2 A, see Fig. 7). These models require either applying simultaneous changes in the treatment of CE, angular momentum loss, natal kicks, and ECS or significantly increasing a fraction of CCSNe that allow for the formation of NSs with small (≲50 km s−1) natal kicks. At the same time, the local BH–BH merger rate densities calculated for those models exceed the corresponding observational limits (see Table 3). This might suggest that different treatment of the CE phase for BH–BH and NS–NS progenitors or high BH natal kicks are needed to obtain merger rates consistent with the observational limits for both types of binaries.
We only find two variations that allow us to significantly (a factor of ≳10) increase the rates of NS–NS mergers with respect to the reference model. These are the models that combine several factors supporting the formation of DNS binaries. For the Galactic merger rates the biggest increase is within a factor of ∼8 (in both cases, these are the model C A and its other version C + P; see Tables 1 and 2 for the details).
We find several models leading to a significant (more than an order of magnitude) decrease in the predicted DNS coalescence rates. These are the models with extremely high angular momentum losses during the stable MT and also the models requiring high (in the light of theoretical predictions) magnitudes of natal kick velocities gained by NSs forming via ECS and/or AIC. These models are in tension with the observational limits on cosmic rate density of sGRBs (Fig. 7) and, in case of the models with high angular momentum losses with the limits on the Galactic NS–NS merger rates (Fig. 6).
In many cases, the merger rates within the same model can differ by more than an order of magnitude depending on the treatment of the CE phase with the HG donor star (see Fig. 6 and the tables). This is the most apparent for the models with varied assumptions about the angular momentum loss. Such differences are comparable to the largest deviation in the estimated merger rates found between different models studied in this work, making the treatment of the CE the primary source of evolution-related uncertainties of the merger rates. It reveals the need for further investigation of the RLOF events with stars that have radiative envelopes and no clear density gradient separating the core and the envelope (as in case of massive HG stars), in particular the stability conditions.
ACKNOWLEDGEMENTS
We thank to Tomasz Bulik for helpful comments and discussions. We also thank to Wojciech Gladysz for his help with carrying out the simulations. The authors acknowledge the Texas Advanced Computing Center at The University of Texas at Austin for providing HPC resources that have contributed to the research results reported within this paper (URL: http://www.tacc.utexas.edu). We also thank to Hannah Brinkman for useful discussion on ECS. We thank to thousands of Universe@home users that have provided their personal computers and phones for our simulations, and in particular to Krzysztof Piszczek and Grzegorz Wiktorowicz (program IT and science managers). KB acknowledges support from the Polish National Science Center grant Sonata Bis 2 (DEC-2012/07/E/ST9/01360). KB thank the Niels Bohr Institute for its hospitality, while part of this work was completed, and acknowledge the Kavli Foundation and the Danish National Research Foundation (DNRF) for supporting the 2017 Kavli Summer Program. MJB acknowledges the support of the NSF through award number HRD-1242090.
Footnotes
We refer to the IMF function defined as the number of stars with a birth mass within a certain mass range using linear mass bins dN/dm ∼ m−α, in contrast to the logarithmic bins dN/dlog(m) ∼ m−Γ used by some authors. Note that α = Γ + 1.
Voss & Tauris (2003) and Mennekens & Vanbeveren (2014) applied a simple scaling rule to calculate the local NS–NS merger rate density based on their Galactic merger rates and assuming a certain density of Milky Way-like galaxies in the local Universe and that our Galaxy is representative. This local merger rate density was then used to estimate the detection rates. The detection rates from the study by Dominik et al. were calculated as detailed in Dominik et al. (2015). They apply a similar procedure to calculate the local merger rate density as the one used in this study (we follow the evolution of the NS–NS progenitor systems that form according to the assumed star formation history in chemically evolving Universe and merge after a certain delay time, see Appendix B) and include gravitational waveforms and detector sensitivity curves to convert these cosmological merger rates into detection rates. They also show the detection rates obtained with the use of equation (5), which was applied to calculate NS–NS detection rates in this work.
REFERENCES
APPENDIX A: ULTRA-STRIPPED SUPERNOVAE
Motivated by observations of supernovae with very low peak luminosities (≲1042 erg s−1) and rapidly decaying light curves, with a famous example of SN 2005ek (Drout et al. 2013), which also holds the record for the smallest ratio of ejecta to remnant mass ever observed for a CCSN, Tauris et al. (2013) proposed that these events may be due to explosions of ultra-stripped massive stars. USSNe are the explosions of stars which lost nearly entire envelopes during binary interactions with a compact companion. The mass of the ejected material during the USSN explosion can be as little as ≲0.1 M⊙, they would be thus ‘an order of magnitude more stripped’ than typical progenitors of Ib/Ic SN. The lack of hydrogen in these latter types of SN is usually explained to be due to binary interaction, where the initially more massive star was stripped of its outmost layers by MT and the leftover envelope ejected during the explosion is ≳1 M⊙. Some type Ib/Ic SNe show much faster than average evolution of the light curve, which is interpreted to be due to the fact that their ejecta mass is much smaller, they are thus natural candidates for USSN. For further characteristic of the light-curve and spectral properties of USSNe, see Moriya et al. (2017).
The extreme stripping of the progenitor of the USSN that would leave only the bare stellar core requires a very tight orbit, hence the need for a compact companion. It can be achieved in a close, post CE X-ray binary, where the second MT from a naked helium star to an NS, initiated by the helium star expansion during its giant phase can occur (Tauris et al. 2013). It has been postulated by Tauris et al. (2015) that most, if not all merging DNSs form in this scenario, with the second NS originating in an ultra-stripped CCSN (either iron-core collapse or ECS). As argumented by these authors, this formation scenario may potentially lead to small natal kick at the birth of an NS, especially if the mechanism responsible for NS natal kicks is primarily due to interaction with asymmetrically ejected material (Janka 2017).
APPENDIX B: CALCULATION OF THE MERGER RATES
In this work, we use three different estimates of the merger rates. The first is the number of DNSs merging within the Hubble time for a given model and for a given metallicity. Together with the total stellar mass of the simulations Msim for each model, it allows for the calculation and proper normalization of the rates.
Msimis the total mass of stars from the whole adopted mass range 0.08–150 M⊙ that would be created in order to obtain the simulated number of ZAMS binaries which were chosen from a narrower mass range, assuming a particular IMF for the mass of the primary star, primordial mass ratio distribution and the binary fraction |$f_{\rm bin} = \frac{N_{\rm bin}}{N_{\rm bin}+N_{\rm single}}$|. This number can be then compared with the stellar mass of the Galaxy, as it is done during calculation of the Galactic merger rates. We assume that all stars are formed in binaries, which probably overestimates the number of low-mass binaries (≲10 M⊙), but is relevant for massive stars, as revealed by observational studies (fbin = 1, e.g. Sana et al. 2012) Note that this is different than in Dominik et al. (2012, 2013, 2015) and Chruslinska et al. (2017) where fbin = 0.5 was used in the whole mass range and leads to nearly twice higher overall estimate of the merger rates. Differences in Msim for different models come from differences in the number of simulated ZAMS binaries for these models.
B1 Galactic merger rates
Secondly, we present the Galactic merger rates i.e. the number of coalescences per unit time within a galaxy. These are calculated for a fiducial Milky Way-like galaxy, assuming 10 Gyr of continuous star formation at the rate of SFRgal = 3.5 M⊙ yr−1. The Galactic rates are calculated for a single metallicity. The procedure is summarized below.
Each of the successfully formed DNS binaries is assigned a random birth time between 0 and 10 Gyr (the Galactic age Tgal). If its delay time, being the sum of the time from the birth of the binary to the formation of the second compact object (∼Myr) and the time required for its coalescence (due to orbital evolution caused by gravitational waves emission, ≳100 Myr), is close to the current age of the galaxy, its added to the number of coalescing systems Nmr. One has to properly normalize the obtained number to match the total mass of the Galaxy formed in stars during its lifetime (Tgal × SFRgal), as in general the mass within the simulated binaries corresponds to only a fraction of the needed mass. This is done by simply using each of the simulated binaries n = Tgal × SFRgal/Msim times for the calculation of Nmr.
B2 The local merger rate density
It is worth to point out some implicit assumptions about the IMF related to this procedure. We assume that the IMF does not depend on metallicity, using the same function regardless of the metallicity or redshift. This is justified by the fact that studies based on the integrated properties of the observed galaxies and resolved stellar populations so far revealed no clear evidence for any significant variations or systematic trends in the form of the IMF with redshift or metallicity (Massey 2003; Bastian et al. 2010; Offner et al. 2014), apart from local deviations (e.g. top-heavy IMF found in some globular clusters, see Kroupa et al. 2013). Secondly, to obtain the SFR in the form given by equation (B1), Madau & Dickinson (2014) assumed a Salpeter-like IMF (Salpeter 1955) with the constant slope of αIMF = 2.35 for masses ranging from 0.1 to 100 M⊙. Hence, the use of equation (B1) together with our results relying on a Kroupa-like IMF is inconsistent. Klencki et al. (in preparation) with the use of the starburst99 code (Leitherer et al. 1999, 2014) calculated the correction factor KIMF = 0.51 which can be used as a multiplicative factor in equation (B1) to calculate the rate density in a more consistent manner (see Section 2 and appendix therein). We thus modify the SFR according to their results, using: SFRKroupa(z) = KIMF × SFR(z).
B2.1 Uncertainties involved in the calculations
There is a number of poorly constrained components within our cosmological calculations that are responsible for the build-up of the final uncertainty associated with our estimated NS–NS merger rate density. Here, we evaluate the impact of some of them on our predictions, leaving a more detailed discussion for future studies.
The most important source of uncertainty in the estimated NS–NS merger rate density is the form of the IMF used (different choices of the IMF are present in the literature, e.g. Salpeter 1955; Kroupa et al. 1993; Kroupa 2001; Chabrier 2003) and in particular the slope of the high-mass end of the IMF for field stars, where observational data points are scarce (e.g. 2 in Bastian et al. 2010). Using a steeper αIMF = 2.7 for primary stars more massive than the Sun, as used e.g. by Dominik et al. (2012) and applying the appropriate SFR correction (Klencki et al. in preparation) would increase the estimates by a factor of ∼1.25, while less steep high-mass end of the IMF would decrease the NS–NS local merger rate density (e.g. αIMF = 1.9 would reduce the estimate by a factor of ∼0.6). Any further break in the form of the IMF beyond 10 M⊙, which presently cannot be excluded would affect our predictions for NS–NS (with steeper IMF further increasing the rates).
The assumed IMF should be used consistently with the adopted SFR density, which is not well determined at higher redshifts z ≳ 2 (the SFR prescription used in this study may underestimate the number of stars formed at high redshifts; see Belczynski et al. 2016b, although this is of secondary importance for the calculation of the local NS–NS merger rates considered in this work) and with the metal yields y and return fractions R. As discussed by Vincenzo et al. (2016), the latter two depend not only on the particular choice of the IMF, but also on the upper cut-off mass mup of the IMF and on the input set of the stellar yields used in the calculations (comparing two sets they suggest a factor of 1.5 uncertainty related to this choice). However, the impact of the uncertainties that affect both y and R on our results partially cancels out, as our calculations are sensitive only to the term y(1 − R) present in equation (B2). The more top-heavy the IMF, the more the predicted yields vary with the location of the upper mass cut-off (increase with increasing mass). We put this upper limit on mup = 150 M⊙ and use yields calculated for mup = 100 M⊙, potentially underestimating this value. The use of twice higher average metal yields would result in a factor of ∼1.2 increase in the predicted NS–NS merger rate density.
Our result is also sensitive to the assumed binary fraction. Here, we assumed that all stars form in binaries, adopting fbin = 1 in the whole simulated mass range and possibly overestimating the number of low-mass binaries. Different choice of fbin = 0.5 would result in a factor of ∼1.5 increase in NS–NS merger rate density. Most likely different binary fraction should be used for high- and low-mass primaries, however it is not clear where lies the boundary between the low- and high-mass regime in this matter, furthermore this transition may turn out to be more gradual. Note that this choice would affect e.g. the predicted ratio of NS–NS and BH–BH mergers.
APPENDIX C: TYPICAL EVOLUTION OF THE PROGENITOR OF THE MERGING DNS
As can be seen in the Fig. 1, only a small fraction of the simulated ZAMS binaries (drawn from the limited mass range) ends up forming a DNS system that will merge within the Hubble time. Nearly half of the initial binaries undergoes an early CE phase (∼1/3 is HG-donor case). Majority of these systems is lost in mergers before the first compact object can form. The biggest contribution to the merging population from this ‘early-CE’ channel comes from binaries passing through the HG-donor CE and for the reference model ( Z⊙) is at the level of ∼10−3 per cent of the simulated ZAMS binaries. Around 20 per cent of the simulated systems does not interact before the formation of the first remnant. Their contribution to the merging population of DNS is negligible, as they form binaries that are too wide to merge within the Hubble time.
The remaining 1/3 of the binaries interact via only stable MT before the formation of either WD, BH, or NS (with the majority forming a WD, as a consequence of the IMF favouring the formation of the less massive stars). The significant fraction of the potential NS progenitors is lost at the moment of the first supernova explosion. The combination of the abrupt mass loss and the natal kick velocity causes ∼80 per cent of the binaries undergoing the SN to disrupt at this point. Over 99 per cent (in submodel B and 95 per cent in submodel A) of the surviving binaries that will end up as merging DNS form through ECS (with no natal kick added in the reference model).
In case of the binaries that remain bound after the SN and where the first component finishes its evolution as an NS, one can distinguish between the systems that will encounter no CE and will not contribute to the merging population and those that will undergo the CE evolution. A fraction of the potential DNS progenitors coalesce during the CE phase, before the envelope can be ejected. One-third of those that survive passes through the highly uncertain CE initiated by the HG donor. In the analysed model, their contribution to the merging population of DNS is the biggest, being twice the number of the interesting binaries resulting from the evolution through the other types of CE. In > 87 per cent (depending on the model) of merging DNS progenitors, the late highly non-conservative MT (due to exceeded Eddington rate) after the CE initiated by an expanding naked helium star occurs, potentially leading to further stripping of the envelope and subsequent SN explosion with very little ejected material. The discussed evolutionary path is summarized with an example in Fig. 2. For subsolar metallicities, the fraction of binaries that encounter this late MT decreases and another variation of the discussed channel, requiring two unstable MT episodes, becomes dominant. Fig. C1 shows an example of this variation. Again a fraction of binaries does not form a DNS, as the secondary star ends up as a WD or BH, even more get disrupted during the supernova explosion. A comparable number of the merging DNS forms in the scenario requiring an AIC of the star that initially formed a WD to an NS and the later CE phase, although we find that the great majority of these (merging) systems passes through the CE initiated by the HG donor, once more pointing out the need for better understanding the physics of MT phases with this kind of donor stars.
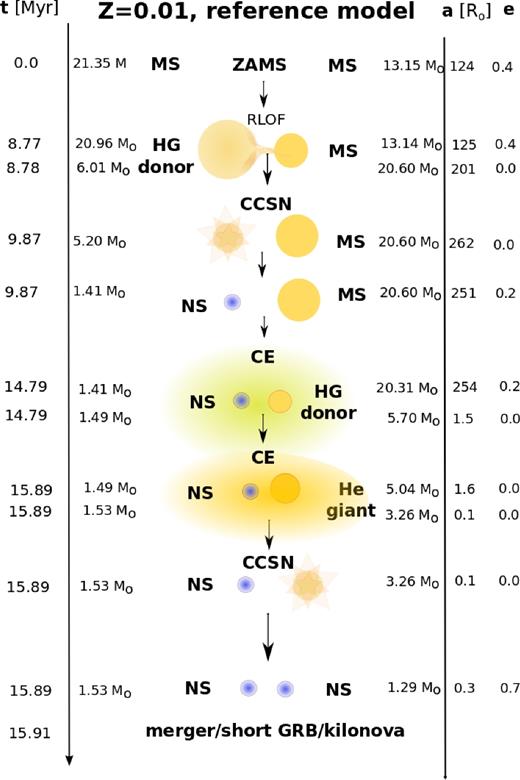
Example evolution of a merging DNS with the remnant masses similar to the masses of GW170817 progenitor stars (see Abbott et al. 2017b), formed in a channel involving two CE episodes and shown for the reference model (see Section 3.1) and metallicity Z = 0.01. Stars pass through a stable RLOF phase before the first core-collapse event. The first star undergoes a CCSN and forms an NS. The binary passes through the CE phase initiated by an HG donor star, shrinking the orbit and leaving behind a helium star, which later on again overfills its Roche lobe and initiates another phase of dynamically unstable mass transfer. The second stars collapses to NS and a DNS system is formed, which then gradually decreases its separation due to emission of gravitational waves until both stars merge, leading to a strong gravitational wave signal, sGRB and kilonova emission. Note that the whole evolution of the binary in this case lasts only ∼16 Myr. This evolutionary channel (involving two CE phases) produces binaries that merge shortly after the formation of the second NS.
The NS–NS binary shown in example in Fig. C1 was chosen to reproduce the known properties of GW170817 (see the limits reported by Abbott et al. 2017b). Note that most of merging DNS forming in our simulations require the first NS to form with a small natal kick and thus they preferentially form through ECS. However, ECS produce rather lightweight NS (∼1.3 M⊙) and to reach a relatively high mass of the primary star as in GW170817 (∼1.5 M⊙), NS would have to accrete a few ∼0.1 M⊙. At the same time NSs are believed to accrete little mass during the subsequent MT episodes (<0.1 M⊙, e.g. section 4 in Tauris et al. 2017), which makes the ECS formation scenario unlikely. As NS accrete primarily during CE phase, the formation channel with two CE favours the formation of more massive NSs. It should be noted that the amount of matter accreted during the CE is not well constrained. We assume the accretion rate of 10 per cent of the Bondi-Hoyle rate. However, recent calculations show that the accretion rates can be reduced even by a factor of 10−2 with respect to the rates resulting from the standard Bondi–Hoyle approximation when the structure of the envelope is taken into account (MacLeod & Ramirez-Ruiz 2015; MacLeod et al. 2017; Murguia-Berthier et al. 2017).
