


Abstract
We utilize a series of galaxy formation simulations to investigate the relationship between the ultraviolet (UV) slope, β, and the infrared excess (IRX) in the spectral energy distributions (SEDs) of galaxies. Our main goals are to understand the origin of and scatter in the IRX–β relation; to assess the efficacy of simplified stellar population synthesis screen models in capturing the essential physics in the IRX–β relation; and to understand systematic deviations from the canonical local IRX–β relations in particular populations of high-redshift galaxies. Our main results follow. Young galaxies with relatively cospatial UV and IR emitting regions and a Milky Way-like extinction curve fall on or near the standard Meurer relation. This behaviour is well captured by simplified screen models. Scatter in the IRX–β relation is dominated by three major effects: (i) older stellar populations drive galaxies below the relations defined for local starbursts due to a reddening of their intrinsic UV SEDs; (ii) complex geometries in high-z heavily star-forming galaxies drive galaxies towards blue UV slopes owing to optically thin UV sightlines; (iii) shallow extinction curves drive galaxies downwards in the IRX–β plane due to lowered near-ultraviolet/far-ultraviolet extinction ratios. We use these features of the UV slopes of galaxies to derive a fitting relation that reasonably collapses the scatter back towards the canonical local relation. Finally, we use these results to develop an understanding for the location of two particularly enigmatic populations of galaxies in the IRX–β plane: z ∼ 2–4 dusty star-forming galaxies and z > 5 star-forming galaxies.
1 INTRODUCTION
Measuring the evolution of the cosmic star formation rate density remains both a challenge and fundamental goal of galaxy evolution astrophysics (see Madau & Dickinson 2014, for a recent review). Essentially all tracers of a galaxy's star formation rate (SFR) measure the luminosity (either directly or reprocessed) from massive, short-lived stars. Because the ultraviolet (UV) continuum from actively star-forming galaxies is dominated by massive stars, direct measurements of UV starlight from galaxies (alongside an assumption of a stellar initial mass function) serve as one of the more straightforward methods for deriving a galaxy's SFR (e.g. Kennicutt & Evans 2012). This said, obscuring dust in the interstellar medium (ISM) of galaxies preferentially absorbs UV radiation, and therefore complicates the interpretation of SFRs calibrated from UV measurements.
The observed relationship between the rest-frame UV continuum slope from galaxies (β, where fλ ∝ λβ) and the ratio of the infrared luminosity to the UV luminosity (IRX) has been commonly employed as a tool for accounting for the dust obscuration of UV and optical radiation. In seminal work, Calzetti (1997) and Meurer, Heckman & Calzetti (1999) found that local starburst galaxies lie on a well-defined sequence in the IRX–β plane. In principle, this notional relationship is quite powerful: even when infrared data are unavailable to constrain the true transfer of energy from UV photons to thermal dust continuum, an IRX–β relationship can clarify the degree of dust obscuration from observations where only UV measurements are available.
Indeed, a large number of studies have employed this technique to infer the dust content of z ∼ 2–6 galaxies for a range of applications. Amongst many others, these include constraining the cosmic star formation rate density (Bouwens et al. 2014, 2015), cosmic star formation rate functions (e.g. Bothwell et al. 2011; Smit et al. 2012, 2016), the evolution of specific star formation rates (e.g. González et al. 2010, 2014), the growth of galaxy dust content (Finkelstein et al. 2012), physical properties of individual galaxy populations (e.g. Stark et al. 2009; Ho et al. 2010; Williams et al. 2014) and SFR tracers themselves (e.g. Treyer et al. 2007; Kennicutt et al. 2009; Hao et al. 2011). The rationale for using the IRX–β relation across a diverse range of observations has been, in part, bolstered by a number of observations that show the relation holding for samples of galaxies between z ∼ 2 and 4 (e.g. Seibert, Heckman & Meurer 2002; Reddy et al. 2008, 2012; Pannella et al. 2009; Heinis et al. 2013; To, Wang & Owen 2014; Bourne et al. 2017; McLure et al. 2017).
At the same time, a number of observations have called into question the relationship between β and the infrared excess. For example, at low redshift, Goldader et al. (2002) and Howell et al. (2010) find that luminous infrared galaxies (L > 1011 L⊙) and ultraluminous infrared galaxies (ULIRGs; L > 1012 L⊙) are offset from the canonical IRX–β relations, with either an excess of IRX at a fixed β or bluer UV spectral slopes at a fixed IRX (i.e. they lie above the relationship).
This offset extends to high-redshift dusty galaxies as well. For example, while Bourne et al. (2017) found that lower luminosity galaxies at z ∼ 2 present similarly as the Meurer et al. (1999) sample in the IRX–β plane, higher luminosity dusty star-forming galaxies (DSFGs) tend to exhibit bluer UV continuum slopes than the canonical relationship at a given IRX value. A similar trend is observed by a number of groups in high-redshift (z ≳ 2) DSFGs (e.g. Reddy et al. 2010; Penner et al. 2012; Oteo et al. 2013; Casey et al. 2014a; Watson et al. 2015; Forrest et al. 2016; Fudamoto et al. 2017). Casey et al. (2014a) explicitly demonstrate that galaxies of increasing infrared luminosity at z ≳ 0.5 have increasingly blue UV spectral energy distributions (SEDs). We will return to this point later in this paper.
Offsets from the Meurer et al. (1999) local relation are not exclusive to DSFGs. Metal-poor systems such as the Small and Large Magellanic Clouds (SMC and LMC, respectively) have redder colours than more metal-rich galaxies on the IRX–β plane (e.g. Bell et al. 2002; Buat et al. 2005). Similarly, some high-z Lyman-break galaxies are more consistent with the SMC/LMC IRX–β curve than the Meurer et al. (1999)-defined starburst locus (e.g. Reddy et al. 2010; Koprowski et al. 2016). Even some so-called normal galaxies at high redshift (those not currently undergoing a starburst event, with ∼solar metallicity) have redder UV continuum slopes than the canonical Meurer relation, and lie in between the Meurer relation and SMC/LMC curves (e.g. Buat et al. 2005; Seibert et al. 2005; Boquien et al. 2009; Casey et al. 2014a; Pope et al. 2017). In effect, these variations in how a galaxy presents in the IRX–β plane underscore variations in the underlying dust attenuation law (e.g. Salmon et al. 2016).
With the advent of the Atacama Large Millimeter Array (ALMA), dust continuum detections (or sensitive upper limits) have now become routine at the highest redshifts (e.g. Rujopakarn et al. 2016; Dunlop et al. 2017). For example, Capak et al. (2015) and Bouwens et al. (2016) employed 0.8–1.1 mm observations of z ≳ 4 galaxies in order to infer their far-infrared (FIR) luminosities (this requires an assumed dust temperature; we will return to this point in Section 5.2). From these data, Capak et al. and Bouwens et al. find that these high-redshift galaxies are systematically low in their dust content, lying below even the SMC/LMC IRX–β curves.
In an effort to understand the origin of the IRX–β relation, as well as its deviations, recent years have seen a flurry of theoretical interest in the field. Granato et al. (2000) utilized the galform semi-analytic galaxy formation model, coupled with dust radiative transfer calculations to understand the origin of the original Meurer et al. (1999) relation. More recently, Safarzadeh, Hayward & Ferguson (2017) developed the first model for the IRX–β relation in galaxies to utilize hydrodynamic simulations of galaxy evolution. These authors coupled dust radiative transfer calculations of idealized (i.e. non-cosmological) discs and binary galaxy mergers, with a focus on the IRX–β relation at z = 0–2. Ferrara et al. (2017) developed an analytic model to understand deviations from the IRX–β relation at z ∼ 6, and Popping, Puglisi & Norman (2017) utilized idealized screen models to dissect the IRX–β relation in local and high-z galaxies. What is missing, thus far, is a comprehensive study of the IRX–β relation in galaxies using cosmological galaxy formation simulations that model the complex distribution of stars and dust in galaxies alongside the interaction of galaxies with cosmic environment.
In this paper, we aim to develop a physical model for the origin of and deviations from the IRX–β relationship in galaxies. To do this, we will employ a series of high-resolution cosmological zoom galaxy formation simulations that are coupled with both stellar population synthesis and dust radiative transfer models. This will allow us to in effect ‘observe’ the simulations, and therefore relate the physical properties of the model galaxies to their observed UV continuum and infrared luminosity properties.
We have three principal goals in this paper.
To understand the origin of and scatter in the IRX–β relation.
To assess the efficacy of simplified (i.e. screen) models in capturing the essential physics driving the IRX–β relation.
To utilize these models to understand systematic deviations from the canonical IRX–β relations in particular populations of galaxies.
To this end, we organize the paper as follows. After describing our numerical methodology and simulations (Section 2), we deconstruct the IRX–β relation, assessing the physical drivers of dispersion in Sections 3 and 4. We then discuss individual galaxy populations that appear to have systematic deviations from the IRX–β relation in Section 5. Throughout these sections, we will also include comparisons to simplified models in which we place a dust screen in front of a simple stellar population (hereafter ‘screen models’). In Section 6, we provide discussion, where we discuss a methodology to minimize the uncertainty resulting from systematic deviations from the fiducial IRX–β relation, compare to other theoretical models, and assess the τUV–β and τUV–IRX relationships. Finally, we summarize in Section 7
2 NUMERICAL METHODS
2.1 Overview
Our overall aim is to simulate the rest-frame UV–millimetre wave SED of a realistic sample of model galaxies in order to investigate the IRX–β relation in galaxies. To do this, we model the formation and evolution of galaxies utilizing the cosmological ‘zoom’ technique, wherein individual galaxies are tracked in a cosmological simulation at a higher resolution than the bulk of the cosmic volume. This technique, while computationally expensive, allows us to maintain a relatively high mass resolution while still following the realistic evolution of galaxies in their cosmic environment.
We couple these simulations with stellar population synthesis models to model the spectral emission properties of the stars, and dust radiative transfer simulations in order to calculate the dust attenuation the stellar radiation encounters as it leaves the galaxy. In the remainder of this section, we describe the details of these galaxy formation simulations and dust radiative transfer calculations, though note that the reader interested primarily in the main results can skip this section without loss of continuity.
2.2 Cosmological zoom galaxy formation simulations
We conduct all of our galaxy formation simulations with a modified version of the hydrodynamic code gizmo (Hopkins 2015), which builds off of much of the code base of gadget-3 (Springel 2005). We simulate a 50 h−1 Mpc box from an initial redshift zinit = 249 down to zfinal = 0, with initial conditions generated with music (Hahn & Abel 2011). We employ a cosmology |$\Omega _\Lambda = 0.7$|, Ωb = 0.048, H0 = 68 km s−1 Mpc−1 and σ8 = 0.82. Our initial simulation includes dark matter only, and included 5123 particles, resulting in a dark matter mass resolution of 7.8 × 10⁸ h−1 M⊙.
We identify five arbitrary dark matter haloes at redshift z = zfinal, where zfinal is the final redshift of the zoom. We have two categories of simulations: massive galaxies intended to model a diverse range of physical properties at high redshift, as well as a lower mass galaxy intended to represent ‘normal’ Milky Way-like galaxies in the present epoch. The former category of simulations are selected at (and eventually run to) zfinal ≈ 2, while the latter zfinal = 0. The massive simulations span more than a decade in mass, with z = 2 halo masses of MDM ≈ 1 × 10¹²–3 × 10¹³ M⊙, while the low-mass (low-redshift) simulation has a final halo mass comparable to the Milky Way's (e.g. Boylan-Kolchin et al. 2013).
Utilizing caesar (Thompson 2015), we follow the standard procedure from Hahn & Abel (2011) in which we build an ellipsoidal mask around all particles within 2.5 × the radius of the maximum distance (i.e. the farthest away) dark matter particle in the z = zfinal halo, and define this as the Lagrangian high-resolution region to be re-simulated at a higher resolution. When re-run to z = zfinal, we have zero low-resolution particles contaminating our main haloes within three virial radii.
We operate gizmo in the meshless finite mass (MFM) mode, which evolves the fluid in a mass-conserving manner within individual mesh nodes. We utilize a cubic spline kernel with 64 neighbours in the MFM hydrodynamics, which is used to define the volume partition between gas elements, and therefore the faces over which the hydrodynamics is solved via the Riemann solver. Davé, Thompson & Hopkins (2016) have shown that relatively minimal differences exist when using the MFM solvers in galaxy formation problems as a pressure–entropy smoothed particle hydrodynamics (Hopkins 2013).
Our simulations use the suite of physics described in the mufasa cosmological hydrodynamic simulations (Davé, Thompson & Hopkins 2016; Davé et al. 2017a; Davé, Rafieferantsoa & Thompson 2017b), and indeed our parent dark matter simulation is generated with identical initial conditions as the 50 Mpc h−1mufasa simulation. In this, stars form only in dense molecular gas, where the H2 fraction is dependent on the gas metallicity and surface density following the Krumholz, McKee & Tumlinson (2009) prescription (e.g. Thompson et al. 2014). We impose a minimum metallicity for star formation of Z = 10−3 Z⊙.
As we will discuss in Section 2.3, the dust masses in our radiative transfer simulations are tied to the metal content in the ISM. Feedback from longer lived stars [asymptotic giant branch (AGB), and Type Ia supernovae] are included as well, following Bruzual & Charlot (2003) stellar evolution tracks with a Chabrier (2003) initial mass function (IMF). These delayed feedback sources deposit metals into the ISM. We track the evolution of 11 elements: H, He, C, N, O, Ne, Mg, Si, S, Ca and Fe. The Type II supernova yields follow the Nomoto et al. (2006) parametrizations as a function of metallicity, though reduced by a factor of 50 per cent, owing to studies that show these scalings result in metallicities a factor of ∼2 too high as compared to the observed mass–metallicity relation (Davé, Finlator & Oppenheimer 2011). For Type Ia supernovae, we employ the yields from Iwamoto et al. (1999), assuming 1.4 M⊙ of returned metals per SN1a event. Chemical enrichment from AGB stars follows the Oppenheimer & Davé (2008) lookup tables where the yields are a function of age and metallicity.
The default mufasa model includes a heuristic quenching scheme in which all gas that is not self-shielded is heated in massive haloes (where the threshold mass for quenching is a function of redshift; Davé et al. 2016). For the bulk of our models, we do not include this scheme as we endeavour to simulate a broad range of physical conditions in star-forming galaxies, and including the quenching model would limit the parameter space that we can study. This said, in order to build a substantial population of evolved stars (that will enable us to understand the relationship between old stellar populations and the IRX–β relation), we include one model in which this quenching model is included.
In Table 1, we summarize the model zooms employed in this study.1 The dark matter particle masses are MDM = 1 × 10⁶ h−1 M⊙, and baryon particle masses Mb = 1.9 × 10⁵ h−1 M⊙. We employ adaptive gravitational softening of all particles throughout the simulation (Hopkins 2015), with minimum force softening lengths of 12, 3 and 3 pc for dark matter, gas and stars respectively. Each model galaxy is evolved to z = 2, outputting 85 snapshots from z ∼ 30–2. In Fig. 1, we show the gas surface density projections for one of our model galaxies (mz5) as it evolves from z ∼ 5–2.
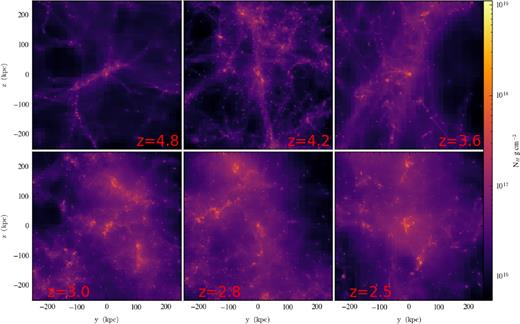
Gas surface density projections during the period 2 ≲ z ≲ 5 of an arbitrary galaxy from our model sample (model mz5). Each panel shows the same galaxy, though at different redshifts. The complex geometries will manifest themselves in the IRX–β relation in Section 5.1.
Summary of physical properties of model haloes. M*,c and Mgas refer to the stellar and gas mass of the central galaxy, while Mhalo refers to the total halo mass at z = zfinal. M*,h refers to the stellar mass within the halo. Model mz0q differs from the remaining models in that it includes a heuristic quenching model.
| Model name | M*,c (z = zfinal) | M*,h (z = zfinal) | Mgas | Mhalo (z = zfinal) | Final redshift |
|---|---|---|---|---|---|
| (M⊙) | (M⊙) | (M⊙) | |||
| mz0 | 8.5 × 10¹⁰ | 4.0 × 10¹¹ | 4.7 × 10⁸ | 4.1 × 10¹³ | 2.2 |
| mz0q | 5 × 10¹⁰ | 8.9 × 10¹¹ | 2.9 × 10¹⁰ | 3.9 × 10¹³ | 2.25 |
| mz5 | 7.3 × 10¹⁰ | 8.1 × 10¹¹ | 2.9 × 10⁹ | 6.1 × 10¹³ | 2 |
| mz10 | 6.8 × 10¹⁰ | 1.6 × 10¹¹ | 8.3 × 10⁹ | 1.1 × 10¹³ | 2 |
| mz45 | 9.4 × 10⁹ | 1.3 × 10¹¹ | 1.6 × 10¹⁰ | 3.7 × 10¹³ | 2 |
| z0mz401 | 2.6 × 10¹⁰ | 3.4 × 10¹⁰ | 1.5 × 10¹⁰ | 2.05 × 10¹² | 0 |
2.3 Dust radiative transfer
With a galaxy sample in hand, we proceed to calculating the UV–FIR SED. Our methodology contains two major steps: generating the unattenuated stellar SEDs for all star particles in the simulation, and then propagating these stellar SEDs through the dusty ISM to calculate the resultant attenuation. This process is performed on each snapshot at z < 10 in post-processing.
These combined calculations are performed with powderday, an open-source dust radiative transfer package first described in Narayanan et al. (2015) that wraps a number of publicly available codes as described below. The stellar SEDs for each snapshot of each modelled galaxy are calculated with the Flexible Stellar Population Synthesis (fsps) code (Conroy, Gunn & White 2009; Conroy & Gunn 2010; Conroy, White & Gunn 2010) via python-fsps,2 a set of python hooks for fsps. The stellar SEDs are calculated as simple stellar populations with their ages and metallicities taken directly from the hydrodynamic simulation. We assume a Kroupa (2002) stellar IMF and the Padova isochrones (Marigo & Girardi 2007; Marigo et al. 2008).
We calculate the attenuation suffered by these stellar SEDs by performing 3D Monte Carlo dust radiative transfer simulations. The metal mass from the galaxy formation simulations is projected on to an adaptive grid with an octree memory structure. The grid encompasses 25 kpc around the centre of the galaxy. Functionally, the octree is constructed by placing the entire set of particles associated with the halo within the radiative transfer simulation region into a single cell, and then recursively subdividing this cell into octs until a threshold maximum number of gas particles are in the cell (we employ nsubdivide,thresh = 64). The physical properties of the gas are projected using a spline smoothing kernel, and functionally done with software within yt (Turk et al. 2011; Turk et al., in preparation).
The radiative transfer happens in a Monte Carlo fashion utilizing the dust radiative transfer code hyperion (Robitaille 2011). hyperion uses the Lucy (1999) iterative algorithm for determining the radiative equilibrium temperature in dust grains. In practice, photons are emitted from stellar sources, and absorbed, scattered and re-emitted by dust. This process is iterated upon until the dust temperature and radiation field are converged. We determine convergence when the energy absorbed by 99 per cent of the cells has changed by less than 1 per cent between iterations. Unless otherwise specified (i.e. the tests done in Section 4.2.3), we assume a Weingartner & Draine (2001) grain size distribution, with R ≡ Av/E(B − V) = 3.15 [where Av is the visual extinction, and E(B − V) is the difference between the B- and V-band extinctions]. The emissivities are updated to include an approximation for polycyclic aromatic hydrocarbons following Robitaille et al. (2012). The dust mass is assumed to be a constant fraction (here, 40 per cent) of the metal mass in each oct cell, where this fraction is taken from constraints across a range of epochs (Dwek 1998; Vladilo 1998; Watson 2011).
The result of the powderday calculations is a simulated SED for each galaxy snapshot, spanning the wavelength range 912 Å to 1 mm. It is these SEDs that we use as both a comparison to observations and an interpretative tool for understanding the IRX–β relation in galaxies. Example SEDs can be seen in Fig. 5. The simulations employed in this study examine a single sightline. Similarly, as an example of the output of powderday, in Fig. 2, we show the UV morphologies of our three most massive galaxies both as observed and the unattenuated flux.
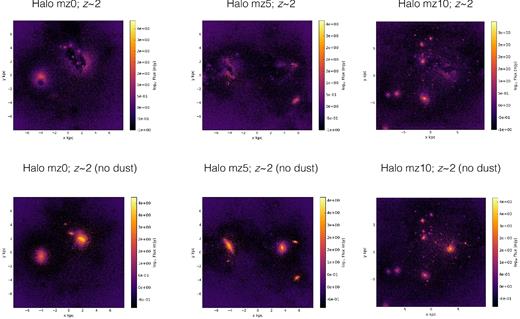
UV images of our three most massive haloes at z ∼ 2, both as observed and unattenuated.
Finally, it is worth a brief word discussing powderday in the context of other dust radiative transfer packages used for similar studies. As we will discuss in Section 6.3, Safarzadeh et al. (2017) utilized sunrise dust radiative transfer calculations coupled with their idealized galaxy evolution models. In principle, sunrise and powderday have a similar work flow. Both codes generate stellar SEDs using population synthesis models, and propagate these stellar SEDs through the dusty ISM until the dust temperature and radiation field have achieved equilibrium. sunrise uses starburst99 calculations for the population synthesis calculations, and performs the radiative transfer in polychromatic fashion in code, while powderday simply wraps fsps for the stellar population synthesis, and hyperion for the dust radiative transfer. Similarly, Granato et al. (2000) coupled galform with grasil (Domínguez-Tenreiro et al. 2014) spectrophotometric radiative transfer calculations. grasil, much like sunrise and powderday, couples with hydrodynamic galaxy evolution codes to calculate the panchromatic UV–FIR SEDs. For a nice review of dust radiative transfer in simulations, we point the reader towards Steinacker, Baes & Gordon (2013).
3 IRX–β FUNDAMENTALS
3.1 IRX–β calculations
In order to calculate the UV continuum slope, β, we fit a simple power law f(λ) ∝ λβ between λ = 1000 and 3000 Å (where the flux is in units of erg s−1 cm−2 Å−1). We choose this relatively broad range to marginalize the effects of the 2175 Å dust feature, when present.
3.2 The reference relations
Throughout the paper, we will compare to a set of ‘reference’ relations to help put our results into context. These include (i) the original Meurer et al. (1999) relation, which is a fit to observations of local starburst galaxies; (ii) the Casey et al. (2014a) relation, which is additionally a fit to low-redshift galaxies, but includes a larger dynamic range of SFRs as well as aperture-corrected data from heterogeneous samples; (iii) recent calibrations by Takeuchi et al. (2012) and Overzier et al. (2011); and (iv) SMC curves calculated by Siana et al. (2009). For the SMC curves, Siana et al. utilize constant star formation history (SFH) Bruzual & Charlot (2003) population synthesis models (tage = 300 Myr) with an SMC extinction curve.
3.3 The parent sample in the IRX–β plane
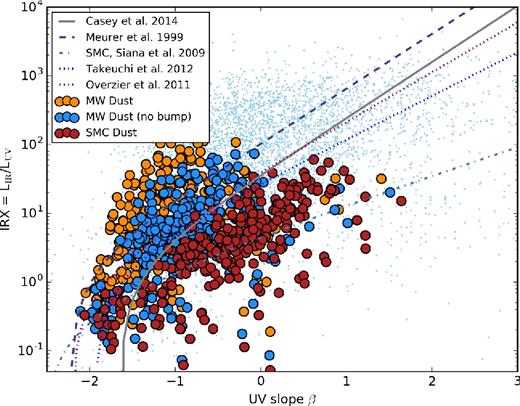
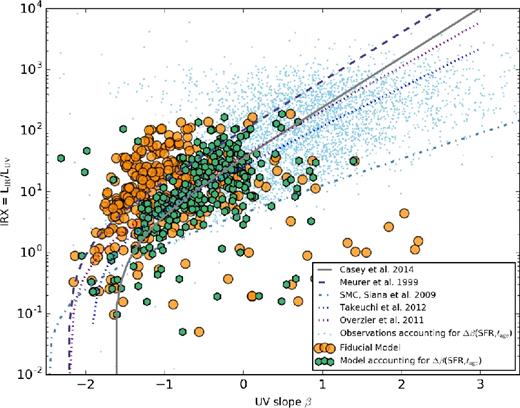
In Fig. 3, we show the location in the IRX–β plane of all snapshots of our simulated galaxies (orange points). Alongside our simulated galaxies, we show a compilation of observed data (blue), comprised of the data presented in Casey et al. (2014a), which in itself is a compilation of new observations, and the samples of Gil de Paz et al. (2007), Howell et al. (2010), Reddy et al. (2012), Penner et al. (2012) and Heinis et al. (2013). We supplement these with more recent detections by Capak et al. (2015) and Bouwens et al. (2016). We have omitted upper limits for the time being, but will return to these later in this paper. To guide the eye, we additionally plot the reference relations (cf. Section 3.2). The comparison of our model galaxies to the observed IRX–β plane presents a number of salient points.
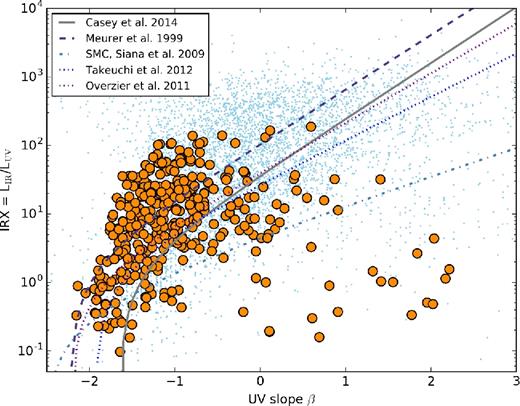
IRX–β relation for parent sample of model cosmological zoom galaxies. The simulated galaxies are the large orange circles, and compared against the light blue points that are observations from 0 ≤ z ≲ 6 (Gil de Paz et al. 2007; Howell et al. 2010; Penner et al. 2012; Reddy et al. 2012; Heinis et al. 2013; Casey et al. 2014a; Capak et al. 2015; Bouwens et al. 2016). The lines show the local reference relations (cf. Section 3.2).
First, the simulated galaxies naturally lie on a locus similar to the local reference relations, though there are a number of deviations both at high IRX and low IRX. The dispersion is significant, and owes to a range of physical effects that we will explore in turn in this paper.
Secondly, while our galaxies follow the same generic trend as observed galaxies, they do not fully cover the same extent in IRX and β as observed galaxies. We quantify this in Fig. 4, where we show histograms of the LIR, LUV, IRX and β of both our model galaxies and the observed comparison samples. While our galaxies are comparably UV luminous, we do not achieve infrared luminosities much beyond LIR ≥ 1013 L⊙, and consequently do not have model galaxies with as extreme IRX values as the most extreme outliers in the observed sample. Of course, a lack of the dustiest systems in our model sample also results in model galaxies restricted to a β range −2 < β < 1, therefore falling short of the very reddest UV continuum slopes observed.
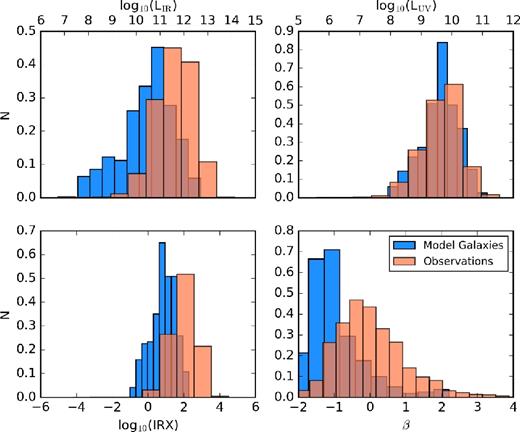
Distributions of LIR, LUV, IRX and β for both sample of model galaxies (blue) compared to compilation of observations (orange). Our modelled galaxies do not achieve as high a luminosity as the observed samples. This results in lower peak IRX and β values in our model galaxies compared to observations.
The lack of exact range matching is not a failure of the models, but rather to be taken as a comparison of sample selections: our models contain, on average, galaxies of roughly 5–10 × lower infrared luminosity than the average observed galaxy that we compare to. This said, despite the fact that the simulations do not cover the entire range of values seen in the observations, significant insight can still be gained.
In the remainder of this paper, we will dissect Fig. 3, aiming to understand both the origin of the IRX–β relation in galaxies and trends that result in deviations from the mean relation. To do this, we will no longer present the entire sample, but rather individual subsamples restricted by either physical or observable properties as it pertains to the relevant discussion.
4 DECONSTRUCTING THE IRX–β RELATION
4.1 The origin of the IRX–β relation
We begin by understanding the origin of the reference IRX–β relations; we then proceed to deconstruct large deviations from these relations.
The simplest place to start is with stellar population synthesis experiments. In the top-left panel of Fig. 5, we have created a simple stellar population with fsps that is covered with a foreground dust screen and a stellar age tage = 10−3 Gyr. These are denoted with the star symbols (we will discuss the circles, as well as the other panels in the plot shortly). For maximal simplicity, we employ this dust screen to all stars, and manually increase the normalization (i.e. optical depth) of the attenuation curve to study the location of the emergent SED in the IRX–β plane. In our default population synthesis model shown here, old stars (tage > 107 yr) do not see any dust, although in this particular example we fix all stellar ages to much less than this threshold value. The dust attenuation curve is a power law with index −0.7 (i.e. τ(λ) ∝ λ−0.7), stellar IMF of a Kroupa (2002) form and solar metallicity. The colours of the points denote the monochromatic (1600 Å) UV optical depth. As the optical depth for UV photons increases, the UV SED reddens, while at the same time power is transferred from the UV to the IR. This idealized example serves as a control experiment in that it is unmuddied by the complicating effects of a diverse stellar population and the complex star–dust geometry characteristic of real galaxies. We note that because the Simple Stellar Population (SSP) models are using a single stellar age, they present redder than the reference IRX–β relations. An increased SFH or younger stellar age moves the stellar populations bluer.
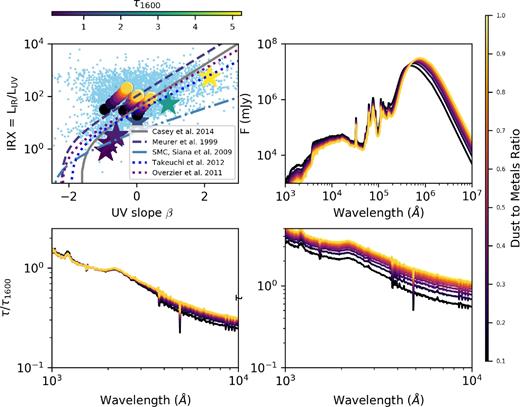
Evolution of a model galaxy in the IRX–β plane (and SED evolution) when manually increasing the dust mass of the system. Top left: stars show IRX–β relation for a simple stellar population with increasing dust optical depths (colour bar on top). Filled circles show three arbitrary simulated galaxies with increasing dust masses (colour bar on right). Top right: UV–mm wave SED for just one of the three galaxies, with increasing dust content. Bottom: optical depths both normalized by the 1600 Å optical depth (left) and not (right).
We further expand on this experiment by conducting a slightly more complex numerical exploration utilizing our model galaxies. We now turn to the filled circles in the top-left panel of Fig. 5. Here, we have selected three arbitrary galaxies from our sample (all selected at the same redshift [z ∼ 2.25] from galaxies mz0, mz5 and mz10) and plot their location using our fiducial parameters on the IRX–β relation. We then manually decrease and increase the dust mass of these galaxies by adjusting our dust-to-metals ratio and show the location of these galaxies in the IRX–β plane. (We remind the reader that our fiducial dust-to-metals ratio is 40 per cent.) Alongside this, we show the panchromatic SEDs for these points (top right), the UV optical depth (bottom left; normalized by their 1600 Å optical depth) and the unnormalized optical depth (bottom right).
As the dust column increases in Fig. 5, the optical depth seen by UV photons increases, and the UV SED flattens. At the same time, power is transferred from the UV into the infrared, resulting in increased IRX values. Of course, Fig. 5 represents contrived scenarios to show how galaxies may move along the reference IRX–β relations in the face of increasing dust column. However, as is evident both from the observed data and our full suite of numerical simulations (e.g. Fig. 3), there is significant dispersion about these reference relations. In the remainder of this paper, we explore the origin of these deviations from the reference IRX–β relations.
4.2 Dispersion in the IRX–β relation
4.2.1 Can simplified screen models capture IRX–β dispersion? The role of geometry
Prior to understanding the origin of the dispersion in the IRX–β relation, it is first worth considering whether a simple screen model at a single stellar age can capture a similar range of IRX and β values as both the cosmological zoom galaxy formation simulations and the observations.
In Fig. 6, we plot the results of fsps models akin to those presented in the top-left panel of Fig. 5. These models are a simple stellar population with a uniform dust screen with a power-law attenuation curve. In the left-hand panel of Fig. 6, we vary just the dust attenuation power-law index (from [−0.2, −1.2]) alongside the attenuation law normalization. While this model is able to span arbitrarily large β values, the very blue UV colours of high-IRX galaxies are not encapsulated in this model. In other words, simple screen geometries in population synthesis models fail to capture the complex physics underlying the locations of galaxies on the IRX–β plane.
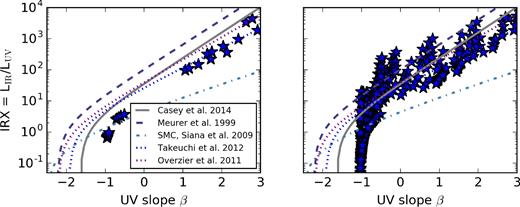
Numerical experiment conducted with fsps in which we place a simple stellar population behind a uniform power-law dust screen with varying optical depths with the goal of understanding whether simple screen models can reproduce the dispersion in the observed IRX–β relation. Left: here, we vary both the normalization and power-law index of the dust law. As the optical depth to UV photons rises, more power is transferred from the UV SED to the infrared, forcing the stellar population up the IRX–β relation. This said, the dispersion is relatively minimal in the resultant IRX–β relation. Right: same as left, but with a range of fractions of OB stars that escape their birth clouds, dust attenuation power-law indices and optical depths. Now, with complex star–dust geometries and attenuation laws, the IRX–β normalization shifts, causing significant scatter about the reference relations.
In the right-hand panel of Fig. 6, we allow a fraction of young O and B stars (tage < 107 yr) in the SPS models to run away from their birth clouds. The goal here is to decouple the sources of UV luminosity from the obscuring dust. We allow both the fraction of runaway OB stars and the fraction of decoupled old stars from dust to vary between [0,1]. In this somewhat extreme experiment, it is clear that the complex star–dust geometry is able to drive a large range of IRX–β values, and that the observed dispersion is due to a decoupling of stars from the dust attenuation screen.
4.2.2 The impact of older stellar populations
We now return to Fig. 3, and highlight the locus of galaxies that lie below the reference IRX–β relations. These galaxies predominantly arise from our halo0q (quenched) model, and reflect quenched galaxies with older stellar populations. In general, older stellar populations can drive red UV SEDs, even while maintaining relatively low IRX values.
To demonstrate this point more explicitly, in Fig. 7, we show the results of a controlled numerical experiment in which we compare the mz0 and mz0_q models. The primary difference in these models is that the latter includes our heuristic quenching model, and therefore has a significant population of evolved stars. The points are coloured by their median stellar age. As is clear, the galaxies with the oldest stellar populations preferentially lie well below the reference IRX–β relations.
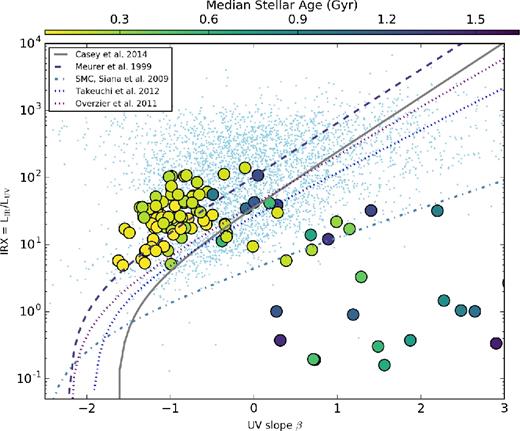
Impact of stellar age on location in the IRX–β plane. Shown is a controlled experiment, comparing models mz0 and mz0_q (i.e. identical models, though one includes a heuristic quenching model). The points are colour-coded by their median stellar age. Galaxies with older stellar populations lie below the local reference IRX–β relations due to the shifting of the UV SED towards redder colours and lack of young stars to dominate the UV SED (cf. Fig. 8).
This effect owes to the reddening of UV SEDs in older stellar populations. To show this, in the left-hand panel of Fig. 8, we conduct a numerical experiment with fsps, where we evolve a simple stellar population behind a dust screen. The example is the same as in Fig. 5, though we fix the dust optical depth and vary the stellar ages. In the right-hand panel of the same figure, we show the UV and optical SEDs for this ageing population. As stellar populations age, their UV SEDs shift towards redder β slopes, as demonstrated by the right-hand panel of Fig. 8. At the same time, they are less likely to be obscured by dust (as a reminder, in these fsps calculations, stellar populations with tage > 107 yr are unobscured), and their IRX ratios drop. (We note there is a slight increase in IRX as the populations continue to age owing to dramatic decreases in LUV.)
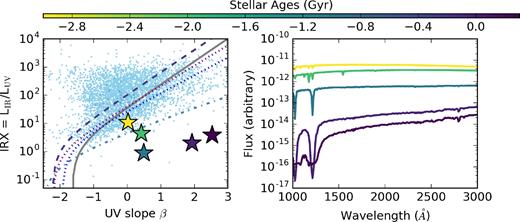
Results from a controlled fsps numerical experiment in which we model the location of a simple stellar population behind a fixed dust screen as the stellar population ages. The left-hand panel shows the location of these stellar population on the IRX–β plane (colour-coded by the stellar population age), while the right-hand panel shows the UV SED for these populations. As is evident, as the population ages, the UV SED reddens, pushing galaxies below the local reference IRX–β relations.
Of course, using the median stellar age as a sole parameter for describing deviations below the IRX–β relation is a crude parameter. What actually matters is the stellar population dominating the UV SED, which is a function of the stellar age distribution. Because of that, there is significant dispersion in the ages of galaxies that lie below the reference IRX–β relations. This said, the general point stands that, on average, older stellar populations deviate towards redder UV colours. This point has been discussed by Kong et al. (2004), who parametrized deviations from the IRX–β relation in terms of a stellar birthrate parameter, comparing the present SFR to the time-averaged past.
4.2.3 Dust composition and the 2175 Å bump
A number of studies have underscored the importance of the underlying extinction curve in driving how galaxies present in the IRX–β plane. For example, as previously discussed, Siana et al. (2009) utilize Bruzual & Charlot (2003) calculations to demonstrate that an LMC- and an SMC-like dust reddening curve result in IRX–β relations that lie, for the most part, below the standard Meurer et al. (1999) relation. Similarly, Bell et al. (2002) demonstrate that sightlines in the LMC all lie below the Meurer et al. (1999) galaxies in the IRX–β plane.
To understand how the intrinsic extinction curve impacts the observed IRX–β relation, we have conducted two numerical experiments on top of our fiducial model (which, as a reminder, utilizes a Milky Way Weingartner & Draine (2001) Rv = 3.1 extinction curve). In our first experiment, we utilize the same curve, though have eliminated the 2175 Å extinction ‘bump’. We remove the bump by linearly interpolating the extinction curve between 1600 and 4000 Å in log-space. This results in reduced attenuation in this wavelength range. For the second experiment, we utilize the Weingartner & Draine (2001) SMC dust curve. In Fig. 9, we show these extinction curves (red lines).
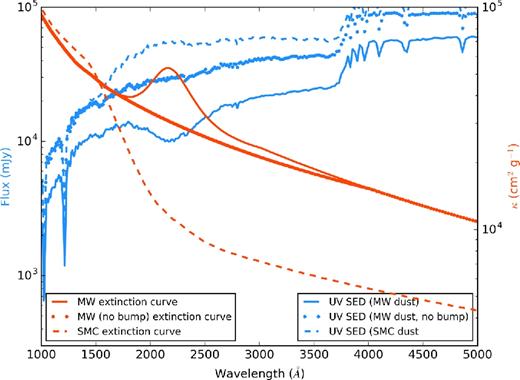
Tests varying the dust extinction curves in the models. Red lines (units on right axis) show the extinction curves: the MW, MW with no dust bump and the SMC. Blue lines (units on left axis) show how the UV–optical SED for an example simulated galaxy changes when using these extinction curves. Broadly, the MW (no bump) and SMC curves have less extinction in the NUV (as compared to the FUV), which allow more 2000–4000 Å photons to escape the galaxy. When fitting the UV SED over a range anchored at shorter wavelengths (e.g. 1000–3000 Å), this can cause the SED to appear redder, with steeper β slopes.
In Fig. 10, we show the results from these models in the IRX–β plane. Galaxies without a 2175 Å bump (but otherwise similar dust extinction properties to the Milky Way) have both lower IRX and larger β values than our fiducial model that includes the UV extinction bump. The SMC dust curve that has even further reduced extinction in the UV presents with both even lower IRX and redder β.
Impact of dust extinction curve on location in IRX–β plane. The orange points are our fiducial model (MW dust). The blue points are the same model, but using an MW extinction curve without a 2175 Å UV ‘bump’. The red points show the impact of using an SMC extinction curve. The reduction in UV extinction drives UV SEDs to lower IRX (owing to increased LUV) and redder β (owing to more transparency in the 2000–4000 Å window). See the text for details.
To understand the origin of the lower IRX and redder β values for the model without a UV bump and the SMC dust curve, we now turn to the UV SEDs (blue lines) presented in Fig. 9. At a fixed far-ultraviolet (FUV) opacity, the Milky Way dust curve with no bump has a lower near-ultraviolet (NUV) opacity, and the SMC curve a yet lower NUV opacity. As this NUV extinction is reduced, the observed UV SED shows larger power-law SED slopes owing to increased transparencies in the NUV/optical bands. Of course, the location of galaxies with the SMC dust curve is degenerate with the impact of older stellar populations (cf. Fig. 8). One must therefore exercise caution in the interpretation of galaxies that lie below the IRX–β relation.
5 APPLICATION TO OBSERVATIONS
5.1 Blue DSFGs
DSFGs are the most luminous, heavily star-forming galaxies in the Universe (e.g. Smail, Ivison & Blain 1997; Barger et al. 1998; Hughes et al. 1998; Narayanan et al. 2009, 2010b; Hayward et al. 2011, 2013; Casey, Narayanan & Cooray 2014b). A number of works recently have observed that DSFGs at a range of redshifts exhibit particularly blue UV SEDs given their IRX values as compared to the traditional IRX–β relations. In other words, the UV slopes, β, are too low for DSFGs given their infrared excesses. This was neatly summarized for a large compiled data set of z ∼ 0–4 DSFGs by Casey et al. (2014a) who demonstrated that galaxies become bluer (i.e. larger departures from the reference IRX–β relations towards lower β slopes) with increasing galaxy infrared luminosity. Similar effects have been observed by Penner et al. (2012) and Oteo et al. (2013).
In Fig. 11, we investigate the origin of blue infrared-bright galaxies. In the top-left panel, we plot our parent sample, with galaxies colour-coded by their infrared luminosity. Here, we only plot galaxies at z > 2 to remain consistent with the bulk of the observations in these samples. Immediately, it is clear that more infrared-bright systems present both above and to the left of the reference IRX–β relations. This is further quantified in the top-right panel of Fig. 11, where we show the departure from the reference IRX–β relations [here, we use the Casey et al. (2014a) relation as the reference from which we measure β departures] as a function of galaxy infrared luminosity. The light blue points show observations, while the coloured points are our cosmological zoom simulations. We ignore the actual colours of the simulated points for the time being. Regardless, it is evident that in both observed galaxies and our models, more infrared-luminous systems indeed have bluer UV SEDs than the reference IRX–β relation. Moreover, the magnitude of this departure in our simulations shows good agreement with what is observed.
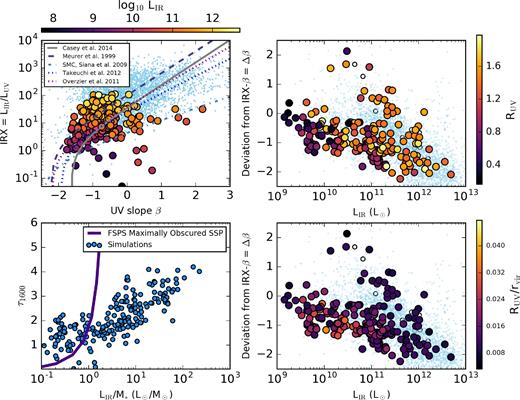
DSFGs with blue UV slopes in the IRX–β plane. The top-left panel shows our model galaxies in the IRX–β plane, colour-coded by their infrared luminosity. As is evident, galaxies with increasing L have bluer UV colours as compared to the reference relations. We quantify this in the top-right panel, where we show the deviation Δβ from the Casey et al. (2014a) relation as a function of L. The blue offset is due to two reasons: low UV optical depths due to complex star–dust geometries in heavily star-forming galaxies, and (to a lesser degree) extended UV-bright regions towards the outskirts of galaxies. The former effect is shown in the bottom-left panel, where the increase in the UV optical depth with L (normalized by the galaxy stellar mass) is significantly shallower than what is expected for complete stellar obscuration (solid line, bottom left). The latter effect is shown by the top-right and bottom-right panels, which show the UV radius on an absolute scale, and normalized by the galaxy virial radius, as a function of Δβ. See the text for details.
We first explore the possibility that extended UV-bright regions towards the outskirts of galaxies cause the blue offset for high infrared luminosity galaxies at high redshift.
Massive galaxies (i.e. the kind that typically present as DSFGs at high z) live in complex environments, with significant substructure surrounding the central galaxy (e.g. Davé et al. 2010; Narayanan et al. 2015). As demonstrated by Geach et al. (2016), many of these star-forming subhaloes are metal poor and UV bright. In the top-right panel of Fig. 11, we now highlight the colour-coding, which maps to the UV luminosity-weighted radius of our model galaxies. Indeed, this increases by a factor of ∼5 over the dynamic range modelled, with more infrared-luminous galaxies broadly having larger UV radii.
However, while this likely plays some role in driving the blue offset of DSFGs from the reference IRX–β relations, in detail the rise in UV disc sizes for more infrared-luminous galaxies is tempered by the fact that the galaxies with the highest infrared luminosity also tend to be the most massive, and hence the largest. More colloquially, bigger things are bigger. We demonstrate this in the bottom-right panel of Fig. 11, where we have now normalized the UV luminosity-weighted radii of our model galaxies by their virial radii (following the Bryan & Norman 1998, definition). Here, it is evident that any relation with the UV size of the galaxy and its blueness is erased. Hence, extended UV emission plays a role in driving some DSFGs towards bluer UV colours, though does not sufficiently paint the entire picture.
Instead, also important are low optical depth sightlines in the UV in luminous systems. These low-τ sightlines arise from the complex star–dust geometry endemic in these systems, visible in Figs 1 and 2. The decoupled sites of UV and IR emission result in significantly lower UV optical depths than would be expected for a maximally obscured geometry. In the bottom-left panel of Fig. 11, we examine the UV 1600 Å optical depth as a function of LIR (normalized by the stellar mass of the galaxy) for our model simulations. As a comparison point, we additionally plot the relation between τ1600 and LIR/M* expected for a maximally obscured source (solid line). We create this by revisiting the fsps numerical experiment conducted in the top-left panel of Fig. 5, where we examined a simple stellar population behind a screen of dust with increasing optical depth, and plot the optical depth of this population as a function of L/M* alongside our simulations. Here, we have slightly modified the numerical experiment from Fig. 5, in that we enforce that dust obscures all stars, both young and old; this represents maximal obscuration. There is a dramatic divergence in the 1600 Å optical depths at high specific infrared luminosity between the simplified maximally obscured stellar population synthesis model and our hydrodynamic simulations that exhibit more complex geometries. At the highest specific infrared luminosities, the maximal optical depth is τ1600 ∼ 4–5, reflective of the large number of sightlines towards UV sources that are relatively unobscured.
In short, we find that DSFGs at high z exhibit blue UV slopes due to low optical depth sightlines towards UV-bright regions. A similar origin is hypothesized by Casey et al. (2014a), though we note that Safarzadeh et al. (2017) suggest that frosting (i.e. recent star formation that is presumably unobscured in this case) may instead dominate the origin of blue DSFGs.
5.2 Galaxies in the first billion years
We now turn our attention to the IRX–β relation in galaxies at z ≳ 5 (for recent reviews on UV slopes at these redshifts, see Finkelstein 2016; Stark 2016). The advent of ALMA has allowed for rest-frame FIR detections of galaxies in the early Universe that, coupled with a number of assumptions, allows for FIR luminosity measurements. As a result, recent years have seen a number of constraints on the IRX–β relation in low-metallicity systems in this epoch. By and large, these galaxies appear to lie below the locus of more metal-rich galaxies at z ∼ 0–2 (and even below the canonical SMC IRX–β curve).
As an example, Capak et al. (2015) surveyed nine galaxies (between 1–4 L* and UV slopes −1.4 < β < −0.7) at z ≈ 5–6 in ALMA's band 7 (0.8–1.1 mm observed frame) and found that seven of them lie below the SMC IRX–β line (the other two being consistent with the SMC curve). Similarly, Bouwens et al. (2016) utilized the ALMA Spectroscopic Survey (2σ detections) in the Hubble Ultra-Deep Field (Aravena et al. 2016a,b; Decarli et al. 2016; Walter et al. 2016) to constrain the IRX–β relation in galaxies from z ∼ 2–10. Like the Capak et al. (2015) study, Bouwens et al. (2016) found many galaxies in this redshift range to be roughly consistent with the SMC curve (the more massive systems), or to lie below it.
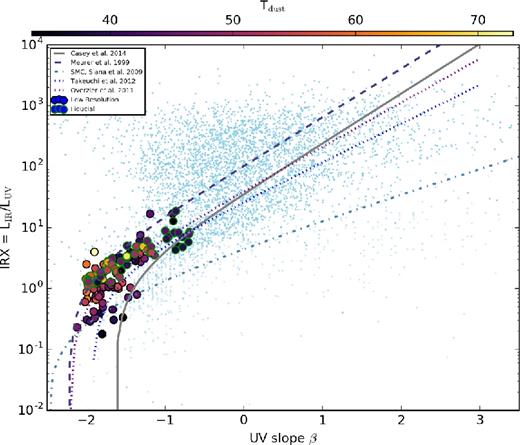
In Fig. 12, we summarize both the detections (and non-detections) in the aforementioned Capak et al. (2015) and Bouwens et al. (2016) studies, as well as show the location of our own high-redshift model galaxies on the IRX–β plane. Here, we show our model systems between 5 ≤ z ≤ 7, and for reference, include the Casey et al. (2014a) compilation of z ∼ 0–2 detections. We restrict our analysis to models mz0, mz5 and mz10 as these models best overlap the stellar mass range observed by Capak et al. (2015) and Bouwens et al. (2016, M* > 109 M⊙ at z > 5). As is clear, our model galaxies all lie on a relatively tight locus near (or above) the z ∼ 0 relations, while many of the z ≳ 5 observations have much lower IRX values.
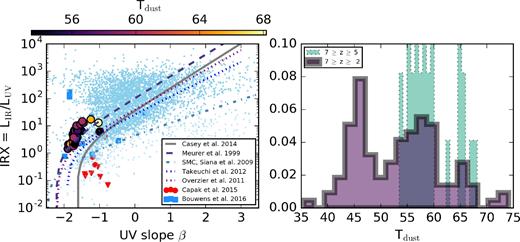
IRX–β Relations for metal-poor systems at z ≳ 5. The left-hand panel shows all model galaxies in our sample between 5 < z < 7, colour-coded by their dust temperature. Observations of systems at these redshifts in particular are noted by the blue squares (Bouwens et al. 2016) and red circles (Capak et al. 2015). The downward-facing red triangles are upper limits on the Capak et al. (2015) observations. While many observations find IRX values systematically below the reference relations for these galaxies, our models suggest that galaxies of this epoch should lie on or even above the reference relations. Our models suggest that the dust temperatures in these galaxies are quite large (50–70 K), and observations that assume significantly lower dust temperatures (i.e. those representative of z ∼ 2 galaxies, as in the observations presented here) will underestimate L, and hence IRX. In the right-hand panel, we show the distribution of Tdust for all galaxies between z = 2 and 7, as well as just those between 5 < z < 7. Due to lower dust content and harder radiation fields from low-metallicity stars, the dust temperatures of the highest redshift bin are systematically larger than low-redshift galaxies.
At face value, the observed lack of dust content in z ≳ 5 galaxies presents a challenge to our models, which predict that these galaxies ought to lie on a similar IRX–β relation as local systems (albeit towards the low IRX and β end). However, one possibility is that the observed galaxies have underestimated infrared luminosities (and hence, IRX values) due to relatively cold assumed dust temperatures.
To elaborate, in deriving the infrared luminosity, Capak et al. (2015) and Bouwens et al. (2016) both required an assumed Tdust due to the fact that only one photometric FIR data point was available. Capak et al. (2015) assumed 25 K ≤ Tdust ≤ 45 K, and Bouwens et al. (2016) assumed as a fiducial value Tdust ∼ 35 K. Of course, if the true dust temperature is warmer than this, then the derived LIR will increase, and the observed galaxies will move closer to the local IRX–β relation.
In the right-hand panel of Fig. 12, we plot the distribution of dust temperatures from our model galaxies, showing both the entire z > 2 sample and just the z > 5 sample.3 The dust temperatures are derived simply from the peak of the modelled infrared SED. While lower redshift (z ∼ 2) galaxies have dust temperatures comparable to the assumed observed values of 35–60 K, at z ≳ 5, the dust temperatures rise dramatically, with typical dust temperatures 50 < Tdust < 75 K. This owes both to lower dust masses (so UV photons have lower optical depths) and harder radiation fields in the lower metallicity stars.
On average, dust temperatures drop individual galaxies with decreasing redshift. We show this general case in Fig. 13, where we show the dust temperature for all of the galaxies used in Fig. 12, binned by their stellar mass at the redshift shown. A generic trend is that with increasing redshifts, the average dust temperature of galaxies rises. Indeed, Bouwens et al. (2016) find that their upper limits would be ∼0.4 dex higher if they had assumed a Tdust = 45–50 K, which is still well below the maximum dust temperatures we find at z ≳ 5 of ∼75 K. Even an increase of ∼0.4 dex would be enough to bring the bulk of the upper limits to values consistent with the SMC curve.
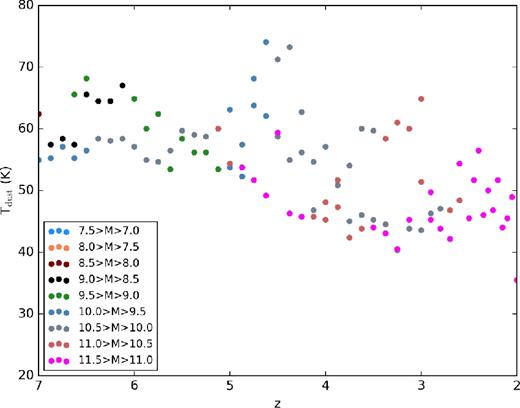
Evolution of dust temperature with redshift. We show the evolution of Tdust for our model galaxies as a function of redshift, binned by their stellar mass at that redshift. Decreasing metallicities at higher redshifts cause both lower dust contents and harder stellar radiation fields. The combination of these drives up dust temperatures systematically with increasing redshift. As a result, assuming the Tdust ∼ 35–50 K characteristic of z ∼ 2 galaxies (e.g. Magnelli et al. 2012) for higher z sources will cause a strong underestimate of the inferred L.
In summary, we therefore find that the typical dust temperature of galaxies at z ≳ 5 is substantially larger than what is observed at lower (z ∼ 2) redshifts. When accounting for this increased Tdust, inferred infrared luminosities from these systems rise and bring IRX values of observed galaxies consistent with local IRX–β relations.
6 DISCUSSION
6.1 Secondary (and tertiary) parameters in the relation
While the IRX–β relation appears to hold over a range of physical conditions, the numerical experiments conducted thus far have demonstrated a number of scenarios in which galaxies may deviate strongly from the reference IRX–β relations. These deviations have been observed in the literature for some time.
As a result, a number of authors have investigated the possibility of ‘second parameters’ in the IRX–β relation. For example, Kong et al. (2004) and Mao, Kong & Lin (2014) have studied the role of SFH in driving dispersion in the UV colours in the IRX–β relation. Kong et al. (2004) defined the ‘birthrate parameter’, proportional to the ratio of the present to past average SFR. Galaxies with lower birthrate parameters move farther from the reference IRX–β relations in a perpendicular manner. Nordon et al. (2013) parametrized this in terms of the star-forming main sequence, but also found a correlation between the dispersion in the IRX–β relation and SFR compared to the average SFH. Johnson et al. (2007a, 2013) find little correlation between the deviation in β and the SFH of star-forming galaxies as probed by the attenuation insensitive but coarse 4000 Å break strength, or by resolved stellar colour–magnitude diagrams. However, red sequence quenched galaxies where the UV is truly dominated by older populations do present with far redder β for a given IRX than star-forming galaxies. Similar results were obtained by Seibert et al. (2005), Dale et al. (2007) and Cortese et al. (2008). Grasha et al. (2013) find a better relation between the stellar age of low-IRX dwarf galaxies from SED modelling and deviations from the reference IRX–β relations. Indeed, our own models suggest that the median stellar age is quite relevant in driving red UV slopes, and thereby significant dispersion about the reference IRX–β relations (e.g. Fig. 7).
Similarly, a number of authors have investigated the dust attenuation law as a possible driver for dispersion in the IRX–β relation (e.g. Burgarella, Buat & Iglesias-Páramo 2005; Johnson et al. 2007b; Boquien et al. 2009; Safarzadeh et al. 2017). The dust attenuation law in galaxies encapsulates both the loss of photons along the line of sight and scattering back into the line of sight, and therefore is a proxy for both the extinction law and radiative transfer and geometric effects.
Popping et al. (2017) have found that dust geometry and UV photometric sampling can both add significantly to the observed dispersion in the IRX–β relation. While we do not consider the latter effect, the former features prominently in driving scatter in our models.
In our simulations, we can identify three major physical drivers of deviations from the IRX–β relation. These are as follows.
Old stellar populations.
Complex geometries of highly star-forming galaxies (and the resultant decoupled UV and IR emission sites).
Dust extinction curves that deviate substantially from a Milky Way-like curve.
In Fig. 14, we summarize the direction of these deviations schematically.

Schematic summarizing how different physical processes move galaxies in the IRX–β plane. The origin of these effects is described in detail in Section 4.
In Fig. 15, we show the IRX–β relation after applying the correction from equation (5) (green hexagons). We find that our model parametrization for Δβ (SFR, tage) does a reasonable job at collapsing the deviations from our reference Casey et al. (2014a) IRX–β relation back towards the reference, and substantially reducing the dispersion. We additionally apply the same fit from equation (5) to the observational data in Fig. 15, noting that the dispersion about the reference relations in observations as well is significantly reduced. For comparison, in the same figure, we show the fiducial IRX–β relation from our simulations (orange circles), without accounting for the blue β-offset in heavily star-forming galaxies.4 By adding the Δβ derived from equation (5) to the observed value, one can significantly reduce the dispersion and uncertainty inherent in the IRX–β relation.
IRX–β relation for our model galaxies and observations after correcting for complex star–dust geometries and older stellar populations. The orange circles are our fiducial model. The green hexagons and faint blue points show our models and observations after applying equation (5), which parametrizes shifts in the UV slope β that occur due to decoupled UV and infrared emission (cf. Section 5.1), as well as those that owe to older stellar populations (cf. Section 4.2.2). The complex geometries are reasonably well parametrized by the global SFR. The shift in UV SED slopes represented in equation (5) collapses the points with relatively high dispersion towards the reference Casey et al. (2014a) relation given by equation (4).
6.2 IRX or β?
At this point, a natural question is: does IRX or β serve as a better proxy for the UV optical depth? Indeed, this point has been investigated by a number of observational studies in recent years (e.g. Cortese et al. 2008; Kennicutt et al. 2009; Hao et al. 2011).
In Fig. 16, we plot τ1600 against both β and IRX, colour-coding the points by Δβref, where again we use the Casey et al. (2014a) derived relation as our reference relation. As is clear, β generally does a poor job of representing the monochromatic UV optical depth. The reason for this is discussed in Section 5.1. In short, strongly varying star–dust geometries complicate the interpretation of β.

6.3 Comparison to other theoretical models
A number of works in recent years have attempted to understand the IRX–β relation in galaxies from a theoretical standpoint. By and large, these methods have employed complementary techniques to our tool of choice: cosmological hydrodynamic zoom simulations.
In seminal work, Granato et al. (2000) coupled the galform semi-analytic galaxy formation model with dust radiative transfer calculations to develop a model for infrared-luminous galaxies (with a particular eye towards local ULIRGs). Semi-analytic models necessarily require a simplified star–dust geometry as the structure of galaxies is evolved in an analytic method. To wit, Granato et al. (2000) assume that the gas and dust are distributed in exponential discs, with the dust distributed both in molecular clouds and diffuse (cirrus) ISM. Stars are allowed to live within molecular clouds within some time-scale tesc. These galaxies are evolved through cosmic time (with SFRs/SFHs determined by the physics inherent in the analytic prescriptions combined with the modelled halo growth rates) and processed through grasil dust radiative transfer. grasil, similar to powderday, calculates the stellar SEDs and computes the radiative transfer through the dusty ISM.
Granato et al. (2000) found that starbursting galaxies within the galform semi-analytic framework nearly always lie close to the fiducial Meurer et al. (1999) IRX–β relationship when the stellar population is young and obscured. These authors find that the time-scale for which young stars are obscured by their birth clouds, tesc, is one of the more important parameters in dictating deviations from the reference IRX–β relations. These results appear to be in good agreement with our own model interpretations. Young stars that are well hidden by a screen of dust (cf. Fig. 5) tend to move along the reference IRX–β relations. When the UV and IR emitting regions become decoupled (cf. Fig. 6), then the population exhibits large deviations in the IRX–β plane.
More recent work by Safarzadeh et al. (2017) utilized a set of idealized hydrodynamic galaxy evolution simulations coupled with sunrise dust radiative transfer to predict the UV–infrared SED properties of both idealized disc galaxies and 1:1 major galaxy mergers. Here, the star–dust geometry is determined by the hydrodynamic evolution of the galaxy/galaxies and has no interaction with cosmologically infalling gas (this said, it is important to note that substantial radial variations in the ISM properties of idealized discs and mergers can still occur; Narayanan et al. 2009, 2011; Torrey et al. 2012). Amongst other issues, these authors investigated both the origin of blue DSFGs in their simulations. Safarzadeh et al. (2017) show that their models are able to produce galaxies with blue UV colours, akin to those in the Casey et al. (2014a) study, though attribute the origin to ‘frosting’ of young stars (i.e. recent star formation). While Safarzadeh et al. (2017) do not explore this in a quantitative sense, this may be in agreement with our own model. Our model suggests that the dominant method of forming blue DSFGs is via unobscured sightlines towards young stellar populations. If the recent star formation in the Safarzadeh et al. (2017) idealized simulations is unobscured, then the models are likely in agreement on this topic. Safarzadeh et al. (2017) additionally investigated the usage of an SMC dust curve on the location of their idealized model galaxies in the IRX–β plane. Similar to the results found here, these authors showed that the lack of NUV attenuation drives galaxies towards lower IRX and redder β slopes for the bulk of their star-forming lives.
Ferrara et al. (2017) developed an analytic model for dust growth in galaxies with the purpose of understanding Capak et al. (2015) and Bouwens et al. (2016) z ≳ 5 galaxies that lie below the reference IRX–β relations. This model derives an equilibrium dust temperature by balancing the rate of energy absorption with that of emission by dust grains. Ferrara et al. (2017) find that galaxies with significant diffuse dust exposed to the UV radiation fields typical of z ∼ 5–6 Lyman-break galaxies will have warm dust temperatures, and in effect have true infrared luminosities much larger than what is inferred when assuming colder dust temperatures typical of lower redshift galaxies. This is consistent with our interpretation of galaxies at z ≳ 5. At the same time, these authors point out that if the clouds in z ≳ 5 galaxies are denser, then the majority of the dust will be shielded from the UV radiation field, and at lower temperatures. These galaxies will have low IRX values, consistent with the Capak et al. (2015) and Bouwens et al. (2016) interpretations.
Cullen et al. (2017) combined galaxies from the First Billion Years hydrodynamic cosmological simulations (Paardekooper, Khochfar & Dalla Vecchia 2013) with bpass stellar population synthesis models (Eldridge & Stanway 2016; Stanway, Eldridge & Becker 2016) to generate stellar SEDs for model populations of early galaxies. These authors assume two models for attenuation: a total birth-cloud extinction model and a Charlot & Fall (2000) like model, and focused particularly on comparisons with the Capak et al. (2015) and Bouwens et al. (2016) high-redshift observations. Like our study, Cullen et al. (2017) find an IRX–β relation for z ≳ 5 galaxies comparable to the local reference relations, and well above the observed z ≳ 5 data. These authors suggest that the dust temperatures in observed data may be underestimated (akin to our work), and additionally rule out an SMC-like extinction curve as being compatible with observations within the context of their galaxy formation models.
Mancini et al. (2016) combined gadget-3 cosmological hydrodynamic simulations with a model for dust formation and destruction to investigate the colours of z ≳ 5 galaxy colours. These authors find galaxies at z ≳ 5 to lie primarily on the SMC curve in the IRX–β plane, though with few lying below the SMC curve in the region of space spanned by the Capak et al. (2015) and Bouwens et al. (2016) observations.
Finally, very recently Popping et al. (2017) explored population synthesis and screen models to understand observed trends in the IRX–β relation in galaxies. In particular, these authors found that inhomogeneities in the ISM due to turbulence and the mixing of stars with dust typically drive bluer UV slopes. This is in good agreement with our understanding of blue star-forming galaxies at high redshift as derived in this work. Popping et al. (2017) additionally found that the manifestation of galaxies on the IRX–β relation can depend on the UV photometric sampling, and that poor sampling can further increase the scatter in the observed relation.
6.4 Possible tensions with observations
We now turn to areas where our models may conflict with observational results. Reddy et al. (2010) examined a sample of 90 Lyman-break galaxies at z ∼ 2 that had both infrared (Spitzer) and UV measurements. With the aid of SED modelling, these authors determined that young galaxies (tage < 100) Myr have systematically lower IRX and redder β values than the older systems (tage > 100 Myr) in their sample. At face value, at least for the youngest galaxies (tage < 100 Myr) in our sample, this is in conflict with our model results presented in Figs 7 and 8 (assuming that discrepancies in stellar ages derived from SED fitting are minimal when compared to the true ages from model galaxies with complex SFHs; e.g. Conroy 2013; Simha et al. 2014).
One possibility is that the young galaxies in the Reddy et al. (2010) sample have an intrinsic SMC-type extinction curve. When these authors calculate IRX and β for their young galaxies assuming an SMC-like dust curve, the observed young galaxies all lie relatively close to the SMC curve, which could then be accommodated by our model (cf. Fig. 10). While it is unknown what drives variations in extinction and attenuation laws in galaxies, certainly a broad range of attenuation laws are observed in galaxies at low and high redshift. Indeed, Kriek & Conroy (2013) find that galaxies with larger specific star formation rates tend to have shallower dust attenuation curves. If the younger systems in the Reddy et al. (2010) sample have shallower attenuation curves (i.e. comparable to an SMC curve), then the tension between our model and the Reddy et al. (2010) observations may be reduced. This said, Reddy et al. (2006, 2010) suggest that attenuation laws are steeper for younger UV-selected galaxies.
In Section 5.2, we argued that the measurements of galaxies in the IRX–β plane at z ≳ 5 are all observed to fall under the canonical relations owing to underestimates of the true dust temperature (and therefore, underestimates of the true L). Indeed, Pavesi et al. (2016) find that for one source at a comparable redshift with a similar UV luminosity to the Capak et al. (2015) sample, the measured dust temperature is Td ≈ 60 K. That said, an additional source measured by this team returned a relatively low dust temperature of ∼35 K. These results require shorter wavelength observations for confirmation, though underscore the importance of robust dust temperature measurements at these redshifts.
7 SUMMARY
We have developed a theoretical model for the origin of and variations in the IRX–β dust attenuation relation in galaxies. To do this, we have combined cosmological zoom hydrodynamic galaxy formation simulations with stellar population synthesis models and 3D dust radiative transfer calculations. Additionally, we compare these to a variety of stellar population synthesis models. Our main results are as follows.
Galaxies with relatively young stellar populations, a Milky Way-like extinction curve, and relatively cospatial IR and UV emitting regions tend to lie on or near the standard Meurer et al. (1999) or Casey et al. (2014a) local relations. As the dust content in galaxies increases, galaxies move along these relations.
Substantial variations can be present from these reference relations. These generally owe their origin to the following effects.
Older stellar populations tend to lie below the canonical IRX–β relations, due to changes in the UV–optical SEDs of evolved stars.
Complex star–dust geometries tend to drive galaxies above the canonical relations, due to low optical depth sightlines that cause galaxies to have bluer β values than those that have more cospatial IR and UV emitting regions. These complex geometries are common in high-redshift heavily star-forming galaxies.
Galaxies with SMC-like extinction curves or those with a Milky Way-like extinction curve (but without a 2175 Å UV bump) lie below the canonical IRX–β relations.
We have used these results to understand the origin of deviations from the IRX–β relation in both high-redshift DSFGs and those detected at z > 5. The former class of galaxies have relatively blue UV SEDs due to complex star–dust geometries and low optical depth sightlines towards UV-bright regions. The latter class of galaxies tend to lie on or even above the canonical IRX–β relation. This said, their dust temperatures are quite warm (50–70 K), so IRX inferences based on a single long-wavelength photometric point are subject to systematically underestimating the L if assuming a lower Tdust.
We use the results from these simulations to derive two fitting relations to maximize the utility of the IRX–β relation in galaxies.
We derive a fitting relation (equation 5) between Δβref, tage and the SFR [i.e. the deviation in β from the reference relations due to complex geometries (characterized by the galaxy SFR) and the stellar ages]. The usage of this correction factor reduces the dispersion inherent in the IRX–β relation.
We derive a fit between the UV optical depth (τ1600) and IRX (which serves as a good proxy for the UV optical depth); equation (6).
In general, our models suggest that no single IRX–β relation exists for galaxies, and that some caution must be exercised when correcting for dust obscuration using this method. We find that it is possible to correct for some of these deviations, though a reasonable amount of scatter in the relationship is still present.
Acknowledgements
Wethank Caitlin Casey, Alex Pope, Naveen Reddy, Nick Scoville, Brian Siana and Dan Stark for helpful conversations. We are additionally appreciative to Rychard Bouwens, Caitlin Casey, Brian Siana and Fabian Walter for providing the results from their observational studies in easily digestible digital format. We also thank Danielle Skinner for uncovering a negative sign typo in equation (6). DN thanks the organizers of the ‘Physical Characteristics of Normal Galaxies at z > 2’ conference in Leiden, where many of the ideas for this paper were generated. The simulations published here were run on the University of Florida HiPerGator supercomputing facility, and we are grateful to the University of Florida Research Computing for providing computational resources and support that have contributed to the research results reported in this publication. Partial support for DN was provided by NSF AST-1009452, AST-1445357, AST-1724864, NASA HST AR-13906.001 from the Space Telescope Science Institute, which is operated by the Association of University for Research in Astronomy, Incorporated, under NASA Contract NAS5-26555, and a Cottrell College Science Award, awarded by the Research Corporation for Science Advancement. JEG acknowledges the Royal Society for a University Research Fellowship.
Footnotes
The ‘mz’ in the nomenclature for the models refers to mufasa zooms simulation series, while the trailing number denotes the Nth most massive halo in the volume. Therefore, model mz0 is the most massive halo in the 50 h−1 Mpc volume, while mz45 is the 46th most massive halo. Note that these mass rankings are taken at the z = 2 for the mz series of simulations, and z = 0 for the z0mz series of simulations.
To ensure that we do not miss any cold dust outside our fiducial 25 kpc box, we utilize a larger 200 kpc box for the radiative transfer calculations for our Tdust derivation.
For the observed galaxies, we employ the Murphy et al. (2009) L–SFR calibrations as summarized in Kennicutt & Evans (2012). We assume that half of the radiation from star formation is reprocessed in the infrared. Because we have no information about the stellar ages, we assume 250 Myr stellar ages for all galaxies.
REFERENCES
APPENDIX A: MODEL TESTS
A1 Resolution tests
In Fig. A1, we show a resolution test with our hydrodynamic models. In specific, we compare the simulated IRX–β results from two runs of a test model, halo mz45. One is our fiducial model (points with green circles outlined), while the other (points with black outline) is a model run with a factor of 8 lower mass resolution. The lower resolution model on average shows lower IRX and β values, though broadly occupies a similar swath of IRX–β plane space as our fiducial model. The colours show the dust temperature and show a similar range in galaxy dust temperature regardless of resolution level. Important to note is that even the lower resolution model shows warmer dust temperatures at lower IRX and β values.
Effects of resolution of hydrodynamic simulation. The points with green circles outlined represent our fiducial model for halo mz45, while the remaining points draw from a test simulation with one level lower refinement in the initial conditions (i.e. a factor of 8 larger mass resolution). The lower resolution simulation shows slightly lower IRX and β values, though both models show a similar range in galaxy dust temperature.
A2 The impact of subresolution obscuration
Dust obscuration on subresolution scales can have a potential impact on the results from dust radiative transfer. For example, Jonsson, Groves & Cox (2010) showed the impact of birth clouds surrounding young stars on the infrared SED of model idealized galaxies, while Narayanan et al. (2010a) demonstrated the impact of the same birth clouds on the submillimetre SEDs of high-redshift systems. In our fiducial models here, we do not include any such obscuration owing to the fact that the lifetimes of these clouds are a free parameter that can have a significant impact on the SED.
To assess the impact of subresolution obscuration on our results, we include a Charlot & Fall (2000)-type birth cloud with a dissipation age of 107 yr. In Fig. A2, we show the impact of these clouds on a test run of halo mz45. Unsurprisingly, the increased obscuration moves galaxies along the fiducial IRX–β relation. A mixture of levels of subresolution obscuration in galaxies of different masses and evolutionary states may further increase the scatter in the IRX–β relation from what is seen in our fiducial model.
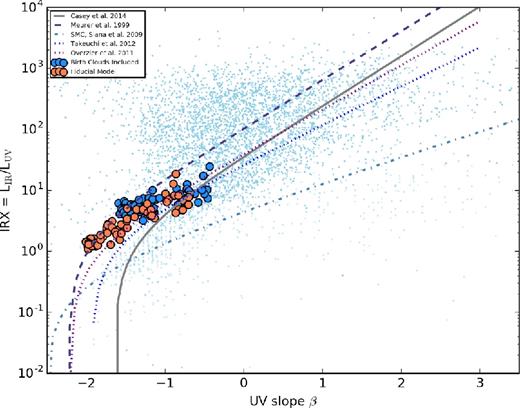
Impact of the inclusion of obscuring subresolution birth clouds on the IRX–β relation. The orange points show our fiducial model for halo mz45 (which does not contain a subresolution model for birth clouds), while the blue points show a model that models natal cloud obscuration via a Charlot & Fall (2000) model with a 0.01 Gyr clearing time-scale. The impact of the birth clouds is to increase obscuration, and therefore drive galaxies to larger IRX and β values.
We additionally assess the role of birth clouds in blue high-redshift DSFGs. In Fig. A3, we show the equivalent of Fig. 11, though with Charlot & Fall (2000) birth clouds included. A comparison with Fig. 11 shows relatively minimal impact. Why is this? To understand, we now turn to Fig. A4, where we show the intrinsic stellar and observed SEDs for a galaxy with our fiducial model set up, and one with the Charlot & Fall (2000) birth clouds turned on. It is clear that diffuse, warmer dust dominates the obscuration over the cold Charlot & Fall (2000) birth clouds as implemented in these models.

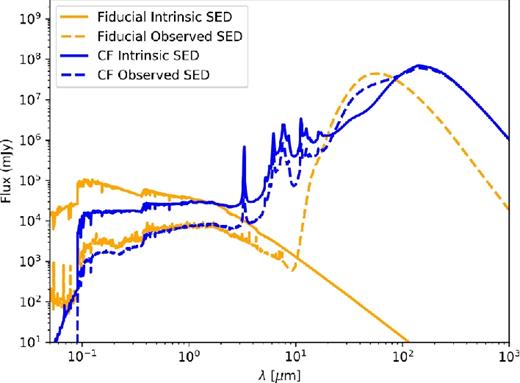
SEDs of a model galaxy with our fiducial dust scheme (orange), and including Charlot & Fall (2000) birth clouds (blue). Both the intrinsic stellar (solid lines) and ‘observed’ (dashed lines) SEDs are shown. For the model with the birth clouds, the reprocessing by the clouds occurs in the fsps stellar SED generation, and so the effects of these clouds appear in the intrinsic stellar SED calculation. While the cold dust surrounding stars provides substantial obscuration of UV photons, the bulk of the obscuration comes from diffuse dust in the galaxy.
A3 Dust sublimation
Khakhaleva-Li & Gnedin (2016) recently modelled the emission from reionization-epoch galaxies, and in particular, utilized hyperion as the dust radiative transfer solver (similar to our work here). These authors find that adopting a simple dust-to-metals ratio for setting dust masses (as we have done here) provides a poor fit to high-redshift (z > 5) UV luminosity functions, and that a model in which dust sublimates at high temperatures gives a better match. Our fiducial model does not include any dust sublimation physics. In order to assess the impact of dust sublimation at high temperatures, we have run a test model in which we employ the hyperion fast dust sublimation model (Robitaille 2011) at temperatures above Tsublimation = 1600 K. We compare this to our fiducial model in Fig. A5. We find that while some differences exist in IRX–β space, they are generally minor.
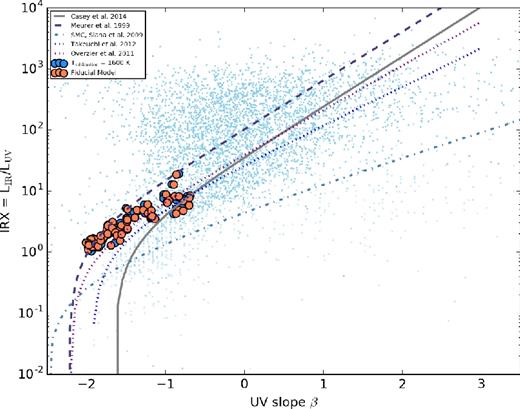
Impact of the inclusion of dust sublimation physics in our models. The orange points show our fiducial model for halo mz45 (that does not include any dust sublimation), while the blue points include a model for immediate dust sublimation at temperature Tsublimation ≥ 1600 K. While differences exist in IRX–β space, they are relatively minimal.
