


Abstract
The distance of the Galactic supernova remnant (SNR) IC 443 (G189.1+3.0, 3C157) is uncertain. Results based on measurements in the optical range from 0.7 to 1.5 kpc, while the assumption that the SNR is associated with the H ii region S249 implies a distance of 1.5–2 kpc. We present the kinematics of the north-eastern region of SNR IC 443. The results were obtained using a scanning Fabry–Pérot interferometer at the H α line. The kinematics derived from the Fabry–Pérot velocity cubes enabled us to obtain the kinematic distance to this nebula. We estimate that IC 443 is located about 1.9 kpc from the Sun. IC 443 shows a complex morphology consisting of three interconnected roughly spherical subshells that have substantially different radii and centroids. The geometry is fully constrained by the structural and kinematic data. Two of these subshells together define the usually assumed boundaries of IC 443, while the third includes optical filaments that extend beyond the bright north-eastern rim. These filaments have been shown to have well-correlated non-thermal radio counterparts. We present the kinematic results of H α Fabry–Pérot observations obtained with the PUMA equipment at the 2.1-m telescope of the Observatorio Astronómico Nacional at San Pedro Mártir, Baja California, México. These results enable us to distinguish between the SNR and the H ii region S249, both of which are in the line of sight. We find that the H ii region is located 0.6 kpc in front of the SNR.
1 INTRODUCTION
The Galactic supernova remnant (SNR) IC 443 (G189.1+3.0, 3C 157), also known as the Jellyfish Nebula in the visible sky, is an evolved SNR of ∼45 arcmin in diameter (Green 2014). The morphology that we can see in the Monte Palomar sky plates shows two hemispheres with different radii. The north-eastern hemisphere resembles a mushroom with a filamentary appearance, and the western hemisphere consists of radially extending filaments. This SNR has been studied in various wavelengths. Observations in the radio reveal a non-thermal spectrum typical of SNR (Duin & van der Laan 1975; Braun & Strom 1986; Green 1986; Reich, Zhang & Furst 2003; Leahy 2004 among others). Optical filaments show a high [S ii]/H α ratio, typical of nebulae ionized by shock waves (D'Odorico 1974; Fesen 1984).
Following its launch, the Einstein space satellite detected IC 443 as an extended X-ray source, filling in the optical and radio shell (Petre et al. 1988; Wang et al. 1992; Asaoka & Aschenbach 1994; Olbert et al. 2001; Roberts, Romani & Kawai 2001; Kawasaki et al. 2005). In addition, IC 443 is a γ-ray source (Esposito et al. 1996). A hard, non-thermal, X-ray source located in the southern portion of IC 443 was first discovered by Keohane et al. (1997) with Advanced Satellite for Cosmology and Astrophysics (ASCA). A pulsar was found at this position from high-resolution Chandra observations by Olbert et al. (2001). Leahy doubted the genuine association between the pulsar and IC 443, but the X-ray analysis of Gaensler et al. (2006) favoured the association. From deep Chandra Advanced CCD Imaging Spectrometer (ACIS) observations of the region around the pulsar J061705.3+222127 in IC 443, Swartz et al. (2015) found that the non-thermal spectrum and morphology of the surrounding nebula are consistent with a pulsar wind nebula.
This SNR is also interesting because of its association with a molecular cloud. This association, coupled with our kinematic study, should provide information about the evolution of the shock wave of a SNR spreading in a molecular medium. This is the type of impact that could be induced in the environment and the role played by the shock wave when shooting or inhibit star formation. Rosado, Arias & Ambrocio-Cruz (2007) showed its real association with the molecular H2 cloud. The estimated age of this SNR has ranged from 3000 to 30 000 yr (Petre et al. 1988; Olbert et al. 2001; Leahy 2004). More recently, Lee et al. (2008) suggested that IC 443 is 20 000 years old.
The optical filaments of IC 443 show violent movements (∼100 km s−1), as measured by Courtés (1960). Subsequently, several studies have been carried out at optical wavelengths (Pismis & Rosado 1974; Lozinskaya 1981; Fesen & Kirshner 1980). The determination of the distance of IC 443 is uncertain: kinematic velocities, based on systemic measurements of velocity in the optical, range from 0.7 to 1.5 kpc (Lozinskaya 1981), while the assumption that the SNR is associated with the H ii region S249 implies a distance of 1.5–2 kpc. This latter distance is based on the photometric distance of the member stars of the H ii region and belong to the stellar association GemOB1 (Fesen 1984; Braun & Strom 1986; Reich et al. 2003; Gao et al. 2011).
The proximity of the SNR to the Galactic anti-centre means that there are none of the confusing effects that usually complicate studies of inner Galactic SNRs.
In this paper we present a kinematic study and the energy balance of the north-east filaments, with the aim of showing that IC 443 is part of a single event: a supernova explosion that occurred in an inhomogeneous medium. We also determine the kinematic distances of both SNR IC 443 and the H ii region S249. In addition, our kinematic data allow us to derive the initial energy of the SN explosion, the evolutionary stage and the SNR age.
In Section 2, we describe our observations and data reduction. The kinematic properties resulting from our data are presented in Section 3. Finally, a discussion and conclusion are presented in Section 4.
2 OBSERVATIONS AND DATA REDUCTION
Observations of SNR IC 443 were carried out with the Fabry–Pérot (FP) scanning interferometer (PUMA) of the Universidad Nacional Autónoma de México (UNAM), installed at the focus f/7.9 of the Ritchey–Chrétien 2.1-m telescope at the Observatorio Astronómico Nacional on the Sierra San Pedro Mártir (OAN-SPM), Baja California, México.
The PUMA instrument consists of a FP scanning interferometer, an f/3.95 focal reducer with a camera, a filter wheel, a calibration system and a CCD detector. The FP interference order is 330 to the H α wavelength, covering a free spectral range of 19.89 Å (908 km s−1) with a finesse of 25. Observations were carried out using an H α filter (λ = 6562.78 Å), with a free spectral range covered by 48 scanning channels, giving a spectral resolution of 19 km s−1 for this line. 3D velocity cubes of 512 × 512 × 48 in a field of view of 10 arcmin × 10 arcmin were obtained using the Marconi 2 CCD (spectral resolution of 1.2 arcsec pixel−1).
The FP data cube consists of 48 channels with 120-s integration time for each channel, giving a total exposure time of 96 min. The calibration data cubes were taken both before and after nebula exposure, in order to detect any possible instability of the instrument. These data cubes consist of 48 channels with an exposure time of 2 s per channel, giving a total exposure time of 1.6 min. A PUMA observation consists of the following data cubes:
one cube from the nebula observation, termed CIO;
two calibration data cubes, termed CIE and CIEZ;
a flat-field correction, termed CIF.
The data reduction was performed using the specialized software cigale (Le Coarer et al. 1993), which enables us to perform flat-field corrections, calibrate in wavelength, construct the velocity map, and both obtain and adjust the radial velocity profiles. It is possible to build monochrome images and images on the continuum from the 3D data cube with this software. A complete description of the data reduction technique is given in Amram et al. (1991). A brief description of the procedure follows.
The data cube is iteratively corrected for instrumental effects, bias and flat-fields.
From the calibration cubes, a phase map is derived in order to obtain the map in wavelengths, which in turn be used to produce the data cube (x, y, λ).
The lines coming from the sky are identified and removed from the nebula profiles. The main problem comes from the fact that the geo-coronal H α and OH lines of the atmosphere are very close to the emission line in which the SNR is being observed. The sky lines are adjusted with the instrumental profile (Airy function).
Finally, the emission profiles and the map in lambda are obtained in order to determine the value of the radial velocities of the SNR.
3 RESULTS
Fig. 1 shows the optical image of SNR IC 443 obtained from the Sky View Virtual Observatory (DSS). The position of the region studied herein is indicated by a circle ∼10 arcmin in diameter. Fig. 2 shows the monochromatic image of the field obtained from our observations. This field corresponds to the region marked in Fig. 1. The image covers a field of view of 10 arcmin × 10 arcmin, which is already corrected for bias and lines of the night sky.
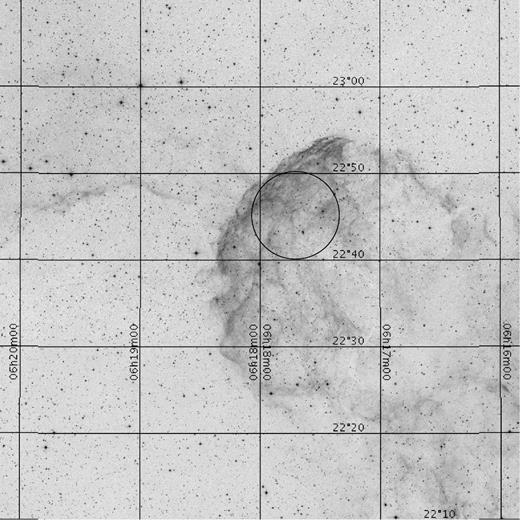
Optical image obtained from the Sky View Virtual Observatory (DSS- Digitized Sky Survey) of the entire SNR IC 443 covering a field of view of 1° × 1°. The region studied in this work is marked by a circle. North is up and east is to the left. The coordinates (α, δ) are in J2000.
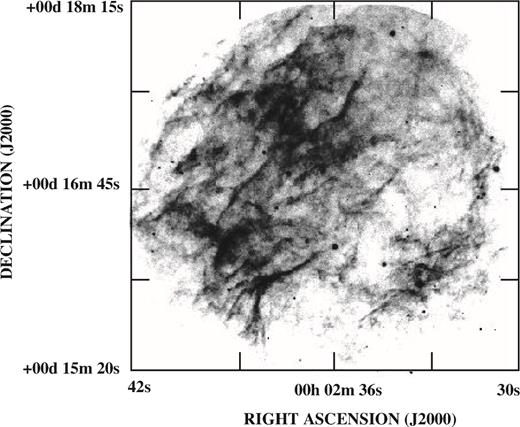
H α image obtained with the PUMA instrument of the north-east region of SNR IC 443, covering a field of view of 10 arcmin × 10 arcmin. This zone corresponds to the region indicated in Fig. 1 with a circle. North is up and east is to the left.
In order to obtain information on the kinematics, we integrated the emission over a number of regions. The extracted velocity profiles were analysed by fitting one or more Gaussians, once deconvolution with the FP instrumental function had been achieved.
From the Gaussian fit to the line profiles, we found that there is a component (which is common throughout the field) of VLSR = 6 km s−1 with a full width at half-maximum (FWHM) of the order of 20 km s−1. We have assumed that this velocity component, anothers velocity components, is the systemic velocity of the H ii region S249. In addition to this component, there are along the entire filamentary structure. Extreme values of VLSR = 114 km s−1 were found in the south-west filaments, which corresponds to the red component, while the blue component has VLSR = −96 km s−1. We thus obtain a systemic velocity for the SNR of Vsys = 9 km s−1 and an expansion velocity of Vexp = 105 km s−1. We therefore do not expect to have an accurate determination of the expansion velocity if the shell is expanding spherically from the geometrical centre, because in that case, as a result of projection effects, the maximum velocity difference is found at the centre of the remnant.
It should be noted that it was the south-west region of our observations where we found the most extreme values of expansion. This zone is the one that is coincident with the molecular cloud associated with this remnant.
In order to obtain the distance to IC 443 and S249, we assumed that they follow the Galactic circular rotation law given in Brand & Blitz (1993); in this way, we calculated a distance of 1.9 kpc to IC 443 and of 1.3 kpc to the H ii region S249. Our observations correspond to Shell A in fig. 1 of Lee et al. (2008). In view of this, we take the radius for this shell to be 19 arcmin; which corresponds to 10.5 pc.
In order to obtain the age and energy of the SNR, we applied the model of Chevalier (1974) for a SNR in the radiative phase. The pre-shock density (10 cm−3) was taken from Lee et al. (2008).
Table 1 shows the kinematic results obtained from the present study. Column 1 gives the interstellar medium component (H ii or SNR region); column 2 shows the systemic velocity in km s−1; column 3 shows the kinematic distance in kiloparsecs; column 4 gives the mean radius; column 5 gives the expansion velocity for the supernova remnant; column 6 gives the age of the SNR in years, calculated taking into consideration that the SNR is in its radiative phase; finally, column 7 gives the energy injected (in ergs) into the interstellar medium by the SN explosion, again considering the SNR to be in its radiative phase.
Kinematic results from SNR IC 443 and the H ii region S249.
| Vsys | Distance | Radius | Vexp | Age [yr] | Eo [erg] | |
|---|---|---|---|---|---|---|
| km s−1 | kpc | pc | km s−1 | Radiative phase | Radiative phase | |
| H ii region S249 | +6 | 1.3 | ||||
| SNR IC 443 | +9 | 1.9 | 10.5 | 105 | 3.0 × 10⁴ | 7.2 × 1050 |
| Vsys | Distance | Radius | Vexp | Age [yr] | Eo [erg] | |
|---|---|---|---|---|---|---|
| km s−1 | kpc | pc | km s−1 | Radiative phase | Radiative phase | |
| H ii region S249 | +6 | 1.3 | ||||
| SNR IC 443 | +9 | 1.9 | 10.5 | 105 | 3.0 × 10⁴ | 7.2 × 1050 |
Fig. 3 shows some examples of the radial velocity field of the IC 443 region studied in this paper. We found that the more extreme velocities are found in the south-west of the observed field. These filaments show velocities ranging from −189 to 132 km s−1. In the range of −95 km s−1 to −19 km s−1 the emission is very filamentary. The H α emission is more intense in the range of velocity from 0 to 19 km s−1, and this emission covers almost the whole field.

Radial velocity profiles integrated over various areas. The vertical axis is the intensity in arbitrary units, and the horizontal axis is the channel number. The profile (0) is a night sky line. The filaments show violent movements, some with Vexp > 100 km s−1.
4 CONCLUSIONS
In the present work, we have shown that the observed filaments of SNR IC 443 show violent movements owing to the explosion of a SN that occurred about 30 000 years ago and that injected an energy of 7.2 × 1050 erg into the interstellar medium. It is noteworthy that the most violent movements occur in the south-west region, which coincides with the end of the molecular cloud associated with this SNR. It would be useful to make observations in the region of this molecular cloud in order to deepen our understanding of shock-wave evolution in molecular clouds. An interesting conclusion of the present work is that IC 443 is a simple SNR that is expanding in a non-homogeneous interstellar medium.
Another important, and novel, result of this work is that we found that the H ii region S249 and the SNR IC 443 are at different distances and that we are observing them projected in the same field, with the SNR being more distant than the H ii region S249.
A distance of 1.5 kpc (corresponding to a radius of 10 pc) is adopted in most papers related to IC 443, although this figure is still being debated (Fesen 1984; Welsh & Sallmen 2003). In this work, we have determined a distance of 1.9 kpc, which corresponds a radius of 10.5 pc. This distance is in agreement with the diameter calculated using the Σ–D relationship, which suggests a distance in the range of 1.5–2.5 kpc for IC 443.
The filaments show violent motions (>100 km s−1). These can be explained if we assume that a SN exploded 30 000 years ago, injecting an energy of 7.2 × 1050 erg into the environment, with the SN now in the radiative phase.
Acknowledgements
This paper is based on observations obtained at the Observatorio Astronómico Nacional de San Pedro Mártir, BC, México. We wish to thank the referee for reading the manuscript carefully and providing valuable comments and suggestions, which helped us to improve the manuscript. We are very grateful for financial support from DGAPA–PAPIIT UNAM: IN103116 and CONACYT CY–253085. This work was also supported by PAI–UAEH–2016-3280. E de la F wishes to thank CGCI–UdeG staff and the Consorcio de Universidades Mexicanas (CUMex) for financial support via the CUMex Researcher's Mobility Scholarship program 2017.
REFERENCES
