-
PDF
- Split View
-
Views
-
Cite
Cite
Katsuhiro L. Murata, Rika Yamada, Shinki Oyabu, Hidehiro Kaneda, Daisuke Ishihara, Mitsuyoshi Yamagishi, Takuma Kokusho, Tsutomu T. Takeuchi, A relationship of polycyclic aromatic hydrocarbon features with galaxy merger in star-forming galaxies at z < 0.2, Monthly Notices of the Royal Astronomical Society, Volume 472, Issue 1, November 2017, Pages 39–50, https://doi.org/10.1093/mnras/stx1902
Close - Share Icon Share
Abstract
Using the AKARI, Wide-field Infrared Survey Explorer (WISE), Infrared Astronomical Satellite (IRAS), Sloan Digital Sky Survey (SDSS) and Hubble Space Telescope (HST) data, we investigated the relation of polycyclic aromatic hydrocarbon (PAH) mass (MPAH), very small grain mass (MVSG), big grain mass (MBG) and stellar mass (Mstar) with galaxy merger for 55 star-forming galaxies at redshift z < 0.2. Using the SDSS image at z < 0.1 and the HST image at z > 0.1, we divided the galaxies into merger galaxies and non-merger galaxies with the morphological parameter asymmetry A, and quantified merging stages of galaxies based on the morphological indicators, the second-order momentum of the brightest 20 per cent region M20 and the Gini coefficient. We find that MPAH/MBG of merger galaxies tend to be lower than that of non-merger galaxies and there are no systematic differences of MVSG/MBG and MBG/Mstar between merger galaxies and non-merger galaxies. We find that galaxies with very low MPAH/MBG seem to be merger galaxies at late stages. These results suggest that PAHs are partly destroyed at late stages of merging processes. Furthermore, we investigated MPAH/MBG variations in radiation field intensity strength G0 and the emission line ratio of |$[{\rm O\,\small {I}}]\, \lambda 6300/{\rm H}\alpha$| that is a shock tracer for merger galaxies and find that MPAH/MBG decreases with increasing both G0 and |$[{\rm O\,\small {I}}]/{\rm H}\alpha$|. PAH destruction is likely to be caused by two processes: strong radiation fields and large-scale shocks during merging processes of galaxies.
1 INTRODUCTION
Polycyclic aromatic hydrocarbons (PAHs), large planar molecules with 50–1000 carbon atoms, are a ubiquitous component of galaxies in the Universe. PAHs are quite easily destroyed by various physical processes, which include collisions with high-velocity electrons and ions in shock regions induced by supernovae (SNe) and hot plasma, strong ultraviolet (UV) radiation of massive young stars and hard UV and soft X-ray radiation of active galactic nuclei (AGNs). Several studies found that PAH emission in supernova remnants (SNRs) is significantly suppressed relative to dust emission (e.g. Ishihara et al. 2010b), which can be explained by low abundance of PAHs relative to dust through selective destruction of PAH by SN-induced shocks (e.g. Tielens 2008). In low-metallicity starburst galaxies, supernova-induced shocks are considered to be a more dominant process for destruction of PAHs than UV radiation from massive stars (O'Halloran, Satyapal & Dudik 2006), although the latter is crucial for PAH destruction in low-metallicity blue compact dwarf galaxy (Plante & Sauvage 2002).
Merging of galaxies is considered to induce large-scale strong shocks in the galaxies; PAH destruction on a galaxy scale is expected to occur during this merging process. Recent integral field spectroscopic observations found that some nearby galaxies possess extended ionized gas with high velocity dispersions, which is interpreted as galaxy-wide shocks with speeds of 150–500 km s−1 induced by merging of galaxies (Monreal-Ibero, Arribas & Colina 2006; Monreal-Ibero et al. 2010; Rich, Kewley & Dopita 2011, 2014, 2015). In the hierarchical picture of a galaxy assembly, galaxies have evolved through merging processes. Since the merging of galaxies is common especially at higher redshifts (e.g. Lotz et al. 2011), it is crucial to explore the PAH destruction during a merging process in order to understand the history of PAH enrichment for various types of galaxies in the Universe.
The number of systematic studies about PAH destruction through merger-induced shocks is, however, rather limited, because a large sample of star-forming galaxies during merging processes is required. Since some galaxies in merging processes have AGNs that also destroy their PAHs by hard UV and soft X-ray radiations, it is necessary to divide galaxies into pure star-forming galaxies and galaxies with AGNs in order to investigate the PAH destruction by merger-induced shocks. In our previous study of Yamada et al. (2013), we constructed the clean sample of star-forming galaxies based on the PAH 3.3 μm feature equivalent width and near-infrared (NIR) slope using spectroscopic observations by the AKARI satellite (Murakami et al. 2007) and investigated their 3.3 μm PAH luminosity (LPAH3.3) and total infrared luminosity (LTIR). We find that LPAH3.3/LTIR systematically decreases with LTIR, which is interpreted as decreases in the amount of PAHs relative to dust grains with LTIR. Combining the decrease of LPAH3.3/LTIR and the previous observations that a merger fraction increases with increasing LTIR, Yamada et al. (2013) suggested that PAHs are destroyed via shocks induced by merging processes of galaxies.
In this paper, we aim to investigate the relation of PAH features (LPAH) with galaxy merger for star-forming galaxies, using optical images of the Sloan Digital Sky Survey (SDSS) and Hubble Space Telescope (HST). Optical images with high spatial resolution allow us to identify galaxy merger remnants and thus securely classify galaxies into merger galaxies and non-merger galaxies.
2 SAMPLE OF STAR-FORMING GALAXIES
Our sample consists of 57 star-forming galaxies in the sample of Yamada et al. (2013), out of which 48 galaxies were observed with SDSS Data Release 9 (DR9; Ahn et al. 2012) at redshift z < 0.1 and the other nine galaxies were observed with HST at redshift 0.1 < z < 0.2. The sample of Yamada et al. (2013) was based on the two AKARI mission programs: Mid-infrared Search for Active Galactic Nuclei (MSAGN; Oyabu et al. 2011) and Evolution of ULIRGs and AGNs (AGNUL; Imanishi et al. 2008, 2010). These two programs observed galaxy spectra at 2.5–5 μm wavelengths with a spectral resolution of R ∼ 120 (Ohyama et al. 2007) using the AKARI/Infrared Camera (IRC; Onaka et al. 2007), which enables to detect the PAH 3.3 μm feature and to measure the NIR continuum slope. Galaxies with either the equivalent width of the 3.3 μm feature <40 nm (Moorwood 1986; Imanishi & Dudley 2000; Imanishi et al. 2008) or NIR continuum slope Γ > 1 (|$f_\nu \sim \lambda ^\Gamma$|) (Risaliti et al. 2006; Imanishi et al. 2010) were excluded as those likely contaminated by AGN activity.
We constructed a sample of 48 galaxies with the SDSS g-band images at z < 0.1 from the sample of Yamada et al. (2013). The redshift boundary is determined to avoid the uncertainties of galaxy morphology estimation due to lower physical spatial resolution towards higher redshifts, which is important for secure morphological classification of our sample into merger galaxies and non-merger galaxies. The pixel scale and typical full width at half-maximum (FWHM) size of point spread function (PSF) are 0.396 and ∼1.5 arcsec, respectively. The PSF size corresponds to the physical resolution of 2.8 kpc at z = 0.1 that is sufficient to resolve merger features.
For the galaxies of Yamada et al. (2013) at z > 0.1, we searched the optical images with high spatial resolutions of the HST in the Hubble Legacy Archive1 and constructed a sample of nine galaxies with the HSTF814W band images. The HST galaxies are at spectroscopic redshift z = 0.108–0.168. The pixel scale and the PSF FWHM are 0.10 and ≲ 0.2arcsec, respectively. The PSF size corresponds to the physical resolution of ≲0.6 kpc at z = 0.168.
We searched for companion galaxies of the 57 galaxies. For the SDSS sample, we defined sources with ‘galaxy’ class in the SDSS catalogue within 150 kpc from the primary galaxy positions and within relative velocity along line-of-sight of 500 km s−1 from the primary galaxies as companion galaxies. The relative velocities were estimated from the SDSS spectroscopic redshifts. We determined the boundaries used in the AKARI above definition of companion galaxies according to the merger simulation by Lotz et al. (2010). For the HST sample, we searched for companion galaxies in the HST image by visual inspection. As a result, out of all the 57 galaxies in our sample, 21 galaxies are found to have a companion galaxy.
3 DATA ANALYSIS
3.1 Spectral energy distribution fitting
We estimated infrared properties of dust and PAH by a spectral energy distribution (SED) fitting technique using multiband photometric data from NIR to far-infrared (FIR) wavelengths. We used the photometric data of the 9, 18, 65, 90, 140 and 160 μm bands of AKARI, the 12 and 22 μm bands of Wide-field Infrared Survey Explorer (WISE; Wright et al. 2010), the 25, 60 and 100 μm bands of Infrared Astronomical Satellite (IRAS; Neugebauer et al. 1984) and the 2.5–5 μm spectrum of the AKARI/IRC for the SED fitting. The data of 2.5–5, 9 and 12 μm likely trace PAH emission features, while the other photometric data trace dust continuum emission.
The 9 and 18 μm fluxes were measured from the AKARI mid-infrared all-sky diffuse maps (Ishihara et al. 2010a; Ishihara et al., in preparation) and the 65, 90, 140 and 160 μm fluxes were measured from the AKARI FIR all-sky diffuse maps (Doi et al. 2015). The source fluxes were calculated by circular aperture photometry with background sky subtraction. The aperture sizes are flexibly changed to capture most of the galaxy light. Systematic uncertainties derived from the AKARI instruments and the photometric calibrations in the bands are included into the flux uncertainties with 15, 15, 20, 20, 30 and 40 per cent for the 9, 18, 60, 90, 140 and 160 μm band, respectively. The 12 and 22 μm fluxes were taken from the WISE All-Sky Catalog,2 and the 25, 60 and 100 μm fluxes were taken from IRAS Faint Source Catalog (Moshir et al. 1990). The flux inconsistency between the IRAS and AKARI bands is included into the flux uncertainties, which is 15 per cent of the IRAS fluxes. The WISE photometry was calibrated using the standard stars, which is likely to introduce systematic offsets of the fluxes for galaxies with redder colours than the standard stars. Therefore systematic uncertainties are included into the flux uncertainties with 10 per cent for the 12 and 22 μm bands (Wright et al. 2010). The 2.5–5 μm spectra were reduced in Yamada et al. (2013) using the AKARI/IRC pipeline. For the 21 galaxies that have a companion galaxy, we used the photometric flux as the sum of the fluxes of a primary galaxy and a companion galaxy because we could not separate these galaxies spatially with IRAS. If a primary galaxy and a companion galaxy are resolved spatially with AKARI and WISE, we evaluated each flux and added them. If not, we performed photometry as a single source with an appropriate aperture size.
The SED model used in the fitting was generated using the DustEM code (Compiègne et al. 2011). The SED model is based on the diffuse interstellar medium at high-galactic latitude (DHGL) model of the DustEM, which reproduces dust emission and extinction of the diffuse interstellar medium at high galactic latitudes, with some modifications to adjust for our data set. The DHGL model includes three dust components: amorphous silicate (aSil), hydrogenerated amorphous carbon (amC) and PAHs. The amC consists of different size components: large amC (LamC) and small amC (SamC). The PAHs are subdivided into neutral and ionized PAHs. The abundance ratio of LamC and aSil is assumed to be 1:5.4 that reproduces dust emission and extinction for the DHGL of the Galaxy. The abundance ratio of neutral and ionized PAHs is assumed to be 1.5:1 corresponding to the ionization fraction of 0.4 that is typical for average PAH size (Li & Draine 2001). In addition to the three dust components, two blackbody spectra with 3000 K as old stars that dominate NIR continuum in galaxies and 600 K that is hot dust temperature in infrared galaxies (Oyabu et al. 2011) are included in the fitting model to reasonably fit the NIR spectra. The amplitudes of LamC and aSil, SamC, neutral PAH, ionized PAH, 3000 and 600 K blackbodies are determined in the SED fitting.
The fitting between model and observed SEDs was performed with χ2 minimization using DustEM wrapper,3 the idl wrapper program of the DustEM code. The observed SEDs were constructed from the photometric fluxes of the AKARI, WISE and IRAS bands, and 2.5–5 μm spectrum binned with four spectral elements after excluding the spectral data points at the wavelengths of the H2O ice absorption and Brα emission, because these are not modelled in the DustEM code. The DustEM wrapper outputs the amplitudes of the six components and the abundances of LamC and aSil (hereafter big grain: BG), SamC (hereafter very small grain: VSG) and PAHs. From the outputs, we calculated LPAH and LTIR that is the total luminosity of BG, VSG and PAHs.
Out of the 57 star-forming galaxies, the observed SEDs of two galaxies in the SDSS sample were not well fitted by model SEDs on a χ2 test with 90 per cent confidence and they were excluded from the sample in the following analysis. The resultant sample includes 55 galaxies at spectroscopic redshifts 0.003 < z < 0.17 (median redshift zmedian ∼ 0.03). These are 13 ultraluminous infrared galaxies (ULIRGs; LTIR > 1012Lsun), 36 luminous infrared galaxies (LIRGs; 1011Lsun < LTIR < 1012Lsun) and 6 infrared galaxies (IRGs; LTIR < 1011Lsun). All the galaxies in the HST sample are ULIRGs. Fig. 1 shows six examples of the result of the SED fitting.
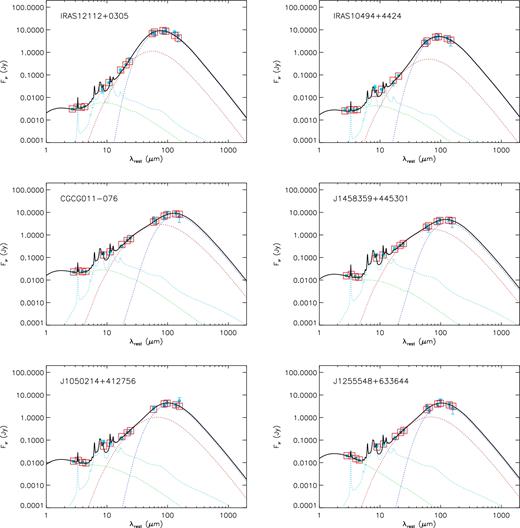
Examples of the observed SEDs. The model consists of the continua of 600 and 3000 K blackbodies (green dotted line), PAHs (cyan dotted line), VSGs (red dotted line) and BGs (blue dotted line). The best-fitting model spectrum and the model flux densities are plotted with the solid line and squares, respectively. The SEDs in the top, middle and bottom panels are taken from ULIRGs, LIRGs and IRGs, respectively.
3.2 Classification into merger galaxies and non-merger galaxies
We divided our sample into merger galaxies and non-merger galaxies using a non-parametric morphological indicator, asymmetry A, which is an indicator of morphology asymmetry with 180° rotation with respect to the centre of a galaxy and has been used in many previous studies to identify merger galaxies (e.g. Schade et al. 1995; Abraham et al. 1996; Lotz, Primack & Madau 2004; Conselice, Rajgor & Myers 2008; Law et al. 2012). We used the SDSS g-band images for the 46 galaxies at z < 0.1 and the HSTF814W-band images for the nine galaxies at 0.1 < z < 0.2.
Before calculating A, we first created segmentation maps of galaxies as follows.
Mask out the pixels of stars and unrelated galaxies in the images.
Create initial galaxy segmentation maps whose pixels are above 1.5σ sky level and they are connected with the centre of the galaxy position. The sky level was adopted as median value of the image after iteratively clipping outliers with the idl procedure of mmm.pro.
Create the final segmentation maps following the quasi-petrosian image thresholding technique (Abraham et al. 2007) that is based on surface brightness distributions in the initial segmentation map with a petrosian fraction of η = 0.2.
For the 21 galaxies that have a companion galaxy, we define the segmentation map as that including both galaxies. The quasi-petrosian image thresholding technique is more suitable for morphological measurement of patchy galaxies including merger galaxies than the segmentation maps created by the petrosian radius technique. The quasi-petrosian image thresholding technique has been used for many previous studies, especially those at high redshift (e.g. Capak et al. 2007; Tasca et al. 2009; Law et al. 2012).
Fig. 2 shows the SDSS g-band images of the 46 SDSS galaxies ordered by descending asymmetry from the top left to the bottom right. Fig. 3 shows the HSTF814W images of the nine HST galaxies. As can be seen in the images, galaxies with large asymmetry values show clear merger signatures such as double nuclei, tidal tails and/or asymmetric morphology.
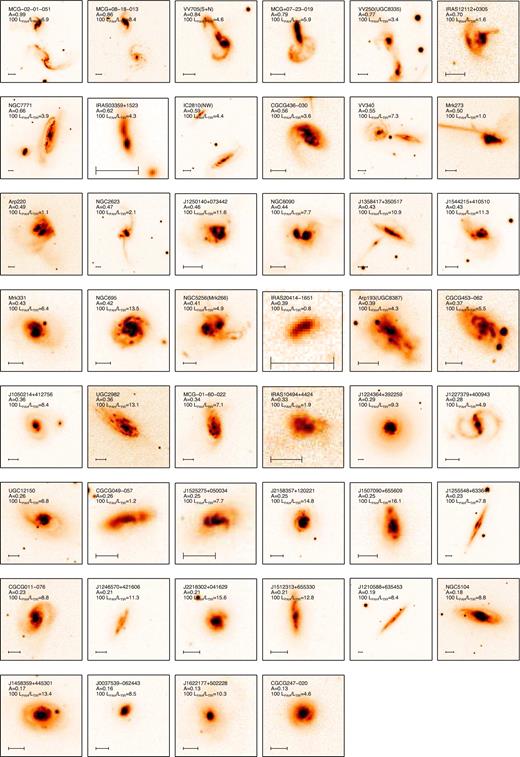
SDSS g-band images of the 46 SDSS galaxies. The images are ordered by descending asymmetry from the top left to the bottom right. The primary galaxy name, asymmetry value A and 100 LPAH/LTIR are given in each image. The scale bars are 10 arcsec for each image.
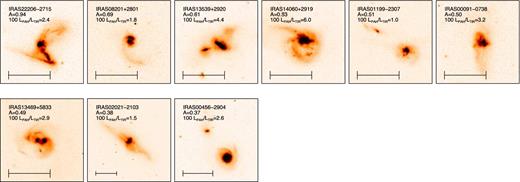
HSTF814W-band images of the nine HST galaxies. The scale bars are 10 arcsec for each image.
We defined galaxies with A > 0.35 as merger galaxies and the other galaxies as non-merger galaxies. The adopted asymmetry criterion of 0.35 is the same as in Conselice (2003). As a result, out of the SDSS 46 galaxies, 26 galaxies (∼57 per cent) are classified as merger galaxies and the other 20 galaxies as non-merger galaxies (∼43 per cent), while all the nine HST galaxies are classified as merger galaxies. Out of all the 55 galaxies, 35 galaxies (∼64 per cent) are classified as merger galaxies and the other 20 galaxies as non-merger galaxies (∼36 per cent). The merger galaxies consist of galaxies with a companion and those with evidence of recent mergers such as double nuclei, tidal tails and/or asymmetric morphology in a single envelope.
4 RESULTS
4.1 Relation to galaxy merger
Fig. 4 displays a number fraction of the merger galaxies as a function of LTIR, which shows that the fraction increases with LTIR. The merger galaxies occupy ∼17 per cent for IRGs, ∼61 per cent for LIRGs and ∼92 per cent for ULIRGs, suggesting that LTIR of most ULIRGs and almost half LIRGs are mainly induced by galaxy mergers. Since our sample is pure star-forming galaxies with no AGN signatures, LTIR of the merger galaxies should be mainly caused by merger-induced starburst. The fraction is broadly consistent with the previous studies of local galaxies (e.g. Sanders & Mirabel 1996; Kim, Veilleux & Sanders 2002; Veilleux, Kim & Sanders 2002; Wang et al. 2006; Kilerci Eser, Goto & Doi 2014). The fraction of interacting/merger systems increase from ∼10 per cent at LTIR = 1010.5–1011Lsun to ∼100 per cent at LTIR > 1012Lsun by visual inspection of the IRAS Bright Galaxy Survey (Sanders & Mirabel 1996). Wang et al. (2006) found that 48 per cent of LIRGs at z ∼ 0.05 are interacting/merging by visual inspection of the SDSS r-band and composite colour images. All the ULIRGs but one in the IRAS 1 Jy sample show signs of a strong tidal interaction and merger by visual inspection of the optical images (Kim et al. 2002; Veilleux et al. 2002). Kilerci Eser et al. (2014) recently found that ULIRGs in the AKARI all-sky survey are interacting pair galaxies or on-going/post-mergers by visual inspection of the SDSS colour composite images.
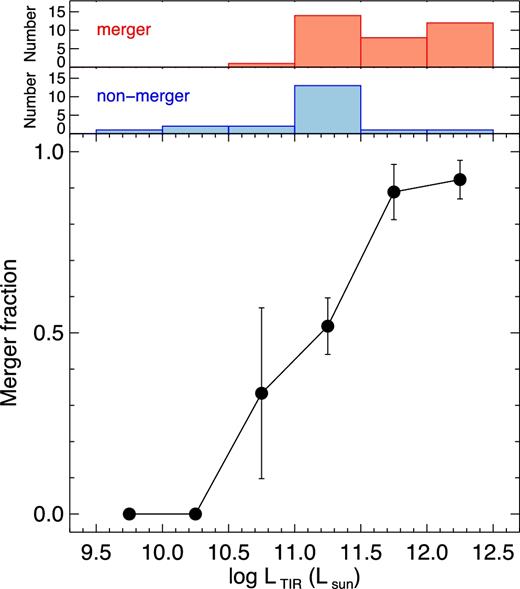
Number fraction of the merger galaxies as a function of LTIR. The error bars are based on the binomial statistics. The histograms display the LTIR distributions of the merger and non-merger galaxies.
Fig. 5 displays that LPAH/LTIR of the merger galaxies tends to be lower than that of the non-merger galaxies. The median LPAH/LTIR of the merger galaxies and the non-merger galaxies are 0.044 and 0.088, respectively. Two non-merger galaxies of CGCG 049−057 and IRAS 10494+4424 have extremely low LPAH/LTIR. Peeters, Spoon & Tielens (2004) also reported that CGCG 049−057 has a low luminosity ratio of the PAH 6.2 μm emission to FIR continuum due to its unusual infrared spectrum with strong PAH 6.2 μm emission, and very strong and cold FIR continuum. IRAS 10494+4424 is close to our asymmetry criterion of the classification between merger galaxies and non-merger galaxies. Asymmetric diffuse light distribution, which implies that this galaxy undergoes a recent merging process, is recognized in the g-band image of IRAS 10494+4424 by visual inspection, and the galactic nucleus is extremely brighter than the diffuse light. Thus this galaxy may be mistakenly classified into non-merger galaxies. We performed the Mann--Whitney U test and rejected with a significant level of 5 per cent the null hypothesis that the LPAH/LTIR distributions of the merger and the non-merger galaxies are drawn from the distribution with the same median. We therefore confirm that LPAH/LTIR of the merger galaxies is statistically lower than that of the non-merger galaxies.
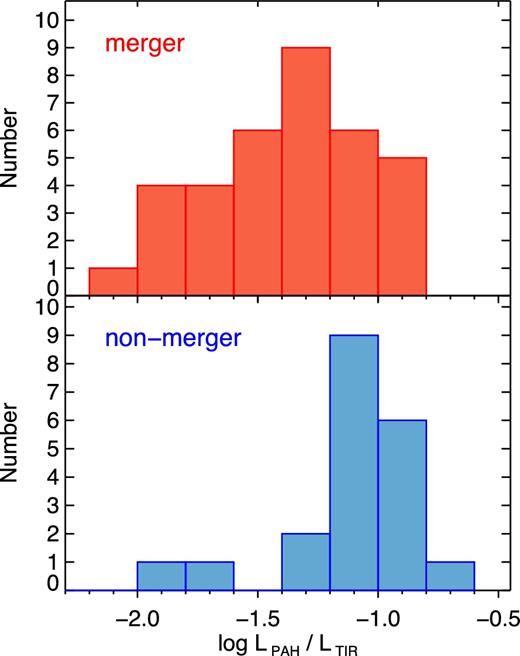
LPAH/LTIR distributions of the merger galaxies (top panel) and the non-merger galaxies (bottom panel).
Fig. 6 shows the relationship between LPAH/LTIR and LTIR for merger galaxies and non-merger galaxies. The merger galaxies and the non-merger galaxies for the SDSS sample are plotted as red circles and blue triangles, respectively, while the merger galaxies for the HST sample are plotted as red squares. Note that there are no non-merger galaxies in the HST sample, which reflects that all the galaxies in the HST sample are ULIRGs. Above LTIR > 1011Lsun, LPAH/LTIR clearly decreases with LTIR from ∼0.10 at LTIR ∼ 1011Lsun to ∼0.01 at LTIR ∼ 1012Lsun, which is consistent with the previous studies that the ratio of the PAH feature luminosity to LTIR decreases with increasing LTIR in the local universe and at high redshift (Elbaz et al. 2011; Nordon et al. 2012; Yamada et al. 2013; Murata et al. 2014; Stierwalt et al. 2014). In Fig. 6 , we find that the decrease is mainly due to lower LPAH/LTIR of merger galaxies than non-merger galaxies. A similar trend was reported in Stierwalt et al. (2014) who investigated LPAH/LTIR with the stages of merging processes for U/LIRGs using 5-38 μm spectra taken with Spitzer Infrared Spectrograph (IRS) in the Great Observatories All-sky LIRG Survey (GOALS). Stierwalt et al. (2014) classified each galaxy into five classes (non-mergers, pre-mergers, early-stage mergers, mid-stage mergers and late-stage mergers) with visual inspection of the Spitzer Infrared Array Camera (IRAC) 3.6 μm images performed in Stierwalt et al. (2013) and found the decrease in LPAH/LTIR for late-stage mergers compared to pre-mergers, early-stage mergers and non-mergers. Considering that late-stage mergers tend to have lower equivalent width of 6.2 μm PAH emission than pre-mergers, the decrease is considered as an excess of LTIR not associated with star formation, namely warm dust emission of AGNs. In our study, we find that merger galaxies have lower LPAH/LTIR than non-merger galaxies even for pure star-forming galaxies, which suggests that AGN emission may not contribute to the decrease.
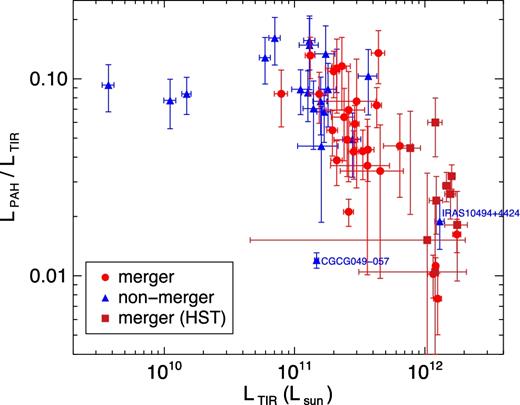
LPAH/LTIR as a function of LTIR for the merger galaxies (red circles) and the non-merger galaxies (blue triangles) in the SDSS sample, and merger galaxies (red squares) in the HST sample.
Fig. 7 shows the ratios of MPAH/MBG, MVSG/MBG and MBG/Mstar for merger galaxies and non-merger galaxies. Here BG mass (MBG), VSG mass (MVSG) and PAH mass (MPAH) are calculated from the results of the SED fitting with the DustEM. Stellar mass (Mstar) is estimated from the WISE 3.4 and 4.6 μm band flux densities using the conversion from WISE NIR photometry and a redshift to a stellar mass given by Eskew, Zaritsky & Meidt (2012). We adopted the Chabrier initial mass function (Chabrier 2003). The W1-band and W2-band fluxes are adopted as aperture photometry with the aperture size of 24.75 arcsec in the radius in the WISE All-Sky Source Catalog. The error bars of MPAH, MVSG and MBG are generated by the SED fitting of the DustEM with the observed flux errors. The error bars of Mstar are estimated by the propagation of the errors of the WISE flux densities.

Distributions of MPAH/MBG, MVSG/MBG and MBG/Mstar for merger galaxies (filled red histogram) and non-merger galaxies (shaded blue histogram).
Fig. 7 clearly shows that merger galaxies tend to have lower MPAH/MBG than non-merger galaxies. Almost half of the merger galaxies have lower MPAH/MBG ratios than non-merger galaxies although the other half of the merger galaxies have MPAH/MBG similar to non-merger galaxies. By contrast, there are no systematic differences in MVSG/MBG between merger galaxies and non-merger galaxies. Also, merger galaxies have MBG/Mstar similar to non-merger galaxies. The systematic decrease of MPAH/MBG for merger galaxies is clearly seen in Fig. 8 that displays MPAH as a function of MBG. Merger galaxies clearly have lower MPAH at a given MBG than non-merger galaxies. These results indicate that the tendency of low MPAH/MBG of merger galaxies is caused by low MPAH of merger galaxies, which suggests a part of PAH destruction during merging processes of galaxies.
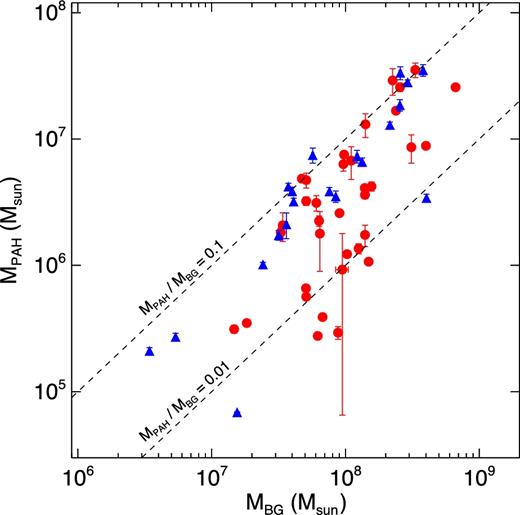
MPAH as a function of MBG for merger galaxies (red circles) and non-merger galaxies (blue triangles). The error bars are generated by the SED fitting of the DustEM with the observed flux errors.
4.2 Relation to the stages of merging processes
The merger galaxies do not always possess lower MPAH/MBG than non-merger galaxies. Obviously, the next question is what causes the difference in MPAH/MBG for merger galaxies. By our definition on merger galaxies that are classified with A, the merger galaxies can include a wide range of merging stages. Therefore, it is interesting to examine the stages of merging processes for the merger galaxies and investigate the relation of PAH abundance with the stages of merging processes.
Motivated by this, we estimate two morphological indicators, the Gini coefficient G and M20 (Lotz et al. 2004), and investigate their relation to MPAH/MBG. G means inequality of a flux distribution, and M20 is a logarithmic fraction of the intensity momentum of the brightest region that includes 20 per cent flux of the total flux to the momentum of the total region of a galaxy. The definitions of G and M20 are described in the Appendix A. Since galaxies at different merging stages occupy different regions of G and M20 diagram (Lotz et al. 2008), we can investigate stages of merger galaxies.
Fig. 9 shows a distribution of G and M20 for our merger galaxies. For reference, we plot G-M20 distributions of ULIRGs with single nucleus (single ULIRGs) and ULIRGs with double nuclei (double ULIRGs) taken from Lotz et al. (2004). Since the G and M20 of the ULIRGs of Lotz et al. (2004) were calculated in R-band images, we added M20 value by 0.1 and G by −0.02, which are typical differences between the two bands taken from Lotz et al. (2004), to convert from R band to g band used in the G and M20 calculation of our merger galaxies. We performed Fisher's linear discriminant analysis for two classes of the single and double ULIRGs, and plot the best classification line (G = −0.20M20 + 0.27) in Fig. 9. Since ULIRGs in the local universe are considered to be merger galaxies of gas-rich disc galaxies on the basis of their morphology and starburst activities (Veilleux et al. 2002), their G-M20 distribution is used as a representative of merger galaxies (Lotz et al. 2004). Based on numerical simulations of galaxy mergers, it is considered that single ULIRGs are at late stages of merging processes of galaxies including the final coalescence stage, and double ULIRGs are earlier stages than single ULIRGs (Veilleux et al. 2002). Therefore, merger galaxies can be divided into two classes using the best classification line in the G–M20 distribution of Fig. 9. Merger galaxies at early (late) stages are those above (below) the line.
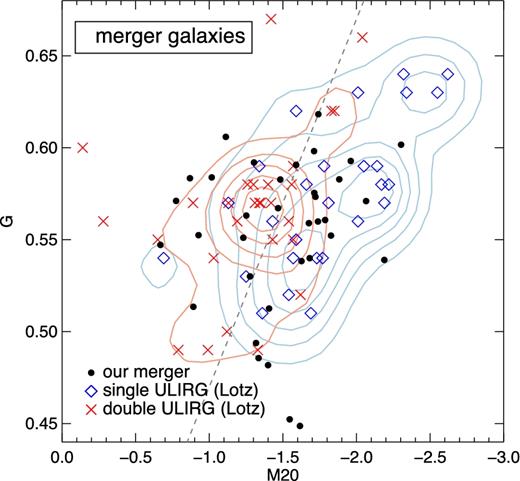
G and M20 distribution for merger galaxies. The filled circles indicate our sample of merger galaxies. For reference, we plot a G-M20 distribution of ULIRGs taken from Lotz et al. (2004) with the conversion from R band to g band. The diamonds and the blue contour indicate G and M20 of the single ULIRGs and their number density, respectively. The crosses and the red contour indicate G and M20 of double ULIRGs and their number density, respectively. The contours are drawn with linearly spaced five levels. The dashed line indicates the best classification line for two classes of the single and double ULIRGs.
Although our merger galaxies are, for the first approximation, similarly distributed in the G-M20 region of the ULIRGs, there shows a little discrepancy at G ∼ 0.65 and M20 ∼ −2.5; no galaxies are found in our sample while the local number density peak is seen for the single ULIRGs. The discrepancy may be because our sample of merger galaxies tends to possess lower LTIR than the ULIRGs of Lotz et al. (2004). Merger-induced starburst is considered to occur at nuclear region. Galaxies with higher LTIR, that is higher SFR, may possess more luminous nuclear starburst, which may cause higher G and lower M20. Psychogyios et al. (2016) examined a distribution of G and M20 for 89 LIRGs from the GOALS sample. Their M20 is similar to our result. On the other hand, their G is much smaller than ours and Lotz et al. (2004), which may be due to their small image size as pointed out by them.
Fig. 10 displays a variation of MPAH/MBG of our merger galaxies in G-M20 diagram and shows a trend of the PAH destruction with the stages of merging processes. We find that the merger galaxies with relatively low M20 tend to have low MPAH/MBG than those with relatively high M20. Galaxies with MPAH/MBG < −1.7, where non-merger galaxies are few, are clustered around the region occupied by the single ULIRGs. Out of the 11 galaxies with such very low MPAH/MBG, nine galaxies have lower M20 against the classification line and even the rest two galaxies have a little higher M20 against the line. Furthermore, we divided the sample into two equal-sized bins with their LTIR and found that, for the galaxies with high LTIR, galaxies with very low MPAH/MBG are also seen in the region occupied by the single ULIRGs. The trend indicates that the galaxies with such very low MPAH/MBG are merger galaxies at late stages, reflecting the tendency of lower MPAH/MBG for merger galaxies as seen in Fig. 7.
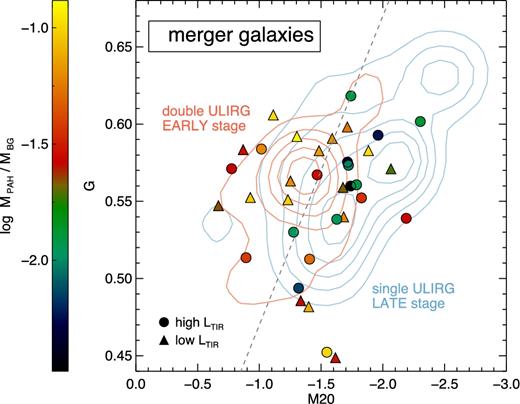
MPAH/MBG variation of merger galaxies in G and M20 diagram. The colours scale with log MPAH/MBG. The contours and the dashed line are the same as in Fig. 9. The sample is divided into two equal-sized bins with their LTIR: (circle) galaxies with LTIR > 3.63 × 10¹¹Lsun; (triangle) galaxies with LTIR < 3.63 × 10¹¹Lsun.
Fig. 11 shows LTIR distributions of the merger galaxies at late stages, those at early stages and non-merger galaxies. Hereafter, merger galaxies at early (late) stages are defined as those above (below) the best classification line in the G–M20 distribution of Fig. 9. The stages of merging processes are clearly related with LTIR. Merger galaxies at late stages possess higher LTIR than those at early stages. 10 out of 13 ULIRGs (∼77 per cent) are merger galaxies at late stages. More than half of merger galaxies with 1011.0 < LTIR < 1011.5 are at early stages. These results are broadly consistent with the previous study of Larson et al. (2016) despite the different method of merger classification. Larson et al. (2016) performed visual inspection of the HSTI-band images for 65 local luminous infrared galaxies of the GOALS sample and investigated the relation of merger stages and LTIR. They found that almost all ULIRGs are major merger galaxies at late stages while more than half of merger galaxies with 1011.1 < LTIR < 1011.5 are at early stages.
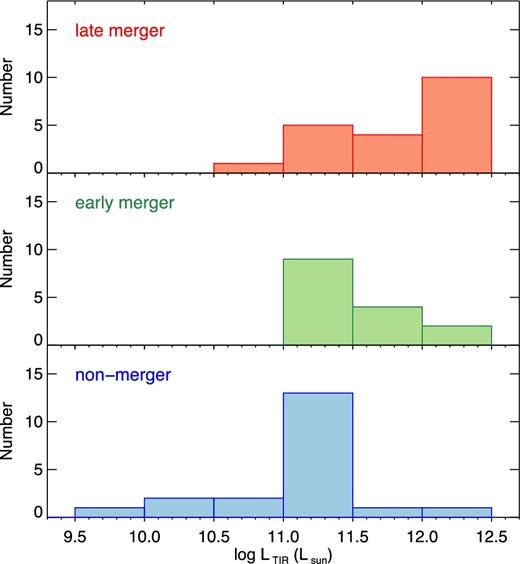
LTIR distributions of the merger at late stages (top), those at early stages (middle) and non-merger galaxies (bottom).
5 DISCUSSION
Using the AKARI, WISE, IRAS, SDSS and HST data, we investigated the relation of LTIR and LPAH with galaxy merger for 55 star-forming galaxies taken from the sample of Yamada et al. (2013). As a result, we confirm the previously noted trend that the fraction of merger galaxies increase with LTIR and merger galaxies tend to have lower LPAH/LTIR than non-merger galaxies, which results in the decreases of LPAH/LTIR with increasing LTIR (Figs 4–6).
Furthermore, we investigated the relation of MPAH, MVSG, MBG and Mstar with galaxy merger (Figs 7 and 8). We find that merger galaxies tend to have lower MPAH/MBG than non-merger galaxies. Almost a half of the merger galaxies have lower MPAH/MBG ratios than non-merger galaxies, while the other half of the merger galaxies have MPAH/MBG similar to non-merger galaxies. By contrast, there are no systematic differences in MVSG/MBG between merger galaxies and non-merger galaxies. Also, merger galaxies have MBG/Mstar similar to non-merger galaxies. These results suggest that PAHs are partly destroyed during merging processes of galaxies. Fig. 10 suggests that PAHs are destroyed especially at the late stages of merging processes.
The destruction of PAHs in U/LIRGs has been reported by previous studies and it is suggested to be caused by harsh radiation fields of AGNs (e.g. Stierwalt et al. 2013, 2014). Since galaxies contaminated by AGN activities were strictly excluded from our sample by two methods of the previously established NIR AGN diagnostics as explained in Section 2, the PAH destruction found in our sample needs another destruction processes.
We consider possible origins for PAH destruction during merging processes of galaxies. The first possibility is the photodissociation of PAHs by strong FUV radiation field due to star formation activity (e.g. Murata et al. 2014; Domingue et al. 2016). PAHs can be destroyed by absorption of some FUV (FUV: 6–13.6 eV) photons since such events heat PAHs above their sublimation temperature. It is well known that merging processes of gas-rich galaxies can trigger starburst (e.g. Mihos & Hernquist 1996; Springel, Di Matteo & Hernquist 2005; Cox et al. 2008), and thus strong FUV radiation field, which may cause the decrease of MPAH/MBG for merger galaxies relative to non-merger galaxies.
Second, possible origin of the PAH destruction is large-scale shocks by merging processes of galaxies. Yamada et al. (2013) suggested that low abundance ratios of PAHs to dust are due to PAH destruction by large-scale shocks during merging processes of galaxies. Merging of galaxies is considered to induce large-scale strong shocks in the galaxies (e.g. Rich et al. 2015) and these shocks can destroy PAHs. The destructions of PAHs under the shocks depend on the PAH size and the shock speed. Although shocks with the speed vshock < 150 km s−1 destroy only small PAHs, shocks with vshock > 150 km s−1 destroy almost all PAHs, regardless of their sizes (Micelotta et al. 2010). On the other hand, shocks with vshock ∼ 200 km s−1 destroy dust grains with only 10–20 per cent dust masses (Jones et al. 1996). LIRGs and ULIRGs possess extended ionized gas with high velocities dispersions, which are interpreted as large-scale shocks with vshock ∼ 150–500 km s−1 induced by galaxy mergers (Monreal-Ibero et al. 2006, 2010; Rich et al. 2011, 2014, 2015). Recently, Rich et al. (2014, 2015) performed integral field spectroscopic (IFS) observations for 27 nearby U/LIRGs of the GOALS sample and found that the fraction of H α emission with high velocity dispersion >90 km s−1, which is mainly originated by shock excitation, to the total H α emission for merger galaxies statistically increases with the stages of merging processes. The fraction increases from about 10 per cent at pair galaxies with wide separations of 10–100 kpc to about 35 per cent at close pair galaxies with separations of <10 kpc, and finally reaches almost 60 per cent at the final coalescence stage.
Post-shock ionized gas now emitting the optical emission lines is possible to be pre-shock dense gas such as that in photodissociation regions (PDRs) and molecular clouds where PAHs are present since the shocks can dissociate molecules and ionize atomic gas. In this case, the presence of the shocked gas detected by optical emission lines means that PAHs can be under shocks during galaxy mergers and thus they can be partly destroyed. Furthermore, since galaxy mergers can induce large-scale shocks by tidally induced high velocity flows and cloud-cloud collision of dense gas cloud, the PDRs in merger galaxies may be also under the shocks. Since the sample of Rich et al. (2014, 2015) consists of typical local U/LIRGs, large-scale shocks commonly appear in local U/LIRGs with merging processes and possibly in gas-rich major mergers. Although local galaxies with large-scale shocks are extremely rare for the overall galaxy population due to the rarity of gas-rich major merger galaxies, our sample of U/LIRGs mostly during merging processes is expected to show large-scale shocks. Under the PAH destruction scenario by large-scale shocks during merging processes of galaxies, this result implies that PAHs are expected to be destroyed more efficiently at later stages, especially the final coalescence stage, during merging processes.
Finally, it is possible that both strong UV radiation and large-scale shocks comparably contribute to the PAH destruction since merging processes of galaxies can induce both.
To verify the above possibilities, we investigate MPAH/MBG variations in G0 and the emission line ratio of |$[{\rm O\,\small {I}}]\,\lambda 6300/{\rm H}\alpha$| (hereafter denoted |$[{\rm O\,\small {I}}]/{\rm H}\alpha$|) for the merger galaxies. Here G0 is radiation field intensity integrated for the FUV wavelengths relative to the standard interstellar radiation field (ISRF) and is derived from the results of the SED fitting with the DustEM. Optical emission line ratios such as |$[{\rm O\,\small {I}}]/{\rm H}\alpha$| are used to distinguish the shocks from H ii regions (e.g. Lequeux 2005). The large |$[{\rm O\,\small {I}}]/{\rm H}\alpha$| is considered as an evidence of galaxy-wide shocks for several optical IFS observations (Farage et al. 2010; Monreal-Ibero et al. 2010; Rich et al. 2011, 2014, 2015). Since the emission line ratio of |$[{\rm O\,\small {I}}]/{\rm H}\alpha$| is more pronounced shock tracer than those of [S ii] λ6717, 6731/H α and [N ii] λ6584/H α (Monreal-Ibero et al. 2010), we determined to here utilize the emission line ratio of |$[{\rm O\,\small {I}}]/{\rm H}\alpha$| for a shock tracer. Although the spatial distribution of |$[{\rm O\,\small {I}}]/{\rm H}\alpha$| is strong evidence of shocks, it is not available in our sample. Therefore, the emission line of spatially integrated spectroscopic data is used in the following analysis.
We retrieved the [O i] and H α line fluxes of the merger galaxies in our sample from archival data of spectroscopic observations and constructed the emission line ratios of |$[{\rm O\,\small {I}}]/{\rm H}\alpha$|. For the galaxies with a companion galaxy, we used the emission line ratios of primary galaxies because few companion galaxies have spectroscopic data. Out of the 35 merger galaxies in our sample, the emission line ratios of |$[{\rm O\,\small {I}}]/{\rm H}\alpha$| of 23 galaxies are constructed using the SDSS fibre spectroscopic data (MPA-JHU Catalog, version 5.2 based on the SDSS DR7). Out of the 12 merger galaxies without the SDSS data, five galaxies are constructed using the spectroscopic data by Veilleux, Kim & Sanders (1999). The rest seven galaxies have no spectroscopic data and they are not included in the following analysis. Seven galaxies out of the 23 galaxies with the SDSS data also have the emission line fluxes of [O i] and H α of Veilleux et al. (1999). To assess the systematic offset of |$\log [{\rm O\,\small {I}}]/{\rm H}\alpha$| of the two spectroscopic data, we calculated the mean difference of |$\log [{\rm O\,\small {I}}]/{\rm H}\alpha$| between the SDSS and Veilleux et al. (1999) data. The difference is 0.08 dex and is negligible to our result.
Fig. 12 shows MPAH/MBG variation in the G0 and |$[{\rm O\,\small {I}}]/{\rm H}\alpha$| emission line ratio diagram for the 28 merger galaxies with [O i] and H α emission line fluxes available. Galaxies with |$\log [{\rm O\,\small {I}}]/{\rm H}\alpha >-1.6$| are best explained by the presence of shocks with vshock < 200 km s−1, while |$\log [{\rm O\,\small {I}}]/{\rm H}\alpha <-1.6$| is explained by the emission from gas ionized by young stars in H ii region (Monreal-Ibero et al. 2010). Most of the galaxies occupy the shocked region. Merger galaxies at late stages tend to be larger |$[{\rm O\,\small {I}}]/{\rm H}\alpha$| than those at early stages, which is consistent with the IFU surveys that shocks are an increasingly important component of the optical emission lines as merging processes (Monreal-Ibero et al. 2010; Rich et al. 2014, 2015).
![MPAH/MBG variation in the interstellar radiation field G0 and [O i] λ6300/H α diagram for the merger galaxies with [O i] λ6300 and H α emission lines available. Merger galaxies at early stages and those at late stages are triangles and circles, respectively. The scatter plots shown in the main panel indicate MPAH/MBG variation as a function of G0 and [O i] λ6300/H α. The dashed line is distinguished from the shocks from H ii regions (Monreal-Ibero et al. 2010). Merger galaxies at early (late) stages are defined as those above (below) the best classification line in the G–M20 distribution of Fig. 9.](https://oup.silverchair-cdn.com/oup/backfile/Content_public/Journal/mnras/472/1/10.1093_mnras_stx1902/1/m_stx1902fig12.jpeg?Expires=1749876449&Signature=HKssBzLunGFYbJVPOpD3rqLL84L39dKJ0zETc7oHj5-21kptMhfpfp55TdQyUvC0Rtg62GtRUtYI948tPRK8Qh6-PD3M4q-jszEA7XWe1B-bc~tUUwwNKi7GLpvniRrhBWkeppSpteKZlwfu2LIkTQvR3EUB2C7AIu0NXMugZlAgcdxfMLIYFLd2MpDgwCdgCzHhMS7Uk8wqDplf9idbIQRBihobcnvmuuBerzH93akKB12ni4CDdV0DynZg2lG5lbtey18XuhM16XS0I07HB0chCSzLDc62qxjN8isco5jXEl-a7QDiMhycNXp1Xh2w93daxzMhXbHu4~mGbR9hWA__&Key-Pair-Id=APKAIE5G5CRDK6RD3PGA)
MPAH/MBG variation in the interstellar radiation field G0 and [O i] λ6300/H α diagram for the merger galaxies with [O i] λ6300 and H α emission lines available. Merger galaxies at early stages and those at late stages are triangles and circles, respectively. The scatter plots shown in the main panel indicate MPAH/MBG variation as a function of G0 and [O i] λ6300/H α. The dashed line is distinguished from the shocks from H ii regions (Monreal-Ibero et al. 2010). Merger galaxies at early (late) stages are defined as those above (below) the best classification line in the G–M20 distribution of Fig. 9.
From Fig. 12, it is clear that MPAH/MBG decreases with increasing G0 and |$[{\rm O\,\small {I}}]/{\rm H}\alpha$|. Interestingly, galaxies at a given G0 tend to possess lower MPAH/MBG with increasing |$[{\rm O\,\small {I}}]/{\rm H}\alpha$|, which suggests that PAHs tend to be destroyed more in shock-dominated galaxies even with the same radiation field strength. Furthermore, galaxies at a given |$[{\rm O\,\small {I}}]/{\rm H}\alpha$| tend to possess lower MPAH/MBG with increasing G0, which suggests that radiation fields strength is another important factor for the PAH destruction. Therefore, it is likely that both large-scale shocks and strong radiation fields comparably contribute to destroy PAHs during merging processes of galaxies.
These trends are clearly seen in Fig. 13, which shows MPAH/MBG as a function of the |$[{\rm O\,\small {I}}]/{\rm H}\alpha$| line ratio at a given G0 for the same sample of Fig. 12. The sample is divided into three equal-sized bins according to G0; galaxies with low G0: G0 < 13; intermediate G0: 13 < G0 < 65 and high G0: G0 > 65. For the merger galaxies with intermediate and high G0, MPAH/MBG decreases with the |$[{\rm O\,\small {I}}]/{\rm H}\alpha$| line ratio. The MPAH/MBG of the galaxies with intermediate (high) G0 decreases from ∼0.06 (∼0.01) at |$\log [{\rm O\,\small {I}}]/{\rm H}\alpha \sim -1.5$| to ∼0.03 (∼0.007) at |$\log [{\rm O\,\small {I}}]/{\rm H}\alpha \sim -1.0$|. The Spearman's rank test found negative correlations between MPAH/MBG and |$[{\rm O\,\small {I}}]/{\rm H}\alpha$| for galaxies with intermediate G0 (Spearman's correlation coefficient ρ = −0.70) and high G0 (ρ = −0.66) with a significant level of 5 per cent. On the other hand, no significant correlations for galaxies with low G0 are found with the Spearman's rank test. We fit the data points of galaxies with intermediate and high G0 with a linear line of |$\log (M_{\rm PAH}/M_{\rm BG})=a\times \log ([{\rm O\,\small {I}}]/{\rm H}\alpha )+b$|, where a and b are free parameters. The best-fitting linear lines shown in Fig. 12 have similar slopes each other with a systematic offset in MPAH/MBG. Galaxies with high G0 have lower MPAH/MBG than those with intermediate G0 at a given |$[{\rm O\,\small {I}}]/{\rm H}\alpha$| line ratio. In summary, PAH destruction is likely to be caused by two processes: large-scale shocks and strong interstellar radiation fields during merging processes of galaxies especially at late stages.
![MPAH/MBG as a function of [O i] λ6300/H α for the same sample of Fig. 12. The sample is divided into three equally sized bins with their G0: galaxies with (cross) G0 < 13, (diamond) 13 < G0 < 65 and (circle) G0 > 65. The lines represent the fitting results of galaxies with 13 < G0 < 65 (dashed) and G0 > 65 (solid) with a linear line of $\log (M_{\rm PAH}/M_{\rm BG})=a\times \log ([{\rm O\,\small {I}}]\,\lambda 6300/{\rm H}\alpha )+b$, where a and b are free parameters.](https://oup.silverchair-cdn.com/oup/backfile/Content_public/Journal/mnras/472/1/10.1093_mnras_stx1902/1/m_stx1902fig13.jpeg?Expires=1749876449&Signature=tenXNqIxdKK-us0IWTfk9eozs4OLbZms1JvDtyq3uK0oWdvLG75K0upuCerlfvOaTbKNYCD4XQqTmyfmbJqwzlAv3iUfuGbZlfQo7ci5Hwg-C83KYpEc0iXvcFI9TE0MzH7Een82oBjKGtrsFX0hf98t~8YzX7yv97vFcIDiBjuIY4R~4F8kZmyIYf7gf9qcQVhjJ5hHAjpcpRpkGgqMa2Wwionr-dywgW7jtTgNIuNPp9rwvvMiP20xmqNr2tr6uY9nY7SaygtcvSPx8UPoFduKNdFJXY7IMTrTESY-xQtkNgKbYu5v4C3~wZJj15ywR8wdqrwnuPwhr6uI4ikHPQ__&Key-Pair-Id=APKAIE5G5CRDK6RD3PGA)
MPAH/MBG as a function of [O i] λ6300/H α for the same sample of Fig. 12. The sample is divided into three equally sized bins with their G0: galaxies with (cross) G0 < 13, (diamond) 13 < G0 < 65 and (circle) G0 > 65. The lines represent the fitting results of galaxies with 13 < G0 < 65 (dashed) and G0 > 65 (solid) with a linear line of |$\log (M_{\rm PAH}/M_{\rm BG})=a\times \log ([{\rm O\,\small {I}}]\,\lambda 6300/{\rm H}\alpha )+b$|, where a and b are free parameters.
For major-merger galaxy pairs at z ∼ 0, Domingue et al. (2016) found that PAH-to-dust mass ratios of spiral-spiral pairs are lower than those of spiral-elliptical pairs and isolated spiral galaxies. They suggested that the reduction is likely a PAH deficiency by their enhanced interstellar radiation fields caused by their active star formation. The sample of Domingue et al. (2016) is mostly IRGs, while our sample of merger galaxies consists of mostly LIRGs and ULIRGs including merger galaxies at later stages. IRGs have lower radiation field strength than U/LIRGs. Main processes of PAH destruction might differ according to LTIR and the stages of merging processes. PAHs might be destroyed by strong radiation fields by star formation in IRGs, while they might be destroyed by both strong radiation fields and large-scale shocks in LIRGs and ULIRGs that are dominant for merger galaxies.
Many authors pointed out the deficit of [C ii] 158 μm emission line for star-forming and starburst galaxies including IRGs, LIRGs and ULIRGs, the so-called [C ii] deficit (e.g. Luhman et al. 2003). Since [C ii] and PAH emissions are mainly emitted from PDRs and they are tied to each other (Díaz-Santos et al. 2013, 2014), it is worth noting the relation between the PAH destruction during merging processes of galaxies and the [C ii] deficit. Many origins have been proposed for the [C ii] deficit. One possible origin is small dust destruction or charging, which reduces photoelectric yield (e.g. Smith et al. 2017). If this is the case, the destruction of PAHs by strong radiation fields and large-scale shocks can naturally explain to reduce the [C ii] emission during merging processes of galaxies.
Finally, we comment out the limitation of our study. As described in Section 3.1, the photometric fluxes of the 21 galaxies with a companion, which are at early stages of merging processes, are used as the sum of the photometric flux of a primary galaxy and a companion galaxy due to the limitation of the low spatial resolution of IRAS. This can affect the interpretation of our results if the effect of the merging of galaxies is not the same in both galaxies. If the companion galaxy is significantly smaller than the primary galaxy, the summed SEDs are mainly reflected from the SED of the primary galaxy. If this is the case, we could not detect the PAH destruction of the companion galaxy from the summed SEDs. Furthermore, for the galaxies with a companion galaxy, we used the emission line ratios of primary galaxies due to the limitation of available spectroscopic data. Therefore, our result of the PAH destruction at early stages of merging processes and its origin may be uncertain. On the other hand, since the merger galaxies at the late stage are disturbed single component, it is certain that PAHs are destroyed at the late stages of merging processes of galaxies.
6 SUMMARY
We have investigated the relation of LPAH, LTIR, MPAH, MVSG, MBG and Mstar with galaxy merger for 55 star-forming galaxies at redshift z < 0.2 using the AKARI, WISE, IRAS, SDSS and HST data. We divided the galaxies into 35 merger galaxies and 20 non-merger galaxies based on A that was calculated with the SDSS g-band for galaxies at z < 0.1 and the HSTF814W images for galaxies at z > 0.1. We find the following.
The fraction of merger galaxies clearly increase with LTIR, and the LPAH/LTIR ratios of merger galaxies tend to be lower than those of non-merger galaxies, which results in the decrease of LPAH/LTIR with increasing LTIR.
Merger galaxies tend to show lower MPAH/MBG than non-merger galaxies and there are no systematic differences in MVSG/MBG and MBG/Mstar between merger galaxies and non-merger galaxies.
Galaxies with very low MPAH/MBG are clustered around the region occupied by the single ULIRGs in the G and M20 diagram, indicating that they are merger galaxies at late stages.
These results suggest that PAHs are partly destroyed during merging processes of galaxies especially at the late stages.
We consider three possible origins for the PAH destruction of star-forming galaxies: strong radiation fields, large-scale shocks by merging processes of galaxies and both. To verify the above possibilities, we have investigated MPAH/MBG variations in radiation field intensity strength G0 and the emission line ratio of |$[{\rm O\,\small {I}}]/{\rm H}\alpha$| that is a shock tracer for merger galaxies. We find that MPAH/MBG decreases with increasing both G0 and |$[{\rm O\,\small {I}}]/{\rm H}\alpha$|. Galaxies at a given G0 tend to possess lower MPAH/MBG with increasing |$[{\rm O\,\small {I}}]/{\rm H}\alpha$|. Galaxies at a given |$[{\rm O\,\small {I}}]/{\rm H}\alpha$| tend to possess lower MPAH/MBG with increasing G0. Therefore, PAH destruction is likely to be caused by two processes: strong radiation fields and large-scale shocks during merging processes of galaxies.
Acknowledgements
This research is based on observations with AKARI, a JAXA project with the participation of ESA. We would like to thank all the members of AKARI project. Funding for SDSS-III has been provided by the Alfred P. Sloan Foundation, the Participating Institutions, the National Science Foundation and the US Department of Energy Office of Science. The SDSS-III web site is http://www.sdss3.org/. SDSS-III is managed by the Astrophysical Research Consortium for the Participating Institutions of the SDSS-III Collaboration including the University of Arizona, the Brazilian Participation Group, Brookhaven National Laboratory, Carnegie Mellon University, University of Florida, the French Participation Group, the German Participation Group, Harvard University, the Instituto de Astrofisica de Canarias, the Michigan State/Notre Dame/JINA Participation Group, Johns Hopkins University, Lawrence Berkeley National Laboratory, Max Planck Institute for Astrophysics, Max Planck Institute for Extraterrestrial Physics, New Mexico State University, New York University, Ohio State University, Pennsylvania State University, University of Portsmouth, Princeton University, the Spanish Participation Group, University of Tokyo, University of Utah, Vanderbilt University, University of Virginia, University of Washington and Yale University. This research is based on observations made with the NASA/ESA Hubble Space Telescope, and obtained from the Hubble Legacy Archive, which is a collaboration between the Space Telescope Science Institute (STScI/NASA), the Space Telescope European Coordinating Facility (ST-ECF/ESA) and the Canadian Astronomy Data Centre (CADC/NRC/CSA). This publication makes use of data products from the Wide-field Infrared Survey Explorer, which is a joint project of the University of California, Los Angeles, and the Jet Propulsion Laboratory/California Institute of Technology, funded by the National Aeronautics and Space Administration.
REFERENCES


