-
PDF
- Split View
-
Views
-
Cite
Cite
Daniel Rahner, Eric W. Pellegrini, Simon C. O. Glover, Ralf S. Klessen, Winds and radiation in unison: a new semi-analytic feedback model for cloud dissolution, Monthly Notices of the Royal Astronomical Society, Volume 470, Issue 4, October 2017, Pages 4453–4472, https://doi.org/10.1093/mnras/stx1532
Close - Share Icon Share
Abstract
Star clusters interact with the interstellar medium (ISM) in various ways, most importantly in the destruction of molecular star-forming clouds, resulting in inefficient star formation on galactic scales. On cloud scales, ionizing radiation creates H ii regions, while stellar winds and supernovae (SNe) drive the ISM into thin shells. These shells are accelerated by the combined effect of winds, radiation pressure, and SN explosions, and slowed down by gravity. Since radiative and mechanical feedback is highly interconnected, they must be taken into account in a self-consistent and combined manner, including the coupling of radiation and matter. We present a new semi-analytic 1D feedback model for isolated massive clouds (≥105 M⊙) to calculate shell dynamics and shell structure simultaneously. It allows us to scan a large range of physical parameters (gas density, star formation efficiency, and metallicity) and to estimate escape fractions of ionizing radiation fesc, i, the minimum star formation efficiency εmin required to drive an outflow, and recollapse time-scales for clouds that are not destroyed by feedback. Our results show that there is no simple answer to the question of what dominates cloud dynamics, and that each feedback process significantly influences the efficiency of the others. We find that variations in natal cloud density can very easily explain differences between dense-bound and diffuse-open star clusters. We also predict, as a consequence of feedback, a 4–6 Myr age difference for massive clusters with multiple generations.
1 INTRODUCTION
The formation of stars from the cold, dense interstellar medium (ISM) marks the onset of the conversion of nuclear binding energy into radiative and mechanical energy. Injected back into the immediate surroundings of the stars, this energy drives a rapid chemical and dynamic evolution of the very molecular cloud from which the stars formed. This chain of events, where the creation of stars leads to energy injection by stars which disrupt the clouds, is known as stellar feedback. In the case of massive stellar clusters (M* > 103 M⊙), the energetic processes are dominated by three main forms of feedback: ultraviolet (UV) radiation, colliding stellar winds, and supernovae (SNe). Each of these processes provides a source of energy and momentum that acts in opposition to gravity (for a review about stellar feedback, see Krumholz et al. 2014).
Around young massive clusters, confined interacting winds produce hot (T ∼ 106–108 K) bubbles (Weaver et al. 1977, hereafter W77; Dunne et al. 2003). These adiabatically expand, compressing the gas ahead of them into a thin dense shell. The bubbles are characterized by a rarefied, collisionially ionized gas. While this gas remains hot, its high thermal pressure drives the expansion of the surrounding shell (W77). Once the gas cools, however, the winds from the central cluster push the remainder of the gas from the bubble into the shell. Thereafter, the wind momentum is deposited directly into the shell in the form of ram pressure. SNe exploding within the bubble add their energy to the existing thermal and mechanical energy of the gas in the bubble.
The optical depth of the gas inside a wind bubble is very low, and so radiation from the central stellar cluster easily reaches the dense shell surrounding the bubble (Townsley et al. 2003; Gupta et al. 2016). UV photons with energies E > 13.6 eV photoionize hydrogen in this shell, resulting in one of two outcomes: either the entire shell becomes ionized, or only the inner layers become so, with the outer layers of the shell remaining neutral (e.g. Martínez-González, Silich & Tenorio-Tagle 2014).
Photons that are absorbed in the shell not only heat it and potentially change its chemical state, but also deposit momentum (Lebedew 1901). Essentially, the radiation exerts a pressure force on the gas and dust that acts radially outwards from the central stellar cluster. If this radiation pressure is sufficiently large, then it can become dynamically significant and can play a major role in driving the evolution of the shell (Mathews 1967; Draine 2011; Kim, Kim & Ostriker 2016). One of the key factors that determine whether or not radiation pressure becomes significant is the efficiency with which radiation couples with the shell (Krumholz & Matzner 2009). For ionizing radiation, this is determined by the amount of neutral and molecular material as well as dust absorbing the radiation. When the column density of the gas is high enough to absorb all the ionizing photons (i.e. when the layer is optically thick to ionizing radiation), the system is ‘radiation bounded’, coupling is efficient and momentum is transferred effectively. However, the shells surrounding many observed star-forming regions are optically thin to ionizing radiation, suggesting that coupling is not always effective (Pellegrini et al. 2012; Seon 2009). For non-ionizing radiation (E < 13.6 eV), the optical depth is again the main factor determining whether or not coupling is efficient, but in this case the dominant source of opacity is provided by dust unless the radiation field is weak (Krumholz, McKee & Tumlinson 2008).
Previous simplified models of the growth of shells and bubbles around young massive clusters have typically assumed that the dynamics of the shell are dominated by the effect of winds (e.g. W77; Chevalier & Clegg 1985; Mac Low & McCray 1988; Koo & McKee 1992; Canto, Raga & Rodriguez 2000; Silich & Tenorio-Tagle 2013, hereafter ST13) or radiation pressure (e.g. Krumholz & Matzner 2009; Murray, Quataert & Thompson 2010; Kim, Kim & Ostriker 2016). However, as we will see later, in the general case both must be included in order for the model to be self-consistent and hence both processes are important. In addition, in the treatments that do account for radiation pressure, the shell is often assumed to be completely opaque to radiation (Krumholz & Matzner 2009; Murray et al. 2010), whereas in reality the escape fraction can often be significant (see Section 6).
In this paper, we present a new model for the growth of shells around clusters that properly accounts for both winds and radiation, and that carefully treats the structure of the shell and its influence on the fraction of the radiation that is absorbed. In Section 2, we present our model for the structure and dynamics of the shell, and in Section 3, we discuss the evolution of an exemplary cloud and compare to analytic solutions. In Section 4, we examine how well coupled radiation is to the shell and use those results in Section 5 to explore the conditions in which each of the different feedback processes (winds, SNe, and radiation) dominates, examining this both as a function of time during the expansion, and in an integrated form over the entire lifetime of the cloud. Our model also allows us to make predictions for the evolution of the escape fraction of ionizing radiation during the growth of the shell, which we present in Section 6. In Section 7, we discuss what we can learn from our model about the star formation efficiency ε of the cloud, and how this varies as a function of the mass, mean density, and metallicity of the cloud. We conclude in Section 8 with a summary of the key results of our study.
2 MODEL
2.1 Shell dynamics
We model three phases of expansion of the natal cloud around the cluster. Early expansion is adiabatic and dominated by wind energy which sweeps the cloud interior into a thin shell (Phase I). This phase last so long as the energy is confined and radiative losses are small. After that, shell acceleration is determined by momentum input by winds, radiation, and eventually by SN explosions opposing gravity (Phases II and III). In Phase II, the expanding shell continues to sweep-up material. Once the whole cloud has been swept up, the shell can freely expand into the ambient ISM (Phase III). These phases are outlined in Fig. 1, and are now discussed in more detail. Since we only model isolated clouds, we do not take into account any effects of an external galactic potential like shearing, which would introduce differential rotation and tidal torques, or the coupling to the larger scale turbulent flows in the ISM.
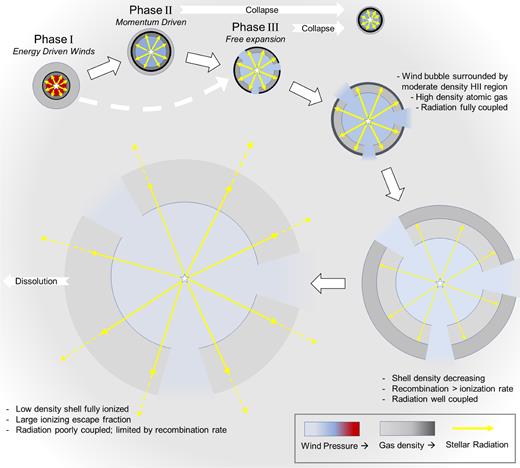
Overview of the shell evolution from the initial adiabatic phase to recollapse or dissolution.
2.1.1 Phase I: energy-dominated winds
Alternatively, as the shell expands, inhomogeneities or asymmetries in the cloud may provide low-density pathways along which the hot gas can escape (Rogers & Pittard 2013). If this occurs, instead of expanding and doing work, the hot gas will escape into the low-density/pressure ambient ISM. However, here we argue that in a rather high-density environment as investigated in this paper, and given the resulting rapid expansion in the adiabatic phase, it is reasonable to assume the bubble does not ‘burst’ until the expansion is of the order of the initial cloud radius. At this time, tsweep, the entire cloud has been swept up in the shell. Further expansion begins to stretch the shell without significantly adding to its mass. The shell's average density begins to decrease, possibly becoming unstable and leading to the formation of channels. Modelling the formation of low-density channels goes beyond the scope of a 1D model. For simplicity, we assume that before tsweep, the formation of any leaks gets hampered. After tsweep, we assume the remaining shell structure is coherent, but does not effectively confine the winds. The time, when Phase I transitions to the next phase is thus given by ttran = min (tcool, tsweep).
2.1.2 Phase II: momentum-dominated sweeping
Once the hot X-ray emitting gas in the bubble cools, causing its thermal pressure to drop dramatically, the reverse shock quickly moves towards the shell as the shocked wind region is pushed into the shell (ST13). This evacuates almost all of the remaining gas from the bubble (now represented by the blue region in Fig. 1), and therefore during Phases II and III, it is a good approximation to treat the bubble as if it were completely empty. This allows us to assume that the wind thereafter imparts its momentum directly on the shell and that no absorption of radiation occurs before the radiation reaches the shell. In reality, the transition between energy driving in Phase I and momentum driving in Phase II will be gradual and even at t > ttran some thermal pressure from the shocked wind material will be present. However, the remaining hot gas is dynamically weak (Gupta et al. 2016; Rahner et al., in preparation) and we will ignore it here.
2.1.3 Phase III: free expansion into low-density ISM or recollapse
If feedback is strong enough, the shell eventually overtakes the initial cloud radius Rcl. The shell then expands into the low-density ambient ISM. It is assumed to become leaky at tsweep so that any shocked, hot wind material cools after tsweep at the latest. Thus, if tsweep < tcool, Phase III follows directly after Phase I (indicated by the dashed white arrow in Fig. 1).
There are two options now. If feedback is strong enough the shell will expand to very large radii. As the shell expands, it thins out, its density drops and it eventually becomes indistinguishable from the diffuse ambient ISM. Even before this, we can no longer represent the shell using the thin shell limit, and so equation (5) does not adequately describe its dynamics any longer. To account for this, we stop the integration if the density of the densest part of the shell drops below 1 cm−3 for an extended period of time (more than 1 Myr) as we consider the shell dissolved. If we would immediately stop, we might miss the reformation of a shell, e.g. during the Wolf–Rayet phase which drastically increases the wind ram pressure. We call the time when the shell dissolves the dissolution time tdis.
If, on the other hand, gravity overcomes stellar feedback, the shell collapses back on itself. The equation of motion during the collapse is the same as before except that the mass of the shell is kept constant. Collapse can happen either during Phase II or III (but not during Phase I as no gravity is included there) and we follow the collapse until the inner radius of the shell has shrunk to 1 pc. We define the time when this happens as the collapse time tcollapse. We stop the integration at this point, but already note that a collapse leads to more star formation (see Section 7) and thus possibly renewed expansion.
2.2 Shell structure
In order to determine how well-coupled radiation is to the shell and its momentum deposition rate, we need to determine the fraction of absorbed radiation fabs. Numerical codes like cloudy (Ferland et al. 2013) provide powerful tools for calculating the chemistry, density, and temperature structure of shells. However, here we choose a simpler set of equations which sacrifice a detailed treatment of the chemical and thermal structure of the shell in exchange for a great increase in the speed with which one can calculate the volume of ionized gas. Our simple approach here also makes it easier to assess the relative importance of the different forms of feedback responsible for driving the dynamical evolution of the shell.
During Phase I, dust inside the hot bubble is destroyed by sputtering and hydrogen is collisionally ionized, allowing radiation to pass through unattenuated. During Phases II and III, the density inside the bubble quickly drops below 1 cm−3 (see Section 2.1), so that only little attenuation of radiation occurs. Thus, ionizing photons from the cluster can reach and ionize at least the inner edge of the shell (and potentially the whole of the shell, as we explain below).
It is important to understand that a hydrostatic shell is not at constant pressure when exposed to a radiation field. By definition, the condition of hydrostatic equilibrium implies that there is no differential acceleration within the shell. In a hydrostatic shell, at any interior point, the net external force (excluding gravity) acting on a layer with thickness |$\mathop {}\!\mathrm{d}r$| is proportional to the amount of stellar radiation absorbed. Since absorption by each previous layer reduces the transmitted flux of ionizing and non-ionizing UV flux, if we want the amount of radiation per unit mass absorbed in each layer (and hence the amount of momentum deposited per unit mass) to remain constant, then the optical depth τ of each layer must progressively increase. In ionized gas, this means increasing the gas density of the layer. However, if we increase the density of the layer, we also increase its mass, and hence require an even higher momentum deposition rate in order to keep it accelerating at the same rate as the previous layer. This implies that the density of the layer must increase even more, in order to provide the necessary increase in τ. In shells with an outward density gradient due to radiation pressure, a monotonically increasing total pressure is required to produce uniform acceleration.
We have computed the peak magnetic pressure predicted by this equation for the clusters and gas densities modelled here and find that magnetic pressure is only marginally significant in the ionized gas while Ri ≤ Rcl. At larger radii and/or late times when the winds are momentum-driven, magnetic pressure is much smaller than the radiation pressure, and decreases in significance as the shell evolves. The magnetic field may still provide a dominant source of pressure in the atomic gas, but the momentum deposited there is proportional to the dust column only (cf. equation 20), and is therefore not affected by the structure of the atomic gas layer. Thus, in our calculations, we ignore the effect of magnetic fields.
We also neglect the effects of turbulence, which is unlikely to be important in the ionized gas, unless the turbulence velocity dispersion is large (σrms ≫ 10 km s−1 in the ionized shell). However, in star-forming regions like Orion, the turbulent velocities in the H ii region are clearly subsonic (Arthur, Medina & Henney 2016) and turbulence is thus of limited importance for determining the structure of the ionized shell. In the atomic gas, turbulence may play an important role in structuring the material but since, as mentioned above, there the absorbed fraction of radiation depends only on the column density, turbulence does not play a significant role in the overall dynamics of the shell.

Sketch of number density n, dust optical depth τd, and attenuation of ionizing radiation ϕ as a function of radius. The red dashed line shows the pressures of the wind bubble Pb, the thermal gas pressure Ptherm of the shell, and lastly of the ambient medium. At very early and late times when the column density of the shell and/or the pressure from winds is low, the shell may be fully ionized (not shown). See also Martínez-González et al. (2014).
By ignoring absorption of Lyman–Werner radiation on H2, we underestimate fabs. We recalculated some of our shell structure models with cloudy to explore the effect chemistry has on opacity and find that a significant amount of H2 only forms when the shell is dense and quite optically thick, i. e. if fabs ∼ 1. In lower density, expanded shells, the interstellar radiation field suppresses the formation of H2, and a more detailed chemical model does not lead to substantially different escape fractions.
A larger caveat is that we fix the dust cross-section σ0 (for a fixed metallicity). In reality, σ0 is a function of the effective stellar temperature and decreases as the massive stars die (Draine 2011). Again using cloudy, we find that at later times (t ≳ 3 Myr) in our simplified treatment, we are overestimating fabs by ∼25 per cent. But since, as we will show, at late times radiation pressure is rarely the dominating source of feedback, this does not strongly affect the dynamics of shells. In a future iteration of our method, we plan to self-consistently calculate σ0 from the time-variable stellar spectrum.
2.3 Coupling structure and dynamics
At one point or another, all of these models fall short of a full, self-consistent treatment of feedback. The expansion rate of the shell depends on how well coupled it is to radiation, which in turn depends on the shell structure. However, as we have seen, the shell structure itself depends on the expansion rate of the shell. To complicate things even further winds, radiation and SNe output depend on cluster mass and age. It is therefore necessary to simultaneously solve for the expansion rate and structure of the shell, while accounting for an evolving stellar population.
Expanding shells in the ISM are not truly hydrostatic – in the sense that parts of the shell do not move radially with respect to each other – as they tend to become thicker over time. If the ‘thickening velocity’ |$v_{\rm {t}} \equiv \mathop {}\!\mathrm{d}(R_{\rm {out}}-R)/\mathop {}\!\mathrm{d}t$| is lower than the shell's sound speed cs, the pressure distribution within the shell can readjust itself on a time-scale short compared to that on which the shell thickness changes, and the shell therefore rapidly settles into a quasi-hydrostatic equilibrium. In such a case, the assumption of local hydrostatic equilibrium is a good approximation.
We find that in our models vt is subsonic except for short times when we switch from the adiabatic phase to Phase II or III and around the occurrence of the first SNe. Over the whole simulated time span, the short periods when the quasi-hydrostatic assumption breaks down are expected to be negligible for the dynamics. Additionally, observations suggest that hydrostatic models as adopted here provide reasonable approximations for expanding gas shells (e.g. Pellegrini et al. 2007).
In order to self-consistently model, the dynamics of feedback-driven shells we thus take the following approach:
A star cluster with mass M*, following a Kroupa initial mass function (IMF, Kroupa 2001), forms at t = 0 in the centre of a gas cloud. All stars in the cluster are assumed to be coeval. We do not consider any ongoing star formation. The cloud has mass Mcl and constant density ncl.
We take the relevant parameters for stellar feedback Lw, Li, Ln, Qi, |$\dot{M}_{\rm {w}}$|, |$\dot{M}_{\rm {SN}}$|, and |$v_{\rm {\rm {w}}}$| from the population synthesis code starburst99 (Leitherer et al. 1999, 2014), v7.0.1, using the Geneva evolution tracks (Ekström et al. 2012; Georgy et al. 2012, 2013) for non-rotating stars (fiducial model) and rotating stars (see Appendix A1). The terminal velocity of the SN ejecta vSN is set to a constant 104 km s−1. These feedback parameters as well τIR and fabs (which are 0 at t = 0 as no shell yet exists) are used to calculate the shell dynamics via the expansion equations (2) and (5).
After a certain time-step Δt, the feedback parameters are updated and the shell structure is modelled via equations (16)–(20). From the shell structure, we get τIR and fabs. The time-step is adaptive: it is small (∼0.02 Myr) during the early phase and around the time of the first SNe (at t ∼ 3 Myr), when fabs is strongly time-dependent.
Steps 2 and 3 are repeated until the end of the simulation is reached at a time tend. The code warpfield (Winds And Radiation Pressure: Feedback Induced Expansion, colLapse and Dissolution) developed for this work is publicly available for download under https://bitbucket.org/drahner/warpfield .
2.4 Investigated parameter space
We examine two different natal cloud densities, ncl = 100 and 1000 cm−3, corresponding to diffuse and translucent molecular clouds, respectively (Snow & McCall 2006). In later sections, we will refer to these as low- and high-density runs. Some GMCs contain clumps and cores in excess of n = 104 cm−3 but on average their density is ∼100–1000 cm−3. We do not yet include a density profile for our clouds but plan to do so in the future. We also model two different metallicities, Z = Z⊙ and 0.15 Z⊙. Note that Z refers to both the metallicity of the cloud, affecting the amount of dust and the time-scale for radiative cooling, and to the metallicity of the cluster, affecting the energy and momentum output by stellar winds and to a lesser extent by radiation. We call these the solar Z and low Z runs, respectively.
Summary of 1D shell dynamical models. Included and neglected physical processes are marked with |$\checkmark$| and -, respectively.
| Model . | Mass . | Gravity . | Wind . | Wind . | Radiation . | Radiation . | Shell . | Stellar . | SNe . | Turbulence . |
|---|---|---|---|---|---|---|---|---|---|---|
| . | reservoir . | . | (|${\dot{E}}$|) . | (|${\dot{p}}$|) . | (|$\dot{E}$|) . | (|$\dot{p}$|) . | structure . | evolution . | . | . |
| This work | Finite | |$\checkmark$| | |$\checkmark$| | |$\checkmark$| | |$\checkmark$| | |$\checkmark$| | |$\checkmark$| | |$\checkmark$| | |$\checkmark$| | - |
| K16a | Finite | |$\checkmark$| | - | - | |$\checkmark$| | |$\checkmark$| | - | - | - | - |
| ST13b | Infinite | - | |$\checkmark$| | |$\checkmark$| | - | - | - | - | - | - |
| M10c | Finite | |$\checkmark$| | (|$\checkmark$|) | - | |$\checkmark$| | |$\checkmark$| | - | - | - | |$\checkmark$| |
| W77d | Infinite | - | |$\checkmark$| | - | - | - | - | - | - | - |
| Cloud number density | ncl | 100, 1000 | cm−3 |
| Metallicity | Z | 0.15, 1 | Z⊙ |
| Cloud mass | Mcl | 105–108 | M⊙ |
| Star formation efficiency | ε | 0.01 − 0.25 | – |
| Cloud number density | ncl | 100, 1000 | cm−3 |
| Metallicity | Z | 0.15, 1 | Z⊙ |
| Cloud mass | Mcl | 105–108 | M⊙ |
| Star formation efficiency | ε | 0.01 − 0.25 | – |
| Cloud number density | ncl | 100, 1000 | cm−3 |
| Metallicity | Z | 0.15, 1 | Z⊙ |
| Cloud mass | Mcl | 105–108 | M⊙ |
| Star formation efficiency | ε | 0.01 − 0.25 | – |
| Cloud number density | ncl | 100, 1000 | cm−3 |
| Metallicity | Z | 0.15, 1 | Z⊙ |
| Cloud mass | Mcl | 105–108 | M⊙ |
| Star formation efficiency | ε | 0.01 − 0.25 | – |
3 A FEEDBACK-DRIVEN DYNAMIC TIMELINE
We will now attempt to summarize the contribution of each feedback mechanism and its variation with time. Our aim is to highlight the different physical regimes where simple scaling relations fall short. There is no simple answer to the question of which feedback mechanism is dominant. Instead this complex problem must be addressed by quantifying how their relative contributions vary with time in an effort to combat gravity.
We start by showing the expansion of a shell that is driven by feedback from a cluster in a dense molecular cloud with cloud mass Mcl = 105 M⊙ and star formation efficiency ε = 0.1 (see Fig. 3). An overview of the shell dynamics for a large number of other models can be found in Appendix A2. In this example, both the cloud and the cluster have solar metallicity. Rapid expansion in the adiabatic phase (Phase I) is followed by strong deceleration after tcool ∼ 0.1 Myr as the thermal pressure from the shocked wind bubble vanishes and the shell accumulates more and more mass (Phase II). At tsweep ∼ 0.8 Myr, the whole cloud has been swept up by the shell. Expanding into low-density ISM (Phase III), the shell now accelerates again.
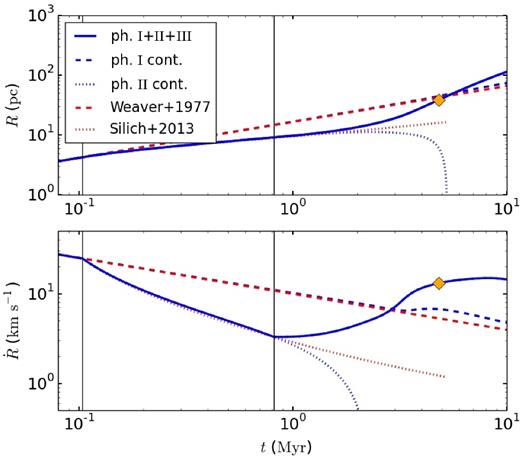
Top: evolution of the inner radius of the shell as a function of time for a model with Mcl = 105 M⊙, ε = 0.1, Z = Z⊙, and ncl = 1000 cm−3. Bottom: expansion velocity of the shell. The vertical black lines mark the transition between the expansion phases (marked by the Roman numerals I, II, and III) at tcool and tsweep. The yellow diamond indicates where the shell becomes fully ionized and ionizing radiation starts to leak out. The blue dashed and dotted lines show a continuation of Phase I (assuming no cooling and an infinite mass reservoir) and Phase II (assuming an infinite mass reservoir only), respectively. The actual evolution of the shell is shown by the solid blue line. The red dashed and dotted lines show analytic solutions for comparison, equation (21) in W77 and equation (13) in ST13.
We have also simulated how the cloud would evolve if Phase I (Phase II) would continue indefinitely as one would expect for an infinite ISM reservoir without cooling (after cooling). This allows us to compare our results with analytic solutions for the equation of motion, i.e. equation (21) in W77 and equation (13) in ST13. For the particular cloud shown here, W77 and ST13 provide good approximations for the shell expansion in Phases I and II (some small deviations towards faster expansion in our model in Phase II are due to radiation pressure). However, for a model with the same cluster mass but a larger cloud size, ST13 would seriously overestimate the shell's velocity and radius at late times (due to their neglect of gravity). Even though we follow W77 in neglecting gravity in Phase I, we do always take into account stellar evolution. This is why at late times, our continued Phase I model differs from equation (25).
An important consequence of including gravity is that for all models investigated here, shells expanding into an infinite ISM reservoir will always recollapse. Sweeping up more and more mass, the shell eventually becomes too massive for gravity to be balanced by the outward forces. If the shell approaches this point asymptotically, it can keep roughly that size until the massive stars have died and feedback decreases. Usually, however, the shell passes the point of force balance with a positive velocity. As soon as this happens, the shell starts to lose momentum and eventually recollapses. This is shown by the blue dotted line in Fig. 3. If gravity is included and the mass reservoir is infinite, the shell reaches a turning point at t ∼ 2 Myr as the expansion velocity becomes negative and the radius of the shell starts to significantly deviate from the ST13 model.
In some models, ionizing radiation can completely overpower the shell. This is the moment when ionizing radiation starts to leak out (see yellow diamond in Fig. 3). Coupling of radiation and the escape fraction of ionizing radiation will be discussed in the following sections.
4 RADIATION COUPLING
For young star clusters, momentum carried by radiation exceeds momentum carried by winds by a factor of a few for solar metallicity and by a few decades at 0.15 Z⊙ (Leitherer et al. 2014). However, this does not mean that radiation always dominates over winds as a source of feedback. Rather, it is the coupling between radiation and the ISM, quantified by fabs in our model, that ultimately determines which of these feedback sources dominates. Any attempt to determine how radiation pressure and ram pressure compare to each other must therefore begin by quantifying fabs.
Ionizing and non-ionizing radiation behave differently. While fabs, n is only influenced by the column density of the shell, fabs, i depends also on the volume density (since the recombination rate is proportional to |$n_{\rm {sh}}^2$|) and on the rate of ionizing photons Qi emitted by the cluster, cf. equations (17) and (18). Thus, fabs, n is solely set by how far out the shell has expanded and how much mass it has swept up in the process, whereas fabs, i is also dependent on the cluster's current output in terms of ram pressure from winds and radiation pressure, which set nsh(r) via equations (14) and (16), and its current emission rate of ionizing photons. Since the shell expansion is a result of the history of feedback, we might say that fabs, n only cares about the past while fabs, i is determined by both the past and the present.
After a dense shell has formed, radiation is initially well coupled (see Fig. 4). However, after the shell enters the free expansion phase (Phase III), the expansion velocity increases, while at the same time, the mass growth nearly stalls. The gas in the shell thus stretches over an ever-increasing surface area, reducing the shell's surface density and leading to a decrease of fabs. At the same time, ram pressure drops as R−2, the volume density decreases and the shell becomes thicker. As a result, fabs decreases even further. In the particular example shown in Fig. 4, fabs starts to differ significantly from unity at t ∼ 1 Myr, just after the cloud has been swept up. The bump at t ∼ 3 Myr is caused by the increase in ram pressure during the Wolf–Rayet and pre-SN phases. At t ∼ 5 Myr, ionizing radiation decouples from the shell. At that point, the whole shell is ionized. However, the time period during which ionizing radiation can pass through the shell is short: at late times, the output of ionizing radiation is greatly reduced due to the death of the very massive stars. Ionizing radiation is then again fully absorbed by the ISM. At t ∼ 8 Myr, fabs drops below 0.1. At this point, less than 10 per cent of the radiation, which has already been diminished due to the aging of the cluster, is transmitted to the shell, greatly reducing the efficiency of radiation pressure as a source of feedback.

Absorbed fraction of non-ionizing radiation fabs, n, ionizing radiation fabs, i, and the luminosity weighted mean fabs. The model is the same as in Fig. 3.
| n (cm−3) . | Z ( Z⊙) . | a . | b . | c . | d . | e . | |$\chi _{\nu }^2$| . |
|---|---|---|---|---|---|---|---|
| 1000 | 1 | −0.323 | 0.129 | −1.119 | −0.143 | 1.975 | 1.07 |
| 1000 | 0.15 | −0.118 | 0.085 | −0.695 | 0.102 | 0.140 | 2.01 |
| 100 | 1 | −0.109 | 0.063 | −0.579 | 0.084 | 0.363 | 1.18 |
| 100 | 0.15 | −0.020 | 0.037 | −0.312 | 0.097 | −0.034 | 3.18 |
From the signs of the fit parameters a (negative) and b (positive), we can already draw two conclusions:
Keeping the cloud mass constant, an increase in star formation efficiency leads to a faster decoupling with time.
Keeping the star formation efficiency constant, an increase in cloud mass leads to a slower decoupling with time.
To understand these trends, imagine a cloud with a given mass and density. If the cloud has a high star formation efficiency, two effects play a role: first, as a more massive cluster outputs more energy and momentum in winds and SNe, the ram pressure at the inner edge of the shell rises. The shell thus becomes denser and ionizing radiation is more coupled. However, there is a second, competing effect. Stronger feedback (both ram and radiation pressure) leads to a faster expansion of the shell. The column density thus drops faster (as soon as the cloud has been swept up), leading to weaker coupling of radiation. The negative sign of a shows that on average the second effect dominates.
Now consider a fixed cluster mass, but a variable cloud mass. The higher the cloud mass, the higher the column density radiation has to pass through. Also, gravity becomes more important as the cloud mass is scaled up, slowing the expansion of the shell down and increasing the coupling of radiation. If instead of a fixed cluster mass, ε is kept constant, the same arguments applies, albeit in a somewhat weakened form as the cluster mass and its feedback also increase as we increase the cloud mass. In summary, radiation coupling is stronger in massive clouds, explaining the positive sign of b.
5 WHICH TYPE OF FEEDBACK DOMINATES?
Now that we have quantified radiation coupling, we can start answering the question ‘Which type of feedback dominates?’ When asking this, it is crucial to distinguish between the instantaneous and the cumulative effect of feedback. The current density/chemical structure of the ISM is a bellwether of instantaneous feedback, while cumulative feedback is traced by shell dynamics.
Instantaneous feedback, as measured by its exerted force, is highly time-dependent. It is therefore necessary to specify what evolutionary stage one is interested in. To demonstrate this, we show in Fig. 5 for two examples the relative contributions from the various forces influencing the shell. These are the forces associated to winds and SNe, Fwind and FSN, direct and indirect radiation pressure, Fdirect and Findirect, as well as gravity Fgrav (cf. Section 2.1.2). To allow easy comparison between the various terms, the forces are normalized to their sum, Ftot = Fwind + FSN + Fdirect + Findirect + Fgrav. The feedback term that dominates at a given time t can be read off from the vertical width in Fig. 5. Note that here for the sake of comparison, gravity receives a positive sign. Therefore, if Fgrav/Ftot < 0.5, the shell gains momentum, otherwise it loses momentum. During the adiabatic phase, the force associated to thermal pressure from shocked winds Fhot is the only force we consider in our model.
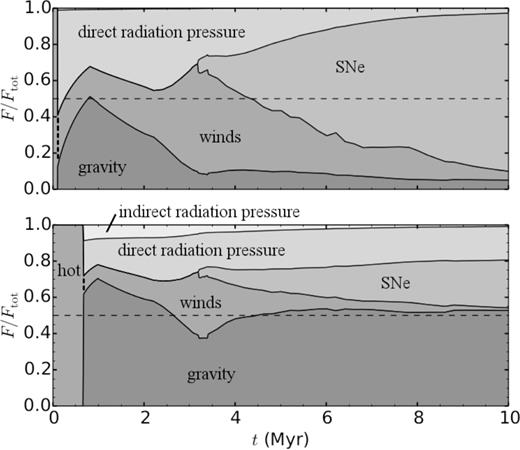
Comparison of relative forces from direct and indirect radiation pressure, winds, SNe, and gravity. If the contribution from gravity is above the 50 per cent margin (dashed horizontal line), the shell loses momentum. Top: Mcl = 105 M⊙, ε = 0.1, Z = Z⊙, and ncl = 1000 cm− 3 (same parameters as in Fig. 3). The contribution from indirect radiation pressure fraction is so small, it is barely visible (<1 per cent). Bottom: same ncl and Z as in the top panel, but with a higher cloud mass and star formation efficiency (Mcl = 3 × 10⁷ M⊙ and ε = 0.25). For more information see Section 5.
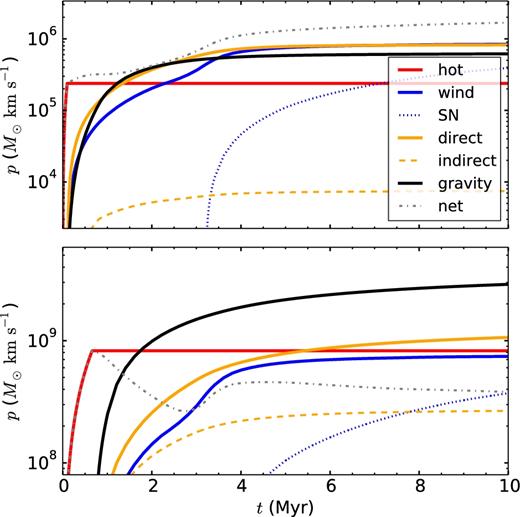
Comparison of momentum p deposited by the various feedback terms. The red line labelled ‘hot’ corresponds to feedback from hot shocked wind material during the adiabatic phase, the other terms are as in equation (5), i.e. ram pressure in blue, radiation pressure in yellow, and gravity, which has a negative contribution, in black. The parameters of the clouds examined in the two panels are the same as in Fig. 5.
During Phase I, gas pressure from hot winds is the only source driving the shell (cf. Fig. 5), but as soon as the shell enters Phase II, this force is shut off so that phot remains constant. After the adiabatic phase, direct radiation pressure becomes the main driving force until at t ∼ 2–3 Myr first momentum from winds and then from SNe starts to dominate the feedback budget. At the end of the simulation, the cumulative contribution from direct radiation pressure equals that from wind ram pressure in the case of the low-mass cloud (Fig. 6, top panel) and exceeds the contribution from wind ram pressure by a factor of 1.5 in the case of the high-mass cloud with higher star formation efficiency (Fig. 6, bottom panel). In the low-mass cloud case shown, the absorption fraction drops rapidly after 3 Myr (cf. Fig. 3) making radiation pressure a very ineffective feedback process at late times. This coincides with the death of massive stars marking a reduction in wind feedback and an increase in ram pressure from SNe. This additional pressure is not sufficient to raise the shell density, leading to a weak coupling between radiation and the swept-up ISM.
Although SNe become the main driving force at late times, the momentum injected by them over the whole simulation time is lower than that injected by winds or direct radiation pressure, albeit still of the same order of magnitude. In massive clouds, the relative importance of SNe is lower than in less massive clouds, as the exerted force associated with direct radiation pressure remained comparable with the force from SN feedback for a long time span.
Whereas feedback parameters like luminosity scale linearly with a cluster's mass for a fully sampled IMF, the gravitational force increases quadratically. With increasing cloud mass, Fgrav thus undergoes a superlinear increase, in contrast to the radiation pressure and ram pressure output of a cluster. This is the reason why in the massive cloud case shown, gravity dominates for most of the time after the end of Phase I and the cloud loses momentum. However, the shell still expands with a positive velocity caused by the initial velocity kick from the adiabatic phase (and a smaller kick during the Wolf–Rayet phase). Due to the slow expansion, radiation remains well coupled. Thus, feedback from radiation pressure continues to exceed wind ram pressure feedback.
In all but the most massive clouds (Mcl ≳ 107 M⊙), which produce very massive and dense shells, the contribution from indirect radiation pressure is small. During the expansion phase, even for a shell that forms in a 108 M⊙ cloud, τIR never exceeds 0.8, supporting findings by Skinner & Ostriker (2015), Martínez-González et al. (2014), and Reißl et al. (in preparation). Only at late times during recollapse can τIR exceed unity, but indirect radiation is still not strong enough to stall the collapse. However, for certain cloud–cluster combinations, it can provide just enough momentum to keep the expansion of the shell going until the entire cloud has been swept up and the shell accelerates again. In such a case, indirect radiation pressure can make the difference between continued expansion and recollapse.
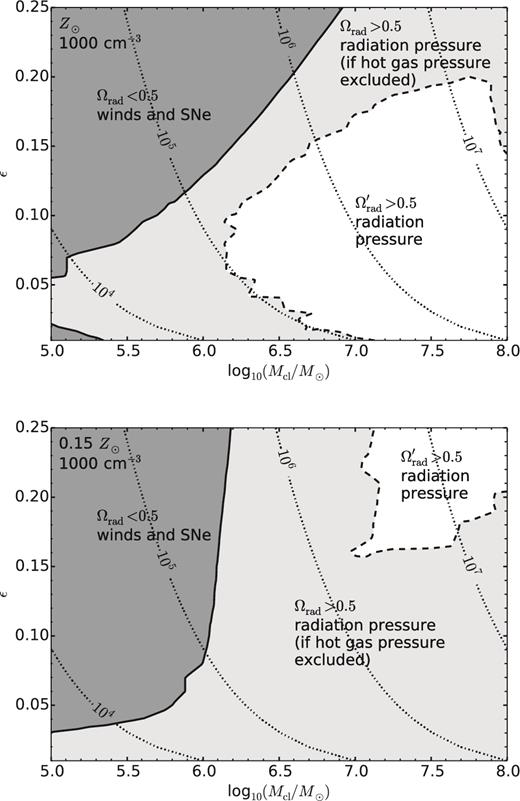
Regimes in which momentum, integrated over the whole simulation time tend, has mainly been injected by radiation or winds/SNe for the high-density runs with solar metallicity (top) and low metallicity (bottom). In white areas, the total momentum injected by radiation pressure exceeds the total momentum injected by ram pressure from winds/SNe and hot, shocked wind material (|$\Omega _{\rm {rad}}^{\prime }>0.5$|). In light grey areas, momentum from radiation pressure exceeds momentum from ram pressure, but not momentum from ram pressure and hot gas combined (Ωrad > 0.5). In dark grey areas, ram pressure dominates over radiation pressure (Ωrad < 0.5). Black dotted curves indicate lines of constant cluster mass from 104 to 107 M⊙.
Fig. 7 shows that the dynamics of shells forming in high-mass natal clouds are dominated by radiation pressure, while the dynamics of shells in low-mass clouds are dominated by winds (and to a lesser extent SNe). Also, ram pressure tends to dominate for high star formation efficiencies, as was expected from equation (29).
Interestingly, even in the low-metallicity case, where momentum output from winds is roughly one order of magnitude lower than for solar metallicity, there is still a large regime where they dominate over radiation pressure (Fig. 7, bottom panel). This has two reasons: first, the low amount of dust in metal-poor cloud leads to radiation being less coupled to the ISM. Second, the low ram pressure on the inner side of the shell causes the shell to be extended and low density; in such shells the recombination rate is small and ionizing radiation can easily escape without depositing its momentum. Thus, even though metallicity of a cluster does not strongly affect its radiative output, the entwinement between winds and radiation pressure still leads to a weakening of the efficiency with which radiation is deposited in the surrounding gas. A change in ram pressure output is always accompanied by a change in radiation coupling.
Our results show that for dense clouds, there is a large parameter range in which radiation pressure dominates. This shed doubts on findings by Martínez-González et al. (2014) who reported that radiation pressure is not the dominant feedback force for dense clouds. Their models, however, were not able to include radiation pressure in their shell expansion model. Instead they relied on an indirect diagnostic.
For our low-density models, ram pressure dominates the whole parameter space. The main reason for this is not that these models were simulated up to later times when SN feedback increases but rather that the shells driven in low-density environments have a lower density themselves and are thus less coupled to radiation. However, ram pressure only dominates by a factor of 1–4 over radiation pressure, meaning that radiation is still not a negligible driving force.
6 ESCAPE FRACTION OF IONIZING RADIATION
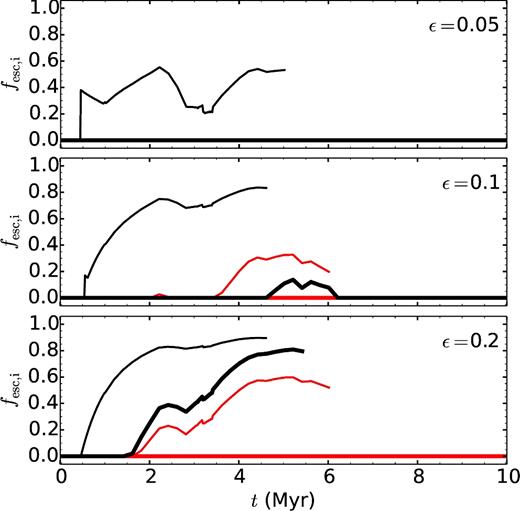
Escape fractions for ionizing radiation fesc, i for ε = 0.05, 0.1, and 0.2 (top, middle, and bottom panels, respectively) for Z = Z⊙. The black lines are for a 105 M⊙ cloud, and the red lines for a 106 M⊙ cloud. Thick and thin lines correspond to cloud densities of ncl = 1000 and 100 cm−3, respectively. Lines that stop before 10 Myr belong to shells that have dissolved into the ambient ISM before this time.
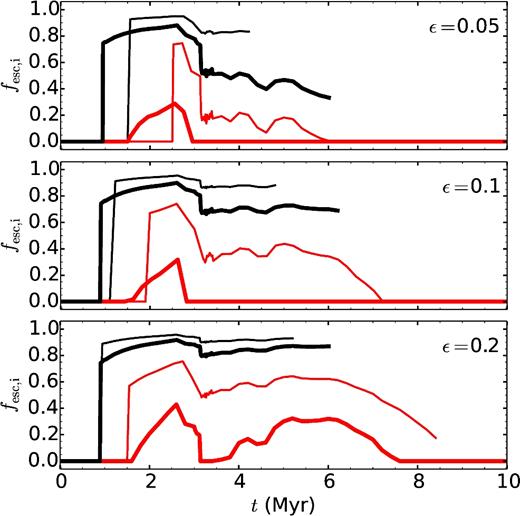
Escape fractions for ionizing radiation fesc, i for ε = 0.05, 0.1, and 0.2 (top, middle, and bottom panels, respectively) for Z = 0.15 Z⊙. The black lines are for a 105 M⊙ cloud, and the red lines for a 106 M⊙ cloud. Thick and thin lines correspond to cloud densities of ncl = 1000 and 100 cm−3, respectively. Lines that stop before 10 Myr belong to shells that have dissolved into the ambient ISM before this time.
For solar metallicity (Fig. 8), fesc, i reaches its highest values around 5 Myr. We have tested how the escape fraction would evolve if we would continue the expansion of the ‘shell’ even after it has dissolved and found that fesc, i always drops after t ∼ 5 Myr. At late times, the strong reduction in Li due to the death of the massive stars causes a decrease in fesc, i, even though the shell has a low column and volume density by then. Both the time span during which ionizing radiation can escape and the amount of escaping ionizing radiation depend on the cloud mass (more escape for low Mcl) and cloud density (more escape for low ncl). Additionally, the fact that the shell dissolves before 10 Myr for some models does not mean that all ionizing radiation can escape. With a decrease in Li at late times, even a diffuse medium of ≲ 1 cm−3 can be enough to absorb a large part of the ionizing radiation.
Low-metallicity models (Fig. 9) have higher integrated ionizing escape fractions than solar metallicity models and fesc, i peaks earlier, at ∼2.5 Myr, as less radiation is absorbed by dust. Also, even at low ε, dense clouds become optically thin to ionizing radiation before the first SNe. Thus, the Wolf–Rayet phase and the first SNe lead to a significant reduction in fesc, i between ∼3–4 Myr. Even though we neglect turbulence, which can open and close low-density channels in the ISM through which radiation can escape, we show that some strong variability in fesc, i is expected purely due to stellar evolution.
Our results are in good agreement with 3D MHD simulations by Howard, Pudritz & Klessen (2017) for a cloud with Mcl = 106 M⊙, ε = 0.1, and ncl = 100 cm−3 and solar metallicity even though they include turbulence but neglect stellar winds. Furthermore, our results are consistent with ionization parameter mappings of the Magellanic Clouds3 carried out by Pellegrini et al. (2012), who find average ionizing escape fractions of 0.4. These escape fractions are dominated by H ii regions with two types of geometries: blister-type H ii and classical density-bounded nebulae. Our model is most applicable to the density-bounded regions, which are consistent with fully ionized shells.
7 WHEN FEEDBACK FAILS - RECOLLAPSE AND SEQUENTIAL STAR FORMATION
It is not a given that stellar feedback is always able to overpower gravity and drive an outflow. If ε is lower than some minimum star formation efficiency εmin, the shell eventually collapses back on itself, initiating more star formation. One possible example for this could be the core of 30 Doradus where two distinct stellar clusters of different age coexist (e.g. Sabbi et al. 2012). The collapse time thus sets what we coin the cadence of star formation. Only when ε > εmin can further star formation be shut off (neglecting triggered star formation in the shell). Since we cannot follow the expansion of each shell ad infinitum, we regard shells as non-collapsing if they have either dissolved or have not collapsed by t = tend. We hence might miss a small number of shells that take longer than 7τff to collapse.
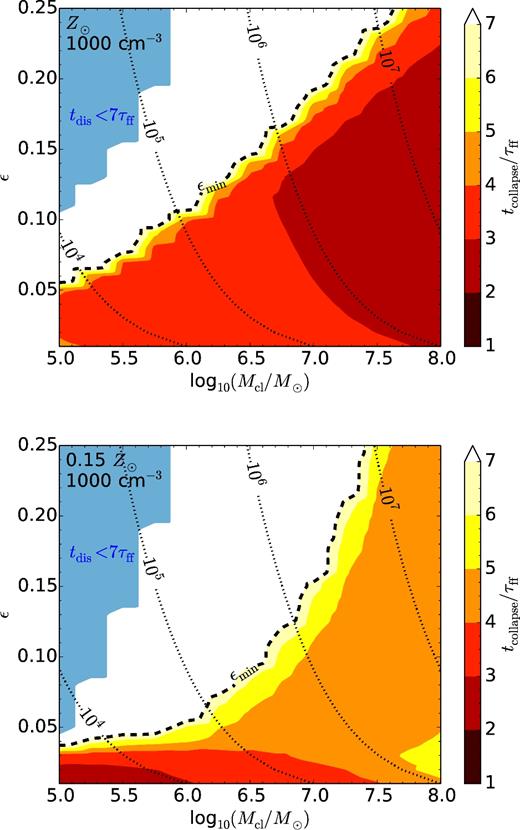
Collapse time tcollapse in multiples of τff (1.4 Myr) as a function of cloud mass and star formation efficiency for high-density runs with solar metallicity (top) and low metallicity (bottom). The black dashed line shows the minimum star formation efficiency εmin (see the main text). Shells in the light blue regime have dissolved before t = 7τff and are assumed to never recollapse. Black dotted curves indicate lines of constant cluster mass from 104 to 107 M⊙.
The dashed contour line between recollapsing and non-collapsing models shows the minimum star formation efficiency εmin. It increases with increasing cloud mass as gravity prevents outflows in massive clouds. We find that for solar metallicity, εmin scales linearly with log Mcl, while for the low Z, high-density model log εmin scales linearly with log Mcl. For all but the most massive clouds, εmin is lower for low metallicity.
The blue area in Fig. 10 shows models in which the shells dissolve before 7τff (∼10 Myr). The earliest dissolutions take place after 4 Myr. Using numerical simulations, this is also what Inutsuka et al. (2015) find for the destruction time of ∼105 M⊙ clouds, albeit for lower star formation efficiencies. 4 Myr is clearly shorter than what observational studies usually estimate for the lifetimes of molecular clouds after the onset of star formation, i.e. ∼20 Myr (see Dobbs et al. 2014 for an overview). We note this calls into question the existence of clouds with low masses and high star formation efficiencies.
In Fig. 11, we show tcollapse for our low-density models. Recollapse is limited to the most massive clouds or small star formation efficiencies in the case of solar metallicity. At low metallicity, only shells that form in clouds with masses close to 108M⊙ and ε ≤ 0.02 collapse. Recollapsing low-density models have lower εff values than high-density models, but are still consistent with observations (e.g. Murray 2011).
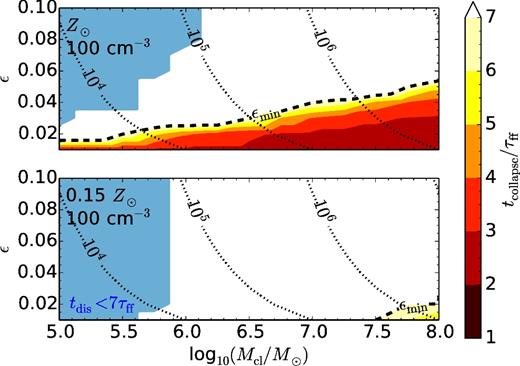
Collapse time tcollapse in multiples of τff (4.6 Myr) as a function of cloud mass and star formation efficiency for low-density runs with solar metallicity (top) and low metallicity (bottom). The black dashed line shows the minimum star formation efficiency εmin (see the main text). Shells in the light blue regime have dissolved before t = 7τff and are assumed to never recollapse. Black dotted curves indicate lines of constant cluster mass from 104 to 107 M⊙. Only star formation efficiencies up to ε = 0.1 are shown.
The trend of increasing εmin for increasing cloud mass hints at star formation being more efficient for massive clouds. Observationally, this is hard to test. Some studies that found the opposite trend, i.e. lower ε with increasing cloud mass, were probably limited by sampling and selection effects (Murray 2011).
Kim et al. (2016) present εmin for various cloud densities. As an example, for a 2 × 10⁶ M⊙ cloud with ncl = 1000 cm−3, they find εmin anywhere between 0.2 and 0.7 depending on which of their definitions for εmin they use. Our results suggest a lower value of εmin = 0.12 for such a cloud. This difference, however, is not surprising, since Kim et al. (2016) ignore wind and SN feedback in their model.
Studies of the effect of gas expulsion on star cluster evolution show that a majority of stars remain bound only if ε ≳ 0.1 − 0.2 (Geyer & Burkert 2001; Baumgardt & Kroupa 2007; Shukirgaliyev et al. 2017). Since clouds with a low gas density or a low mass have a lower minimum star formation efficiency than this value, our model predicts that such clouds will form gravitationally unbound OB associations rather than gravitationally bound star clusters. Similarly, the lower values of εmin that we find in our lower metallicity models suggest that the formation of unbound associations rather than bound clusters may be more common in these systems.
8 CONCLUSIONS AND SUMMARY
We have developed a new model that simultaneously and self-consistently calculates the structure and the expansion of shells driven by feedback from stellar winds, SNe, and radiation pressure. The model has been put to use to investigate the conditions in which the various different sources of feedback dominate, the amount of radiation that can escape through the shell, and to derive minimum star formation efficiencies for a large parameter space of clouds and clusters. Our main results are summarized below.
8.1 What is the dominant source of feedback?
Radiation pressure and ram pressure are interconnected. Any attempt to estimate the momentum that radiation injects into the ISM without accounting for ram pressure by winds and SNe will yield incorrect results. Changing the momentum imparted by winds always leads to a change in the efficiency of radiation pressure.
The evolution of a star-forming molecular cloud is strongly influenced by the effects of stellar evolution. The Wolf–Rayet phase and SN explosions do not only increase the effect of ram pressure but also indirectly increase the effect of radiation pressure (see above). It is thus imperative to include proper stellar evolution when investigating feedback.
After the shocked wind material has cooled, radiation dominates the driving of the shell as long as the shell remains optically thick. This is usually the case when the star cluster is still young (t ≲ 2–3 Myr). In massive clouds, which tend to expand more slowly due to the quadratic dependence of the gravitational force on mass, radiation pressure remains dominant for an even longer time span. Thus, in more massive clouds, the time-integrated effect of radiation pressure compared to ram pressure increases. Indirect radiation pressure is negligible for low-mass clouds and is only of some importance during the early phases of massive cloud evolution or during recollapse.
Stellar winds are more important than radiation pressure in dense clouds only if the cloud mass is towards the lower end of the range studied here (M ∼ 105–106 M⊙). They always dominate over radiation pressure if the cloud density is low. At low metallicity, the momentum output by winds is decreased but radiation also couples more weakly with the shell, and so winds can still dominate over radiation.
SNe dominate at late times. However, in most cases, over the whole cloud lifetime SN feedback does not exceed either feedback from winds or from radiation pressure. Also, feedback from SNe is not always sufficient to destroy a molecular cloud.
8.2 How well coupled is radiation to the shell?
As we have demonstrated, classical Strömgren calculations show a full ionization of a massive molecular cloud by a star cluster is practically impossible. Despite this, we find the escape of ionizing radiation from a spherically symmetric expanding cloud is significant, and a direct result of the shell structure responding to stellar feedback. This is an unavoidable consequence of the dynamic evolution caused by feedback driving an expansion and stretching the gas over a larger volume, decreasing its density.
Radiation decouples more rapidly from the ISM for higher star formation efficiency, lower metallicity, lower cloud density or lower cloud mass. This is true for both ionizing and non-ionizing radiation.
For our calculations of ionizing escape fractions fesc, i, we consider the radiation escaping through a shell but neglect any fragmentation of shell. Our escape fractions are thus independent of the solid angle on the sky and, in most cases, are lower limits to real total escape fractions.
8.3 What is the minimum star formation efficiency required to prevent recollapse?
We find minimum star formation efficiencies εmin of a few per cent for low-mass clouds, increasing to ∼25 per cent or more for very massive clouds. Clouds with star formation efficiencies above these values are disrupted by the effects of stellar feedback and do not recollapse.
The values we recover for εmin are considerably smaller than those found by Kim et al. (2016), likely because those authors do not account for the effects of stellar winds or SNe.
The cadence of star formation (i.e. the delay between episodes of star formation in clouds that recollapse) is 3–6 Myr (2–4 τff) for dense clouds with solar metallicity and is somewhat higher for lower metallicity clouds. Low-density clouds are much easier to disrupt by feedback (especially if they are metal poor), thus suggesting that they earlier shut off further star formation and hence tend to have a lower star formation efficiency.
Our results suggest that dense, massive and/or metal-rich clouds are more likely to form gravitationally bound star clusters, while less dense, less massive and/or more metal-poor clouds are more likely to form unbound OB associations.
Acknowledgments
We thank Sam Geen, Mordecai-Mark Mac Low, Avery Meiksin, Stefan Reißl, Stefanie Walch, and Robin Williams for helpful discussions. We acknowledge support from the Deutsche Forschungsgemeinschaft in the Collaborative Research Centre (SFB 881) ‘The Milky Way System’ (subprojects B1, B2, and B8) and in the Priority Program SPP 1573 ‘Physics of the Interstellar Medium’ (grant numbers KL 1358/18.1, KL 1358/19.2, and GL 668/2-1). RSK furthermore thanks the European Research Council for funding in the ERC Advanced Grant starlight (project number 339177).
Note that this assumes that the turbulence is dominated by motions on scales that are small compared to the shell thickness.
Photons in the energy range 11.2–13.6 eV can also be absorbed in the Lyman–Werner bands of H2, but this is significant in comparison to dust absorption only when the radiation field is relatively soft (Krumholz et al. 2008).
Typical sampled cloud masses associated with massive clusters in the Large Magellanic Cloud and Small Magellanic Cloud are >104 M⊙ (the same as those shown in Figs 8 and 9; see e.g. Wong et al. 2011), but the characteristic metallicity of the gas in these two galaxies is 0.5 Z⊙ (in between the metallicities, we investigated) and 0.2 Z⊙ (slightly above our low-Z model), respectively.
REFERENCES
APPENDIX A:
A1 The effect of stellar rotation
Models that include stellar rotation can better reproduce the observed main-sequence width and stellar surface abundances and velocities than models of non-rotating stars and are therefore thought to provide a more realistic view (Ekström et al. 2012). Given that rotating stars produce more ionizing radiation at later times (Levesque et al. 2012), it is interesting to see how stellar rotation effects the escape fractions of ionizing radiation in our models.
We reran all models including stellar rotation and found that the effects on the dynamics of the shell are small. However, since most ionizing radiation gets emitted at late times when the density of the shell has already dropped, fesc, i is larger at late times for rotating stars than for non-rotating stars (see Fig. A1). On the other hand, at early times stellar rotation does not considerably decrease fesc, i. Taken together, the time-integrated escape fractions of ionizing radiation are higher if stellar rotation is included.
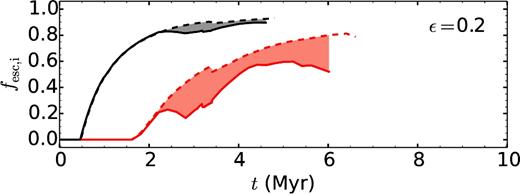
Example of the dependence of fesc, i on stellar rotation for ncl = 100 cm−3 and solar metallicity. The dashed lines correspond to the model which includes stellar rotation. The solid lines correspond to the non-rotating model. We show results for clouds with masses Mcl = 105 M⊙ (black) and Mcl = 106 M⊙ (red), as in Fig. 8. Since the assumed stellar rotation might be too high (see the main text), realistic escape fractions are expected to lie in the grey- and red-shaded areas, respectively.
For our simulations, we have used the rotating models by Ekström et al. (2012), which assume a stellar rotation velocity of 40 per cent of the break-up velocity on the zero-age main sequence. However, as Martins & Palacios (2013) point out, this value might be too extreme. The results obtained from including such a high rotation velocity should thus be regarded as an upper limit for fesc, i while non-rotating models provide a lower limit.
A2 Overview of models
On the following pages, we provide figures showing the shell radius and velocity, the absorption fraction of ionizing and non-ionizing radiations as well as momentum and force comparisons for models with a cloud mass of 105 M⊙ and star formation efficiencies of 0.1, 0.15, 0.2, and 0.25 (Fig. A2) and models with cloud masses Mcl = 106, 107, and 108 M⊙ and star formation efficiencies ε = 0.02, 0.05, 0.1, and 0.25 (Figs A3–A5). Densities of ncl = 1000, 100 cm−3 are shown; the metallicity is solar. Dashed lines in the expansion velocity and momentum plots show negative values.
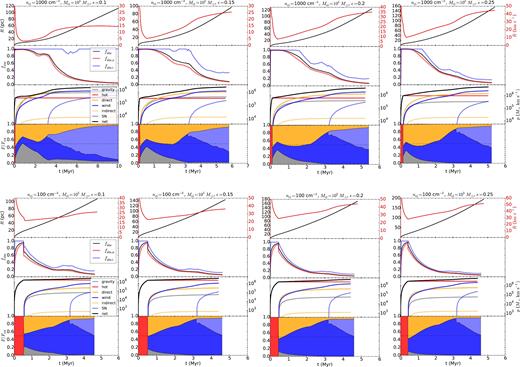
Models for clouds with Mcl = 105 M⊙ and ε = 0.1, 0.15, 0.2, and 0.25.

Models for clouds with Mcl = 106 M⊙ and ε = 0.02, 0.05, 0.1, and 0.25.

Models for clouds with Mcl = 107 M⊙ and ε = 0.02, 0.05, 0.1, and 0.25.
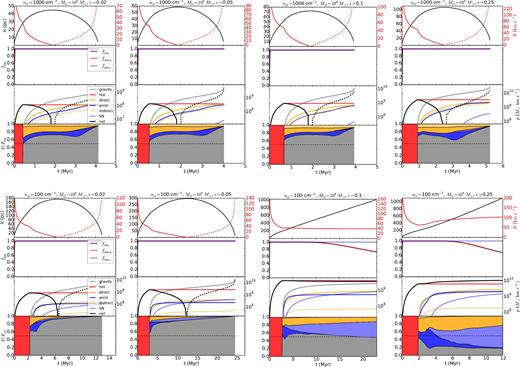
Models for clouds with Mcl = 108 M⊙ and ε = 0.02, 0.05, 0.1, and 0.25.


