-
PDF
- Split View
-
Views
-
Cite
Cite
N. Bucciantini, R. Bandiera, B. Olmi, L. Del Zanna, Modeling the effect of small-scale magnetic turbulence on the X-ray properties of Pulsar Wind Nebulae, Monthly Notices of the Royal Astronomical Society, Volume 470, Issue 4, October 2017, Pages 4066–4074, https://doi.org/10.1093/mnras/stx993
Close - Share Icon Share
Abstract
Pulsar Wind Nebulae (PWNe) constitute an ideal astrophysical environment to test our current understanding of relativistic plasma processes. It is well known that magnetic fields play a crucial role in their dynamics and emission properties. At present, one of the main issues concerns the level of magnetic turbulence present in these systems, which in the absence of space resolved X-ray polarization measures cannot be directly constrained. In this work, we investigate, for the first time using simulated synchrotron maps, the effect of a small-scale fluctuating component of the magnetic field on the emission properties in X-ray. We illustrate how to include the effects of a turbulent component in standard emission models for PWNe and which consequences are expected in terms of net emissivity and depolarization, showing that the X-ray surface brightness maps can provide already some rough constraints. We then apply our analysis to the Crab and Vela nebulae and by comparing our model with Chandra and Vela data, we found that the typical energies in the turbulent component of the magnetic field are about 1.5–3 times the one in the ordered field.
1 INTRODUCTION
Pulsar Wind Nebulae (PWNe) are bubbles of relativistic particles and a magnetic field arising from the interaction of the relativistic pulsar wind with the ambient medium (interstellar medium [ISM] or supernova remnant). They shine in non-thermal (synchrotron and inverse Compton) radiation in a broad range of frequencies from radio wavelengths to γ-rays (see Gaensler & Slane 2006 for a review). At X-rays, many PWNe show an axisymmetric feature known as jet-torus structure. This feature has by now been observed in a number of PWNe among which are the Crab nebula (Weisskopf et al. 2000), Vela (Helfand, Gotthelf & Halpern 2001; Pavlov et al. 2001) and MSH 15-52 (Gaensler et al. 2002; DeLaney et al. 2006), to name just a few. It is now commonly accepted that this structure arises due to the interplay of the anisotropic energy flux in the wind with the toroidal magnetic field, as confirmed by a long series of numerical simulations (Komissarov & Lyubarsky 2003, 2004; Del Zanna, Amato & Bucciantini 2004; Del Zanna et al. 2006; Volpi et al. 2007; Camus et al. 2009; Porth, Komissarov & Keppens 2014; Olmi et al. 2014, 2016). In general, two-dimensional models are built on the axisymmetric assumption of a purely toroidal magnetic field, while three-dimensional models usually have a much lower resolution and can only investigate large-scale deviations from axisymmetry. However, recently, several arguments have been put forward advocating the presence of small-scale turbulence in PWNe: the presence of a large diffuse X-ray halo at distances in excess of the naive expectation for synchrotron cooling and advection (Tang & Chevalier 2012; Bühler & Blandford 2014; Zrake & Arons 2016); the suggestion that radio-emitting particles could be continuously re-accelerated in the body of the nebula (Olmi et al. 2015; Tanaka & Asano 2016); and the observation of recurrent γ-ray flares requiring localized strong current sheets (Uzdensky, Cerutti & Begelman 2011).
Radio polarization maps are available, but being radio emission dominated by the outer region of PWNe, where the effects of the interaction with the SNR are stronger, they provide at best a good estimate of the degree of ordered versus disordered magnetic field for the overall nebula, but cannot be used to constrain the conditions in the region close to the termination shock where most of the variability and the acceleration processes take place. In the Crab nebula, the polarized fraction in radio is on average ∼16 per cent (Conway 1971; Ferguson 1973; Velusamy 1985; Aumont et al. 2010) with peaks up to 30 per cent, lower than in optical, where the average polarized fraction is ∼25 per cent (Velusamy 1985). Moreover the polarized flux in radio anticorrelates with the location of the X-ray torus. The values of the radio polarization are consistent with a largely turbulent magnetic field in the outer part of the nebula (Bucciantini et al., in preparation).
Recently, high-resolution HST observations in polarized light have been presented both for the inner region of the Crab nebula (Moran et al. 2013) and for the Vela PWN (Moran, Mignani & Shearer 2014). The study of the Crab nebula focused on the brightest optical features, namely the knot and the wisps, which are shown to have typical polarized fractions of about 60 per cent and 40 per cent, respectively. The results in the Crab nebula are consistent with the general picture of a strongly ordered toroidal magnetic field just downstream of the termination shock with a possible hint of the development of turbulence: the polarized fraction of the wisps is lower than the one in the knot and numerical simulations suggest the former to be slightly more downstream than the latter. Vela is not detected in polarized optical light, but this might not be very constraining given that there is no optical counterpart observed for this nebula (Marubini et al. 2015). The major problem with optical emission is that there is usually a large foreground, often polarized (see for example the polarization analysis of the Crab nebula presented in Hester 2008), and the jet-torus structure, which is so prominent in X-ray, is much fainter. Ideally, one would like to probe these systems using X-ray polarimetry (Bucciantini 2010) and there is a large interest in the scientific community for such an objective (Soffitta et al. 2013; Weisskopf et al. 2016). Incidentally, the Crab nebula is, at the moment, the only object with a polarization detected in X-ray (Weisskopf et al. 1978).
In the past years, several models have been presented to simulate the X-ray emission map of PWNe (with a particular focus on Crab), ranging from simplified toy-models (Ng & Romani 2004; Schweizer et al. 2013) to more complex multidimensional time-dependent simulations (Volpi et al. 2007; Porth et al. 2014; Olmi et al. 2016). Starting from the early work of Bucciantini et al. (2005), polarization has also been modelled using, in general, a magnetic field geometry derived from numerical simulations (Del Zanna et al. 2006; Porth et al. 2014). However, the presence of small-scale turbulence and its effects, both on the polarized fraction and on the emissivity pattern, have never been taken into account before.
Here we present synthetic polarization maps of PWNe, taking into account the presence of small-scale magnetic turbulence at a subgrid level. In Section 2, we illustrate how the recipe for total and polarized emission can be corrected to take into account magnetic turbulence. In Section 3, using a simple toy model, we show how the effects of turbulence manifest in the intensity map and are thus in principle already accessible from X-ray imaging. In Section 4, we present a semi-analytical model for a thin-ring that allows us to derive simple formulae showing the typical degeneracy between Doppler boosting and turbulence. In Section 5, we apply our results to the Crab and Vela PWNe, objects that have been considered as primary targets for future X-ray polarimetric observations (Weisskopf et al. 2016).
2 POLARIZATION RECIPES AND SUBGRID MODEL
It can be shown that it is not correct to model a fluctuating component just by adding a constant unpolarized emission on top of the one derived assuming a totally ordered field. A cautionary remark is here in order: the corrections derived by Bandiera & Petruk (2016) are formally valid only in the limit β → 0 when the isotropic assumption in the comoving frame corresponds to the isotropic assumption in the observer's frame. In case of strongly relativistic motions this is in general not true. The correction coefficients in such a case are defined properly in the comoving frame and one would need to perform a Lorentz transformation of the polarization tensor to get the correct result in the observer's reference frame. However, the typical bulk flow in the body of PWNe (and in particular in the torus region) has a speed of β ≲ 0.5, leading to differences between the comoving and observer's magnetic field of the order of few per cent at most, as can be seen from equation (6), well below the level of the quantitative accuracy with which simulated maps can reproduce observations.
3 EMISSION MAPS
In Fig. 1, we show the results for various values of the amplitude of the fluctuating part σ, in the case of a torus with a symmetry axis inclined by 30° on the plane of the sky (for reference to a purely ordered case, consider the upper-right panel of fig. 1 in Bucciantini et al. 2005). It is immediately evident that for |$\sigma > 1/\sqrt{3}$|, corresponding to a case where the fluctuating components contain the same magnetic energy of the ordered one, the intensity along the torus changes appreciably with respect to the ordered case: as the energy in the fluctuating components rises, the difference in the intensity between the centre of the torus and the sides drops. However, as shown by Bucciantini et al. (2005), the angular sideways trend of the luminosity along the torus is also strongly affected by Doppler boosting, so in principle one can obtain similar trends lowering the flow speed (see Section 4). Interestingly, it can be shown that for a flow speed with β ≲ 0.5, the two effects can be disentangled looking also at the brightness difference between the front and back sides of the torus. Such brightness difference is insensitive to the value of σ and depends only on β (see the Appendix), so it can be used to set a lower limit to the flow speed (see again fig. 1 of Bucciantini et al. 2005). On the other hand, the presence of a fluctuating component is very effective in raising the luminosity at the sides of the torus, thus the brightness difference between the front and sides can be used to get another constraint and set limits on σ. Interestingly, as shown in Fig. 1, maps in polarized intensity show little or no variation at all in their pattern for any value of σ, what changes is the polarized intensity (the polarized fraction). This can be easily understood recalling that in our subgrid model the effect of small-scale fluctuations on the polarized intensity is much smaller than that on the total one. The other important aspect is that, being a mean-field model, it does not include possible variances in the polarized properties. So the polarized direction (the polarized angle) stays unchanged. The ratio of the maximum polarized intensity over the maximum total intensity goes from 0.7 for σ = 0 to 0.08 for |$\sigma =\sqrt{10/3}$| (δE = 10E), while the total polarized fraction goes from 38 per cent for σ = 0 to 3 per cent for |$\sigma =\sqrt{10/3}$|. This shows how important future X-ray polarimetric measures could be. However, some constraints can be drawn even now just by using available emission maps. The known polarized fraction of the Crab nebula in X-ray is PF = 19.2 ± 1 (Weisskopf et al. 1978). Assuming it is mostly associated with the emission of the bright torus, this would suggest a value of σ in the range [0.6–0.8], corresponding to a value of the energy in the fluctuating components of the same order as the one in the ordered toroidal field.
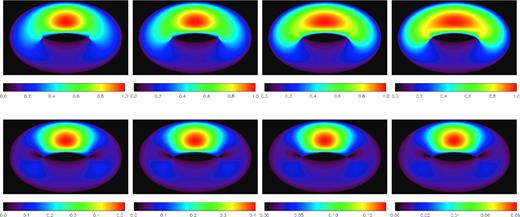
Upper panels: from left to right the total intensity normalized to its maximum value, for |$\sigma =\sqrt{1/6},\sqrt{1/3},\sqrt{4/3},\sqrt{10/3}$| (corresponding to ratios of energy in the fluctuating components over the one in the ordered toroidal component of 0.5,1,4,10, respectively). Lower panels: the same but for the polarized intensity, normalized to the maximum total intensity.
As an example of application to more complex multidimensional models based on relativistic MHD simulations, in Fig. 2 we show how the simulated synchrotron map changes due to the inclusion of a small-scale fluctuating magnetic field. The model is the one described in Olmi et al. (2015) and targeted to the Crab nebula. For reference to the fully ordered case (σ = 0), one should take the map shown in fig. 2 of that same paper. Instead of just using a uniform value of σ for the fluctuating components of the magnetic field in the nebula, we have here opted to take a value increasing with distance from σ = 0.3 at a radius from the centre r = 0.6 ly, to a maximum value σ = 1 at r = 1.25 ly. With this choice the inner wisp region is marginally affected, while fluctuations reach their maximum in correspondence with the location of the torus (see also the next section). The effects of this small-scale turbulent component are twofold: they raise the brightness of the sides of the various rings and arcs, as already discussed, and they also increase the relative brightness of those regions having a higher value of σ (the torus) with respect to the inner ones.
4 THE ‘THIN TORUS’ SEMI-ANALYTIC CASE
The most relevant aspect to investigate for the present discussion is how the intensity decreases moving away from the projected axis of symmetry, for the brighter (front) region of the torus. In the Appendix, we also discuss the intensity ratio between the two regions of the torus crossing the projected axis (front-to-back side brightness ratio), the geometry of the polarization swing (Bucciantini et al. 2005) due to the velocities of the emitters and other observables in the case of two symmetric rings (see also Section 5).
The presence of a random magnetic field component does not affect the direction of polarization, but contributes both to the behaviour of the polarization fraction and to the pattern of the total intensity, the last one due to the fact that in the presence of a random magnetic field component synchrotron emission is less anisotropic.
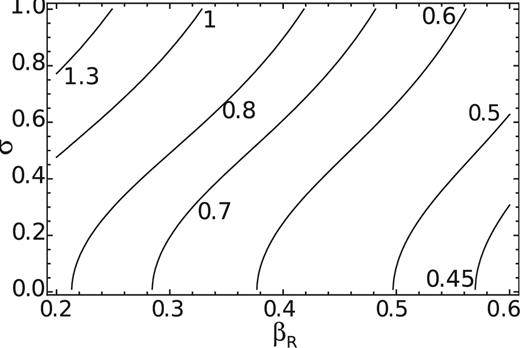
Value of the normalized |$y_S/R_1=1/\sqrt{-S}$| brightness scale along a thin-ring (with respect to the symmetry axis) given by equation (30), as a function of βR and σ. Labels of the contours are the values of yS/R1. The model is computed for βz = 0, i = 30° and α = 0.6.
5 APPLICATIONS
We apply here our model to the Crab and Vela PWNe. Following an approach similar to the one used by Ng & Romani (2004), we build a simulated synchrotron map to fit the three main components seen in X-rays: the torus, the inner ring and the jet. In order to obtain a reference image of the Crab nebula as shown in Fig. 2, we have aligned and combined 24 Chandra ACIS images of different epochs, ranging from 2012 to 2015, as retrieved from the Chandra Archive. Since each individual image presents a stripe corresponding to the chip gap, as well as the bright line aligned with the saturated pulsar image, before adding the images up we have masked these critical areas in all of them. Due to the different roll angles of the observations, the stripes in each image show a different orientation: therefore we successfully managed to add them up without leaving blind areas. Finally, a pixel-by-pixel correction has been applied to account for the difference in the effective exposure time due to the superposition of masked images having different orientations and offsets. In this way, the medium-large scale structure is very well reproduced; only the smaller scales are partially washed out, since the nebular structure is highly dynamical on those scales. Let us remark here that given the simplicity of the model we have adopted, we have not gone through a full-fledged data reduction. The data are simply used to derive rough constraints and not to place severe quantitative limits.
In Fig. 4, we show our reference image for the Crab nebula, our best-fitting model, and the residuals between the data and the model. In Fig. 5, we show the residuals in the fully ordered case σ = 0, where in order to get brighter sides of the torus we had to lower the boosting speed to the possible smallest value (0.25–0.3)c. We cannot lower it further. However, looking carefully at the residuals, one can see that even if we are able to get the correct front-to-back side brightness difference, this model tends to under-predict the front-to-sides one, on both sides of the torus. To make this difference clearer, in the bottom panel of Fig. 5, we compare the X-ray surface brightness of the torus, sampled along the arc shown in the upper panel of the same figure, to our two models: the one with a fluctuating small scale field with σ = 0.7 and the one with a fully ordered field with σ = 0. It is evident that both models give a reasonable fit in the central (on axis) part of the torus within ±10 arcsec from the peak, where they can hardly be distinguished. However, the wings of the torus beyond ±15 arcsec are slightly underpredicted by the fully ordered case. On top of this the integrated polarized fraction for the fully ordered case is estimated to be ∼30 per cent. This is much higher than the measured value of 19 per cent and, given that the torus is by far the brightest feature in X-ray, it is unlikely that the low surface brightness diffuse X-ray emission could provide enough unpolarized radiation to compensate.

Left-hand panel: Chandra X-ray image of the Crab nebula. Intensity normalized to the maximum. Middle panel: our model of the Crab nebula. In the torus, we assume a flow velocity of 0.35c and σ = 0.7. Intensity normalized to the maximum with bars corresponding to the polarized direction. Right-hand panel: residuals obtained by subtracting the model from the data, normalized to the intensity maximum of the data. The solid line represents the zero level. The dashed lines represent the ±20 per cent level.
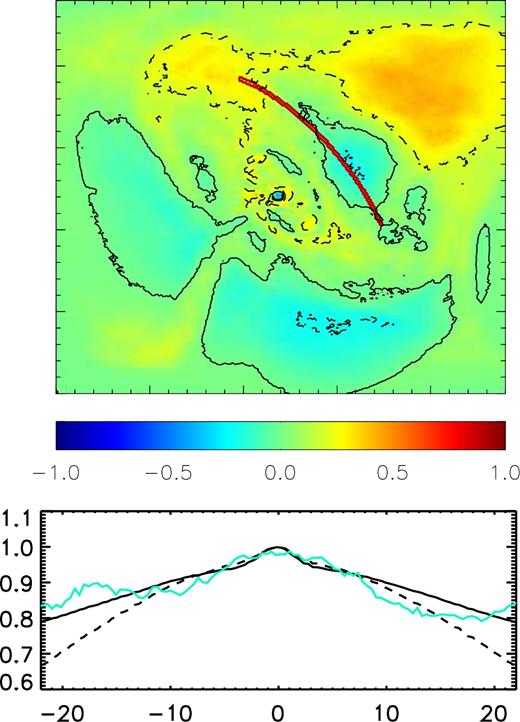
Upper panel: map of the residuals for the Crab nebula defined as for Fig. 4, but with respect to a model with fully ordered toroidal magnetic field. The flow velocity is set to 0.3c in order to match the front to back brightens difference, while in the torus σ = 0. The solid line represents the zero level. The dashed line represents the ±20 per cent level. Lower panel: comparison of the surface brightness in the region defined by the red arc in the upper panel (cyan line) to the model with σ = 0.7 (solid line) and to the one with σ = 0 (dashed line). The curves have been re-scaled to match the maximum of the intensity. The x-axis is in arcsec from the peak. The y-axis is in arbitrary units normalized to the peak.
As shown in Fig. 4, in the region of the ring and the torus, our best-fitting model provides residuals below 15 per cent. Given, however, the presence of a non-uniform and diffused X-ray nebular emission, the fact that the torus itself is brighter on one side, the fact that the ring is not exactly centred on the pulsar and that there are non-axisymmetric features like the north-west spur, it is obvious that our axisymmetric model cannot provide an accurate fit. But in its simplicity it already indicates that the brightness profile of the torus points towards a possibly large level of turbulence (about half of the magnetic energy should be in the small-scale fluctuating part).
We have repeated a similar analysis for the Vela PWN. To get a reference image, we have followed a procedure similar to that already described for the Crab nebula, combining 19 Chandra ACIS images relative to the period from year 2001 to 2010. Since the relevant areas in individual images now are not affected by the chip gap, we have simplified the masking procedure with respect to the previous case. As shown in Fig. 6, the X-ray nebula is characterized by two tori and a small jet. Due to the presence of a large and diffuse X-ray emission, and to the brightness of the pulsar, we have limited our investigation to the brightness profile of the two tori, without attempting a global fit of the emission map. In the upper panel of Fig. 6, we show the regions of the tori where we have extracted the brightness profiles shown in the bottom panel. We model the tori, as was done for the Crab nebula, using the Gaussian profile of equation (33), with R2/R1 = 5.9 and 5.3 for the outer and inner torus, respectively. The symmetry axis is inclined by 33° on the plane of the sky and 130° with respect to the north. A jet (and counter-jet) was also introduced with radial velocity equal to 0.7c, in order to reproduce the brightness peak observed on axis in the outer torus. The spectral index is fixed at α = 0.3 (Kargaltsev & Pavlov 2004). The brightness difference between the front side (on axis) of the tori and the back side constrains the radial flow speed to be higher than 0.35c. In the bottom panel of Fig. 6, the brightness profile of the tori is compared to a fully ordered case σ = 0 with radial velocity 0.35c and to a case with σ = 1 and radial velocity ≈0.5c. Again it is evident that the two models begin to differ substantially beyond 10 arcsec from the axis. For the inner torus the difference between the two cases is small. This happens because the sides of the inner torus are superimposed along the line of sight to the back part of the outer torus so that their brightness does not decline as fast. On the other hand, the model with a fully ordered magnetic field underpredicts the brightness of the sides of the outer torus. A better agreement is achieved by the model with σ = 1. However, we remark here that the presence of a large diffuse X-ray emission does not allow us to perform a satisfactory global fitting of the emission map using a simple prescription as equation (33). We can use our models to provide upper limits to the total integrated polarized fraction. For σ = 0, we expect PF ≤ 23 per cent, while for σ = 1 we find that the polarized fraction should be ≤6 per cent. Only future polarimetric measures could help us to identify the correct regime.
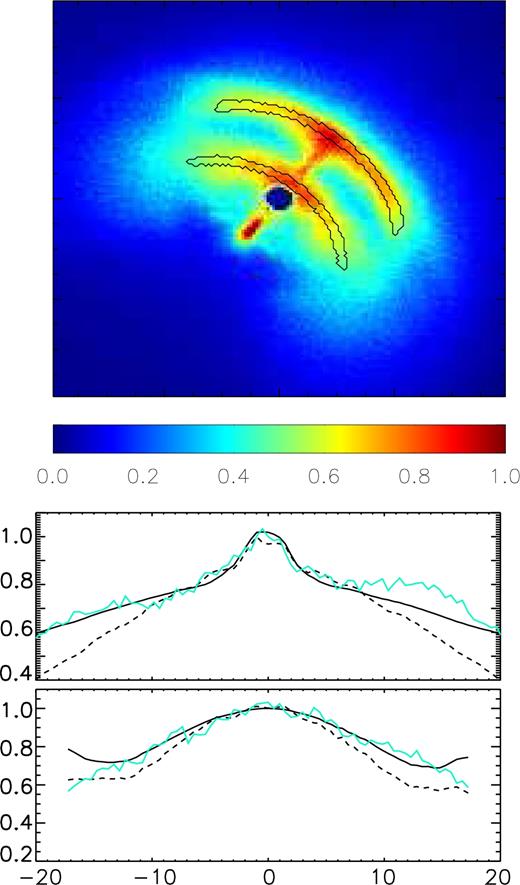
Upper panel: brightness map of the Vela PWN, normalized to the maximum. Axes in arcsecs. The central region containing the pulsar has been excised. The two arcs represent the region of the inner torus and outer torus whence the brightness profile was extracted. Lower panel: comparison of the surface brightness in the outer torus (above) and inner torus (below), measured in the arcs shown in the upper panel, to the model with σ = 1 (solid line) and to the one with σ = 0 (dashed line). The x-axis is in arcsec from the peak. The y-axis is in arbitrary units normalized to the peak.
6 CONCLUSIONS
Driven by the increasing evidence pointing towards the presence of a possibly large magnetic turbulence in PWNe and the interest in future X-ray polarimetric observations, we have developed here a simple formalism to simulate the effect of a small-scale fluctuating magnetic field on the emission properties of PWNe, and potentially of other synchrotron emitting sources, and we have shown how to build emission maps to be compared with observations. We find that in general there is a degeneracy between the effects of a turbulent component and the Doppler boosting. Both regulate how the brightness changes along rings and tori: the front-to-sides brightness difference can be lowered assuming either a lower flow speed or a higher level of turbulence. We showed however that this degeneracy can be partially broken looking at the front-to-back brightness difference, which depends only on Doppler boosting. We have applied our analysis to the Crab and Vela PWNe, showing that models with a sizable fraction of magnetic energy into a small-scale turbulent component seem to provide a better fit for the tori. In the case of the Crab nebula, where integrated polarimetric measures are available, our turbulent model gives a consistent estimate of the polarized fraction. For the Vela PWN we provide only rough estimates of upper limits for future observations. Our results show that, while evidence for a turbulent component can already be guessed from emission maps, future X-ray polarimetric measures, even of just integrated polarized fraction, will be crucial to set stronger constraints. This could also help to clarify if the observed morphological difference in X-ray PWNe is possibly related to different levels of turbulence.
Acknowledgements
The authors acknowledge support from the PRIN-MIUR project prot. 2015L5EE2Y Multi-scale simulations of high-energy astrophysical plasmas.
REFERENCES
APPENDIX: THIN-RING
We illustrate here how to derive other observable quantities of interest for a thin-ring (or a pair of symmetric rings), as a function of inclination, bulk velocity and level of turbulence.
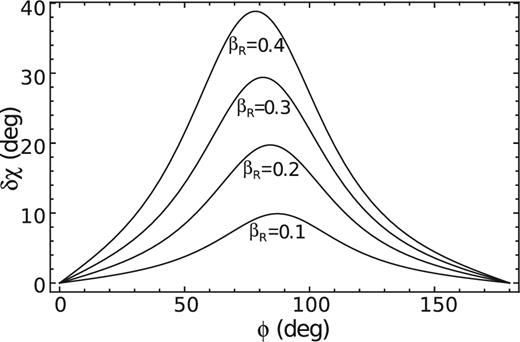
Trend of the polarization angle swing δχ as definded in equation (A5), for different values of the velocity βR in the case βz = 0, i = 30° and α = 0.6.
Non-vanishing values of βz are expected in the case of a pair of rings, like for instance in the case of Vela. It is then possible to estimate the value of βz by comparing the yS scalelength of the two tori. To keep the system symmetric, let us assume equal values of βz in the two rings, but with opposite signs; in this case, Fig. A2 shows that the ratio yS, +/yS, − is strongly dependent on βz while it is almost independent of βR and therefore possibly represents a good diagnostic for βz. It can be shown that this quantity is also almost independent of σ.
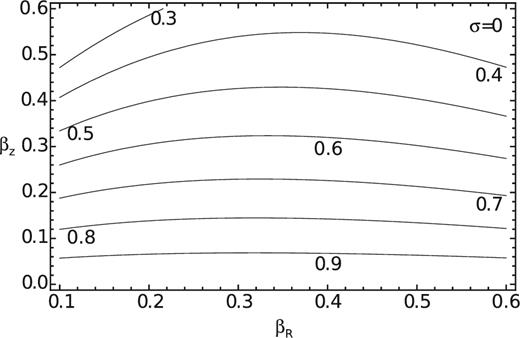
Trend of the yS, +/yS, − ratio for two rings symmetric with respect to the equator, as a function of βz and βR, for i = 30° and α = 0.6.


