


Abstract
We perform the NuSTAR and Swift/XRT joint energy spectral fitting of simultaneous observations from the broad-line Seyfert 1.5 galaxy NGC 5273. When fitted with the combination of an exponential cut-off power law and a reflection model, a high-energy cut-off is detected at 143|$^{+96}_{-40}$| keV with 2σ significance. Existence of such cut-off is also consistent with the observed Comptonizing electron temperature when fitted with a Comptonization model independently. We observe a moderate hard X-ray variability of the source over the time-scale of ∼12 yr using INTEGRAL/ISGRI observations in the energy range of 20–100 keV. When the hard-band count rate (6–20 keV) is plotted against the soft-band count rate (3–6 keV), a hard offset is observed. Our results indicate that the cut-off energy may not correlate with the coronal X-ray luminosity in a simple manner. Similarities in parameters that describe coronal properties indicate that the coronal structure of NGC 5273 may be similar to that of the broad-line radio galaxy 3C 390.3 and another galaxy MCG-5-23-16, where the coronal plasma is dominated by electrons, rather than electron–positron pairs. Therefore, the coronal cooling is equally efficient to the heating mechanism keeping the cut-off energy at low even at the low accretion rate.
1 INTRODUCTION
Although widely studied, the coupling between the accretion disc and the Comptonizing corona as well as the origin of seed photons for Comptonization (Haardt & Maraschi 1991; Liu, Xie & Ji 1995; Zycki, Collin-Souffrin & Czerny 1995; Liu et al. 1999; Taam et al. 2012; Mallick & Dewangan 2017) is yet to be fully understood in accreting systems harbouring a supermassive black hole, i.e. active galactic nuclei (AGNs). One robust way to predict the connection between the coronal properties in response to the seed photon flux is to measure the cut-off in the hard X-ray spectrum and the photon power-law index. The spectral cut-off is directly related to the Comptonizing electron temperature of the corona while the power-law index depends on the interplay between the electron temperature and the optical depth (Titarchuk & Lyubarskij 1995). The optical depth provides the size of the Compton up-scattering region for a typical electron density. Therefore, measuring both the high-energy cut-off and photon power-law index can provide much accurate description of the nature of Comptonizing corona and its geometry. Since high-energy spectra (> 5 keV) are less affected by the absorption, they are most reliable for measuring photon power-law index as well as high-energy cut-off (Nicastro et al. 2000; Malizia et al. 2014). NuSTAR spectra, with its unprecedented sensitivity at high energy (the detection limit in 10–30 keV is 1 × 10⁻¹⁴ erg cm−2 s−1; Harrison et al. 2013), has provided strong constraints on the coronal properties as well as the cut-off energy of a few AGNs (Brennman et al. 2014; Balokovic et al. 2015; Fabian et al. 2015; Matt et al. 2015).
One possible mechanism for the existence of a very high energy cut-off, which in turn implies a very high temperature of the corona, is the inefficient coronal cooling process. Such inefficient cooling can be caused by a low supply of seed photons that is common in the low-luminosity AGN (LLAGN) due to their very low mass accretion rate (<1 per cent of the Eddington accretion rate) and the presence of radiatively inefficient electron–positron pair as the coronal composition. One such example is NGC 2110, where the mass accretion rate is relatively low (0.25–3.7 per cent of Eddington accretion rate; Marinucci et al. 2015) and the cut-off is detected at energies >210 keV (Marinucci et al. 2015). On the other hand, bright AGN with high-mass accretion rate (> 10 per cent of Eddington accretion rate), e.g. SWIFT J2127.4+5654 shows relatively lower cut-off at 108 ± 11 keV (Marinucci et al. 2014). Using Suzaku and NuSTAR observations of one of the brightest AGN IC 4329A (∼46 per cent of Eddington accretion rate; de La Calle Peŕez et al. 2010), the high-energy cut-off is detected in the energy range 170–200 keV (Brennman et al. 2014) while Malizia et al. (2014) constrained the cut-off energy at 152|$^{+51}_{-32}$| keV using the simultaneous Swift/BAT and INTEGRAL/IBIS observations. Variable cut-off energy is also reported. For example, the cut-off energy detected in NGC 5506 has been reported few times: using simultaneous Swift/BAT and INTEGRAL/IBIS observations during three epochs, Molina et al. (2013) constrained the cut-off energy at 36|$^{+5}_{-6}$|, 54|$^{+14}_{-10}$| and 76|$^{+27}_{-16}$| keV by keeping the disc reflection fraction fixed at 0, 1 and 2, respectively. Using simultaneous XMM–Newton and BeppoSAX observations, Bianchi et al. (2003, 2004) obtained the high-energy cut-off at 140|$^{+40}_{-30}$| keV while using simultaneous Swift/XRT and NuSTAR spectra, Matt et al. (2015) found the high-energy cut-off at 720|$^{+130}_{-190}$| keV. Although we certainly cannot rule out the possibility of a variable cut-off energy detected from a source at different epochs; however, if such variation is linked to the change in the mass accretion rate, it is unlikely that the cut-off energy would vary on short time-scales (from months to years).
Such luminosity dependence of the cut-off energy may not be described by a simple relationship, rather complicated by the dichotomy in physical and observational properties like Compton-thin/Compton-thick circumnuclear matter and narrow-line Seyfert 1 (NLS1)/broad line. Nevertheless, strong constraints on the cut-off energy have been proven to be extremely crucial in understanding the accretion and radiation mechanism in AGN. Continuing the efforts to understand the hard X-ray spectral properties of AGN, we present the spectral analysis of a low-luminosity, Seyfert 1.5 galaxy NGC 5273 in the energy range 0.8–75 keV.
NGC 5273 is a broad line, nearby AGN at a redshift of 0.003 62 (Bentz et al. 2014). The AGN is hosted by a faint-spiral galaxy (S0 morphology) at a distance of 16.5 ± 1.6 Mpc (Tonry et al. 2001; Tully et al. 2008). Using the weighted average of the time-delay between the broad, optical recombination lines with respect to the changes in the continuum flux, Bentz et al. (2014) measured the mass of the central black hole of (4.7 ± 1.6) × 106 M⊙. Subtracting M32 template spectrum from the optical spectrum of NGC 5273, Osterbrock & Martel (1993) found a weak H β emission line. However, based on the very large ratio of H αb and H βb lines, they categorized the source as a Seyfert 1.9. However, in a recent paper, Trippe et al. (2010) acquired optical spectra with the GoldCam spectrograph on the 2.1 m telescope at Kitt Peak National Observatory and significantly detected both H α and H β lines after subtracting the E0 host galaxy contribution. Neither the narrow-line region nor broad-line region was found to be reddened. Therefore, they classified NGC 5273 as a Seyfert 1.5 galaxy. Since the later claim of the Seyfert classification was based on the improved instrumentation and better calibration than the former claim, we assume the galaxy type 1.5 in the rest of the paper.
Using XMM–Newton observations of NGC 5273 on 2002 June 14, Cappi et al. (2006) found the equivalent width of the Fe-K α emission line 226 ± 75 eV. They found moderate absorption column density of the order of 1022 cm−2 and interestingly the highest ratio between the 2–10 keV X-ray flux and O iii line flux (at 5700 Å) amongst all Seyfert 1 galaxies. This diagnosis, based on the fact that [O iii] luminosity is the isotropic indicator of the intrinsic luminosity, implies that NGC 5273 is a Compton-thin AGN. Using Suzaku (combining FI-XIS, BI-XIS, HXD/PIN) and Swift/BAT observations of NGC 5273 on 2013 July 16, Kawamuro et al. (2016) found the power-law index of 1.57|$^{+0.07}_{-0.06}$| and absorption column density NH of 2.60|$^{+0.12}_{-0.11}$| × 1022 cm−2. The Fe-K α line equivalent width of 100 ± 20 eV is smaller by a couple of factors than the earlier measurement. They showed that for the given power-law index and absorption column density, the torus model of Ikeda, Awaki & Terashima (2009) underestimated the equivalent width of the Fe-K α line for all possible values of the half-opening angle of the torus. Although the reason of such underestimation is not clear, the mismatch could be due to the difference in the line-of-sight column density and the actual circumnuclear matter density that mostly lies out of observer line of sight but may contribute to the line emission. However, considering the complexity of AGN geometry, such relationship requires a detailed study to establish.
In this work, we carry out spectral analysis from Swift/XRT and NuSTAR simultaneous observations of NGC 5273. Hard X-ray light curve in the energy range 3–80 keV is strongly variable and the fractional rms variability decreases at higher energy. Using the best-fitting model, which consists of a power law with a high-energy cut-off, a reflection and a partial covering absorption, we constrain the high-energy cut-off at 143|$^{+96}_{-40}$| keV with the 2σ significance. Combining 344 pointing observations with INTEGRAL spanning over ∼12 yr, the source is detected with ∼3.8σ significances in the shadowgram of INTEGRAL/ISGRI in the energy range 20–100 keV with a total exposure of ∼553 ks and the source shows hard X-ray variability over this time-scale. We find the absorption column density and covering fraction of 2.36|$^{+0.18}_{-0.17}$| × 1022 cm−2 and 0.97|$^{+0.01}_{-0.02}$|, respectively. Data reduction and analysis procedure are provided in Section 2, while results from the spectro-timing analysis are summarized in Section 3 and discussions and conclusions are provided in Section 4.
2 OBSERVATION AND DATA REDUCTION
NGC 5273 was observed by NuSTAR on 2014 July 14 starting at 02:56:07 ut. While the total duration of the observation lasted for ∼39 ksec, the effective, on-source exposure was 21.2 ksec. The NuSTAR data were collected using the two focal plane telescopes (FPMA and FPMB) centred roughly 1 arcmin away from the centre of NGC 5273. Data are reduced using the NuSTAR Data Analysis Software nustardas v1.6.0 included in heasoft v6.19 and the recent (as of 2017 March 05) calibration data base CALDB version 20161207 is used. Event files from both telescopes are filtered and depth corrections are applied using the nupipeline task (version 0.4.5). Circular regions with the radius of 80 arcsec are chosen as source and background regions with the source region circle centred on NGC 5273 while the background region circle is chosen such that its centre is at least 5 arcmin away from the source centre so that background selection is not contaminated by the point spread function (PSF) wing of the source. Energy spectra, light curves in different energy bands, response matrix files (rmf) and auxiliary response files (arf) are extracted using the nuproducts task. While light curves from FPMA and FMPB are combined to increase the signal-to-noise ratio, responses and spectra are not combined to minimize the systematic effects. Instead, they are fitted simultaneously by allowing us to vary cross-normalization factor between two modules.
Swift observed NGC 5273 on 2014 July 14 starting at 03:55:00 ut. Swift/XRT exposure lasted till ∼6.5 ksec. Following the standard procedure of filtering and screening criteria, Swift/XRT data are reduced using the xrtpipeline v. 0.13.2 task. A 40 arcsec circular region is used to extract the source spectrum, and a 40 arcsec circular region, far away from source PSF wing, is used to extract the background spectrum using XSELECT v 2.4d. The xrtmkarf task is used along with the exposure map to generate an auxiliary response using the latest Swift/XRT spectral redistribution matrices for the current observation.
INTEGRAL took 344 pointing observations of NGC 5273 with regular intervals between 2003 and 2014 and we analyse all pointing observations of INTEGRAL/ISGRI in the energy range 20–100 keV. ISGRI, one of two instruments in INTEGRAL/IBIS, has a collecting area of 2600 cm2, is sensitive between 15 and 1000 keV with a maximum effective area between 20 and 100 keV (Ubertini et al. 2003). All archival data are processed and analysed using the INTEGRALoffline science analysis (osa; Courvoisier et al. 2003) package v. 10.2, the Instrument Characteristics v 10.2 and the Reference Catalogue v. 40.0. Following standard procedure, images are created combining all science windows.
3 TIMING ANALYSIS AND RESULTS
The 3–80 keV background-subtracted light curve from NuSTAR is shown in the top panel of Fig. 1, where counts from both FPMA and FPMB are combined and 500 s bin size is used. Light curve in the relatively soft band (3–6 keV), hard band (6–20 keV) and their ratio is shown in the bottom panel of Fig. 1. At all time intervals, relatively harder band has higher count rate than the soft band. A significant variability (of the order of ∼15 per cent) is observed in the hardness ratio (see the bottom panel of Fig. 1), particularly during the second and third time intervals. Therefore, flux variability in soft and hard bands is not similar. In order to clarify this, we plot the hardness intensity diagram (HID). The hardness ratio is defined as (H − S)/(H + S), where H is the background-subtracted hard-band (6–20 keV) count rate and S is the background-subtracted soft-band (3–6 keV) count rate and the intensity is defined as the 3–20 keV count rate. The resulting plot is shown in the left-hand panel of Fig. 2. A positive hardness ratio is observed, which implies that the hard count rate is higher than the soft count rate and a scattering in the hardness ratio around the best-fitting constant (shown by a black horizontal line) may be noted. To test the number of spectral components present in the current energy spectra in a model-independent way, we perform the flux–flux analysis where the hard-band flux (6–20 keV) is plotted against the soft-band flux (3–6 keV) in the right-hand panel of Fig. 2. The plot shows a linear relationship between count rates in two bands. The best fit does not pass through the origin, implying the existence of a separate hard component, but the offset is not large and a fit through the origin is still consistent with the data (change in χ2 is −16 for the change in 1 degree of freedom). This can further be confirmed by the energy spectral analysis.
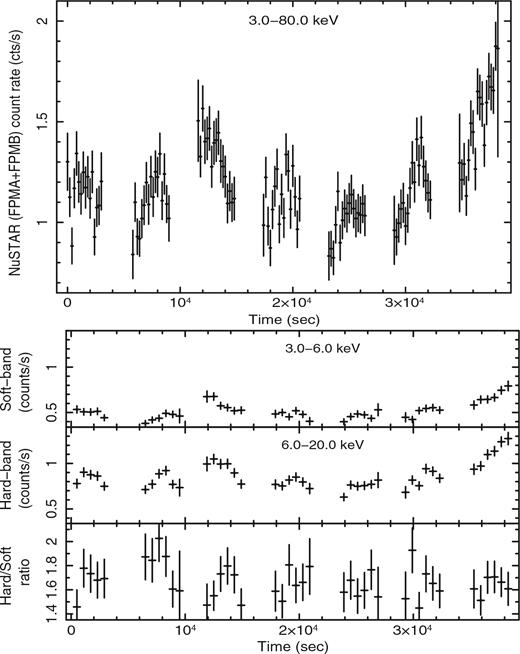
The 3–80 keV background-subtracted light curve from NuSTAR is shown in the top panel where observations from FPMA and FPMB are combined. Bottom panel shows light curves in the soft-band (3–6 keV; top), hard-band (6–20 keV; middle) and the hardness ratio (defined as the ratio of 6–20 keV count rate to that of 3–6 keV; bottom) as a function of time. All light curves and hardness ratio are plotted with 500 s bin size. Variability in both light curve and hardness ratio can be seen.
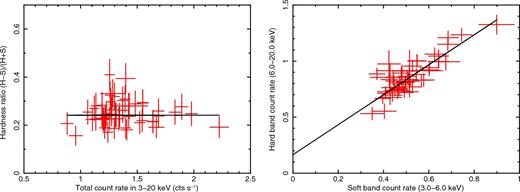
The left-hand panel shows the HID of NGC 5273 using NuSTAR. The hardness ratio is defined as H − S/H + S, where H is the hard-band (6–20 keV) count rate and S is soft-band (3–6 keV) count rate and intensity is defined 3–20 keV count rate. It may be noted that with the change of total count rate, hardness ratio shows some dispersion around best-fitting constant shown by horizontal black line. The right-hand panel shows flux–flux plot where the hard-band count rate (H) is plotted against the soft-band count rate (S). When fitted with a linear function and extrapolated, the fitted line (shown in black) intersects Y-axis (i.e. hard count rate axis) at the origin that implies hard excess even at zero soft-band count rate and the presence of two spectral components.
The top panel in Fig. 3 shows the INTEGRAL/ISGRI image in the field of view of NGC 5273 in the energy range 20–100 keV. The image is constructed by superimposing all 344 pointing with total effective exposure of ∼553 ksec. 0.5 counts s−1 in the image corresponds to a 3σ limit of any source detection. It is clear that the source is detected with at least 3σ significance at the position of NGC 5273 (shown by the black circle where the average count rate is ∼1.56 ± 0.18). For clarity, 20–100 keV INTEGRAL/ISGRI light curve spanning nearly 12 yr is shown in the bottom panel of Fig. 3. In the light curve, the source is clearly detected and a hard X-ray variability over the long term is clearly observable.
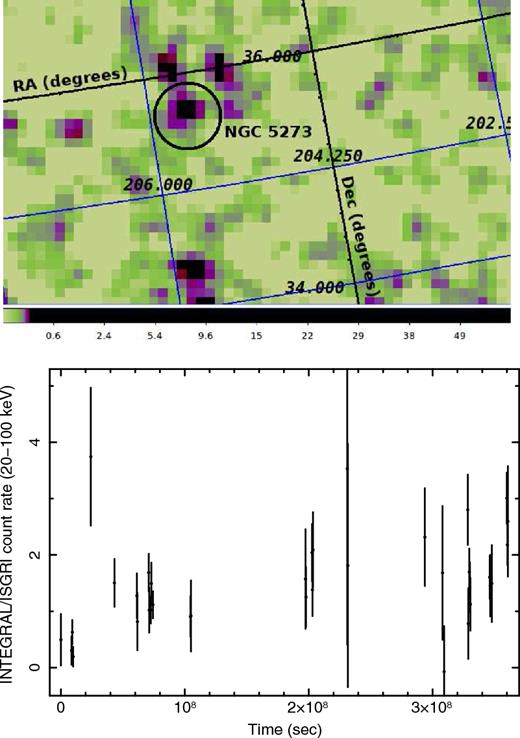
Top panel shows INTEGRAL/ISGRI image at the field of view of NGC 5273 in the energy range 20–100 keV. It is constructed by superimposing all pointing observations (344) of NGC 5273 made by the INTEGRAL covering ∼12 yr. The source is detected (shown by the black circle) at the position of NGC 5273 with 3.8σ significance. Bottom panel shows the 20–100 keV light curve from all pointing observations with INTEGRAL/ISGRI covering ∼12 yr. The light curve bin size is 5 d. Although signal-to-noise ratio is poor, a variability in hard X-rays count rate is observable.
4 SPECTRAL ANALYSIS AND RESULTS
Although there is an indication of variability in the hardness ratio (i.e. spectral variability) and the presence of a second spectral component from the flux–flux plot, the detail time-resolved spectroscopic study is strongly restricted by the poor signal to noise. Hence, we perform energy spectral analysis integrated over the entire observation. NuSTAR (3–79 keV) and Swift/XRT (0.8–7 keV) spectra are jointly fitted. The restrictions in the high- and low-energy end of the spectrum in Swift/XRT are due to poor signal to noise and calibration uncertainties (Pahari et al. 2015). Spectral fittings are performed using xspec v 12.9.0n. All errors that are quoted here correspond to 2σ significances unless mentioned otherwise. For better signal to noise, spectral channels are binned such that there would be at least 60 counts bin−1. While the cross-normalization factor of FPMA is kept fixed at 1, in case of FPMB and Swift/XRT, it is kept free to vary. From the best-fitting model, cross-normalizations of FPMB and Swift/XRT are 1.05 ± 0.02 (∼5 per cent) and 0.85 ± 0.02 (∼15 per cent), respectively. For other sources, the difference in cross-calibration constant between FPMA and FPMB is found in the range 3–7 per cent while the difference between FPMA and Swift/XRT is found in the range 3–20 per cent (Marinucci et al. 2015; Marcotulli et al. 2017), which are consistent with our results. However, we may note that the NuSTAR exposure was ∼39 ksec while the Swift/XRT exposure was ∼7 ksec. Such a difference in exposures may cause the deviation of Swift/XRT cross calibration constant from unity due to the short time-scale X-ray flux variability observed from the source.
We fit the spectra with a power law modified by the Galactic absorption column density of 0.0092 × 1022 cm−2 (Kawamuro et al. 2016). The model provides an unacceptable fit with the photon power-law index of 1.23 ± 0.06 and χ2/dof = 2990/243 (12.3). The data-to-model ratio as a function of energy is shown in the left-hand panel of Fig. 4. The residual spectrum shows a strong negative residual below 2 keV that is mostly due to the underestimation of intrinsic absorption. Residuals are also observed at ∼6.5 keV and at higher energies as well. To take care of the low-energy absorption, we use a partial covering absorption model zpcfabs in xspec. The fitting improves significantly with χ2/dof = 374/241 (1.55). The hydrogen column density and covering fraction are found to be 2.47|$^{+0.19}_{-0.17}$| × 1022 cm−2 and 0.96|$^{+0.02}_{-0.01}$|, respectively. However, residuals at ∼6 keV as well as at high energy (∼ 15–20 keV) still persist. The high-energy residuals show convex curvature at energies ∼20 keV and tails off at higher energies. This indicates the presence of Compton reflection hump along with a high-energy cut-off. To account for the reflection, we use a physically motivated xillver reflection model (Garcia et al. 2013). The latest version (xillver-a-ec5) can calculate angle-resolved reflection spectra for an incident power law with the index as low as 1 and having a cut-off as high as 1000 keV. The addition of the xillver model provides a significant improvement in the fitting with χ2/dof = 300/239 (1.26). While fitting, we tie the incident photon power-law index of xillver model to that with zpowerlw model. We assume the presence of no high-energy cut-off and therefore fixed the cut-off parameter of xillver to 1000 keV. The Fe abundance from the fitting is 1.2 ± 0.3, which is consistent with the solar abundance. We find the ionization parameter is low (0.98|$^{+0.06}_{-0.04}$| erg s cm−1) and consistent with the neutral value. The disc inclination angle of NGC 5273 with respect to the observer line of sight is not known. While fitting, the xillver model prefers low inclination. Fixing this parameter at high inclination (say 65°) results in poor fitting. Therefore, we fix this to 40° since the fit prefers the range of 28°–50°. The preference of low inclination by the spectral model is also consistent with the Seyfert type 1.5 and face-on nature of the host galaxy (Trippe et al. 2010). Left-hand panel of Fig. 4 shows that beyond 40 keV, the data-to-model ratio drops rapidly and significantly close to zero. Such a high-energy roll-over in the ratio spectra strongly indicates the presence of high-energy cut-off. Therefore, we replace the simple zpowerlw model with a cut-off power law (cutoffpl model in xspec) that is a power law along with the high-energy cut-off as a parameter. While fitting, this parameter is kept free to vary and the high-energy cut-off parameter from xillver model is tied to it. This provides the best-fitting model with χ2/dof = 264/238 (1.11). The cut-off energy is well constrained at 143|$^{+96}_{-40}$| keV. In order to check whether a redshifted cold absorption model can describe the low-energy spectra as good as zpcfabs, we replace the zpcfabs with ztbabs model. The best-fitting absorption column density is found to be 2.31|$^{+0.22}_{-0.19}$| × 1022 cm−2 with χ2/dof = 295/239 (1.23). An F test between spectral fitting with partially covering absorption model and the simple cold absorption model favours the partial covering absorption model with the F-test probability of 2.82 × 10⁻⁷, which is at least 3σ significant. Additionally, we do not find any change in the photon index of the primary continuum while switching from the partial covering absorption model zpcfabs to a simple cold absorption model ztbabs. Therefore, the steeper power-law photon index obtained from the present analysis compared to that found with XMM–Newton observation (Cappi et al. 2006) is either a more accurate measurement of the photon index due to the inclusion of hard X-ray spectra up to 70 keV or due to the change in the nature of X-ray emitting corona. The spectrum along with the best-fitting model, its components and the residuals are shown in the right-hand panel of Fig. 4. Best-fitting parameters along with 2σ error bars and X-ray fluxes in different energy bands are provided in Table 1. From Table 1, we note that X-ray flux increases up to 50 keV and then it drops significantly beyond 100 keV.
![Left-hand panel shows the data-to-model ratio of NGC 5273 as a function of energy when Swift/XRT (red circles), NuSTAR/FPMA (black squares) and NuSTAR/FPMB (grey triangles) spectra are fitted jointly with a redshifted power law (zpowerlw in xspec) modified by the Galactic absorption. The fitted power-law index is 1.23 ± 0.06. Cross-calibration constants are used among different instruments. A strong absorption below 2 keV, an Fe emission line at ∼6.5 keV and a high-energy roll-over above 30 keV are clearly visible in the data-to-model ratio plot. The right-hand panel shows the spectra fitted with the best-fitting model tbabs × zpcfabs × const × [cutoffpl+xillver] along with model components and residuals.](https://oup.silverchair-cdn.com/oup/backfile/Content_public/Journal/mnras/470/3/10.1093_mnras_stx1455/3/m_stx1455fig4.jpeg?Expires=1750715540&Signature=WDyPm-lFYSLDSNI4F~Qu8iY99506IuaA2588sOflXBIOso05QecIfAKHb2H~E~YGoKNHJLK2A8aCeEP2ruLobH9Uibe-yrfKHC32Clxu0pBArd5a7vHpAsQz2yV2jQabA1hgH2UozuUDeOPMyuZe~-zYsnzJuxv6OBE5il6W1Q~5J784UvYQgMepS9uTEIypaf~WzQ6EXEuVjQZluhyvy5tVV8ru5Xqs1bADB556euvbUmemyt8fwt5M0lv3hPHti5GiSfV~s9aXjhevSVYvLOnu1-YUKA5um6sDRBZikMukPTj56Y8NkicgWrc39tcxA~bJtHPfEPMvAePJcd~xog__&Key-Pair-Id=APKAIE5G5CRDK6RD3PGA)
Left-hand panel shows the data-to-model ratio of NGC 5273 as a function of energy when Swift/XRT (red circles), NuSTAR/FPMA (black squares) and NuSTAR/FPMB (grey triangles) spectra are fitted jointly with a redshifted power law (zpowerlw in xspec) modified by the Galactic absorption. The fitted power-law index is 1.23 ± 0.06. Cross-calibration constants are used among different instruments. A strong absorption below 2 keV, an Fe emission line at ∼6.5 keV and a high-energy roll-over above 30 keV are clearly visible in the data-to-model ratio plot. The right-hand panel shows the spectra fitted with the best-fitting model tbabs × zpcfabs × const × [cutoffpl+xillver] along with model components and residuals.
Best-fitting model parameters from the simultaneous fitting of Swift/XRT and NuSTAR energy spectra using the model tbabs × zpcfabs × const × [cutoffpl+xillver]. 2σ errors are quoted. N|$_{\text{H},\rm tbabs}$| is the Galactic absorption column density, N|$_{\text{H},\rm zpcfabs}$| and f|$_{\text{c},\rm zpcfabs}$| are the absorption column density and covering fraction due to the zpcfabs model. Γcutoffpl and Ecutoff are the photon power-law index and the high-energy cut-off due to the cutoffpl model. Γxillver and E|$_{\text{cut}\rm xillver}$| are the photon power-law index due to the primary emission and the cut-off energy in the xillver model. AFe is the iron abundance with respect to the solar abundance, ξ, xillver is the ionization parameter and i is the disc inclination angle. Ftotal, Fcutoffpl and Fxillver are the total flux, the flux due to cutoffpl and xillver models, respectively, in the energy range 0.1–100 keV. F0.1–2.0, F2.0–10.0, F10.0–20.0, F20.0–50.0, F50.0–100.0 and F100.0–150.0 are fluxes in the energy range 0.3–3, 3–6, 6–20, 20–50, 50–100 and 100–150 keV, respectively.
| Spectral parameters | Fitted values |
|---|---|
| N|$_{\text{H},\rm tbabs}$| [1022 cm−2] | 0.0092 (f) |
| N|$_{\text{H},\rm zpcfabs}$| [1022 cm−2] | 2.47|$^{+0.19}_{-0.17}$| |
| f|$_{\text{c},\rm zpcfabs}$| | 0.96|$^{+0.02}_{-0.01}$| |
| Γcutoffpl | 1.81|$^{+0.02}_{-0.03}$| |
| Ecutoff [keV] | 143|$^{+96}_{-40}$| |
| Γxillver | =Γcutoffpl |
| AFe | 1.2 ± 0.3 |
| logξ, xillver [erg s cm−1] | 0.98|$^{+0.06}_{-0.04}$| |
| E|$_{\text{cut},\rm xillver}$| [keV] | =Ecut-off |
| i [degrees] | 40° (f) |
| Ftotal [10−11 erg s−1 cm−2] | 6.49|$^{+0.11}_{-0.07}$| |
| Fcutoffpl [10−11 erg s−1 cm−2] | 4.84|$^{+0.06}_{-0.04}$| |
| Fxillver [10−11 erg s−1 cm−2] | 1.65|$^{+0.03}_{-0.04}$| |
| F0.5–2 [10−11 erg s−1 cm−2] | 0.11|$^{+0.03}_{-0.02}$| |
| F2–10 [10−11 erg s−1 cm−2] | 1.76|$^{+0.03}_{-0.02}$| |
| F10–20 [10−11 erg s−1 cm−2] | 1.33|$^{+0.04}_{-0.05}$| |
| F20–50 [10−11 erg s−1 cm−2] | 1.95|$^{+0.04}_{-0.03}$| |
| F50–100 [10−11 erg s−1 cm−2] | 1.36|$^{+0.03}_{-0.03}$| |
| F100–150 [10−11 erg s−1 cm−2] | 0.43|$^{+0.02}_{-0.03}$| |
| χ2/dof | 264/238 |
To check whether fitted parameters are independently constrained and non-degenerate, we produce contour plots among different spectral parameters at 68, 95 and 99 per cent confidence levels and they are shown in Fig. 5. Top-left panel of Fig. 5 shows that the covering fraction of the absorber as predicted by the zpcfabs model is well constrained between 95.5 and 98.5 per cent with respect to the variation of cut-off power-law normalization. Similarly, the absorption column density of partial covering is also well constrained within the range (2.1–2.6) × 1022 cm−2 with respect to the cut-off power-law normalization that is shown in the top-right panel of Fig. 5. Therefore, if we assume that zpcfabs truly describes the absorption that dominates the low-energy part of the spectrum, then the column density is moderate to low but the absorbing cloud may have large spatial extension so that it nearly blocks the entire line of sight of the observer, therefore strongly reducing low-energy/soft X-ray flux below 2 keV.
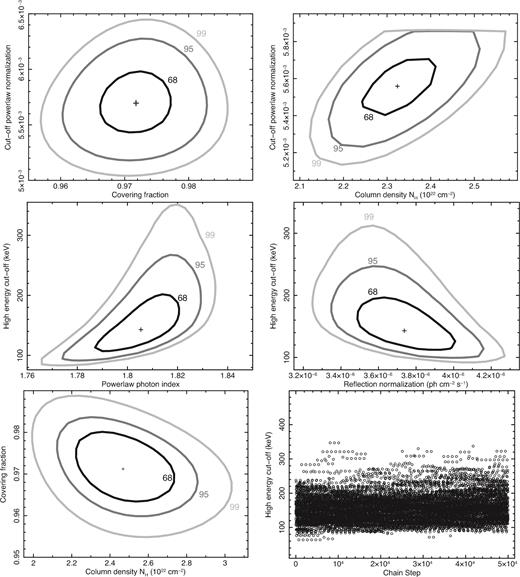
Using best-fitting spectra, correlations among different spectral parameters are explored. In all panels (except bottom right), 68, 95 and 99 per cent confidence contours are shown in black, dark grey and light grey, respectively. Top-left panel shows cut-off power-law flux and covering fraction (between 96 and 98 per cent) are well constrained and non-degenerate while top-right panel shows absorption column density is observed within the expected range of (2.1–2.6) × 1022 cm−2. Central-left panel shows that high-energy cut-off is well constrained between 90 and 220 keV within 2σ limit while photon power-law index is high but constrained (1.76–1.84). Central-right panel shows that reflection component is well constrained and non-degenerate with respect to the high-energy cut-off. Bottom-left panel shows the covering fraction and absorption column density are well constrained. Bottom-right panel shows the high-energy cut-off as a function of chain steps as observed from the MCMC simulations. It is well constrained between 100 and 200 keV.
Central-left panel of Fig. 5 shows the correlation between the power-law index and high-energy cut-off. Due to the simplicity of the spectrum and the remarkable capabilities of NuSTAR in constraining the cut-off beyond the energy range of its regular operation, the cut-off energy in NGC 5273 can be constrained in the range 90–350 keV within the 3σ limit. It may be noted that even higher energy cut-off was constrained previously using NuSTAR spectra for NGC 5506 and IC 4329A at the 3σ lower limit of 350 and 170 keV, respectively. Within 3σ limit, the photon power-law index is found in the range 1.76–1.84, which is steeper compared to earlier measurements using spectra that cover only up to 10 keV. Using XMM–Newton spectra, Cappi et al. (2006) reported the power-law index of 1.4 ± 0.1 while using Suzaku/XIS spectra of NGC 5273 in 2013, Kawamuro et al. (2016) found the power-law index of 1.57|$^{+0.07}_{-0.06}$|, which is steeper than the XMM–Newton measurement. However, in fig. 5, Kawamuro et al. (2016) used the power-law index in the range ∼1.35–1.79. The lack of reliable high-energy spectra beyond 10 keV could be a possible reason for such relatively flatter power-law index and can be fixed with NuSTAR spectra. However, it may also be noted that the source shows both flux variability and a hint of spectral variability during the NuSTAR observation. Therefore, the change in the power-law index can be intrinsic to the source owing to the change in the optical depth of the corona. With the variation of the cut-off energy, the normalization of the reflection component is also found to be well constrained and shown in the central-right panel of Fig. 5. Because of the narrow iron emission line and the ionization parameter being consistent with the neutral value, the reflection may take place in the outer disc, and the reflection model prefers a low inclination (< 50°). In the presence of Compton-thick, strong absorber (e.g. NGC 5643, NGC 4941, NGC 4102, etc., where measured column density is > 1023 cm−2; Kawamuro et al. 2016), a high inclination angle with respect to the plane of the accretion disc is naturally preferred to explain the strongly absorbed soft X-ray spectra. In case of NGC 5273, three independent observations using XMM–Newton [(0.9 ± 0.1) × 1022 cm−2; Cappi et al. 2006, Suzaku (2.60|$^{+0.12}_{-0.11}$| × 1022 cm−2; Kawamuro et al. 2016) and Swift/XRT+NuSTAR (2.36|$^{+0.18}_{-0.17}$| × 1022 cm−2) at three different epochs confirm the presence of a Compton-thin absorber along the line of sight in NGC 5273. The bottom-left panel of Fig. 5 shows that the covering fraction and the absorption column density are well constrained.
To measure the coronal parameters, we replace cutoffpl model with a thermal Comptonization model comptt assuming that the primary power-law spectrum is due to the Comptonization of soft seed photons. For simplicity, parameters of xillver reflection model, obtained from the best-fitting using cutoffpl, are kept fixed except the normalization. Alternatively using the slab as well as the spherical geometry of the corona, which is a parameter of the comptt model, the temperature and the optical depth of the Comptonizing electron cloud are found to be 57|$^{+18}_{-11}$| and 0.66|$^{+0.27}_{-0.14}$| keV, respectively. Therefore, the electron temperature of the Comptonizing electron from the comptt model is consistent with the range of theoretically predicted high-energy cut-off (Lightman & Zdziarski 1987) that we obtain from the cutoffpl model fitting.
4.1 rms variability study
We compute the intrinsic fractional rms variability over the measurement noise at different energy bin as this technique is proven to be useful to study the true intrinsic variability of the source as well as to probe possible existence of variable components in the spectra (Vaughan et al. 2003; Markowitz & Edelson 2004; Lobban et al. 2016; Mallick et al. 2016, 2017). Following Rodriǵuez-Pascual et al. (1997) and Vaughan et al. (2003), fractional rms variability amplitude Fvar is defined as |$\sqrt{(V^2 - \langle \sigma _x^2\rangle )/\langle x_m\rangle ^2}$|. Here V2 is the variance of the light curve at a given energy, |$\langle \sigma _x^2\rangle$| is the mean of the square of errors of counts on each time bin and 〈xm〉2 is the square of the mean counts of the entire time series. The errors on Fvar are computed following equation B2 provided in appendix B in Vaughan et al. (2003). The rms spectrum of NGC 5273 is shown with 1σ error bars in the left-hand panel of Fig. 6. In the case of reflection-dominated spectra, the fractional rms variability usually decreases with the increase in photon energies as seen from few other Seyfert galaxies, e.g. IC 4329A (Brennman et al. 2014) and MCG 6-30-15 (Ponti et al. 2004). Due to large error bars, the decreasing trend is not significant and the rms spectrum can be fitted using a constant model that is shown by the horizontal line. However, from 19 to 50 keV, a decrease in the fractional rms is observed from ∼17 to ∼12 per cent, which is significant compared to the best-fitting constant line. To check whether such a decrease in Fvar is real, we plot the background-subtracted, FPMA and FPMB combined light curves in the energy range 5–6 keV (black) and 19–50 keV (red), respectively, in the right-hand panel of Fig. 6. From the visual inspection of both light curves, it is clear that the 5–6 keV light curve shows larger variability compared to the 19–50 keV light curve, particularly during the first, second, third and last time intervals. From the left-hand panel of Fig. 6, a slight increase in Fvar is also observed in the energy range 10–20 keV although it is not highly significant considering the error bars. With the increase in energy, such increasing trends/bump-like structure in the fractional variability by a few per cent is observed previously from MCG 6-30-15, NGC 7469, 3C 390.3 and 3C 120 in the similar energy range (Markowitz, Edelson & Vaughan 2003). However, a significant drop in Fvar above 20 keV is prominent, which may be caused by the existence of a high-energy cut-off, or at the high energy we have more contribution from the reflected component, which will be less variable compared to the power-law component and effectively reduce the high-energy variability.
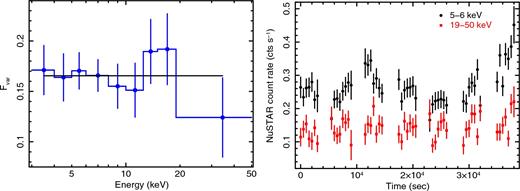
Left-hand panel shows the fractional rms variability amplitude (Fvar) as a function of photon energies, computed using background-subtracted, combined FPMA and FPMB light curves. When fitted with a constant (shown by a black line), the Fvar in 19–50 keV energy range shows a significant decrease and then the best fit. To justify this, we compare light curves in the 5–6 keV (black circle) and 19–50 keV (red square) energy bands in the right-hand panel. During first three and last time intervals, the larger dispersion in 5–6 keV count rate is clearly observed compared to that observed from the 19–50 keV light curve.
Although there is a drop in the fractional rms at higher energy, the variability is still of the order of 10–12 per cent in 19–50 keV band with ∼39 ksec exposure. A variability in 20–100 keV is also visible from the INTEGRAL/ISGRI light curve shown in the bottom panel of Fig. 3. Taking into consideration the latest INTEGRAL/IBIS survey (Bird et al. 2016) and rescaling the flux of a close detected AGN, the 2σ upper limit of 20–100 keV flux for NGC 5273 is 8.7 × 10⁻¹² erg s−1 cm−2. With NuSTAR, we obtain a higher flux (2σ lower limit) of 3.31 × 10⁻¹¹ erg s−1 cm−2 in 20–100 keV. Therefore, such a difference in hard X-ray flux measurement by INTEGRAL and NuSTAR may be caused by the variability in the hard X-ray emission of the source.
5 DISCUSSION AND CONCLUSIONS
We present the NuSTAR and Swift/XRT joint analysis of observations in the energy range 0.8–75 keV of a low-mass, Seyfert 1.5 galaxy NGC 5273. The hardness ratio (H − S/H + S; H: 6–20 keV count rate and S: 3–6 keV count rate) as a function of total flux (3–20 keV count rate) is relatively flat that is often seen from Seyfert galaxies at hard-band dominated, high flux level (Lamer et al. 2003; Connolly, McHardy & Dwelly 2014). The plot of hard-band (6–20 keV) flux as a function of soft-band (3–6 keV) flux shows a hard offset that can be interpreted as the presence of a second spectral component in the hard band (Taylor, Uttley & McHardy 2003). The Seyfert classification of NGC 5273 as 1.5 is also consistent with our X-ray spectral analysis where the reflection model prefers the inclination angle between 28° and 50° with respect to the disc normal. The model preferred inclination angle is also consistent with two facts: (1) a low-to-moderate absorption column density obtained from our joint X-ray spectral analysis and previous reports and (2) large and variable equivalent width of iron emission line observed in different epochs with XMM–Newton and NuSTAR compared to what is predicted by the Torus model from Ikeda et al. (2009). These two facts imply that there may exist a large reservoir of cold absorption material that is not intercepted by the observer’s line of sight and responsible for a large equivalent width of iron emission line. A similar scenario was also proposed by Trippe et al. (2010), using the optical data.
From the energy spectral analysis, we find a moderate-to-low absorption column density that is consistent with earlier measurements using XMM–Newton and Suzaku and we also obtain a reasonably high covering fraction 95–98 per cent within the 3σ limit. Although we have used partial covering absorption model, the soft X-ray emission from intermediate and type 2 Seyfert galaxies is dominated by the scattered emission from the photoionized medium (see e.g. Turner et al. 1997; Awaki et al. 2000, 2008). In NGC 5273, the scattering fraction is ∼5–9 per cent (Kawamuro et al. 2016), which is an order of magnitude higher than that observed from other Seyferts such as NGC 2273 (Awaki et al. 2009), IRAS 18325−5926 and a factor of 6–7 higher than that in Mrk 3 (Awaki et al. 2008).
In the current analysis of NuSTAR spectra observed in 2014, when we replace xillver with a zgauss model at ∼6.4 keV, we obtain equivalent width of the Fe emission line to be 103 ± 23 eV, which is consistent with the Suzaku measurement performed with data taken in 2013. Therefore, on a short time-scale, the Fe line flux does not change which is consistent with earlier studies (McHardy, Papadakis & Uttley 1999). However, from the spectral modelling of XMM–Newton and Suzaku observations taken with a gap of 11 yr (2002 and 2013, respectively), the equivalent width of the Fe-K α line is found to be ∼230 and ∼90 eV, respectively, which imply that on long time-scale, Fe emission-line flux may change and therefore, the geometry/position of the Fe-line emitting region changes during both epochs of observations. The origin of the narrow Fe-K α line could be the reprocessing of coronal X-ray photons from the inner part of the circumnuclear matter or the outer accretion disc while the change in the equivalent width of Fe emission line is possibly due the change in underlying continuum flux while the reprocessed flux remains unchanged. Comparing the hard X-ray (2–10 keV) flux between the XMM–Newton observation from Cappi et al. (2006) and the present NuSTAR observation, we find that the NuSTAR flux is nearly two to three times higher than the XMM–Newton flux. As a consequence, we find the low equivalent width of the Fe emission line with the NuSTAR spectrum compared to that of the XMM–Newton spectrum. Therefore, our best-fitting spectral model along with the detection of narrow Fe line and its low equivalent width are consistent with the primary emission from an intrinsically and moderately variable hot corona and a constant reflected emission from the outer disc, the circumnuclear matter or both.
As shown by Kawamuro et al. (2016), the torus model of Ikeda et al. (2009) largely underestimates the equivalent width of the Fe-K α line compared to what we observe with XMM–Newton, Suzaku and the current analysis using NuSTAR for all values of the torus half-opening angle. The reason for underprediction is the assumption that the column density of the cloud along the observer’s line of sight (NH) is equal to the equivalent column density of the circumnuclear matter that is responsible for the narrow Fe emission line. However, because of the Compton-thin nature of the source, this assumption may not be valid in the case of an inclination very close to or higher than the half-opening angle of the torus with respect to the disc plane. The moderate/low absorption column density as well as the Seyfert classification of the source implies that the observer’s line of sight may pass through the outer skin of the torus so that the line-of-sight column density could actually be different (which could be low) than the actual circumnuclear matter density (may be higher) that is responsible for the narrow Fe emission line and is not overlapped by our line of sight. Because of this difference, the observed equivalent width of the narrow Fe-K α line is higher than the model-predicted value if we assume that the location of the circumnuclear matter is the reprocessing site. Using optical data, Trippe et al. (2010) also found a similar scenario where the observed column density may arise from dust-free warm absorber while the actual column density, derived from cold absorption, is significantly higher than the line-of-sight column density. Therefore, in such a complicated scenario, the applicability of the torus model by Ikeda et al. (2009) is not clearly understood. In an alternate scenario, the equivalent width of the narrow Fe emission line can vary between few eV to a few keV, depending on how strongly the primary continuum is absorbed.
Since the mass of NGC 5273 is well known [(4.7 ± 1.6) × 106 M⊙] from the reverberation mapping, the Eddington luminosity is (5.9 ± 0.2) × 1044 erg s−1. Using the Suzaku and Swift/BAT flux in 2–10 keV, Kawamuro et al. (2016) found the Eddington ratio of 0.0032 assuming the bolometric ratio of 10. Using similar procedure with 2–10 keV NuSTAR flux, we find the Eddington luminosity fraction of 0.0093. Using our analysis, Lbol/LEdd is found to be ∼ 0.9–1.1 per cent. Therefore, such a low Eddington ratio < 10−2 implies that the source can be categorized as an LLAGN. In LLAGN, the coronal electron temperature is usually expected to be high due to the inefficient cooling of the corona caused by the low supply of the seed UV/soft X-ray photons (Bottcher 2001; Xie et al. 2010; Yuan & Narayan 2014). Therefore, the cut-off energy is thought to be high. Despite the low Eddington fraction, this does not hold true for NGC 5273 as presented here. Using the broad-band spectral modelling, we constrain the high-energy cut-off at 143|$^{+96}_{-40}$| keV with the 2σ significance. We also perform the Markov Chain Monte Carlo (MCMC) simulation with 105 trials that also constrain the cut-off energy between 110 and 250 keV that is shown in the bottom-right panel of Fig. 5. Our study indicates that LLAGN can have moderate-to-low cut-off energy. Surprisingly, two other sources show low cut-off energy despite of the low accretion rate. Using joint Suzaku/NuSTAR broad-band spectral analysis of the broad-line radio galaxy 3C 390.3, Lohfink et al. (2015) detected a high-energy cut-off at 117|$^{+18}_{-14}$| keV when the source accretes at ∼1 per cent of Eddington luminosity. They obtained the photon power-law index of 1.71|$^{+0.1}_{-0.1}$| and the coronal electron temperature of 30|$^{+32}_{-8}$| keV. These parameters that describe coronal properties of 3C 390.3 are qualitatively similar to that obtained from the energy spectral analysis of NGC 5273 presented here. However, it may be noted that the core of NGC 5273 is not detected in radio with the European VLBI Network at 1.6 and 5 GHz above the threshold of few hundreds of μJy (Panessa & Giroletti 2010). Therefore, the coronal properties of a radio galaxy and a radio-silent AGN could be very similar. Exploring the connection between the radio emission and coronal properties in AGN is beyond the scope of this work. Using the NuSTAR and Swift/XRT simultaneous observations of the radio-quiet galaxy MCG-5-23-16, Zoghbi et al. (2017) found the cut-off energy in the range 107–152 keV and showed that the cut-off energy increases with the increase in the hard X-ray flux. Although the source is obscured, MCG-5-23-16 is accreting at ∼2–3 per cent of Eddington mass accretion rate (assuming 2–10 keV unabsorbed X-ray flux of ∼3–8 × 10⁻¹¹ erg cm−2 s−1 Zoghbi et al. 2014, the black hole mass of ∼3 × 10⁷ M⊙ Wandel & Mushotzky 1986 and the redshift of 0.0085 Wandel & Mushotzky 1986). The photon power-law index varies in the range 1.78–1.85. These values are qualitatively similar to that obtained from NGC 5273. Zoghbi et al. (2017) argued that due to very small compactness ratio between the corona and the seed photon source, the coronal plasma is possibly dominated by electrons, rather than electron–positron pairs. As a consequence, the coronal cooling efficiency increases while coronal heating rate remains same. A similar explanation can be applied to the case of NGC 5273, where the low/moderate cut-off is observed at the low Eddington fraction. Not only LLAGN, but high-luminosity AGN also shows a low-energy cut-off. Low-energy cut-off is expected since the adequate supply of seed photons cools the corona efficiently. For example, low cut-off energy ∼108 keV is observed from SWIFT J2127.4+5654, which accretes 18–22 per cent of Eddington luminosity (Marinucci et al. 2014). Very low energy cut-off (< 50 keV) is also detected from Mrk 335 (Keek & Ballantyne 2016), which accretes at very high Eddington fraction (> 20 per cent). Therefore, a broad diversity exists between the coronal intrinsic luminosity and the cut-off energy, the origin of which is yet to understand clearly.
More observations with missions like AstroSat where simultaneous observations using three different instruments (SXT, LAXPC and CZTI) in 0.2–150 keV energy range (Singh et al. 2014; Vadawale et al. 2016; Yadav et al. 2016) would be extremely useful to find narrower constraints on the high-energy cut-off as well as the low-energy absorption properties.
Acknowledgements
We thank the referee for constructive comments and suggestions. We are thankful to NuSTAR team for making data publicly available. This research has made use of the NuSTAR Data Analysis Software (NuSTARDAS) jointly developed by the ASI Science Data Center (ASDC, Italy) and the California Institute of Technology (USA). INTEGRAL/ISGRI and Swift/XRT data obtained through the High Energy Astrophysics Science Archive Research Center online service were provided by the NASA/Goddard Space Flight Center.
