


Abstract
The study of dust, the most abundant material in cometary nuclei, is pivotal in understanding the original materials forming the Solar system. Measuring the coma phase function provides a tool to investigate the nature of cometary dust. Rosetta/OSIRIS sampled the coma phase function of comet 67P/Churyumov–Gerasimenko, covering a large phase angle range in a small amount of time. Twelve series were acquired in the period from 2015 March to 2016 February for this scientific purpose. These data allowed, after stray light removal, measuring the phase function shape, its reddening, and phase reddening while varying heliocentric and nucleocentric distances. Despite small dissimilarities within different series, we found a constant overall shape. The reflectance has a u-shape with minimum at intermediate phase angles, reaching similar values at the smallest and largest phase angle sampled. The comparison with cometary phase functions in literature indicates OSIRIS curves being consistent with the ones found in many other single comets. The dust has a negligible phase reddening at α < 90°, indicating a coma dominated by single scattering. We measured a reddening of [11–14] %/100 nm between 376 and 744 nm. No trend with heliocentric or nucleocentric distance was found, indicating the coma doesn’t change its spectrum with time. These results are consistent with single coma grains and close-nucleus coma photometric results. Comparison with nucleus photometry indicates a different backscattering phase function shape and similar reddening values only at α < 30°. At larger phase angles, the nucleus becomes significantly redder than the coma.
1 INTRODUCTION
Dust is one of the major components, together with ices of various nature, in cometary nuclei. The dust-to-ice ratio in comet 9P/Tempel 1 nucleus was found to be larger than one using OSIRIS/Rosetta data of the NASA Deep Impact event (Küppers et al. 2005). Recent results from the Rosetta mission showed that the dust-to-water mass ratio in comet 67P/Churyumov–Gerasimenko (67P) coma ranges from 6 to 100 along its orbit (Fulle et al. 2016, and references therein). A recent proposed model of comets formation requires a dust-to-ice ratio from three to nine to explain the observed bulk properties of cometary nuclei (Lorek et al. 2016). All this evidence suggests that non-volatile dust is the most abundant material in cometary nuclei. Its study is therefore pivotal in understanding the nature of the material that formed these primitive relics of the Solar system formation.
Among the remote-sensing studies of cometary dust, the measurement of the phase function curve, i.e. a parameter proportional to the measured intensity against the phase angle of observation, α, has a key importance in investigating the intimate nature of cometary dust. As a matter of fact, the phase function shape depends on the size, size distribution, shape, and composition of dust particles plus on their abundance along the line of sight. Solving the inverse scattering problem provided a tool, extensively used in literature, to probe how the dust particles released from comets are made. For a recent review of the scattering modelling results, we address the reader to Kimura et al. (2016).
The majority of comets studied so far were observed from Earth through ground-based observations while few data are available from space. It has to be underlined that all data are anyway affected by a two-fold problem. First, a single object is rarely seen with different observing geometries covering a large range of phase angles. Moreover, observations at large phase angles are available only for few comets passing close to the Sun (e.g Gehrz & Ney 1992; Grynko, Jockers & Schwenn 2004). Secondly, in order to correlate measurements taken at different times, the assumption that the emitted dust maintains the same scattering properties over time (i.e. the same intimate nature) has to be done. These problems affect the retrieval of a proper dust phase function from a single object covering a large range in phase angles within a short time period. Also when the usual approach of combining measurements from different objects in order to obtain an average behaviour of cometary dust is made, the assumption that the nature of dust cannot be very different in time and among comets plays a primary role in the subsequent analysis.
With the Rosetta mission and the OSIRIS camera system (Keller et al. 2007), we had the unprecedent opportunity to study the scattering properties of the dust from within a cometary coma. Moreover, with the adopted observing geometry, we were able to sample the coma using different observations geometries covering a large phase angles range (≥140°) within typically 2.5 h. This implied reducing to the minimum the uncertainty introduced by the assumption of observing always the same dust at different times.
Twelve OSIRIS multiwavelength series were acquired between 2015 March and 2016 February to study the properties of the intensity of light scattered by the coma dust against the phase angle of the observations. The results of our analysis in terms of phase function shape and its comparison with space- and ground-based observations of comets, reddening, and phase reddening, versus time, heliocentric and nucleocentric distance are presented in the following sections. Moreover, a comparison with results coming from Rosetta/VIRTIS data of the inner coma close to the nucleus and OSIRIS data of the nucleus itself is performed in order to deepen our understanding of the coma behaviour and its relationship with the nucleus.
2 OBSERVATIONS
Twelve OSIRIS series were acquired between 2015 March 29 (heliocentric distance, rh = 1.98 AU inbound) to 2016 February 18 (rh = 2.39 AU outbound) in order to measure the scattering phase function of the dust coma with multiwavelength observations. We obtained several Narrow Angle Camera (NAC) and Wide Angle Camera (WAC) observations. For a more detailed description of the two cameras we address the reader to Keller et al. (2007). The observations were carried out in most cases with the NAC and the WAC simultaneously. In 2015 November, a new operational mode of the WAC shutter was introduced, the so-called ‘ballistic mode’, following a technical failure of the shutter itself. This mode allowed exposures of about 150 ms. On-chip stacking of exposures was therefore used to increase the total exposure of the images and improve the signal-to-noise ratio (S/N). Overall, WAC images were taken using the narrow-band UV375 F13 (peak transmission wavelength at 375.6 nm), Vis610 F18 (612.6 nm) and the broad-band Green F21 (537.2 nm) filters. NAC images were obtained using the broad-band Blue F24 (480.7 nm), Orange F22 (649.2 nm) and Red F28 (743.7 nm) filters. Anyway, after the on-chip stacking the S/N in the WAC UV F13 filter was too low to be significant. This filter was therefore discharged from the observational pipeline after 2015 November. The WAC narrow-band filters are designed to sample the continuum of the coma spectrum where no gaseous emission lines are expected. We assumed that the gaseous emissions in the broad-band filters essentially contribute very little to the total integrated signal. All the measurements presented in the following refer therefore to the solar light scattered by dust particles in the coma. Our observational strategy fulfilled optimization criteria in order to obtain best quality data in terms of phase angle coverage and S/N.
The log of all the observations is given in Table 1.
Image series dedicated to the coma dust phase function measurement. MTP, STP, rh, rc, tstart and texp stand for medium term planning (duration 1 month), short term planning (duration 1 week) from the Rosetta hibernation exit on 2014 January 20, heliocentric distance, nucleocentric distance, time of exposure start and exposure duration, respectively.
| Series (MTP/STP) | Date | Filters | rh (AU) | rc (km) | tstart (UT) | texp (s) |
|---|---|---|---|---|---|---|
| 014/049 | 29/03/2015 | WAC F13, F18, F21 | 1.98 | 56–70 | 02:28:05 | 45, 0.45, 0.08 |
| 018/063 | 07/07/2015 | WAC F13, F18, F21 | 1.32 | 153 | 19:55:02 | 127, 1.27, 0.8 |
| NAC F24, F22, F28 | 73, 7, 40 | |||||
| 019/070 | 20/08/2015 | WAC F13, F18, F21 | 1.24 | 320 | 12:57:38 | 127, 1.27, 0.8 |
| NAC F24, F22, F28 | 73, 7, 40 | |||||
| 020/071 | 28/08/2015 | WAC F13, F18, F21 | 1.25 | 420 | 19:10:04 | 127, 1.27, 0.8 |
| NAC F24, F22, F28 | 73, 7, 40 | |||||
| 021/075 | 28/09/2015 | WAC F13, F18, F21 | 1.37 | 1200 | 13:44:00 | 127, 1.27, 0.8 |
| NAC F24, F22, F28 | 73, 7, 40 | |||||
| 022/081 | 06/11/2015 | NAC F24, F22, F28 | 1.60 | 240 | 19:08:38 | 146, 14, 80 |
| 023/083 | 19/11/2015 | WAC F21 | 1.69 | 125 | 12:30:05 | 0.8 |
| NAC F24, F22, F28 | 146, 14, 80 | |||||
| 023/086 | 14/12/2015 | WAC F18 | 1.88 | 100 | 18:05:59 | 1.27 |
| NAC F24, F22, F28 | 73, 22, 40 | |||||
| 023/086 | 14/12/2015 | WAC F18, F21 | 1.88 | 100 | 18:17:34 | 1.27, 0.8 |
| NAC F24, F22, F28 | 73, 22, 40 | |||||
| 024/090 | 07/01/2016 | WAC F18, F21 | 2.07 | 75 | 12:31:44 | 1.27, 0.8 |
| NAC F24, F22, F28 | 146, 14, 80 | |||||
| 025/092 | 21/01/2016 | WAC F18, F21 | 2.18 | 80 | 12:30:03 | 0.5, 0.5 |
| NAC F24, F22, F28 | 146, 14, 80 | |||||
| 026/096 | 18/02/2016 | WAC F18, F21 | 2.39 | 35 | 12:26:27 | 0.75, 0.45 |
| NAC 24, F22, F28 | 146, 14, 80 |
2.1 Observational geometry
All dust phase function series were acquired in a similar way. The comet–s/c distance and the phase angle Sun–comet–spacecraft (i.e. the nucleus elongation) remained almost constant throughout the observations within one single series. Once such geometry was fixed, the pointing stations were obtained scanning the coma in the plane perpendicular to the plane containing the Sun, the comet and Rosetta. An example of the observational geometry is sketched in Fig. 1. This resulted in scanning the phase angles Sun–dust–spacecraft between 0° and 160°. Pointing at α < 15° (solar elongation >165°) was possible only when Rosetta was beyond 2.21 AU from the Sun (after 2016 February). The operational constrain was set to avoid an overheating of the s/c at small heliocentric distances due to the hole where Rosetta was mounted on the launch rocket. During the analysis, we found an unexpected stray light contribution in the field of view of the two camera in images acquired at phase angle <7°. Therefore, we discarded all the data at phase angle <10°.

Observational geometry in dust phase function series. Panel (a) shows the behaviour of the nucleus and solar elongation angles versus the phase angle during a single series (MTP018). The tridimensional relative positions of s/c, comet and Sun together with the direction of the pointing stations (in green) are portrayed in panel (b).
3 DATA REDUCTION
All data were calibrated photometrically in reflectance, I/F (i.e. the measured scattered intensity divided by the incident solar intensity), using the instrumental pipeline described in Tubiana et al. (2015).
Using appropriate SPICE kernels (Acton 1996), a phase angle map was generated for each image, allowing us to associate a suitable phase angle with each image pixel in order to have the largest possible phase angle coverage. We then divided each image in squared sub-frames of 16 × 16 pixel2. This value was found to be an optimum with a trial-and-error procedure for averaging the signal within the sub-frame extension and having, at the same time, a good sampling in phase angle.
Our data are affected by the presence of background stars, cosmic ray hits, light tracks of single dust grains, and, at large phase angles (≥95°), by residual solar stray light contamination. Since our scientific aim was measuring the background coma level, getting rid of these contaminations, we used the IDL mmm.pro procedure to calculate the background level in each of the aforementioned sub-frames. This procedure, well tested for estimating the background in stellar-contaminated fields, gives as output the measurement of the background as three times the median minus two times the mean intensity level. The procedure gets therefore rid of stars, cosmic-ray hits and grain tracks with large positive values.
The final output of the procedure is the reflectance versus phase angle curve for each series. This curve represents the measured coma dust phase function. We point out that using the reflectance instead of the usual scattered intensity value does not influence the shape of the phase curve since the reflectance is derived dividing the scattered intensity by the incoming solar flux, which is a constant value for images taken with the same filter, independently of the phase angle of the observations.
3.1 Removal of the stray light effect at large phase angles
Observational campaigns devoted to study and measure the Sun stray light at small solar elongation angles were performed with the OSIRIS instrument during the Rosetta cruise phase. Pure stray light data were obtained in 2014 May using the WAC F21 and Red F12 and the NAC F22 filters. Therefore, we had a good characterization of the stray light phase curve to be removed from the WAC F21 and the NAC F22 filters. Pure stray light data are shown in Fig. 2. As it can be seen, the increase of light due to the Sun approaching the field of view of the two camera produces a distinguishable pattern against the phase angle. We had therefore to remove such effect to get rid of the Sun contribution. The phase function of scientific data has two main contributes: the solar light scattered by the dust particles in the coma plus the light coming from the Sun stray light contamination. Since pure stray light and scientific data were obtained with a similar observational geometry, we subtracted from each scientific image the stray light image corresponding to the same phase angle, once both were reduced to a unitary exposure time. In case coma and stray light data were taken at slightly different phase angles the stray light images were scaled by a constant obtained shifting them along a polynomial curve of reflectance versus phase angle. This curve was derived interpolating the reflectance values of the stray light images central section against the phase angle. In this way, we obtained an artificial stray light bidimensional image characterized by the same observational geometry of the coma data which could be effectively subtracted from the corresponding scientific frame. Fig. 2 shows the result of the solar stray light removal. It is clear that the solar contamination is affecting phase function data only for phase angles larger than ∼95°. Our stray light removal procedure allowed retrieving corrected phase function shapes above 95° for the WAC F21 and NAC F22 filters. We point out that the efficiency of the procedure was clearly depending on the S/N of the original series, and the data taken with low S/N were difficult to correct. Moreover, the last observing stations at large α were difficult to treat since we wanted to subtract two large counts numbers in order to obtain a tiny signal. We decided therefore to trust our analysis only for phase angles ≤155°.
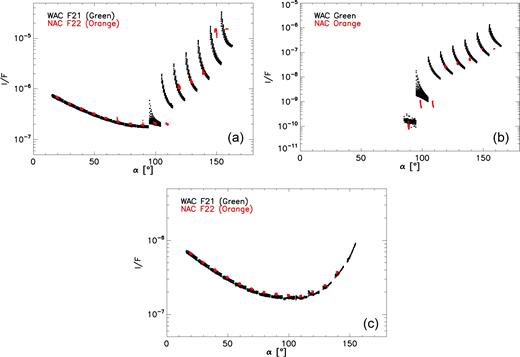
Removal of the stray light effect. Reflectivity data in MTP020 coma, 2014 stray light campaign, coma with stray light removal in WAC F21 (black) and NAC F22 (red) filters against the phase angle are shown in panel (a), panel (b) and panel (c), respectively.
4 COMA PHASE FUNCTION SHAPE
The typical shape of the coma phase function is shown in Fig. 3 where the multiwavelength coverage of WAC and NAC data for the sample MTP018 series is shown. The measured curves in the WAC F21 and NAC F22 filters along the entire mission are instead portrayed in Fig. 4.
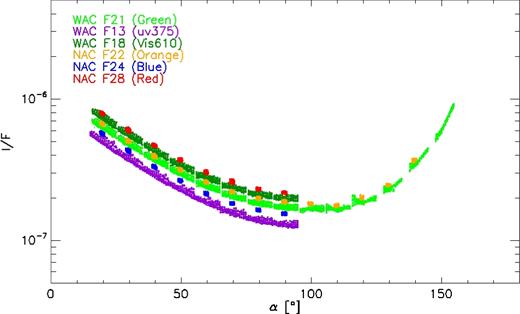
Multiwavelength coverage in MTP020 phase–function series. The reflectivity in all used filters is plotted against the phase angle.
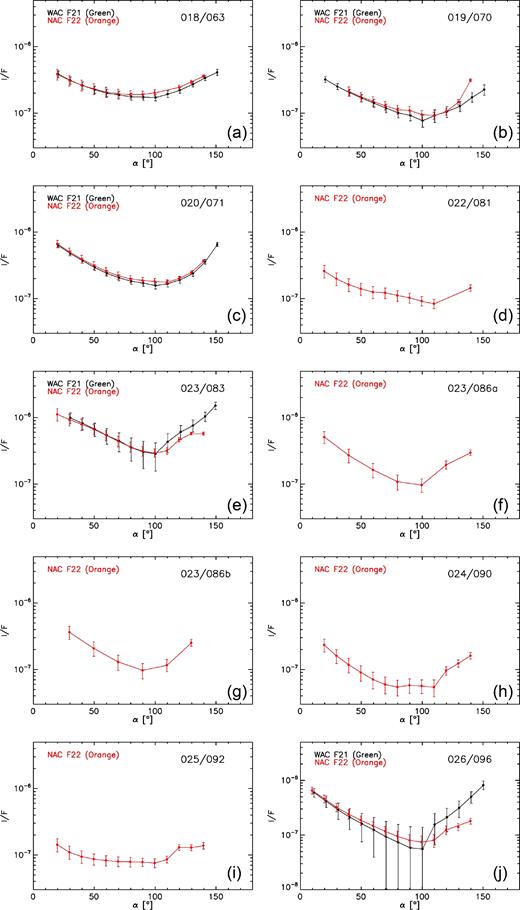
Measured phase function curves. Reflectivity data from MTP018 to MTP026 in WAC F21 (black) and NAC F22 (red) filters are plotted against the phase angle for each series. The two numbers on the upper right-hand corner of each image stand for MTP/STP.
Despite little dissimilarities within the different series in the reflectance absolute values against the phase angle, the overall shape looks constant in time. The reflectance decreases from small phase angles up to ∼100° and then increases again at larger phase angles, reaching similar values at the smallest (∼10°–20°) and largest (∼150°) phase angles sampled, producing a typical u-shape curve.
These curves look different from the usually modelled coma phase function shape derived from considering ground- and space-based observations of different comets all together, i.e. a flat shape at median phase angles, a large surge in the forward scattering direction, and a rather gentle backscattering peak (e.g. Kolokolova et al. 2004).
4.1 Comparison with previous ground- and space-based observations of comets
Since our u-shape curves differ from the modelling in Kolokolova et al. (2004), we decided to perform a comparison between our results and the coma phase function of single comets derived from previous ground- and space-based observations present in the literature.
Such comparison is not straightforward since different authors use different parameters to identify the phase function. The phase function is sometimes expressed as an albedo curve (against the phase angle), which is depending on the ratio of the observed flux in the visible and in the infrared (e.g Gehrz & Ney 1992), as an observed flux curve (e.g Grynko et al. 2004), or as a measured magnitude curve usually normalized to unit heliocentric and geocentric distances (e.g Moreno et al. 2012). In order to make a proper comparison between OSIRIS and literature data, we decided therefore to make a normalization to the available common result closest to the intermediate phase angle of 90°. OSIRIS data were providing a continuous coverage in phase angle because of two main reasons. First, in WAC data this was granted by the large field of view of the camera and the observational strategy which was designed to give reflectance versus phase angle data in a continuous way. Secondly, in small field-of-view NAC data, we performed a linear interpolation between two consecutive reflectance data points to grant the continuous coverage in α. When the literature studies provided a fitting curve to the observed data, we used this curve for the normalization. When only single data points largely dispersed in phase angle were present, we used the data point closer to α = 90°. When a large scattering of data points was provided within a close range of phase angle, we normalized to the average value of the scattered data points closer to α = 90°.
Fig. 5 shows the results of our comparisons.
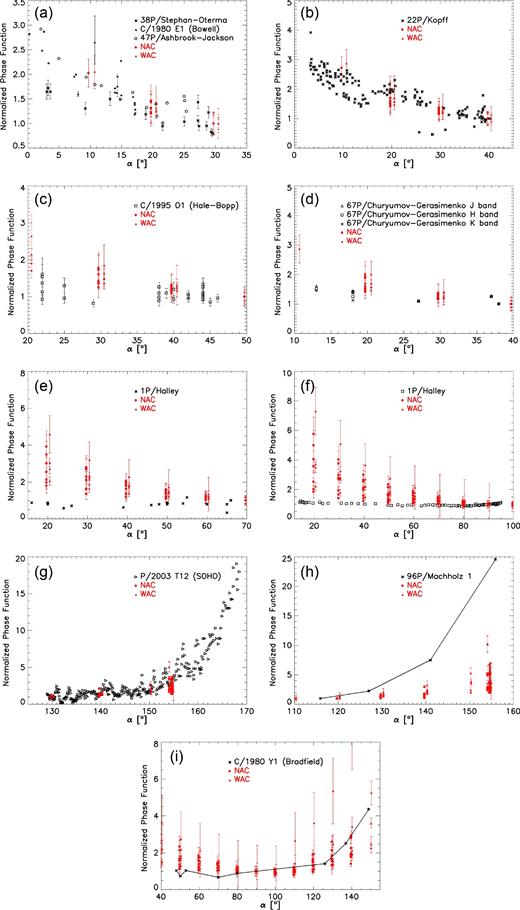
Normalized phase function comparison between OSIRIS data of comet 67P (red) and several comets observed from ground and in space fly-bys (black).
In Fig. 5(a) WAC F21 and NAC F22 results covering our entire data set are overplotted to the backscattering range phase function of a Jupiter family comet (47P/Ashbrook–Jackson), a Halley-type comet (38P/Stephan–Oterma) and a hyperbolic comet (C/1980 E1 (Bowell)) obtained with ground-based observations in Meech & Jewitt (1987). The normalization was performed at α = 30°. Our data are well within the scatter of the data of the three comets at low phase angles.
In Fig. 5(b) the comparison is performed with ground-based observations of the Jupiter family comet 22P/Kopff (Moreno et al. 2012). Also these data are referred to low phase angles and the normalization was performed at α = 40°. Our data fall within the scatter of the comet 22P observations.
Mason et al. (2001) provided ground-based phase curve results for comet C/1995 O1 (Hale–Bopp). The overplot with OSIRIS data and a normalization at α = 46° is portrayed in Fig. 5(c). We found the results from the two comets being comparable.
Interestingly, Hanner et al. (1985) observed comet 67P during the 1982–1983 passage and measured coma phase functions in the infrared domain. The comparison with our data is shown in Fig. 5(d) where the normalization was performed at α = 38°. Despite the different wavelength range, OSIRIS results are clearly comparable with infrared data in the [20°–40°] phase angle range.
Comet 1P/Halley represents instead a remarkable outlier, being characterized by an extremely flat curve at small and intermediate phase angles as resulted from both ground-based (Gehrz & Ney 1992) and space-based observations (Krasnopol'Skii et al. 1987). The comparison between OSIRIS results and the ground- (normalization at α = 65°) and space-based (normalization at α = 90°) measurements of Halley is performed in Fig. 5(e) and (f), respectively.
Large phase angle data are provided by space-based observations of the two Jupiter family comets P/2003 T12 (SOHO) (Hui 2013) and 96P/Machholz 1 (Grynko et al. 2004). The comparison with our results is performed in Fig. 5(g) for comet P/2003 T12 (SOHO) (normalization at α = 130°) and Fig. 5(h) for comet 96P/Machholz 1 (normalization at α = 115°). OSIRIS data well fit the observed behaviour of comet P/2003 T12 (SOHO) up the largest phase angles sampled. Our results are instead systematically lower than 96P/Machholz 1 ones at α > 120°.
Comets covering a wide range of phase angle are a quite rare observable. Among them we found comet C/1980 Y1 (Bradfield) which was observed from ground from α ∼ 45° to 150° in Gehrz & Ney (1992). Normalizing at α = 90° we found the OSIRIS data to be consistent with comet C/1980 Y1 (Bradfield) phase function being the Gehrz & Ney (1992) results within the scatter between our flattest and steepest data at large phase angle (Fig. 5i). The largest difference with Bradfield comet is found for MTP026, which provides the OSIRIS data characterized by the largest difference between the maximum and minimum phase function values.
As a final conclusion in this section, we can state that OSIRIS phase function u-shape curves are consistent with phase functions measured in many other single comets. When the scatter of our and literature data coming from different comets is taken into account, we find the u-shape being consistent with an overall behaviour of cometary dust.
5 COMA PHASE FUNCTION REDDENING AND PHASE REDDENING
In order to measure the behaviour of the coma phase function at different wavelengths, we first produced a spectrophotometric plot of the reflectance data versus the wavelength within a single series and at fixed phase angles. We took into account in our analysis only data with α ≤ 95° to avoid stray light effects in filters other than WAC F21 and NAC F22. The main error on the reflectance measurements comes from the photometric error associated with the background extraction methodology. Once spectrophotometric plots were produced, we performed a linear fit to the data since this first-order interpolation was well representing the observed trend of the data points when the associated error bars were considered (e.g. Fig. 6 shows the reflectivity versus wavelength data and the correspondent linear for the MPT020 series and α = 90°). The linear fit provided associated errors on the slope and intercept measurement.
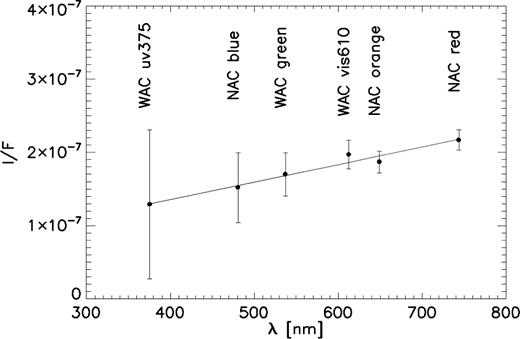
Reflectivity versus wavelength data and correspondent linear fit for the MPT020 series and α = 90°.
Since we obtained reddening measurements for each observational phase angle within a single series, we checked if the coma showed phase reddening effects, i.e. an increase of the reddening with the phase angle, as happening in many small bodies (e.g Marchi, Paolicchi & Richardson 2012; Fornasier et al. 2015). We measured the phase reddening performing a linear interpolation of the reddening versus phase angle data for each series. The phase reddening, ΔS expressed in %/°, is then the angular coefficient of the linear fit divided by the reddening value at phase angle zero (Ciarniello et al. 2015). Our results are reported in Table 2 and they are shown in Fig. 7 where the reddening is plotted against the phase angle for our entire data set.
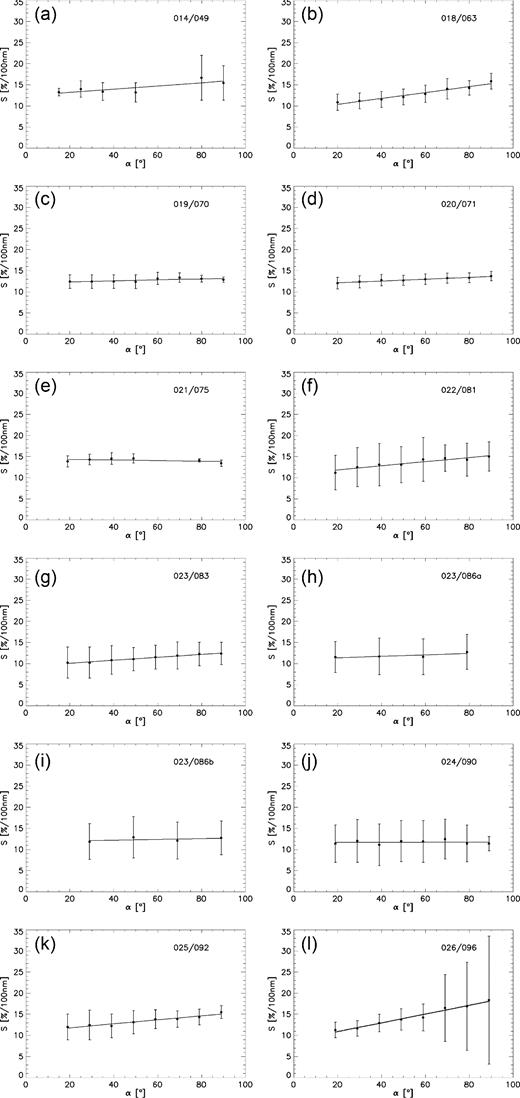
Dust coma phase reddening. The reddening as measured in different series is plotted versus the phase angle. The two numbers on the upper right-hand corner of each image stand for MTP/STP.
Reddening and phase reddening results. S and ΔS stand for reddening and phase reddening, respectively.
| Series (MTP/STP) | S(%/100nm) | ΔS(%/°) |
| 014/049 | 14.3 ± 1.4 | 0.31 ± 0.11 |
| 018/063 | 12.8 ± 1.8 | 0.78 ± 0.08 |
| 019/070 | 12.8 ± 0.4 | 0.10 ± 0.04 |
| 020/071 | 12.9 ± 0.5 | 0.18 ± 0.02 |
| 021/075 | 14.1 ± 0.4 | −0.05 ± 0.05 |
| 022/081 | 13.5 ± 1.3 | 0.46± 0.07 |
| 023/083 | 11.3 ± 0.9 | 0.26 ± 0.02 |
| 023/086 | 11.9 ± 0.6 | 0.11 ± 0.09 |
| 023/086 | 12.4 ± 0.5 | 0.06 ± 0.10 |
| 024/090 | 11.7 ± 0.5 | 0.01 ± 0.07 |
| 025/092 | 13.4 ± 1.2 | 0.43 ± 0.05 |
| 026/096 | 14.4 ± 2.6 | 1.18 ± 0.10 |
We found none or little phase reddening, when the error bars are taken into account. Phase reddening both in planetary surfaces and rings is usually interpreted as an effect of multiple scattering among particles (e.g Cuzzi, French & Dones 2002). If the multiple scattering is dominant in a cloud then it becomes optically thick. Our measurements indicate therefore that single scattering is the dominant scattering process in the 67P coma. We underline data from MTP026, which may look characterized by a not negligible phase reddening, were taken with the WAC in the aforementioned on-chip stacking mode. This mode leads to uncertainties in the absolute calibration of the reflectance, which are not quantified yet at the time of writing. Therefore, the statistical error bars associated with MTP026 phase reddening results in Fig. 7(l) and Table 2 have to be considered as a low limit of the real error. This led us in considering also MTP026 data with negligible phase reddening due to the large associated error bars.
Since we measured a null or small phase reddening, we decided to consider representative of the reddening within a single series its average value among different phase angles, with an associated statistical error given by the standard deviation of the distribution. Our results are shown in Table 2. The measured average reddening values as a function of the phase angle are included in the range [11–14] %/100 nm, with an average error of ∼1%/100 nm, when our complete data set is considered. These results are consistent with the average reddening value of 12.9%/100 nm ± 0.2%/100 nm found from 480 to 649 nm by Frattin et al. (2017) when measuring the reddening of single grain tracks in the coma. Although a slightly different wavelength range was used in the two papers this is not influencing the aforementioned conclusion since our results range was found to not change when calculated using the wavelength range and normalization in Frattin et al. (2017).
We also plotted our results versus mission time, heliocentric distance, and nucleocentric distance (Fig. 8) in order to search for possible trends. A little scatter of the data around the reddening average value is visible but we didn’t find clear and convincing increasing or lowering trends. Our results indicate the background coma colour is essentially not changing with the heliocentric and/or nucleocentric distance. Interestingly, Frattin et al. (2017) show a similar scatter of the data with the heliocentric distance indicating the majority of their detected grains have spectral properties similar to the background coma.
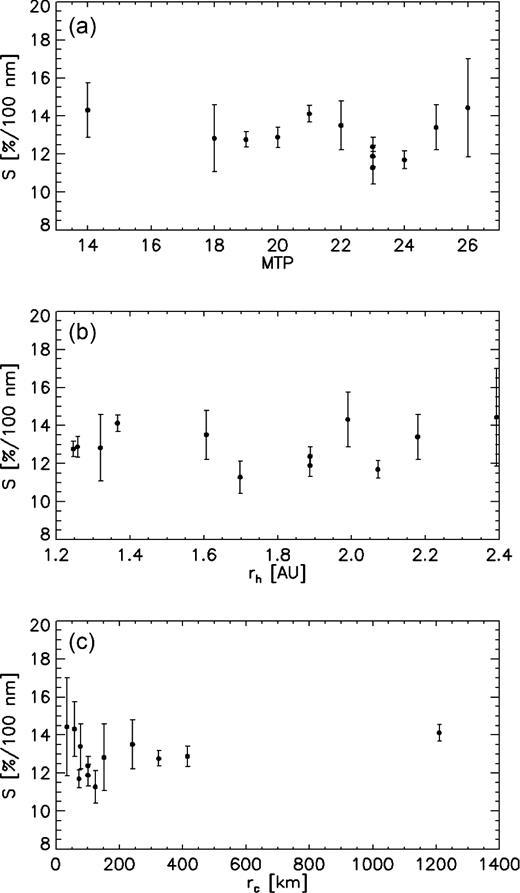
Dust reddening. Measured vales are shown against mission time (a), heliocentric distance (b) and nucleocentric distance (c), respectively.
5.1 Comparison with VIRTIS coma data
Our measurements can be compared with analogous results coming from the VIRTIS imaging spectrometer onboard Rosetta (Rinaldi et al. 2016). The authors sampled the inner coma from 2015 February to August with series obtained pointing the field of view ∼1 km from the comet surface. They obtained therefore data from a different coma portion, closer to the nucleus, with respect to our measurements. They reported a reddening in the range [9–13] %/100 nm ± 1%/100 nm on both sunlit and dark side of the coma, when measured between 350 and 800 nm and in the [42°–82°] range of phase angles.
In order to make a proper comparison with our results, we converted our measurements into the same wavelength interval and normalization used in Rinaldi et al. (2016), but this was found not affecting our final results range. OSIRIS and VIRTIS results are therefore consistent within the error bars associated with the two measurements methodologies.
Moreover, the Rinaldi et al. (2016) results allow us to make an even more precise comparison. We have very close in time data between the two instruments in MTP020/STP71 (VIRTIS data: 2015 August 26, OSIRIS data: 2015 August 28). In this date VIRTIS data showed an average colour of 11.8%/100 nm ± 1.7%/100 nm for the near-nucleus background coma at α = 82°. Our measurement at the closest date is 12.6%/100 nm ± 0.5%/100 nm when calculated with the Rinaldi et al. (2016) wavelength range. OSIRIS and VIRTIS data look very similar in the two considered close dates. This interesting result hints to a dust with similar scattering properties in close days regardless the distance from the nucleus.
5.2 Comparison with OSIRIS nucleus data
We compared our coma results with similar OSIRIS measurements of the nucleus in order to investigate similarities and differences in the photometric behaviour of the material covering the comet surface and that present in the coma.
The first intuitive comparison comes from the phase function shape results. In Fig. 9, we plotted the OSIRIS coma data against the International Astronomical Union magnitude phase function system, called H-G IAU (Bowell et al. 1989), best-fitting modelling of the OSIRIS nucleus data taken during pre-perihelion (July–August 2014) in the NAC Green F23 filter (Fornasier et al. 2015) and the linear-exponential best fit of OSIRIS nucleus data taken during post-perihelion (April 2016) in the WAC F18 filter (Hasselmann et al. 2017). Both nucleus and coma data were normalized to α = 70°. We note that the nucleus is characterized by a larger backscattering opposition effect with respect to the coma, independently of the heliocentric distance. A possible interpretation can be connected to the shadow–hiding effect which could explain the observed difference in terms of packing density, being this effect not present in independent scatterers (e.g Stankevich, Shkuratov & Muinonen 1999). Further theoretical modelling is anyway needed to better understand these observations.
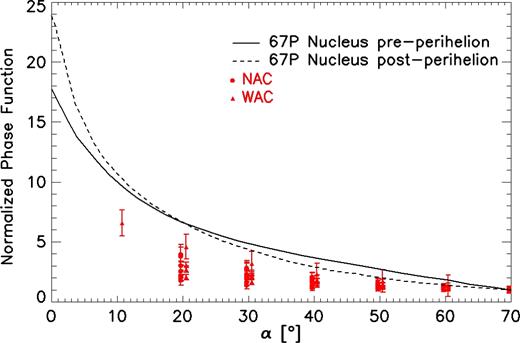
Dust coma against nucleus phase functions. Continuous and dashed black line represents the phase function of the nucleus at pre- and post-perihelion, respectively. Red points stand for coma results.
As reported in the previous paragraph, a proper reddening comparison can be achieved only when the same normalization factor and wavelength interval are used in measuring the steepness of the material spectrum. We therefore converted our coma measurements using the [535–882] nm wavelength interval and a normalization factor equal into the value of the reflectance at 550 nm usually used in studies of minor bodies surfaces (Fornasier et al. 2015, and references therein). The new formalism implied a little shift of our reddening results range ([12–15]%/100 nm with an average error of 1%/100 nm).
Fornasier et al. (2016) found the nucleus reddening behaviour changing with the heliocentric distance. Observations acquired in 2014 August (rh = [3.62–2.33] AU) showed a strong phase reddening (0.81%/°) and a reddening between ∼12%/100 nm and ∼17%/100 nm in the [10°–65°] α range. Getting closer to perihelion in the 2015 April–August (rh = [1.88–1.24] AU) period the nucleus lowered its phase reddening (0.32%/°), while the reddening values changed from ∼15%/100 nm to ∼17%/100 nm between α = 60° and 90°, respectively. In the outbound orbit (rh = [2.22–2.33] AU) spectral data indicated the nucleus got back to reddening and phase reddening values initially observed at larger heliocentric distances. The bluer nucleus close to perihelion was interpreted as the increasing cometary activity removed part of the surface dust, changing the ice content of the visible surface, i.e. as a change in composition of the surface itself.
We compared our data, averaged within a single series, to Fornasier et al. (2016). We considered only series taken with heliocentric distance larger than 2.2 AU and between 1.24 and 1.88 AU, to be consistent with nucleus data. The comparison is shown in Fig. 10 where the continuous red line represents the only coma series taken at large heliocentric distance (MTP026), while the dotted and dashed red curve represents maximum and minimum reddening coma data at small heliocentric distance (<1.88 AU), respectively.
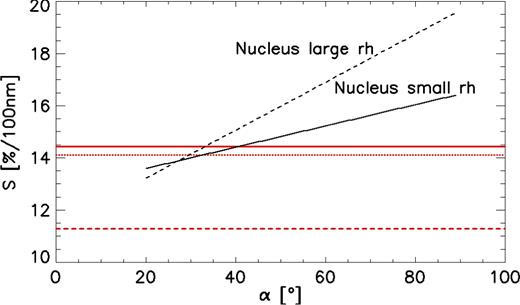
Dust coma against nucleus reddening. Continuous and dashed black line represents the small and large heliocentric distance reddening of the nucleus, respectively. Continuous red line stands for coma MTP026 data. Dotted and dashed red curve represents maximum and minimum reddening coma data at small heliocentric distance, respectively.
The coma measurements are consistent with the nucleus ones only at low phase angles (α < 30°) while at larger phase angles the nucleus becomes redded than the coma, independently of the heliocentric distance. We also note that if we extrapolate the reddening values of the nucleus at α = 0° they fall within the observed coma range.
The lower coma reddening with respect to the nucleus one was also found in VIRTIS data if we compare the results from Ciarniello et al. (2015) (20%/100 nm reddening for the nucleus in the [550–800] nm range after correcting for phase reddening observations taken from MTP006 to MTP012) and the aforementioned Rinaldi et al. (2016). Although the authors of the two papers used different normalization factors and wavelength range in the reddening measurements it is undeniable that 67P coma dust and nucleus behave spectroscopically in a different way.
The scientific interpretation of the dust in the coma being characterized by a lower reddening than the nucleus (at α > 30°) is not straightforward. Observations gave evidence that the dust in 67P coma is coming from the nucleus surface and it is composed of the same material. A difference in the spectral signature may arise from the influence of the multiple scattering effect, although this influence is likely to be small for low albedo material, as underlined in (Ciarniello et al. 2015). If nucleus and coma compositions are likely to be similar and multiple scattering has a small effect, then a different scattering behaviour may be explained by differences in the shape and/or size distribution of the dust particles in the coma with respect to the ones forming the nucleus dust regolith. On the other hand, laboratory results showed that dust particles characterized by the same composition, shape, size and size distribution behave photometrically in a different way if they are single particles or if they are compressed forming a surface (Shkuratov et al. 2007). Using volcano ashes with blue and red albedo of 0.08 and 0.13, respectively, Shkuratov et al. (2007) showed that a surface made by those particles is always redder than single particles, except at low phase angles (α < 10°–20°). This effect is increasing with the phase angle. Despite the differences in albedo between 67P dust and volcano ashes, we note that the overall photometric behaviour looks comparable in the two cases.
We underline that anyway further detailed scattering theoretical modelling and focused laboratory measurements using cometary dust analogues are needed to understand the observed photometric differences between the nucleus and the coma.
6 SUMMARY AND CONCLUSIONS
Twelve OSIRIS multiwavelength series were acquired between 2015 March and 2016 February to study the phase function of comet 67P coma. The purpose of the study was measuring the phase function of a cometary coma covering a wide range of phase angles within a short amount of time. The collected data allowed, after a proper stray light removal procedure, the measurement of the phase function shape, its reddening and phase reddening while varying the heliocentric and nucleocentric distance.
The results and conclusions can be summarized as follows:
Despite little dissimilarities in reflectance values within the different series, we found an overall phase function shape constant in time. The reflectance decreases from small phase angles up to ∼100° and then increases again at larger phase angles, reaching similar values at the smallest (∼10°–20°) and largest (∼150°) phase angles sampled, producing a typical u-shape curve. The comparison between our phase functions and the ones from single comets in literature indicates that OSIRIS curves are consistent with the ones found in many other single comets. When the scatter of our and literature data coming from different comets is considered, we found the u-shape being consistent with an overall behaviour of cometary dust. Moreover, OSIRIS data provide input material for future theoretical studies where, solving the inverse scattering problem, our knowledge of the main scatterers in cometary comae will be deepen.
The dust is characterized by a null or low-phase reddening below 90° of phase angle. This indicates single scattering being the dominant scattering process in the coma.
We measured reddening in the [11–14] %/100 nm range between 376 and 744 nm. No convincing increasing or lowering trend with heliocentric or nucleocentric distance was found, indicating the background coma doesn’t change appreciably its spectrum with time or distance from the comet. These results are consistent with single grain photometry coming from OSIRIS data (Frattin et al. 2017). This indicates the majority of the grains detected as single distinguishable tracks have spectral properties similar to the background coma. Our reddening results are also comparable with the close-nucleus dust photometry coming from VIRTIS data (Rinaldi et al. 2016), enforcing the conclusion of the overall dust being characterized by similar scattering properties, regardless of the distance from the nucleus.
The comparison with OSIRIS nucleus photometry indicates a different phase function shape in the backscattering region, possibly due to shadow–hiding effect on the surface. Nucleus and coma are characterized by similar reddening values only at α < 30°. At larger phase angles the nuclues becomes significantly redder than the coma. The scientific interpretation of this observable, confirmed also by VIRTIS results, is not straightforward. Further, detailed scattering theoretical modelling and focused laboratory measurements using cometary dust analogues are needed to understand the observed photometric differences between the nucleus and the coma.
Acknowledgements
OSIRIS was built by a consortium of the Max-Planck-Institut für Sonnensystemforschung, Göttingen, Germany, CISAS - University of Padova, Italy, the Laboratoire d’ Astrophysique de Marseille, France, the Instituto de Astrofísica de Andalucia, CSIC, Granada, Spain, the Research and Scientific Support Department of the European Space Agency, Noordwijk, The Netherlands, the Instituto Nacional de Técnica Aeroespacial, Madrid, Spain, the Universidad Politéchnica de Madrid, Spain, the Department of Physics and Astronomy of Uppsala University, Sweden and the Institut für Datentechnik und Kommunikationsnetze der Technischen Universität Braunschweig, Germany. The support of the national funding agencies of Germany (DLR), France (CNES), Italy (ASI), Spain (MEC), Sweden (SNSB) and the ESA Technical Directorate is gratefully acknowledged.
