


Abstract
In the framework of the worldwide ground-based campaign, long-slit spectroscopy of comet 67P/Churyumov–Gerasimenko was performed at the 6 m BTA telescope of the Special Astrophysical Observatory RAS in the post-perihelion period from 2015 November to 2016 April at a heliocentric distance from 1.61 to 2.72 au. Strong CN and relatively weak C2, C3, and CO+ emissions were identified in the spectra of the comet on 2015 November 8 and December 9, while NH2 emissions were only observed on November 8. In the spectrum derived on 2016 April 3, only the CN emission was found. The production rates of CN, C3, and C2 are in good agreement with data obtained by other authors. The value log[Q(C2)/Q(CN)] = –0.43 corresponds to the carbon-chain depleted class of comets. The spectra of the comet show a high level of the continuum referring to dust-rich comets. The dust production Afρ decreased from 172 cm at r = 1.62 au to 55 cm at r = 2.72 au, which is close to data derived from photometry at this telescope. The normalized gradient of the cometary dust reflectivity in the 3600–7070 Å spectral range varied from 12.5 ± 2 per cent 1000 Å−1 to 11.3 ± 2 per cent 1000 Å−1, which is close to a mean spectral reddening of cometary dust of 11 ± 2 per cent 1000 Å−1. In general, the photometric properties of comet 67P/Churyumov–Gerasimenko show that it is a typical Jupiter-family comet.
1 INTRODUCTION
Ground-based observations of comet 67P/Churyumov–Gerasimenko (hereafter 67P/(C–G)) started in 1982, but prior to the Rosetta mission they were carried out quite sporadically. To support the Rosetta mission of the European Space Agency (ESA), a worldwide campaign of comet observations was begun in 2003 (Schulz, Stüwe & Boehnhardt 2004). During the period of 2003–2016, a large volume of data about the gas and dust production rates in the comet was collected in the pre- and post-perihelion periods for each apparition. A short review of the results obtained during the last perihelion passage is given in Snodgrass et al. (2017). This expanded dataset can be used for analysing the physical characteristics of the comet and comparing with the results of the Rosetta mission. In this paper, we present the results of optical spectroscopy of comet 67P/(C–G) obtained in post-perihelion periods from 2015 November to 2016 April at the 6 m BTA telescope of the Special Astrophysical Observatory (Russia) (hereafter SAO). We describe the main characteristics of our observations, the data reduction, and discuss the main results.
2 OBSERVATIONS AND REDUCTION
The long-slit optical spectroscopy of comet 67P/(C–G) was performed during three periods: on 2015 November 8 and December 9, when the comet's heliocentric distance r increased from 1.62 to 1.84 au, its geocentric distance Δ decreased from 1.80 to 1.72 au, and its phase angle α was between 33° and 31°, and on 2016 April 3, at r = 2.72 au, Δ = 1.81 au, and α = 10.4°. Observations were carried out at the primary focus f/4 of the 6 m BTA telescope of the SAO with a multimode focal reducer SCORPIO-2. The instrument is described in more detail by Afanasiev & Moiseev (2011) and Afanasiev & Amirkhanyan (2012).
The spectra were obtained with two grisms using a volume-phase holographic grating (VPHG) combined with a long, narrow-slit mask. A VPHG1200G grism and a slit with dimensions of 6.1 arcmin × 1.0 arcsec were used in 2015 November and 2016 April. They provided an effective wavelength region of 3600−7070 Å with 5 Å spectral resolution. In 2015 December, a VPHG2400 grism with a 6.1 arcmin × 2.0 arcsec slit provided a spectral range of 3600−5100 Å with a spectral resolution of 4 Å. The slit was oriented along the comet's velocity vector in the 2015 November and December observation sets and along the extended Sun–comet radius vector for observations obtained in 2016 April (Fig. 1). The date of observation (the mid-cycle time), the heliocentric r and geocentric Δ distances, the phase angle α, the position angle of the slit PAslit, the grating/image scale, the total exposure time during the night Texp, the number of spectra N, and the spectral domain are listed in Table 1.

Image of comet 67P/(C–G) and the position of the slit during the observations. North (N), East (E), sunward direction (⊙), and scale bar are indicated. Narrow boxes across the comet mark the position of the slit on each observation date.
Log of the observations of comet 67P/(C−G).
| UT date | r (au) | Δ (au) | α (deg) | PAslit (deg) | Grating/image scale (arcsec) | Texp (s) | N | Spectral domain (Å) |
|---|---|---|---|---|---|---|---|---|
| 2015 Nov. 8.078 | 1.615 | 1.798 | 33.2 | 295.4 | VPHG1200@540/0.18 × 0.36 | 2400 | 6 | 3600–7100 |
| 2015 Dec. 9.093 | 1.844 | 1.721 | 31.8 | 294.8 | VPHG2400@415/0.36 × 0.71 | 3000 | 5 | 3500–5100 |
| 2016 Apr. 3.913 | 2.723 | 1.807 | 10.4 | 128.9 | VPHG1200@540/0.18 × 0.36 | 2800 | 4 | 3600–7100 |
Primary reduction of spectral data was performed using the codes developed at the SAO operating in an IDL1 environment. It included bias-frame subtraction, removal of cosmic ray traces, flat-field correction with the spectrum of a built-in lamp with a continuous spectrum, spectral line curvature compensation, wavelength calibration, and representation of the data in an evenly spaced wavelength scale. The night-sky spectrum was removed using its level measured in each column over the zones free of the cometary coma.
The spectrophotometric standard star Feige 56 (Oke 1990) was observed to fulfil absolute calibration. To provide flat-field corrections, we observed a smoothed spectrum of an incandescent lamp for spectral data. We obtained the spectra of the He–Ne–Ar lamp to perform wavelength calibrations. The transparency of the Earth's atmosphere for the SAO was taken from Kartasheva & Chunakova (1978).
3 DATA ANALYSIS
To analyse the energy distribution in the cometary spectrum and search for possible molecular emissions, one-dimensional spectra were built by adding up the counts along the slit within ±25 arcsec from the nucleus. To isolate the emission spectrum of the comet, we subtracted the scaled solar spectrum from the cometary spectrum. We used a solar spectrum (Neckel & Labs 1984) to fit the continuum. The solar spectrum was convolved to the resolution of our spectra with an appropriate instrumental profile and normalized to the flux from the comet around 5000 Å. The final spectra of comet 67P/(C–G) were obtained by multiplying the solar spectrum by a polynomial.
The observed spectrum of the comet with the superimposed continuum is depicted in Figs 2(a), 3(a), and 4(a) for 2015 November 8, 2015 December 9, and 2016 April 3, respectively. The polynomials used are displayed in Figs 2(c), 3(c), and 4(c). The emission spectra of the comet were obtained by subtracting the calculated continuum from the observed spectrum (see Figs 2(b), 3(b), and 4(b)). The continuum of the comet shows a reddening effect up to 4400−4500 Å in the November–December period and to 6400 Å in 2016 April.
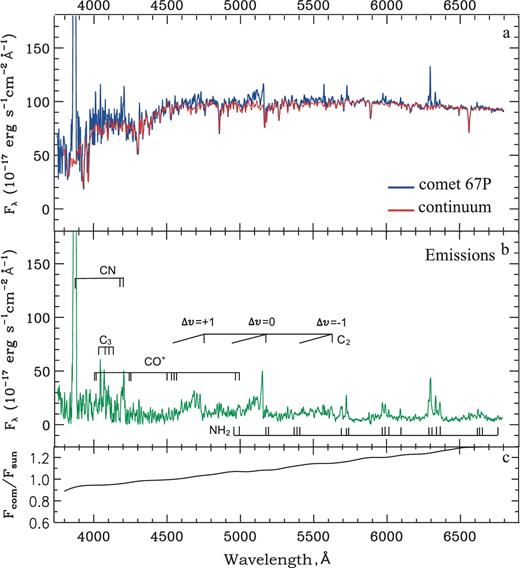
Spectrum of comet 67P/(C–G) obtained on 2015 November 8: (a) the observed spectrum of the comet with the superimposed continuum; (b) the emission spectrum; (c) the applied polynomial correction to the solar spectrum.
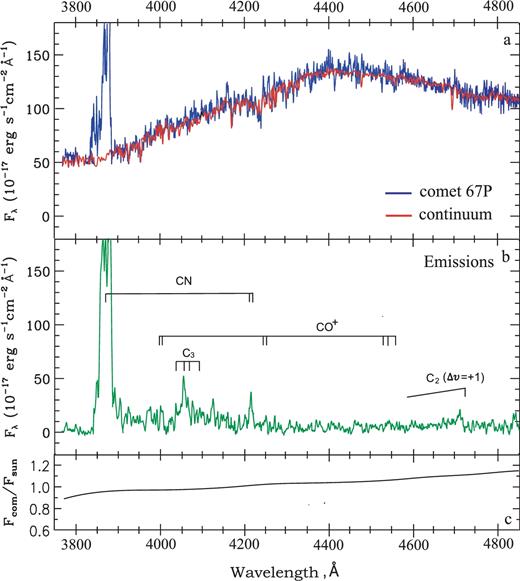
Spectrum of comet 67P/(C–G) obtained on 2015 December 9. Designations are the same as in Fig. 2.
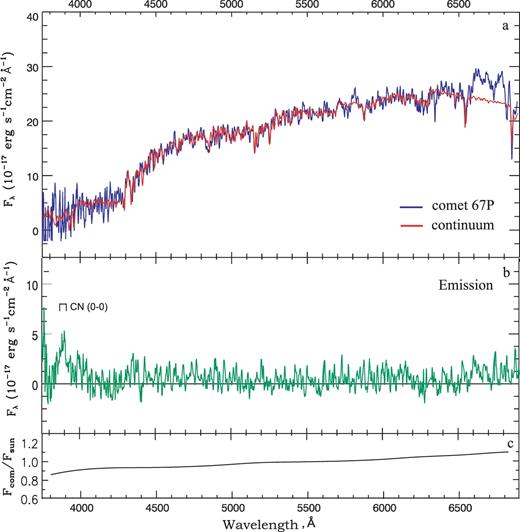
Spectrum of comet 67P/(C–G) obtained on 2016 April 3. Designations are the same as in Fig. 2.
3.1 Emissions
For identification of the observed emission features, we used theoretical spectra of well-known molecules in comets. For theoretical calculations, we used the thermodynamic equilibrium assumption, where vibration and rotation energy levels are populated according to the Boltzmann distribution. The rotational and vibrational temperatures were considered as parameters to calculate the intensities of individual lines (Arpigny 1972, 1976). The observed spectrum was corrected for the Doppler effect.
Strong CN and relatively weak C2, C3, and CO+ emissions were identified in the spectra of comet 67P/(C–G) on 2015 November 8 and December 9. NH2 emissions were observed in the spectra of comet 67P/(C–G) on 2015 November 8. Only the CN emission was detected in the spectrum of the comet on 2016 April 4.
CN: The (Δv = +1, Δv = 0) vibration bands of the violet system of CN belonging to the electronic transition B2Σ+–X2Σ+ were detected in the blue spectral region in three periods of observations. The LIFBASE spectral simulation program of Luque & Crosley (1999) was used to calculate the CN spectra. The spectral lines attributed to the rotational transitions allowed us to resolve them in December only. For the two other observations (2015 November and 2016 April), the moderate spectral resolution of our spectra did not allow us to resolve them.
C3: We detected some emission features of C3 for the observations obtained in November and December. For identification, we used data from the literature (Gausset et al. 1965).
CO+: In our spectra taken in November–December, we detected some weak features that originated from the A2Σ–X2Π electronic transition. The database of Kim (1994) was used for calculations of the theoretical spectrum.
C2: We detected three vibrational band systems of C2 (Δv = +1, Δv = 0, Δv = –1) corresponding to the electronic transition A3Πg–X3Πu , which were obtained in November and December, respectively. To calculate these emissions, we used the line list derived from the laboratory measurements of Phillips & Davis (1968).
NH2: We detected weak emissions of NH2 in cometary spectra obtained in 2015 November in a spectral range from 4900 to 6800 Å. The emissions of NH2 were attributed to the electronic transition A2A1–X2B1. The laboratory measurements of NH2 derived by Dressler & Ramsay (1959) and Johns, Ramsay & Ross (1976) were used to identify these features in our spectra.
3.2 Gas production rate
The Haser model (Haser 1957) supposing isotropic gas outflow from the nucleus and constant gas velocity is usually used to determine gas production rates. Model calculations involve the full flux inside a specified aperture. As soon as we obtain the spectrum from the regions captured by the slit of the spectrograph, it is necessary to do a corresponding correction. To calculate this aperture correction, we took into account both the ratio between the slit areas and the circular aperture and the observed brightness distribution along the slit.
The estimated values of the gas production rate substantially depend on the g-factor and scale length parameters for the parent and daughter molecules used in the model. In our calculations, we used the g-factor for C2 (Δv = 0) presented in A’Hearn et al. (1995). The characteristic scales for the parent and daughter molecules of CN and C2 were taken from Langland-Shula & Smith (2011). The g-factor for the CN (0–0) band is dependent on the heliocentric velocity of the comet; thus, we used the values presented by Schleicher (2010). To calculate the gas production rate of NH2 (0,9,0), the fluorescence efficiency factor was taken from Kawakita et al. (2001). The parent and daughter scale lengths for NH2 and outflow velocity dependence of |${v_{{{\rm{H}}_{\rm{2}}}{\rm{O}}}} = 1.0{r^{ - 0.5}}$| km s−1 were taken from the paper of Langland-Shula & Smith (2011). Table 2 shows the gas production rates of CN, C3, C2, and NH2 and the ratio of production rates of C2 and C3 to CN in comet 67P/(C–G). In Fig. 5, we present the dependence of the CN, C3, C2, and NH2 production rates on the heliocentric distance according to data from different authors. Dashed lines show the best power-law fit to the post-perihelion data, while there are not enough observational data before perihelion to approximate a fit.
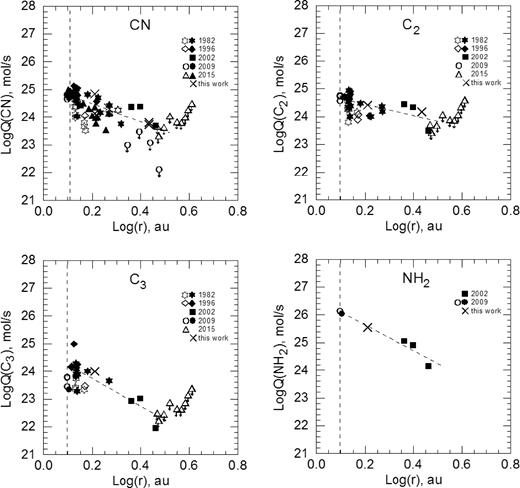
Production rates of CN, C2, C3, and NH2 in comet 67P/(C–G) as a function of the heliocentric distance. Open and closed symbols designate all available data obtained during the pre-perihelion and post-perihelion observations in different apparitions, respectively. For comparison, we used all available data obtained in the following apparitions: 1982–1983 (Cochran et al. 1992; Feldman et al. 2004; Schleicher 2006); 1995–1996 (Weiler et al. 2004; Schleicher 2006; Snodgrass et al. 2013); 1999–2004 (Lowry et al. 2003, 2012; Kidger 2003; Schulz et al. 2004; Lara et al. 2005; Lamy et al. 2006; Ishiguro 2008; Tubiana et al. 2008; Snodgrass et al. 2013); 2006–2010 (Tubiana et al. 2008; Lara et al. 2011; Tozzi et al. 2011; Snodgrass et al. 2013; Guilbert-Lepoutre et al. 2014); 2014–2016 (Snodgrass et al. 2016a, b; Boehnhardt et al. 2016; present work). We also included upper limits of production rates of CN, C2, and C3 calculated by Guilbert-Lepoutre et al. (2014) (CN: open circles with down-pointing arrows) and Snodgrass et al. (2016a) (CN, C2, C3: open triangles with down-pointing arrows). Dashed lines show the best power-law fits to the post-perihelion data.
Gas production rates in comet 67P/(C−G).
| Q (mol s−1) | ||||||
|---|---|---|---|---|---|---|
| UT date | CN | C3 | C2 | NH2 | log[C2/CN] | log[C3/CN] |
| 2015 Nov. 8.078 | 7.05 × 1024 | 1.01 × 1024 | 2.62 × 1024 | 3.54 × 1025 | −0.43 | −0.84 |
| 2015 Dec. 9.093 | 2.24 × 1024 | 0.72 × 1024 | – | – | – | −0.49 |
| 2016 Apr. 3.913 | 5.3 × 10²³ | – | – | – | – | – |
4 DUST PRODUCTION RATE
The continuum flux was determined from the long-slit spectra at wavelengths of 4450 and 5260 Å, which correspond to the central wavelength of the continuum filters BC and GC of the HB filter set (Farnham, Schleicher & A’Hearn 2000). Calculating the aperture correction, we took into account the ratio between the slit areas and the circular aperture and the observed brightness distribution along the slit. Table 3 presents the Afρ values for three periods of observations.
Measured Afρ values and calculated dust production rate QM for comet 67P/(C–G).
| QM (kg s−1) | |||||||||
|---|---|---|---|---|---|---|---|---|---|
| Afρa (cm) | n = 3b | n = 4b | |||||||
| UT date | r (au) | α (deg) | 4450 Å | 5260 Å | v (m s−1) | 4450 Å | 5260 Å | ||
| 2015 Nov. 8.087 | 1.615 | 33.2 | 148 ± 11 | 172 ± 14 | 39–152 | 70 | 81 | 18 | 20 |
| 2015 Dec. 9.093 | 1.844 | 31.8 | 89 ± 8 | – | 37–142 | 39 | – | 10 | – |
| 2016 Apr. 4.928 | 2.723 | 10.4 | 47 ± 7 | 55 ± 9 | 31–116 | 17 | 20 | 4 | 5 |
Notes: athe geometric albedo of the particles was taken as 0.065 (Moreno et al. 2016); bthe power index in the adopted particle size distribution f(a) ∼ a−n.
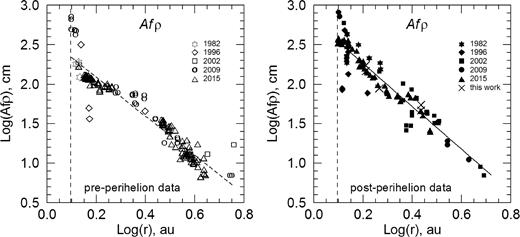
Dust production rates in the logAfρ −logr representation based on all available data for the 1982–1983 (pre-perihelion – Feldman et al. 2004; Schleicher 2006; post-perihelion – Schleicher 2006), 1995–1996 (pre-perihelion – Snodgrass et al. 2013; post-perihelion – Weiler et al. 2004; Schleicher 2006), 1999–2004 (Lowry et al. 2003; post-perihelion – Kidger 2003; Schulz et al. 2004; Lara et al. 2005; Lamy et al. 2006; Ishiguro 2008; Tubiana et al. 2008; Snodgrass et al. 2013), 2006–2010 (pre-perihelion – Tubiana et al. 2008; Lara et al. 2011; Tozzi et al. 2011; Snodgrass et al. 2013; Guilbert-Lepoutre et al. 2014; post-perihelion – Lara et al. 2011; Snodgrass et al. 2013), and 2014–2016 (pre-perihelion – Snodgrass et al. 2016b; post-perihelion – Boehnhardt et al. 2016; present work) apparitions of comet 67P/(C–G). Dashed and solid lines are the best power-law fits to the pre-perihelion and post-perihelion data, respectively.
Based on the observed data for comet 67P/(C–G) obtained from the 1982 to 2015 apparitions, we made power-law fits to the pre- and post-perihelion data (see Figs 5 and 6). Averaged values of the exponent n in the relation Q ∝ r–n for gas and dust production rates Q are presented in Table 4.
Average values of the exponent n in the gas (CN, C3, C2) and dust (Afρ) production rates in comet 67P/Churyumov–Gerasimenko.
| Parameter n in Q ∝ r–n | ||||
|---|---|---|---|---|
| ra (au) | CN | C3 | C2 | NH2 |
| post-perihelion | ||||
| 1.25−2.89 | 3.29 ± 0.46 (48) | 4.98 ± 0.91 (19) | 2.04 ± 0.54 (22) | 4.63 ± 0.74 (5) |
| Parameter n in Afρ ∝ r–n | ||||
| ra (au) | 2002 | 2009 | 2015 | all data |
| 1.25−5.72 | 2.85 ± 0.27 (25) | 3.14 ± 0.12 (30)b | 2.37 ± 0.04 (110)b | 2.47 ± 0.07 (150)b |
| 3.60 ± 0.10 (5)c | 2.80 ± 0.09 (55)c | 2.72 ± 0.10 (100)c | ||
Notes: athe range of heliocentric distances; b and c indicate that the exponent n is taken from the best power-law fit to the pre-perihelion and post-perihelion data, respectively. The number in parentheses corresponds to the number of datapoints used for the fit.
5 DISCUSSION
We analysed the spectra of comet 67P/(C–G) for three post-perihelion periods of observations. On 2015 November 8, species belonging to the CN, C3, CO+, C2, and NH2 molecules were detected. The CN bands were the strongest in the spectrum, while C2 (Swan system) was quite weak. Observations of the comet on 2015 December 9 showed strong CN emission and weak C3 and CO+ emissions. The latest spectral observations of the comet carried out on 2016 April 3 showed only weak CN (0–0) emission, and the dust continuum was rather high. The production rates of C3, C2, and NH2 molecules were relatively low in comparison with the production rate of CN molecules. The log[Q(C2)/Q(CN)] production ratio was −0.43 for the November epoch, while the log[Q(C3)/Q(CN)] ratio was −0.84 in November and −0.49 in December. These values are in good agreement with those derived by other authors (De Almeida, Singh & Burgoyne 1989; Cochran et al. 1992; A’Hearn et al. 1995; Snodgrass et al. 2016a). Thus, our results confirmed that comet 67P/(C–G) is carbon-chain depleted. Our calculations of gas production rates for comet 67P/(C–G) showed values close to those typical for Jupiter-family comets (Langland-Shula & Smith 2011).
CN is expected to be the strongest emission feature in the visible range and has usually been detected at heliocentric distances near 3 au. However, in previous apparitions, namely in 1982, CN was observed in comet 67P/(C–G) beginning from 2.02 au before its perihelion passage (Cochran et al. 1992), whereas in the 1996 apparition, the CN emission was first detected in the spectra of the comet at 1.6 au before perihelion (Snodgrass et al. 2016a). In the 2009 and 2015 apparitions, no gas species were detected within a range of heliocentric distances from about 4 to 2.2 au (Guilbert-Lepoutre et al. 2014). In contrast, in the post-perihelion period, emission lines of CN, C2, and C3 were observed almost to 2.9 au. As one can see in Fig. 5, production rates of these species in pre-perihelion are typically an order of magnitude lower than those at the same post-perihelion distances. The asymmetry of the CN, C3, and C2 production rates around perihelion is probably related to the low activity of the comet before perihelion passage and increasing activity after that. After perihelion passage, very similar changes in the CN, C3, and C2 productivity with distance from the Sun were observed (Schulz et al. 2004). These variations of the gas production rates are probably correlated with the changes in activity of the comet over the same period (see the light curves of the comet on Kidger's websitess2).
The dust production in comet 67P/(C–G), presented by the Afρ value, was measured during previous perihelion passages on 1982 November 12, 1996 January 18, 2002 August 18, and 2009 February 28 by many authors (Lowry, Fitzsimmons & Collander-Brown 2003; Kidger 2003; Feldman, A’Hearn & Festou 2004; Schulz et al. 2004; Weiler, Rauer & Helbert 2004; Lara et al. 2005; Lamy et al. 2006; Schleicher 2006; Ishiguro 2008; Tubiana et al. 2008; Lara et al. 2011; Tozzi et al. 2011; Snodgrass et al. 2013; Guilbert-Lepoutre et al. 2014). The Afρ values varied from 813 cm close to perihelion to about 7 cm at large heliocentric distances, 5.7 au. As in the case of gas production rates, before perihelion the dust production was significantly lower than after perihelion (see Fig. 6). Guilbert-Lepoutre et al. (2014) found variations of the Afρ values from 18 to 73 cm in the pre-perihelion period of the comet within a range of heliocentric distances from 3 to 2.2 au. Snodgrass et al. (2013) reported details of the dust productivity in the comet in the period from 1995 to 2010 for pre- and post-perihelion passages when the heliocentric distance changed from 5.61 to 1.25 au; Tozzi et al. (2011) presented observations of the comet at four epochs during the inbound phase before it reached its perihelion in 2009 February. The authors detected anomalous enhancement of the dust density of the cometary coma towards the nucleus, which can be explained by a very slowly expanding dust cloud. Analysis of the variations of the Afρ values from 2015 August to 2016 May showed that the dust coma of the comet was not in a ‘quasi-steady-state’ (Boehnhardt et al. 2016). According to our observations, comet 67P/(C–G) showed the dust production typical for these heliocentric distances (see Fig. 6) despite the significant activity of the comet during our whole observation period.
An analysis of archival images of comet 67P/(C–G) obtained during all previously observed apparitions made it possible to predict the activity of the comet over the 2014–2015 time period (Snodgrass et al. 2013); the predictions were largely confirmed during the 2014–2016 Rosetta mission observations. The earliest ground-based observations (in 2013 and early 2014) showed that the comet appeared as an inactive point source, although photometry and observations from Rosetta/OSIRIS indicated that detectable activity started in early 2014, when the solar distance was more than 4 au (Snodgrass et al. 2016a; Tubiana et al. 2015). The comet was detected to be active in ground-based observations during 2014, showing a short tail, and in 2015 it was considerably brighter, with an extended coma and a long tail showing a similar appearance through perihelion (Snodgrass et al. 2017). All gaseous emissions (CN, C3, and C2) were detected in the spectra of the comet close to the perihelion passage (Fig. 5). Even the strong CN emissions, which have been observed at large heliocentric distances in some comets (Korsun, Ivanova & Afanasiev 2008; Ivanova et al. 2016), have been detected in this comet starting from only 2.2 au, closer to perihelion (see Fig. 5). There is a significant asymmetry of gas productivity prior to and after perihelion passage. A general analysis of the data shows that the asymmetry can be traced up to perihelion, with much lower gas productivity just before perihelion and about a month after it. Snodgrass et al. (2016a) explained the asymmetry of CN (including last pre-perihelion observations in 2014) with a variety of causes, including possible general low comet activity, or suggesting that comet 67P/(C–G) contains less HCN in general, as well as the seasonal effects that depend on illumination of different parts of the cometary nucleus (Keller et al. 2015; Sierks et al. 2015). However, the most probable explanation could be a thermal-wave lag (Guilbert-Lepoutre et al. 2014; Snodgrass et al. 2016a), where the wave did not reach the inner layers of the cometary nucleus, thereby reducing the comet's total activity on the inbound part of the orbit, where the nucleus is being heated up. In contrast with the gas productivity asymmetry before and after perihelion, the dust productivity of the comet (Fig. 6) appears to be more symmetric. Comet 67P/(C–G) is classified as dusty (Kiselev & Velichko 1998; Snodgrass et al. 2016a), but according to analysis of the productivity of the comet, its dust/gas ratio is lower than in other short-period comets observed in the infrared range, especially before perihelion passage (Hanner et al. 1985). Snodgrass et al. (2016a) compared the water production rates obtained from the MIRO instrument with ground-based observations of the dust productivity of the comet and obtained a mass dust/gas ratio much higher (in the upper limits) than the value obtained with Rosetta (Rotundi et al. 2015). The authors supposed that their results were possibly related to the low dust velocities in the comet measured by OSIRIS and GIADA on Rosetta (Rotundi et al. 2015), or that the main drivers of the dust were more volatile compounds (e.g. CO, CO2).
The normalized reddening of the dust continuum in comet 67P/(C–G) has been determined by many authors in different apparitions. For this, the expression for the normalized reflectivity gradient S΄(λ1, λ2) = (dS/dλ)/Smean, where dS/dλ is the rate of change of the reflectivity with respect to the interval λ1 to λ2 and Smean is the mean reflectivity in the observed wavelength range (Jewitt & Meech 1986). This gradient depends on the wavelengths of observations and decreases as the wavelength increases. According to spectroscopic data obtained by Storrs, Cochran & Barker (1992) during 1982−1983, dust reddening was equal to 24 ± 1 per cent 1000 Å−1 at wavelengths from 3700 to 6400 Å. From the post-perihelion observations on 1996 February 10, when the comet was at r = 1.33 au, Weiler et al. (2004) defined the mean colour gradient as (−0.7 ± 5.1) per cent 1000 Å−1 in the interval of 4070−4600 Å. This small value was possibly caused by C3 contamination. Schleicher (2006) obtained an average value of reddening of 30 ± 42 per cent 1000 Å−1 for the period 1982−1996. From post-perihelion observations of the comet in the 2003 apparition, Lamy et al. (2006) obtained the value 32 ± 6 per cent 1000 Å−1 at r ≈ 2.5 au. Observations of the comet at heliocentric distances ranging from 2.37 to 2.48 au allowed Lara et al. (2005) to deduce that the cometary coma had a rather neutral reflectivity gradient, 0.055 ± 0.02 per cent 1000 Å−1. Tubiana et al. (2008, 2011) observed the comet at large heliocentric distances, from 4.6 to 5.6 au, and estimated a mean reddening that changed within a range of 10 to 12 per cent 1000 Å−1. A spectral slope of 18 per cent 1000 Å−1 for a wavelength range between 4400 and 5400 Å was obtained from pre-perihelion observations of the comet in 2014 (Snodgrass et al. 2016a). Moreover, the spectral slope of ∼4 per cent 1000 Å−1 was found to be less steep at 8000 Å, compared with the blue region, ∼24 per cent 1000 Å−1. Similar behavior of the spectral slope of 5–25 per cent 1000 Å−1 below 8000 Å and 1.5–5 per cent 1000 Å−1 in the near-IR was obtained from the VIRTIS instrument on Rosetta (Capaccioni et al. 2015). Ciarniello et al. (2015) presented spectral slope values of ∼20 per cent 1000 Å−1 in the visible and 3.3 per cent 1000 Å−1 in the IR, which supported previous results obtained from VIRTIS. A higher value of spectral slopes of 11–16 per cent 1000 Å−1 was reported from the Rosetta/OSIRIS instrument (Fornasier et al. 2015), but this difference could be related to a slightly different wavelength interval and different solar phase angle range. The effect of reddening of cometary dust was also marked in our long-slit spectra obtained in 2015 November and 2016 April within the wavelength interval of 3600−7070 Å. For this period, the normalized reddening of the dust varied a little bit, from 12.5 ± 2 to 11.3 ± 2 per cent 1000 Å−1. This indicates that the dust particles of the comet were larger than the wavelength. It is possible that the above-mentioned differences of the dust reddening in comet 67P/(C−G) were due to differences in the heliocentric distances and phase angles of observations. However, Jewitt & Meech (1986) noted that dust properties of comets differ so widely that any phase angle or heliocentric distance dependence of the continuum colour is hidden.
The results of our ground-based observations of comet 67P/(C−G) are indeed complementary to the Rosetta mission. Comparative analysis of the ground-based observations and measurements with the spacecraft makes it possible to have a better understanding of the processes in comets, in particular: (1) the relationship between parent and daughter molecules; (2) how activity differs in the vicinity of the nucleus and in the distant coma; and (3) how the scattering properties of dust particles deposited on the 67P/(C−G) surface and those forming the coma correlate with one another.
It is important to stress that our ground-based observations do not duplicate the Rosetta measurements (this is impossible due to the significant difference in facilities utilized), but they are supplementary to one another. Our spectral observations in the visible cover epochs from 2015 November to 2015 April, which correspond to the post-perihelion motion of the comet. We detected daughter molecules, calculated the corresponding gas production rates, and their variations over the heliocentric distances. The measurements conducted by Rosetta covered a wider spectral range, from the UV through the sub-millimetre waveband, that made it possible to estimate water production and investigate the spatial distribution of CO2, OH, NH2, NH, and CN molecules over the cometary coma (Gulkis et al. 2015; Bockelée-Morvan et al. 2016; Bodewits et al. 2016; Migliorini et al. 2016). Despite the enormous amount of Rosetta results, to our knowledge only spectral data corresponding to the comet being near its perihelion have been published to date. This makes it difficult to compare the Rosetta findings with our ground-based observations.
Nevertheless, our observational results on the daughter molecules CN, C2, and C3 appear to be in good accordance with the spectral data obtained by VIRTIS, which detected similar daughter molecules in the coma during 2015 November–December (Migliorini et al. 2016). The VIRTIS data, showing that the CN emission lines have a great intensity, correlate quite well with our ground-based observations, revealing the significant excess of the CN emission over other daughter molecules. What also emerges from our ground-based observations is that the gas emission lines appear to be in noticeable contrast with the continuum emission from dust that was observed mainly on the day side of the nucleus (Migliorini et al. 2016). Furthermore, by comparing production rates of CN and NH2 gases near perihelion (Bodewits et al. 2016) with the OSIRIS measurements and our ground-based measurements of the comet over post-perihelion epochs, one can conclude that there is a significant decrease of the gas production rate with distance from the Sun.
We investigate an important question: how the colour slope of the cometary coma varies with heliocentric distance. Comparative analysis of the light-scattering properties of dust particles forming a cometary coma and that of the nucleus is important for a better understanding of the physical properties of cometary dust. The colours of the nucleus and individual particles were measured by Rosetta (Capaccioni et al. 2015; Filacchione et al. 2016; Hilchenbach et al. 2016). Analysis of data obtained from the VIRTIS instrument has shown very low reflectance of the nucleus (albedo of 0.060 ± 0.003). Also, observations obtained at heliocentric distances from 3.6 au to the frost line at 2.7 au showed that the single-scattering albedo increases up to 30 per cent. The increasing water-ice abundance in the surface layers and partial removal of the dust layer are probably results of the increasing reflectance. However, as has been shown in laboratory experiments (Shkuratov et al. 2004), there is a significant difference in the responses from single-scattering dust particles and surfaces composed of exactly the same particles. Ground-based observations of 13 ecliptic comets indeed reveal a significant difference in the colours of their nucleus and coma (Lamy & Toth 2009). The analysis of the spectral slopes of the nucleus of comet 67P/(C–G), which was observed near perihelion with OSIRIS, showed a significant phase reddening for the nucleus, where the spectral slope increased from 11 to 16 per cent 1000 Å−1 in the 1.3−54° phase angle range (Fornasier et al. 2015). The geometric albedo of 67P/(C–G) as measured by VIRTIS (Ciarniello et al. 2015) is in good agreement with results obtained from the OSIRIS instrument. Unfortunately, to our knowledge, such data for the post-perihelion period are still missing in the literature.
6 SUMMARY
The main results provided by our observations can be summarized as follows:
CN, C2, C3, and CO+ emissions were identified in the spectra of comet 67P/(C–G) on 2015 November 8 and December 9. NH2 emissions were detected in the spectra on 2015 November 6.
On 2016 April 3, only the CN emission was detected in the spectrum of the comet.
The value log[Q(C2)/Q(CN)] = –0.43 corresponds to a ‘depleted’ class of comets.
The cometary activity level measured by the Afρ parameter showed maximum values from 148 to 174 cm, while the minimal Afρ values ranged from 47 to 55 cm at r = 2.72 au from the Sun.
Dust mass production rates obtained from Afρ were in the range of 18–70, 10–39, and 4–17 kg s−1 on 2015 November, 2015 December, and 2016 April, respectively, depending on the chosen particle size distribution.
The normalized reflectivity gradient of the dust decreased from 12.5 ± 2 to 11.3 ± 2 per cent 1000 Å−1 within a range of heliocentric distances from 1.62 to 2.72 au.
Acknowledgements
The observations with the 6 m BTA telescope were conducted with the financial support of the Ministry of Education and Science of the Russian Federation (agreement No. 14.619.21.0004, project ID RFMEFI61914 × 0004). OVI thanks Evgenij Zubko for discussion and constructive criticism. OVI thanks the SASPRO Programme for financial support. The research leading to these results has received funding from the People Programme (Marie Curie Actions) European Union's Seventh Framework Programme under the REA grant agreement No. 609427. The research was further co-funded by the Slovak Academy of Sciences. OVI thanks the Slovak Academy of Sciences grant VEGA 2/0032/14. VKR thanks for support by the projects 16BF023-02 of the Taras Shevchenko National University of Kyiv. The authors thank the anonymous reviewer for valuable comments on the manuscript.
