


Abstract
We report the first molecular line survey of Supernova 1987A in the millimetre wavelength range. In the Atacama Large Millimeter/submillimeter Array (ALMA) 210–300 and 340–360 GHz spectra, we detected cold (20–170 K) CO, 28SiO, HCO+ and SO, with weaker lines of 29SiO from ejecta. This is the first identification of HCO+ and SO in a young supernova remnant. We find a dip in the J = 6–5 and 5–4 SiO line profiles, suggesting that the ejecta morphology is likely elongated. The difference of the CO and SiO line profiles is consistent with hydrodynamic simulations, which show that Rayleigh–Taylor instabilities cause mixing of gas, with heavier elements much more disturbed, making more elongated structure. We obtained isotopologue ratios of 28SiO/29SiO > 13, 28SiO/30SiO > 14 and 12CO/13CO > 21, with the most likely limits of 28SiO/29SiO >128, 28SiO/30SiO >189. Low 29Si and 30Si abundances in SN 1987A are consistent with nucleosynthesis models that show inefficient formation of neutron-rich isotopes in a low-metallicity environment, such as the Large Magellanic Cloud. The deduced large mass of HCO+ (∼5 × 10⁻⁶ M⊙) and small SiS mass (<6 × 10⁻⁵ M⊙) might be explained by some mixing of elements immediately after the explosion. The mixing might have caused some hydrogen from the envelope to sink into carbon- and oxygen-rich zones after the explosion, enabling the formation of a substantial mass of HCO+. Oxygen atoms may have penetrated into silicon and sulphur zones, suppressing formation of SiS. Our ALMA observations open up a new window to investigate chemistry, dynamics and explosive nucleosynthesis in supernovae.
1 INTRODUCTION
Core-collapse supernovae (SNe) play a key role in the evolution of the interstellar medium (ISM) of galaxies. First, heavy elements are synthesized in the stellar interior, and newly synthesized elements are expelled from SNe, enriching the ISM with metals and dust (e.g. Dwek 1998; Kobayashi, Karakas & Umeda 2011). Secondly, the interaction of the fast expanding ejecta into the ambient ISM results in shocks (e.g. Gotthelf et al. 2001). However, there are still limited studies of how turbulent gas evolves in SN remnants before interacting with a circumstellar medium and subsequently the ISM, or measurements of the elements that have been synthesized in individual SNe.
So far, most abundance measurements of SN remnants have focused on detecting lines at X-ray, UV and optical wavelengths to derive elemental abundances in SN remnants (e.g. Reynolds 2008; Grefenstette et al. 2014). Constraints obtained from these short wavelength spectra are limited to the atomic lines of the main isotope only. Recently, our ALMA Cycle-0 programme discovered cold 28SiO and 12CO, and possibly 29SiO emission from the ejecta of SN 1987A (Kamenetzky et al. 2013). Because the line shift of an isotopologue can be larger than the SN expansion velocity only at millimetre and submillimetre wavelengths, ALMA provides a unique opportunity to investigate isotope abundances in SNe.
The formation of molecules in SNe was reported first in SN 1987A (e.g. Spyromilio et al. 1988; Roche et al. 1989; Lepp, Dalgarno & McCray 1990), followed by a handful of detections in other SNe within a few years after the explosion. Near- and mid-infrared (IR) observations detected only small masses of molecules (∼10−3 M⊙; Lepp et al. 1990; Kotak et al. 2006) in a few young (<2 yr) SNe. Recently, a large mass (>0.01 M⊙) of cold (<120 K) CO molecules was reported in the ejecta of SN 1987A 25 yr after the explosion (Kamenetzky et al. 2013). Also a large mass (∼0.5 M⊙) of cold (∼20 K) dust (Matsuura et al. 2011; Indebetouw et al. 2014) was recorded in the ejecta 23–25 yr after the explosion. These findings show that the SN ejecta have entered a cold molecular phase, which can be investigated with ALMA. Additionally, vibrationally excited H2 emission was detected recently, showing the presence of H2 in the ejecta (Fransson et al. 2016). These later-phase observations can provide insights into molecular chemistry in the ejecta, that can be compared with chemical models (e.g. Lepp et al. 1990; Rawlings & Williams 1990; Cherchneff & Lilly 2008; Cherchneff & Dwek 2009; Clayton 2011; Sarangi & Cherchneff 2013).
It is believed that hydrodynamical instabilities at the time of the SN explosion and shortly thereafter disrupted the nuclear-burning zones into clumps of different compositions (e.g. Hammer, Janka & Muller 2010; Wongwathanarat, Muller & Janka 2015). Microscopic mixing occurs at the thin interfaces of regions of different nuclear-burning zones. It has also been suggested that macroscopic mixing, triggered by these instabilities (Li, McCray & Sunyaev 1993) has caused the different elemental zones to have similar velocity profiles (McCray 1993). After a few weeks, the instabilities should have died out with the clumps maintaining their initial motion up to the present. The CO expansion velocities on days 100 and 10 000 after the explosion were measured to be the same (Liu, Dalgarno & Lepp 1992; Kamenetzky et al. 2013). Chevalier & Kirshner (1979) and Milisavljevic & Fesen (2015) have suggested that such clumps with discrete elemental abundance can be sustained even in the 450 yr old Galactic SN remnant, Cassiopeia A. Our ALMA measurements of velocities from different molecules can test whether mixing has caused the different elemental zones to have similar velocity profiles.
An outstanding question is the extent to which microscopic and macroscopic mixings occur immediately after the explosion. Recent 3D explosion modelling has proposed that Rayleigh–Taylor instabilities of the gas can cause some mixing of gas between zones at the time of the explosion (Fryxell, Arnett & Mueller 1991; Hammer et al. 2010). Chemical models predict that microscopic mixing could result in different compositions of molecules, allowing the formation of hydrides such as OH, OH+ and CH, and opening up new chemical pathways to increase the CO mass (Lepp et al. 1990). If these hydrides are present, their line emission could be detected in an unbiased spectral line survey, thus testing the early evolution of the ejecta triggered by instabilities in the SN explosions.
SN1987A is unique. It is located only 50 kpc away. Its inner ejecta has not yet mixed with the circumstellar material, expelled by its progenitor before the explosion. Given the early stage of the remnant evolution, the blast wave has just overtaken the high-density circumstellar material in the equatorial ring (France et al. 2010; Ng et al. 2013; Fransson et al. 2015). CO and SiO detected with ALMA's spectral imaging (Kamenetzky et al. 2013) have unambiguously formed in the ejecta rather than in the ISM or circumstellar material swept-up by the SN remnant. The majority of SN 1987A's ejecta has not yet experienced a reverse shock (France et al. 2010). After passage through reverse shocks, many molecules in the ejecta may be destroyed, though some molecules may reform after passage through reverse shocks, as found in Cassiopeia A (Rho et al. 2012; Wallström et al. 2013; Biscaro & Cherchneff 2014).
We present a molecular line survey of SN 1987A's ejecta in the 210–300 and 340–360 GHz ALMA spectra, from Cycle-1, Cycle-2 and Cycle-3 observations. The plan of paper is (a) mass of molecules, (b) isotope ratio and (c) line profiles, followed by discussions of molecular chemistry, line profile and isotope ratio.
2 OBSERVATIONS AND DATA REDUCTION
ALMA obtained spectra covering a continuous spectral range from 210 to 300 GHz, using a combination of 10 ALMA ‘Scheduling Blocks' in bands 6 and 7. As part of the ALMA cycle 2 programme, 2013.1.00280.S (PI Matsuura), the spectra of SN 1987A were obtained on 2014 August 29 (day 10 048 since the explosion) for part of band 7 (275–298 GHz), and on 2014 September 2 (day 10 053) for band 6 (211–275 GHz). Additionally, 230 GHz CO J = 2–1 data were obtained on 2014 August 18 (day 10 037), as part of the ALMA cycle 1 programme 2012.1.00075.S (P.I. Indebetouw), where the spectrum covering CO J = 3–2 and 357 GHz HCO+ J = 4–3 was obtained on 2015 July 25 (day 10 378) as part of the ALMA cycle 3 programme 2013.1.00063.S (PI Indebetouw). A series of slightly overlapping ∼2000 km s−1 wide segments were observed in sequence; whereas a typical SN 1987A ejecta line width is 2000 km s−1 [Full width at half-maximum (FWHM); e.g. Kamenetzky et al. 2013], so that one emission line can fill one ALMA spectrum segment.
We requested a root mean square (rms) noise level of 47–52 μJy, which was in general achieved. The integration time was 480–750 s per segment, and the total observing time was 30–34 min for band 6 segments and 40 min for band 7 segments, with a total observing time of 5.6 h. The combined spectrum is the result of 10 × 4 of individual settings and observations for bands 6 and 7 with ALMA. Each setting and observation was reduced individually with the Common Astronomy Software Applications (casa) in the post observation process, before being combined into a single spectrum. The baselines were weighted in order to have a fixed circular beam size (0.3 arcsec) across the frequencies. That is slightly smaller than the naturally weighted beams, which have typically 0.3–0.5 arcsec elliptical beams. The spectra have been smoothed to enhance the signal-to-noise ratio, yielding a final spectral resolution of 345.2 km s−1.
SN 1987A is spatially resolved, with a clear distinction between the ejecta and the ring (Fig. 1). The spectrum was extracted from an ellipse-shaped aperture with long axis of 1.29 arcsec (east–west) and short axis of 1.10 arcsec (north–south), centred on the SN ejecta, thereby minimizing the contamination by emission from the ring. However, there is some slight leak of the ring flux into the aperture, due to imperfect image reconstruction, contributing some continuum level to the ‘ejecta' spectrum. The largest contribution to the noise is the random level of this ring flux ‘leak' into the aperture. We evaluated uncertainties by calculating the σ level by taking the difference of fluxes at four different apertures along the ring, and found that this noise level is on average about 80 per cent larger than the rms noise alone. We adopt this aperture-measured noise level as the noise in the analysis.
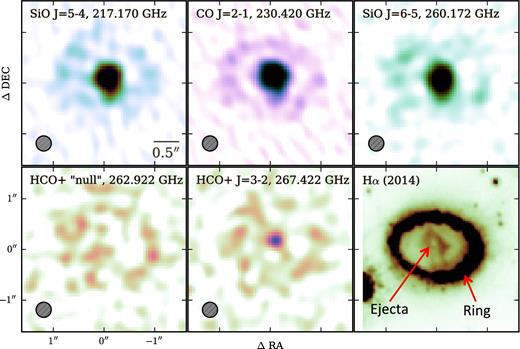
The ALMA 217, 230 and 267 GHz images , along with a Hubble Space Telescope H α image (Fransson et al. 2015; Larsson et al. 2016). The SiO and CO lines originate from the ejecta, located in the centre of the ring. The faint emission from the ring seen in all ALMA images, is due to synchrotron radiation from the ring. The quoted frequencies are those observed, rather than the line centre. The HCO+ 267.4 GHz line is clearly detected in the ejecta, when comparing with the ‘null' frequency image at 262.9 GHz.
3 SPECTRUM AND IMAGES
3.1 ALMA spectrum and molecular identifications
In Fig. 2, we show the observed spectrum of SN 1987A's ejecta, showing a variety of broad (FWHM∼2000 km s−1) molecular lines. The strongest molecular emissions are attributed to SiO and CO. The emission at 267 GHz is associated with HCO+ J = 3–2, with some possible contamination from SO2. Other weak features are due to SO and 29SiO. SO2 and CS may contribute some weaker features, though as discussed later that is very unlikely. The line identifications are summarized in Table 1.
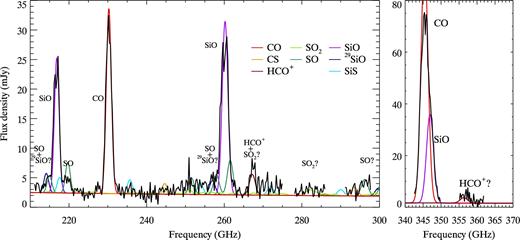
The ALMA 210–300 and 340–360 GHz spectra of SN 1987A's ejecta (black). Major molecular features are labelled. Model molecular spectra with a 2000 km s−1 FWHM Gaussian line profile and the excitation temperature of 40 K, are plotted in colour, guiding molecular identifications. Underlying synchrotron radiation, leaked from the ring into the aperture, is represented by a power low with an index of −0.8.
The lines identified in SN 1987A, together with some representative non-detected lines.
| Line ID | v0 | Int. | h | vc | FWHM |
|---|---|---|---|---|---|
| (GHz) | (10−20 W m−2) | (mJy) | (km s−1) | (km s−1) | |
| SO JK = 55–44 | 215.221 | 2.6 ± 0.3 ± 0.2 | |||
| + 29SiO J = 5–4? | 214.386 | ||||
| SiO J = 5–4 | 217.105 | 35.1 ± 0.4 ± 0.2 | 28.7 ± 0.5 | 220 | 1770 |
| SO JK = 56–45 | 219.949 | 3.3 ± 0.4 ± 0.3 | |||
| CO J = 2–1 | 230.538 | 51.0 ± 0.4 ± 0.3 | 30.0 ± 0.1 | 130 | 2130 |
| SO JK = 66–55 | 258.256 | 1.8 ± 0.6 ± 0.0 | |||
| + 29SiO J = 6–5? | 257.255 | ||||
| SiO J = 6–5 | 260.518 | 54.1 ± 0.6 ± 0.0 | 29.1 ± 0.4 | 230 | 2210 |
| HCO+ J = 3–2 | 267.558 | 6.7 ± 0.6 ± 0.1 | 3.8 ± 0.3 | −200 | 2210 |
| +SO2|$\text{J}_{K_{-}},_{K_{+}}$| = 133, 11–132, 14? | 267.537 | 150 | |||
| CO J = 3–2 | 345.796 | 178 ± 2.6 ± — | 73 ± 1.2 | ||
| + SiO J = 8–7 | 347.331 | ||||
| Upper limits of non-detections | |||||
| 13CO J = 2–1 | 220.399 | <2.4 | |||
| 30SiO J = 5–4 | 211.853 | <2.5 | |||
| 30SiO J = 6–5 | 254.216 | <6.2 | |||
| 30SiO J = 7–6 | 296.575 | <3.3 | |||
| CS J = 5–4 | 244.936 | <3.1 | |||
| CS J = 6–5 | 293.912 | <6.1 | |||
| SO JK = 65–54 | 251.826 | ||||
| SO JK = 54–45 ? | 294.768 | ||||
| SO2|$\text{J}_{K_{-}},_{K_{+}}$| = 160, 16–151, 15 | 283.465 | <3.8 | |||
| SiS J = 13–12 | 235.961 | <2.5 | |||
| SiS J = 14–13 | 254.103 | <4.4 | |||
| SiS J = 15–14 | 272.243 | <5.4 | |||
| HCO+ J = 4–3 | 356.734 |
Notes. v0: the frequency of the molecular lines in vacuum. Int.: the integrated line intensities. The first flux uncertainties are estimated from a Monte Carlo method of placing multiple apertures on the images, and the second uncertainties are systematic errors due to uncertainties of baseline determinations. For the measurements of SO and 29SiO lines, neighbouring SiO lines were fitted with Gaussian profiles, and subtracted from the spectra, before measuring the integrated line fluxes of SO, 29SiO lines. h, vc and FWHM: the height, the central velocity and the FWHM of the Gaussian fits to the line profiles. The LMC systemic velocity of 275 km s−1 was subtracted to obtain the central velocities. The spectral resolution was 345.2 km s−1, and the uncertainties of these velocities are ∼100 km s−1. For 28SiO, the dips are masked by the fitting, so that the measured Gaussian heights are higher than the peaks observed in the spectra (Fig. 2). Upper limits (3σ) are given for non-detections, assuming Gaussian line profiles with an FWHM of 2000 km s−1.
In order to identify molecular lines in our spectra, in addition to simple matching of the frequencies of species to features present, we have used molecular spectra predicted by the non-LTE (local thermal equilibrium) code radex (van der Tak et al. 2007), including CO, SiO, 29SiO, SO, HCO+, SiS, CS and SO2 and the LTE code described by Matsuura et al. (2002) for SO2. The details of radex modelling are described in Section 4. We used the hitran molecular line list for SO2 modelling (Rothman et al. 2009). The temperatures of the models are 40 K in this plot.
The comparison of the ALMA spectra with the model spectra indicates that the weak features are indeed molecular lines. The features at 215, 219, 258 GHz and potentially at 252 and 261 GHz, are associated with SO. Because the model predicts that the 215 GHz line intensity cannot be explained only with SO, an additional contribution from 29SiO is needed, as suggested by Kamenetzky et al. (2013). A similar blending issue of SO and 29SiO is also found for the 258 GHz feature.
Another SiO isotope, 30SiO, has three transitions within the observed ALMA spectral coverage; at 211.9 GHz (J = 5–4), 254.2 GHz (J = 6–5) and 296.6 GHz (J = 7–6). These lines are not detected, and upper limits for the line intensities are listed in Table 1.
13CO has a transition at 220.399 GHz. Our spectra show a feature that is comparable with this. However, the line centre is slightly offset to shorter frequency to be 13CO. This feature can probably be attributed to SO J, K = (5,6)–(4,5) at 219.9494 GHz. No other 13CO transitions occur in our current frequency coverage, so observations at other frequencies are required to rule out the presence of 13CO emission.
The 267 GHz feature is associated with HCO+ with a potential contribution from SO2. This line is the only HCO+ feature present in our spectral coverage, with a marginal detection of HCO+ J = 4–3 at 357 GHz, whereas SO2 has multiple transitions. We display the SO2 model spectrum in Fig. 2 for comparison with the ALMA-observed spectrum (Fig. 2). The model spectrum predicts that the strongest SO2 feature would appear at about 282 GHz, but in the ALMA spectrum, this feature is not detected. This suggests that although SO2 emission lines can be present across the 200–300 GHz range, the contribution of SO2 to the 267 GHz line is small. The 267 GHz line is attributed mainly to HCO+.
Early in its evolution (from day 377 up to 574), tentative detections of near-IR CS vibrational–rotational transition were reported for SN 1987A (Meikle et al. 1989, 1993). CS molecules have rotational transitions at 244.9 and 293.9 GHz, but these lines were not detected in our ALMA spectrum.
We measured integrated line intensities after local continuum subtraction, as listed in Table 1. We fit the lines with a Gaussian, and their heights, centres and FWHMs are also listed in the table. For non-detected lines, 3σ upper limits are given in the table.
3.2 SiO and CO line profiles
The line profiles of SiO J = 5–4 and 6–5 are clearly non-Gaussian, with dips at the top (Fig. 2). The enlarged SiO line profiles are displayed in Fig. 3, with a comparison with the CO line profiles. The profiles are plotted in velocity, after the Large Magellanic Cloud (LMC) systemic velocity of 275 km s−1 (van der Marel et al. 2002; Marshall et al. 2004; Evans et al. 2015) was subtracted. That is a very small difference from the systemic velocity measured in the ring: 286.5 km s−1 in Barycentre, i.e. 271 km s−1 in kinematic vLSR with ALMA (Groningsson et al. 2008). However, compared with the ALMA velocity grid of 345.2 km s−1, this difference is negligible. A dip at ∼300 km s−1 is prominent in the SiO line profiles, and the SiO J = 5–4 and 6–5 line profiles resemble each other, including the widths and depths of the dips. The SiO dips are slightly offset to the red from line centre by ∼300 km s−1.
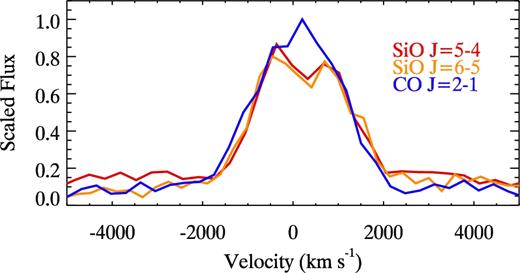
The line profiles of SiO J = 5–4 and 6–5, compared with that of CO J = 2–1. The SiO lines clearly show dips at the top at ∼300 km s−1. An LMC systemic velocity of 275 km s−1 has been subtracted from all spectra.
There is a hint of a dip at the shoulder of CO J = 2–1 at ∼−100 km s−1. Its shape changes with different re-sampling of the ALMA frequency, thus, it is insufficient to verify whether this dip is real or not with CO J = 2–1 alone. A dip is also present in the CO J = 3–2 spectrum (Fig. 2), and that corresponds to about −100 km s−1, the same velocity as CO J = 2–1. CO might have a plausible dip at about ∼−100 km s−1.
The FWHMs of the SiO lines were measured to be 1770 and 2210 km s−1 for J = 5–4 and 6–5, respectively. The difference may not be real, because the tops of the line profiles were masked to remove the effect of the dip. The CO FWHM velocity was measured to be 2130 km s−1. The SiO and CO FWHM are more or less consistent.
Fig. 3 shows that the axis of line symmetry is offset from the centre by 100–200 km s−1 (also listed in Table 1). A similar offset is also seen in the 1.64 μm [Si i]+[Fe ii] line profile (Kjær et al. 2010; Larsson et al. 2016).
3.3 Images
Fig. 1 shows the ALMA images at 217.255 GHz (SiO J = 5–4) and 259.679 GHz (SiO J = 6–5), as well as at 230.615 GHz (CO J = 2–1). These figures clearly show that the strong molecular emissions originate from the inner ejecta. The ejecta are resolved spatially, much larger than the beam size, and appears to be slightly elongated to approximately south–north, following the elongation direction of the H α image (right bottom of Fig. 1). The 267.453 GHz image for the band covering HCO+ J = 3–2 can be compared with the 263.078 GHz image, which does not have a contribution from the HCO+ line. The difference of the contrast between the ring and the ejecta in these two images shows that there are molecular lines contributing in the 267.453 GHz band, indicating the detection of HCO+ J = 3–2. The faint emission seen in the ring is associated with synchrotron radiation (e.g. Zanardo et al. 2014).
4 ANALYSIS OF THE LINE INTENSITIES
We analysed the measured line intensities by modelling them with the non-LTE radiative transfer code radex (van der Tak et al. 2007). The gas density of the line emitting region may not be high enough for LTE to apply, and a non-LTE radiative transfer code is needed for modelling. We describe our modelling of the SiO lines in detail, followed by a brief description of similar analyses for other molecules.
4.1 SiO analysis
The radex code calculates the level populations of molecules using collisional cross-sections. We used SiO Einstein coefficients and SiO–H2 collisional cross-sections from the lamda molecular and atomic data base (Schöier et al. 2005), which was based on the work of Dayou & Balança (2006). Although H2 has been detected in the inner ejecta (Fransson et al. 2016), the main collisional partner of SiO may be O2, SO or O rather than H2. Faure (private communication) estimates that having O2 as a collision partner could increase the rate coefficients by a factor of 1–10, compared with the H2 collisional partner adopted here. That may contribute to the uncertainties of the analysis.
To account for optical depth effects in emission lines, we use the option Large Velocity Gradient in the radex code, which is equivalent to the Sobolev formalism for a freely expanding gas, as summarized by equations 7 and 8 of McCray (1993).
One of the input parameters is the gas density of the collisional partner. We calculated line intensities by varying the gas densities of the collisional partner (ncoll) from 104, 105 to 106 cm−3. We found that a 105 cm−3 model cannot achieve the measured SiO J = 6–5 to 5–4 line ratio, excluding the density being this value. With 104 cm−3, we found a solution that fitted both SiO measured line intensities, however, the required optical depth (τ) becomes more than 1000. For such a high optical depth in the SiO main isotope lines, the 29SiO isotopologue lines would also become optically thick, so that radex predicts almost equally strong 28SiO and 29SiO lines even with a very low isotope abundance ratio (see Section 5.3). Because improbably strong 29SiO isotopologue lines were predicted, a density 104 cm−3 can therefore be excluded. Thus, we adopted the gas density of the collisional partner of 106 cm−3 for the analysis.
Our adopted gas density is similar to the density used by Jerkstrand, Fransson & Kozma (2011). They modelled SN 1987A spectra taken 8 yr after the explosion, by solving for the thermal balance and radiative transfer. The density of the O/Si/S zone was 4.2 × 106 cm−3. Assuming a constant expansion of the clumps over time, that density would have been decreased to 2 × 105 cm−3 24 yr after the explosion. Our adopted density is therefore more or less consistent to the value used by Jerkstrand et al. (2011) with considering a constant expansion over time.
The other two input parameters are the SiO column density (NSiO) and kinetic temperature (Tkin). Appropriate ranges of Tkin and NSiO are constrained by the SiO J = 6–5 to 5–4 ratio of integrated line intensities, r = I(SiO J = 6–5)/I(SiO J = 5–4). Fig. 4 demonstrates the set of (Tkin, NSiO) values that match the ALMA measured line ratio (|$r=1.54^{+0.3}_{-0.2}$|) shown by a red line, with its uncertainties indicated by two white lines.
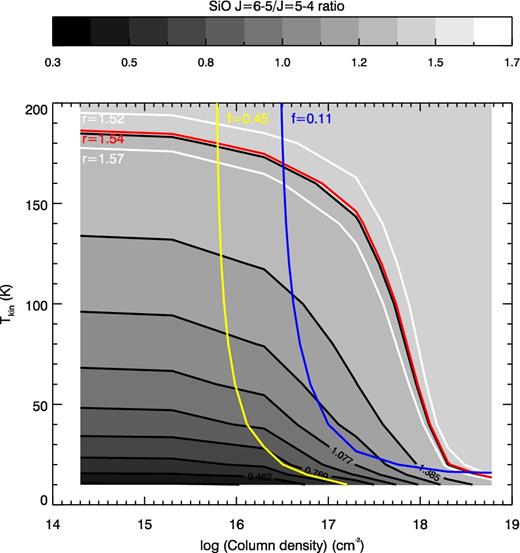
The radex models of the SiO line intensity ratio r = I(SiO J = 6–5)/I(SiO J = 5–4) at ncoll = 106 cm−3. The red line shows the parameter space that matches the measured line ratio (r = 1.54), and the white lines indicate the uncertainties of the measured line intensity ratio (|$r=1.54^{+0.3}_{-0.2}$|). The right side of the blue and yellow lines shows the parameter space where the thresholds set by the filling factor (likely limit of <0.11 and probable limit of <0.45) are satisfied. The solution for SiO modelling is the region where both the line ratio (|$r=1.54^{+0.3}_{-0.2}$|) and filling factor (likely limit of <0.11 and probable limit of <0.45) are satisfied.
While the radex models line intensities refer to whole sky emission (4π), the net line flux from SN 1987A is limited by its emitting surface area (fΩ). We define the filling factor (f) against the integrated area used for the spectrum extraction from the ALMA cube data (Ω = 2.6 × 10⁻¹¹ sterad). The maximum possible size of the emitting area is limited by the estimated ejecta size. There are several ways to constrain the ejecta size. One comes from the assumption that the ejecta gas is expanding with a constant velocity over 27 yr. Although our measured FWHM for the SiO lines is ∼2000 km s−1, slightly wider FWHMs were detected at early times (2400 km s−1; McCray 1993), and we adopt the latter value for the possible ejecta size. Choosing an equation converting the FWHM to the expansion velocity for a uniform sphere (McCray 1993), our measured FWHM corresponds to an expansion velocity of 1700 km s−1. This gives an approximate emitting area of 2.8 × 10⁻¹² sterad (0.19 arcsec in radius) after 27 yr, setting the beam filling factor to be 0.11 or smaller. We adopt an LMC distance of 50 ± 0.19 ± 1.11 kpc (Pietrzynski et al. 2013), which is consistent with the distance measured towards SN 1987A (51.2 ± 3.1 kpc) by Panagia et al. (1991). The higher velocity component was recorded to be 3500 km s−1 (McCray 1993), though it was recorded from hydrogen recombination lines. The longest axis of the H α image in 2012 is about 0.8 arcsec (Larsson et al. 2013; Fransson et al. 2015). These give a maximum possible filling factor of 0.45. In summary, we set f < 0.11 as the more likely range, and <0.45 as a potential maximum value.
By comparing the measured line intensity of SiO J = 5–4 with the modelled value, we obtain the filling factor f. In Fig. 4, the contours for f = 0.11 and f = 0.45 are indicated by blue and yellow lines, showing that only the right top side of the pair of (Tkin, NSiO) can fulfil the f < 0.11 or <0.45 conditions. The combination of the line ratio and the intensity gives constraints on Tkin, NSiO and f, and the appropriate range for these parameters are summarized in Table 2.
SiO and CO model parameters.
| Tkin | ncoll | N | f | M |
|---|---|---|---|---|
| (K) | (cm−3) | (cm−2) | (M⊙) | |
| SiO | ||||
| 170 | 106 | 3.8 × 10¹⁶ | 0.046 | 4 × 10⁻⁵ |
| 150 | 1.6 × 10¹⁷ | 0.018 | 6 × 10⁻⁵ | |
| 100 | 5.3 × 10¹⁷ | 0.013 | 2 × 10⁻⁴ | |
| 50 | 8.8 × 10¹⁷ | 0.019 | 4 × 10⁻⁴ | |
| 40 | 1.1 × 10¹⁸ | 0.022 | 5 × 10⁻⁴ | |
| 30 | 1.3 × 10¹⁸ | 0.028 | 9 × 10⁻⁴ | |
| 20 | 2.1 × 10¹⁸ | 0.028 | 2 × 10⁻³ | |
| CO | ||||
| 40 | 106 | 1.9 × 10¹⁹ | 0.06 | 2 × 10⁻² |
| 30 | 1.6 × 10²⁰ | 0.03 | 7 × 10⁻² | |
| 20 | 1.3 × 10²¹ | 0.05 | 1.0 | |
| 50 | 105 | 6.4 × 10¹⁹ | 0.03 | 3 × 10⁻² |
| 40 | 1.8 × 10²⁰ | 0.02 | 6 × 10⁻² | |
| 30 | 4.7 × 10²⁰ | 0.03 | 2 × 10⁻¹ |
Note. Tkin: the kinetic temperature, N: column density and f: filling factor.
Fig. 5 shows the energy diagram of SiO. There are multiple solutions that fit the measured SiO line intensities, and there is little difference in the SiO energy distributions between the Tkin = 20–170 K models, except for J = 1–0, 2–1 and J > 8–7. With existing ALMA data only, it is difficult to constrain the parameter space even further.
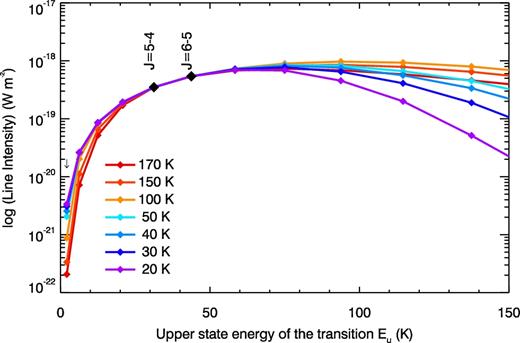
The spectral line energy distribution (SLED) of SiO. The black diamonds show the measured line intensities. The radex models, plotted with lines for seven different Tkin values, show little difference amongst models. The only difference is found at J > 8–7, making difficult to constrain SiO kinetic temperature from ALMA observations only.
The obtained column density is an ‘averaged' value within the beam, and is converted to the total molecular mass by MSiO = fΩNSiOd2m, where d is the distance to SN 1987A (50 kpc), and m is the molecular mass. The estimated SiO masses are listed in Table 2. The appropriate range of the kinetic temperature is 20–170 K and the resulting SiO mass range is 4 × 10⁻⁵–2 × 10⁻³ M⊙. Note that the inferred SiO mass is much smaller than that of CO, despite their comparable line intensities. This is so because SiO has a dipole moment ∼30 times larger than that of CO, hence an Einstein A coefficient ∼103 times larger.
4.2 CO analysis
The CO models have been revised after Kamenetzky et al. (2013), as the ALMA CO J = 2–1 line flux has been re-calibrated. Essentially, the CO analysis also follows the method used for SiO. We used our latest CO J = 2–1 measurements, together with published Herschel Space Observatory J = 7–6 and 6–5 measurements (Kamenetzky et al. 2013; Matsuura et al. 2015). Herschel CO fluxes were measured 2 yr before the ALMA CO line fluxes. While some flux evolution might have occurred, however, considering only small reduction (3 per cent) of 44Ti heating over 2 yr and small change in volume (∼10 per cent), we believe that the evolution of fluxes should be within the measured uncertainties. We use two constraints to find the best parameter space, the line ratio of J = 7–6 (8 × 10⁻¹⁸ ± 2 × 10⁻¹⁸ W m−2) to J = 2–1 (51.0 ± 0.4 ± 0.3 × 10⁻²⁰ W m−2), and the threshold of the filling factor (f < 0.11), with a possible range up to f < 0.45. Here, the filling factor is defined differently from the Kamenetzky et al. (2013) definition; they defined a unity filling factor as the size of the expanding gas over 24 yr with a constant velocity of 2000 km s−1, whereas this work adopts the ALMA spectral-extracted aperture size, which is a 1.29 arcsec × 1.10 arcsec ellipse. We used the collisional cross-sections and Einstein coefficients for CO–H2 from Yang et al. (2010).
Fig. 6 shows the contours of the model line ratios. In the case of CO, both ncoll = 1 × 105 cm−3 and 1 × 106 cm−3 can provide solutions to fit the CO lines. We present contours for ncoll = 1 × 105 cm−3 and 1 × 106 cm−3, separately. The ALMA and Herschel line ratio of CO J = 7–6 to 2–1 is plotted using the red line (r = 16 ± 4), with its uncertainty given by the white lines. The region within the two white lines indicates the suitable parameter space to fit the measured CO line ratio. The filling factor gives additional constraints. In Fig. 6, the parameter space that satisfies the most likely range of f < 0.11 and the possible range up to f < 0.45 are plotted by blue and yellow lines.
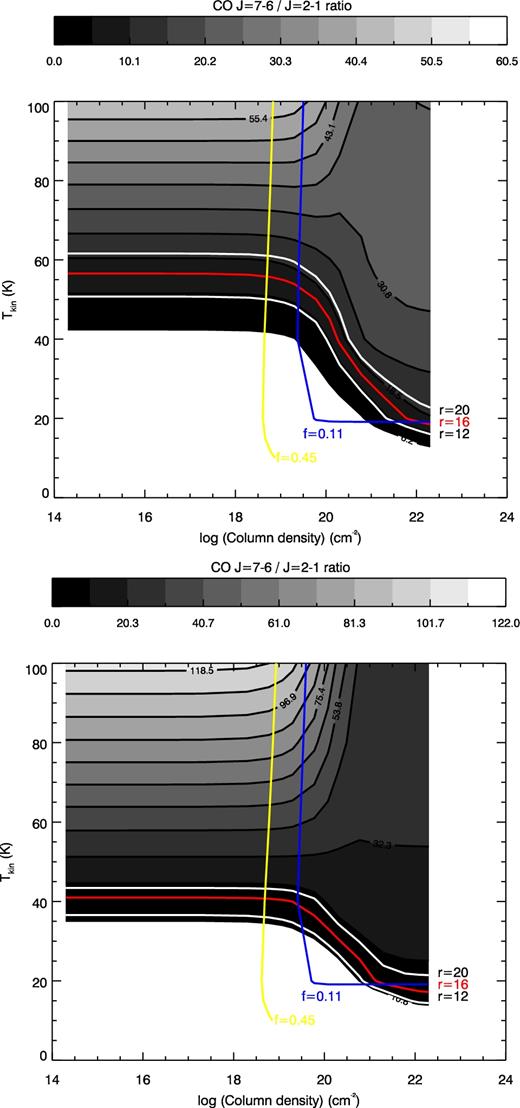
radex models for the CO line ratios (r = I(CO J = 7–6)/I (CO J = 2–1)) at ncoll = 1 × 105 cm−3 (top) and ncoll = 1 × 106 cm−3 (bottom). The white lines show the range that fits the measured line intensity ratio (r = 16), with its range of uncertainties shown as grey lines (r = 20 and 12). The blue contour shows the filling factor threshold (f < 0.11), and the potentially feasible range (<0.45; yellow). The cross-section from these contours (r = 16 ± 4 and f < 0.11) is the suitable parameter range for the CO fitting, and the other cross-section (r = 16 ± 4 and f < 0.45) is the potential parameter range.
The combination of the radex parameter space that satisfies both the line ratio and the filling factor gives the solutions of the CO modelling. The suitable range at ncoll = 1 × 105 cm−3 is Tkin = 30–50 K with a CO mass of 0.2–0.03 M⊙. At ncoll = 1 × 106 cm−3, the range is Tkin = 20–40 K and a mass is 1.0–0.02 M⊙. The fitted parameters and resultant CO masses are summarized in Table 2.
Fig. 7 shows the energy diagram of CO lines. The models that fit the CO J = 7–6 and 2–1 line intensities can also fit CO J = 6–5 line intensities as well.
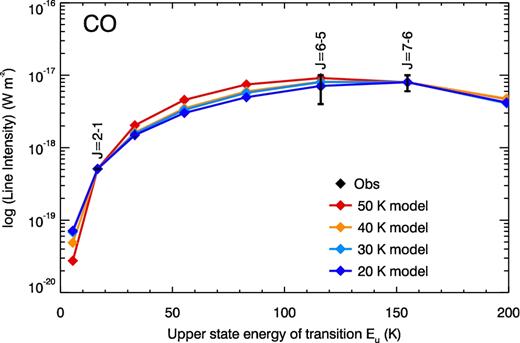
The CO SLED from the ALMA and Herschel measurements, compared with ncoll = 105 cm−3radex model. The models for ncoll = 106 cm−3 are almost the same as ncoll = 1 × 105 cm−2 for a given temperature, so not plotted here.
4.3 Estimating the masses of HCO+, SO, CS and SiS
We also estimated the masses and their upper limits for HCO+, SO, CS and SiS. We adopted a gas density of 106 cm−3, consistent with the model solutions for both SiO and CO. The mass depends only slightly on the assumed ncoll. With ncoll = 105 cm−3, the inferred mass increases by a factor of ∼3, compared with the mass for 106 cm−3. We also fixed the kinetic temperature of the gas to be 40 K because both the 12CO and 28SiO modelling gave solutions at this temperature. These molecular lines are optically thin, and the column density and the filling factor are inversely correlated. Strictly speaking, this inverse correlation is not applicable in some non-LTE conditions, but within the range of temperature, column densities and collision partner densities, this condition holds. Hence, the filling factor is fixed at 1, leaving only the column density as the relevant parameter for the line intensities. We assume that the 267 GHz line is due to HCO+ only, with no SO2 contamination, giving an upper limit for the HCO+ mass. The resulting masses and upper limits are summarized in Table 3.
Estimated masses and upper limits for HCO+, SO, SiS and CS, assuming Tkin = 40 K and ncoll = 106 cm−3.
| Molecules | Mass |
|---|---|
| (M⊙) | |
| HCO+ | ≤5 × 10⁻⁶ |
| SO | ∼4 × 10⁻⁵ |
| SiS | <6 × 10⁻⁵ |
| CS | <7 × 10⁻⁶ |
| Molecules | Mass |
|---|---|
| (M⊙) | |
| HCO+ | ≤5 × 10⁻⁶ |
| SO | ∼4 × 10⁻⁵ |
| SiS | <6 × 10⁻⁵ |
| CS | <7 × 10⁻⁶ |
4.4 Isotopologue ratios
From the measured line intensities of 28SiO and 12CO and the upper limits for 13CO, 29SiO and 30SiO, we can estimate the 12CO/13CO, 28SiO/29SiO and 28SiO/30SiO isotopologue abundance ratios, which can be assumed to be equal to the isotope ratios. The 29SiO lines are blended with SO lines, so that only upper limits for 29SiO line intensities are available. We assume that the excitation temperatures of 28SiO, 29SiO and 30SiO are identical. The isotopologue ratios can be directly obtained from the ratio of the line intensities without radex modelling, assuming that all the lines are optically thin, and that all transitions are in LTE. This method gives 28SiO/29SiO > 13, 28SiO/30SiO > 14 and 12CO/13CO > 21.
The radex modelling can further constrain the isotopologue ratios, because level populations can be in non-LTE, and because 28SiO can be getting optically thick at lower kinetic temperatures. We assume that 28SiO, 29SiO and 30SiO have the same kinetic temperature, giving a lower limit to the 28SiO/29SiO ratio. The lower limit for 28SiO/29SiO is >34 at 170 K, but increases to 28SiO/29SiO > 128 at 50 K, and 28SiO/29SiO >163 at 20 K. The ratios are summarized in Table 4. The lower limit for 28SiO/30SiO is >43 at 170 K, and increases to >188 at 50 K and >401 at 20 K. The 170 K lower limits for the isotope ratio from radex are lower values than the estimates from the line ratios only, assuming the LTE and an optically thin case. This is because of the non-LTE effects.
Isotopologue ratio limits.
| Isotopologues | Method | Abd ratio | |
|---|---|---|---|
| 12CO/13CO | Line ratio | >21 | |
| radex | 40 K, n = 1 × 106 cm−3 | >40 | |
| 28SiO/29SiO | Line ratio | >13 ± 2 (J = 5–4) | |
| >30 ± 10 (J = 6–5) | |||
| radex | 170 K, n = 1 × 106 cm−3 | >34 | |
| 150 K | >52 | ||
| 100 K | >100 | ||
| 50 K | >128 | ||
| 40 K | >137 | ||
| 30 K | >145 | ||
| 20 K | >163 | ||
| 28SiO/30SiO | Line ratio | >14 | |
| radex | 170 K, n = 1 × 106 cm−3 | >43 | |
| 150 K | >64 | ||
| 100 K | >112 | ||
| 50 K | >188 | ||
| 40 K | >227 | ||
| 30 K | >279 | ||
| 20 K | >401 |
Note. Abd ratio: abundance ratio.
As long as the isotopologues of the same species have emitting regions with a similar gas density and a similar kinetic temperature, the isotope ratios are much more robust than the molecular masses which are more strongly dependent on the adopted kinetic temperature.
4.5 Modelling of the CO and SiO line profiles
We present a very simple modelling of the line profile shapes expected for the observed CO and SiO lines. The purpose of this section is to show that the line profiles are compatible with reasonable ideas about the line-emitting region and to deduce some general characteristics of the molecular emission. The excitation requirements to obtain the observed line intensities were discussed in Section 4, therefore here we focus on modelling the profile shapes, to be compared with the observed ones.
Consistent with the observed shape of the molecular emitting region, we assume that the line-emitting region is a hollow, prolate ellipsoid. In our toy model, we take the ratio of the ellipsoid axes to be about 2; the inner radius of the ellipsoid is assumed to be about 80 per cent of the outer one. The inclination of the long axis with respect to the plane of the sky is taken to be of about 45 deg. Note that the absolute sizes of the axes are not relevant at this stage, when we discuss only normalized profiles, but we are assuming that the emitting region is similar to the observed central ellipsoid (Fig. 1). In order to explain the difference between the CO and SiO profiles, we assume that the CO emission comes from the whole ellipsoid, while SiO is abundant in the outer region of the ellipsoid, with a significantly lower abundance at the inner region at 20 per cent of the long axis as illustrated in Fig. 8. As discussed in Section 4, it is probable that the emitting region is in fact composed of a large number of small clumps or filaments, occupying a small fraction of the total volume. The above elliptical shape therefore applies just to the overall large-scale distribution of the gas emitting in the molecular lines, although the emitting gas, due to chemical and/or excitation phenomena, would be in fact concentrated in a large number of clumps within the large-scale structure. As we will see, our profile calculations are independent of the substructure of the mass distribution forming many clumps, provided that they are homogeneously distributed on large scales.
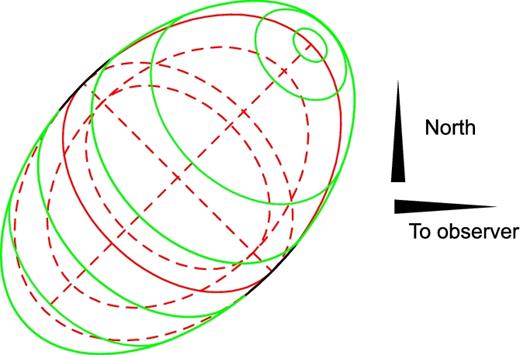
Schematic view of the SiO distribution used for velocity modelling. Red lines show the poles and equator of the outer and inner ellipsoids, and the green lines indicate the SiO-rich region
Since the line emitting gas is expected to have been ejected in a single very short event from a compact object, with minor acceleration/deceleration after the explosion, ballistic radial expansion is expected. We therefore assume radial expansion with a linear velocity gradient. The fastest velocity (at the tip of the ellipsoid) is taken to be about 1500 km s−1, in order to reproduce the observed profile width.
For the assumed velocity field, the emission at each local standard of rest (LSR) velocity comes from the flat region defined by cuts of the ellipsoid parallel to the plane of the sky, in a kind of tomography of the emitting region. For velocity channels with the same width, the distance between the planes is constant. This property is not affected by the fact that the line-emitting gas is placed in a large number of clumps within the ellipsoid. We assume the excitation and abundance distributions to be constant in the ellipsoid (at large scale), except for the lack of SiO in equatorial regions; these simplified constraints are sufficient to reasonably reproduce the observed profiles. The predicted emission from a shell showing a ballistic velocity field, in particular its relation with the size of the emitting regions at each velocity, was already discussed for some evolved nebulae with intense molecular lines e.g. by Bujarrabal et al. (1997, 1998, 2007). Simple excitation conditions, geometry and kinematics were also assumed in those papers, with predictions in good agreement with observations. Our modelling is similar to that presented in those papers, except for the clumpy nature of the shell, which is an intrinsic, distinct property of SN 1987A. In the optically thick case (and for a constant excitation temperature), the angle-integrated emission is obviously proportional to the surface offered by the emitting region; in the optically thin case, the intensity will be proportional to that surface multiplied by the depth of the region emitting at each velocity, which is also constant. In both cases, the brightness distribution for a given velocity must also be constant across the angular extent of the corresponding section. The final spectra were smoothed to a resolution of 375 km s−1, to account for the presence of a local velocity dispersion, which can be due to microturbulence or a dispersion in the velocities of different clumps, and to match the resolution of the smoothed ALMA spectra, which is of this order. The modelling was motivated by the emission line profiles and consistent with recently obtained high-resolution imaging (Abellan et al. 2017).
With these simple assumptions, we have derived normalized line profiles, which are comparable to the observed ones within the uncertainties (Fig. 9). The molecular emission might originate from a region having similar geometrical and dynamical properties compatible with our assumptions.
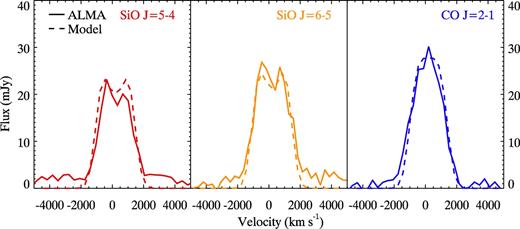
Model line profiles for CO and SiO, compared with the observed ones. The difference between the CO and SiO line profiles can be explained by morphological differences (see text).
5 DISCUSSION
5.1 Molecular chemistry
It has been thought that SNe are molecule-poor environments, because hydrogen, the key element for chemical reaction, is expected to be rather deficient in SN ejecta, and because ample He+ destroys molecules formed within it (e.g. Lepp et al. 1990; Rawlings & Williams 1990; Cherchneff & Sarangi 2011). For young (<10 yr old) SNe, CO and SiO had been the only molecules firmly detected (e.g. Kotak et al. 2006; Cherchneff & Sarangi 2011), with a recent report of detecting near-IR H2 lines from SN 1987A since 2004 (Fransson et al. 2016). Now from our spectral line survey with ALMA, we have discovered SO and HCO+ in the ejecta of SN 1987A. These detections add to the already detected molecules at millimetre wavelengths, CO and SiO, and likely 29SiO, (Kamenetzky et al. 2013). The ejecta of young SN remnants may represent at a much more molecule-rich environment than had been thought before. All the molecules found in SN 1987A have formed from elements ejected and synthesized from this SN, except for H2, and formed only after the explosion within the last ∼30 yr. The inner ejecta have not yet interacted with circumstellar material from the progenitor star or ambient ISM material.
SN remnants that are over a thousand years old have shown slightly more diverse molecular species. H2O, OH+, HCO+ and SO molecules, in addition to CO, have been detected in SN remnants that are interacting with molecular clouds (van Dishoeck, Jansen & Phillips 1993; Reach & Rho 1998; Paron et al. 2006). These molecules are thought to originate from the molecular clouds rather than the SN remnants (van Dishoeck et al. 1993), or from post-reverse shock regions (Reach & Rho 1998; Wallström et al. 2013; Biscaro & Cherchneff 2014). The only molecular detections that are not associated with shocks are H2, ArH+ and OH+ in the Crab nebula SN remnant (Graham, Wright & Longmore 1990; Loh et al. 2012; Barlow et al. 2013). Due to different time-scales and densities, as well as the presence of shocks, molecules in old SN remnants may have experienced different chemical pathways from young SN remnants, such as SN 1987A.
5.1.1 History of molecular detections in SN 1987A
In the early epochs of SN 1987A, all the CO and SiO detections were of vibrational bands at near- and mid-IR wavelengths (Aitken et al. 1988; Catchpole et al. 1988; Rank et al. 1988; Spyromilio et al. 1988; Roche et al. 1989). CO emission was found at day 192 at 2.3 and 4.6 μm (Rank et al. 1988; Spyromilio et al. 1988). A possible trace of SiO emission was reported at day 257 (Aitken et al. 1988), which was later confirmed by Roche et al. (1989). SiO continued to be present at day 517 (Roche, Aitken & Smith 1991). Both the SiO and CO emissions had disappeared from IR spectra by day 615 (Wooden et al. 1993). Since that time, there had been no SiO and CO detections in SN 1987A for nearly 25 yr. Our ALMA observations show CO and SiO rotational transitions in millimetre spectra at day 10 053. The emission has shifted from IR to millimetre wavelengths on a time-scale of two decades, because the excitation temperatures of the molecules have decreased.
Our analysis finds a current CO mass of 0.02–1.0 M⊙. The CO mass estimated at early times was rather uncertain. Spyromilio et al. (1988) reported 10−5–10−4 M⊙ of CO at day 100, while from the analysis of the same IR spectra Liu & Dalgarno (1995) suggested 0.45 M⊙ at day 100, decreasing to (2–6) × 10−3 M⊙ at days 200–600. The difference was caused by the latter work accounting for the optical depth and non-LTE effects for CO, while the former assumed optically thin emission with LTE assumed. Nevertheless, our analysis shows that the current CO mass is larger than at day 200–600. Such a large current CO mass may suggest that the destruction of CO via fast moving electron collisions has decreased in the last two decades. This is reasonable, because the two key contributions to Compton electron production (Thielemann, Hashimoto & Nomoto 1990) are from 56Ni (half-life of 6.1 d) and 56Co (half-life of 77.1 d; Nadyozhin 1994) whose decay rates reduced with time. The reduction of the destruction rate of CO (Deneault, Clayton & Meyer 2006) opened up the possibility to sustain a larger mass of CO now.
Alternatively, Sarangi & Cherchneff (2013) found that CO is primarily formed in the outmost zone of the O-rich core by neutral–neutral reactions involving O2 and C atoms and by radiative association reactions. The chemical model predicted that these processes built up an increasing CO mass from 10−4 M⊙, at day 100 to ∼0.2 M⊙, at day 2000.
Our radex models show that the gas density of 106 cm−3 is high enough for CO up to J = 4–3 to be nearly in LTE, though at 105 cm−3, CO level population of all transitions is slightly offset from LTE. So the gas density of SN 1987A is at a borderline of LTE and non-LTE.
The current molecular temperature is consistent or slightly higher than the dust temperature. The dust temperature measured in 2012 was 20–30 K, depending on the dust composition (Matsuura et al. 2015). The kinetic temperatures of the molecules are between 20 and 50 K for CO and 20 and 170 K for SiO. It is possible that the gas and dust are not collisionally coupled.
5.1.2 HCO+ as a tracer of dense gas and possible requirement of mixing
The surprising detection of HCO+ in SN 1987A can inform us about the density of the ejecta. HCO+ is commonly used as a dense gas tracer in molecular clouds with moderate ionization (e.g. Williams & Viti 2014). This is because its critical density (ncr) is much higher than that for more commonly found molecules, such as CO. The critical density of HCO+ncr(HCO+ J = 3–2) is (2–1) × 106 cm−3 at 50–100 K, while that of CO ncr(CO J = 2–1) is only (3–2) × 103 cm−3 at 50–100 K. Our detection of HCO+, which is as strong as one-eighth of the CO line intensity, shows that the gas density in the HCO+ emitting region in the ejecta is far higher than (3–2) × 103 cm−3, and probably close to ∼106 cm−3, consistent with the density found from our SiO and CO analysis.
As chemical models by Sarangi & Cherchneff (2013) did not consider HCO+ formation, while Rawlings & Williams (1990) did consider it but predicted very small HCO+ mass, we revisit the chemical processes to form this molecule. Forming HCO+ requires H2, which is abundant only in the hydrogen envelope. HCO+ is formed via the reaction of CO with H|$_3^+$|, (|$\mathrm{H_3^+ + CO \rightarrow H_2 + HCO^+}$|), and the formation of H|$_3^+$| requires H2 and a moderate ionization state (|$\mathrm{H_2^+ + H_2 \rightarrow H_3^+ + H}$|) (Williams & Viti 2014). These reactions can occur both in oxygen-rich and carbon-rich environments. In total, forming HCO+ requires H2 in CO gas. The reaction also requires H|$_3^+$|, which was suggested to have been detected in the early days (Miller et al. 1992). Alternatively, the reactions C + H2 → CH + H and CH + O → HCO+ + e− can form HCO+ after >1000 d (Rawlings & Williams 1989, 1990). Both chemical processes require H2 to form HCO+.
A substantial mass of CO is required to form HCO+ in the case of the reaction via CO. The HCO+/CO abundance ratio is density dependent. The highest abundance of HCO+ is usually found in dense regions, where the HCO+/CO abundance ratio can be as high as 10−4 (Papadopoulos 2007), while typically the abundance is far lower than 10−7 in the ISM (Viti, Natarajan & Williams 2002). In order to form ∼5 × 10⁻⁶ M⊙ of HCO+, the gas should contain about 10−2 M⊙ of CO. There is a small fraction of C and O in the hydrogen envelope, because C and O are present there from when they were incorporated into the star at the time of its formation. However, the masses of intrinsic C and O are insufficient to account for the CO mass needed to generate substantial HCO+ mass (only about 10−4 M⊙ of CO at most). In contrast, such a high abundance of CO is available in the inner ejecta, while a large mass of H2 must have formed in the hydrogen envelope.
The enigma of CO in the ejecta interior and H2 in the hydrogen envelope might be solved by the presence of some macroscopic mixing in the ejecta in the early phases after the SN explosion. A classic picture of stellar nucleosynthesis is that the progenitor undergoes a sequence of nuclear reactions in the stellar interiors, building multiple zones with discrete elemental abundances. Fig. 10(a) shows the radial distributions of elements in an unmixed case, starting from the innermost region (interior mass = 0 M⊙) outwards. This figure is based on explosive nucleosynthesis models for SN 1987A (Sukhbold et al. 2016), but includes a more extensive nuclear reaction network based on Woosley (1988) and Woosley et al. (1997) models. The model is for an 18 M⊙ star with an initial metallicity of one-third of the solar metallicity. In the unmixed case, the hydrogen envelope does not have any benefit of enhanced oxygen and carbon atoms being synthesized in the stellar interior. So the presence of some mixing could help in forming HCO+. Indeed, recently, H2 emission has been detected in the inner ejecta of SN 1987A (Fransson et al. 2016), so one of the key molecules to form HCO+ is present in the inner ejecta.
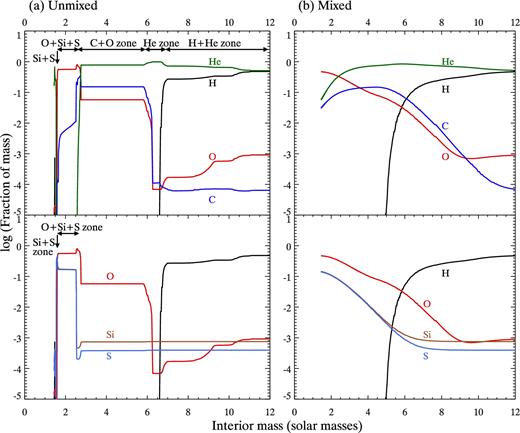
The modelled fractional abundance of atoms after SN explosion. The x-axis shows the interior stellar mass, with zero M⊙ being the inner most. The model is an 18 M⊙ star with one-third of the solar metallicity based on the model for Sk−69° 9202 (Sukhbold et al. 2016), but involving more extensive nuclear reaction network. Only the inner 12 solar masses of the 17.09 M⊙ solar mass pre SN are shown. Panel (a) shows SN 1987A model without mixing of nuclear-burning zones. Panel (b) shows an example of the effect of mixing, with the model with artificial mixing at t = 107 s. For clarity, we split the plots in two (upper and lower panels). The upper panel is for 1H, 4He, 16O and 12C, and the lower panel is for 28Si and 32S with H and O for guidance. The unmixed model (a) shows distinct nuclear-burning zones, Si+S, O+Si+S and C+O zones, as well as He and H+He envelopes. (b) Having mixing triggered by the explosion can make elements from different nuclear-burning zones mixed to some degree, though the degree of mixing is largely in debate. The most notable effect of mixing is Si and S being mixed into O (right lower panel), which was not the case in the unmixed model (left lower panel).
Recent hydrodynamical simulations have shown that Rayleigh–Taylor instabilities and Richtmyer–Meshkov instabilities mix elements at the interfaces of He envelope and C+O zone (Kifonidis et al. 2000; Hammer et al. 2010). The Rayleigh–Taylor instabilities break elemental zones into clumps (Fig. 11b), and Richtmyer–Meshkov instabilities make some fraction of hydrogen sink into the inner ejecta zone (macroscopic mixing; Fig. 11b). This mixing can bring hydrogen atoms down, and elevate oxygen and carbon atoms, increasing the carbon and oxygen abundance in hydrogen-rich regions and the hydrogen abundance in the C+O region. In Fig. 10(b), artificial mixing was introduced by disturbing the velocity gradient of 300 km s−1 that matches the light curve, γ-ray brightening and the spectrum of SN 1987A (Pinto & Woosley 1988; Woosley 1988; Arnett et al. 1989). This demonstrates an example of the mixing effect – allowing some hydrogen to co-exist with carbon- and oxygen-rich ejecta. Note that Fig. 10(b) is one-dimensional model, which does not account for clumpiness, which has been illustrated in Fig. 11(b).
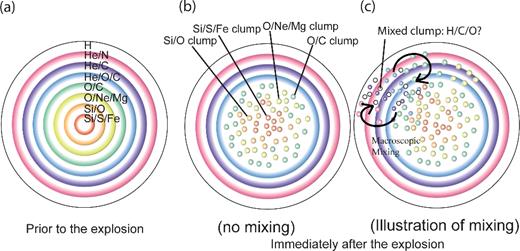
Illustration of the effect of clumping and macroscopic mixings. Panel (a) shows the ‘classic' picture of a stellar core prior to the explosion, consisting of onion layers of different nuclear-burning shells. Hydrodynamical simulations suggest that Rayleigh–Taylor instabilities break elemental zones into clumps (b). Further, macroscopic mixing may make some clumps composed from multiple elemental zones (c).
If mixing can enhance CO in H2 gas, or H2 gas can sink into the C+O zone, this can potentially increase the HCO+ abundance in the ejecta. That brings enigma of mixing – what is the extent of the mixing and what types of mixing would be needed? Fransson & Chevalier (1989) argued against microscopic mixing, because that would cause discrepancies between line ratios of ionized or neutral lines observed in early phases (<200 d). However, they open the possibility of some extent of macroscopic mixing of clumps. Indeed, hydrogen-rich gas from the H envelope moving as slow as 400 km s−1 has been observed from H α and H2 (Kozma & Fransson 1998; Larsson et al. 2016), which could potentially sank into the inner core. Instead of mixing elements completely, mixing might occur locally at the interfaces of the H and He envelopes and the He and C+O zone, due to Rayleigh–Taylor instabilities (Müller, Fryxell & Arnett 1991). Depending on model inputs, Rayleigh–Taylor instabilities at the C+O and He interface can merge into the H and He interface, developing a larger scale of mixing (Herant & Benz 1991; Wongwathanarat et al. 2015). The presence of a such large-scale mixing at early times could have later resulted in a substantial mass of HCO+.
The general assumption is that the ejecta material becomes chemically less active, after the earlier phases (up to about 1000 d) because both the temperature and the density drop. However, our estimated gas density for the ejecta is of the order of 106 cm−3 currently. Even with a temperature as low as 25 K, the Maxwellian velocity is about 105 cm s−1. With this density, molecules can collide with their counter parts in less than fraction of a second, so that the ejecta might be still chemically active. Moreover, Rawlings & Williams (1990) predicted that He+ abundance should decrease at about 1000 days, and consequently, molecular abundances would increase. Also at reduced density, neutral–neutral reactions, which would require overcoming high-energy barriers, would be inefficient, and instead ion-molecular reactions may be taken place (Cherchneff, private communication). These might have caused changes in the molecular compositions over the time.
Rawlings & Williams (1990) published the only model that predicted the formation of HCO+ in SNe. The process required was C + H2 → CH + H and CH + O → HCO+ + e−. The predicted fractional abundance at day ∼1000 was however only 10−18. These models account for elemental abundances from the stellar yields, but not for nuclear-burning zone structures. Incorporating zone structures could potentially increase the HCO+ abundance.
5.1.3 SiO and SiS chemistry
Chemical models predict that at day 1500 the majority of SiO is depleted into silicate dust grains (Sarangi & Cherchneff 2013, 2015). Our measured SiO mass is consistent with this hypothesis qualitatively, but not quantitatively. Our estimated SiO mass is 4 × 10⁻⁵–2 × 10⁻³ M⊙ which is a factor of 16–800 larger than the theoretically predicted SiO mass (2.5 × 10⁻⁶ M⊙; Sarangi & Cherchneff 2013). Nevertheless, Si atoms in SiO is only 3 × 10⁻⁵–1 × 10⁻³ M⊙ which corresponds to less than 10 per cent of Si mass synthesized in SNe. That leaves the possibility that a large fraction of Si could be in silicate dust. Alternatively, Si can be in atomic form, as found in [Si i] (Kjær et al. 2010).
Chemical models (Sarangi & Cherchneff 2013) predict that the majority of Si is actually in the form of SiS rather than SiO. This is because the innermost zone (Si+S+Fe zone) of the stellar core is oxygen-deficient, and Si in this zone forms SiS. The predicted SiS mass is 4.4 × 10⁻² M⊙. However, we find only small mass of SiS (<6 × 10⁻⁵ M⊙). This discrepancy may be partly explained by input nucleosynthesis models. The chemical models of Sarangi & Cherchneff (2013) used elemental abundance predicted for a 19 M⊙ SN progenitor with solar abundances from Rauscher et al. (2002), which is not optimized for SN 1987A nor LMC abundances. The Rauscher et al. (2002) nucleosynthesis model predicts a large Si+S+Fe zone mass of 0.11 M⊙, where 4.4 × 10⁻² M⊙ of SiS can form. In contrast, Fig. 10(a), which shows stellar yields specifically optimised for SN 1987A, presents a much smaller mass (0.03 M⊙) in the Si+S+Fe zone, which can reduce the SiS mass. However, only a factor of 3 difference in Si+S+Fe zone mass is insufficient to explain the more than 103 difference between predicted and estimated SiS mass.
We argue that a large SiO abundance and a small SiS abundance suggest the presence of some degrees of mixing. Fig. 10(b) shows an example of a mixed case. This is expressed in one dimension as a function of cumulative mass from the core to outer direction, so that the clumpiness is not well reflected. At a time of 107 s (∼116 d) after the explosion, Si and S atoms are mixed with O atoms. The mixing enables one to form SiO more efficiently from co-existing Si and O atoms. Additionally, S can bond with O, forming SO and SO2, rather than SiS in a mixed model (Cherchneff & Dwek 2009). Instead of mixing different zones completely, the mixing might have happened only to an extent, with some clumps from one zone mixed with clumps from other zones. Nevertheless, such mixing can still affect the chemical compositions, reducing the SiS abundance and diverting Si to SiO.
An alternative possibility is using intrinsic Si to form SiO. Some Si atoms are present throughout the stellar interior, due to the Si incorporated into the star at the time of star formation. Chemical models (Sarangi & Cherchneff 2013) predict that the abundance of SiO to be 2 × 10⁻⁸ M⊙ in O/C and He+O+C zones, where only intrinsic Si atoms are present (table 6 of their works). In these zones, Si atoms are mainly in silicate dust, instead of in SiO, and the predicted silicate dust mass is 4 × 10⁻⁴ M⊙. Opposed to the predictions of chemical model, if somehow the dust condensation rate of silicates can be lowered to a negligible level, intrinsic Si can make an SiO mass as high as the measured mass. However, that would make it difficult to explain the large condensation rate of dust found in SN 1987A (Matsuura et al. 2011, 2015; Indebetouw et al. 2014). Further, while changing the dust condensation rate might increase the SiO abundance, this does not solve the deficiency of SiS found in SN 1987A. Although there might be some uncertainty in the S chemistry (Cherchneff, private communication), the presence of intrinsic Si and changing the dust condensation can potentially solve the problems of chemistry in SN 1987A partially, but not fully.
5.2 Line profile and geometry
The SiO line profiles show dips at the centre (Fig. 9). The presence of dips requires a non-spherical distribution of SiO gas. A filled sphere is unlikely to produce a dip in the line profile, as even with optical depth effects it can only produce a flat top profile. It might be possible to have a shell, an elongated ellipse or possibly even a bipolar or torus shape. The absence of a prominent dip in the CO line profile is compelling evidence that the CO and SiO have different spatial distributions.
Recently, Kjær et al. (2010) and Larsson et al. (2013, 2016) investigated the ejecta velocity structures, using the 1.64 μm [Si i]+[Fe ii] feature. They found asymmetric line profiles in both [Si i]+[Fe ii] and H α, with extents of over 3000 km s−1. Such a wide profile is not found here for the SiO line. In Kjær et al. (2010), the redshifted part of the line profile is stronger than the blueshifted component, but such an extreme asymmetric structure is not found for SiO. Moreover, a dip was not found in either the [Si i]+[Fe ii] or the H α line, (Larsson et al. 2016). Their line shapes do not resemble that of SiO. The SiO line profile may arise from different parts of the ejecta from those traced by [Si i]+[Fe ii] and H α trace. This is probably because line excitation mechanisms are different, as [Si i]+[Fe ii] lines are produced by non-thermal excitation from positrons, while SiO is most likely collisionally excited.
We argue that the SiO dip is associated with a fast wind triggered deep inside the stellar core at the time of the SN explosion. Hydrodynamical simulations by Hammer et al. (2010) showed that an inhomogeneous distribution of entropy, triggered by shocks within a second of the explosion (Scheck et al. 2008), enhanced fast outflows of the inner core. Elements from the inner zones, such as nickel and oxygen can overrun carbon from the helium envelope. That shapes the ejecta into a multipolar geometry. Eventually, such turbulence ceases, so that the measured line velocities a few months after the explosion are almost the same for all elements (McCray 1993). Nevertheless, the asymmetric bipolar shape triggered immediately continues to be present in the spatial distributions of the gas.
5.3 Isotope ratios
Our ALMA spectrum covers the lines of SiO and CO isotopologues, resulting in estimates of lower limits for the isotope ratios of SN 1987A.
Together with the Crab nebula, which has provided direct measurements of Ar isotope ratios with the Herschel Space Observatory (Barlow et al. 2013), the remnant of SN 1987A has allowed for the first time to estimate the isotope ratios for core-collapse SNe (Kamenetzky et al. 2013).
Explosive nucleosynthesis models have predicted the ratio of 28Si/29Si for SN 1987A. Woosley & Weaver (1995) predicted 28Si/29Si to be 65, while Thielemann, Nomoto & Hashimoto (1996) predicted 8. Our ALMA observations suggest 28Si/29Si > 13, which is larger than the ratio derived by Thielemann et al. (1996). More recent generic (i.e. not specific to SN 1987A) SN models predict 28Si/29Si = 62 and 28Si/30Si = 50 at LMC metallicity (Nomoto et al. 2013). These ratios are much closer to the lower limits we extracted for SN 1987 A with ALMA.
All the isotopes of Si are synthesized by oxygen burning, either before or during the explosion (Woosley 1988; Woosley & Weaver 1995; Woosley & Heger 2002). The majority of 28Si is made by oxygen burning and adding neutrons results in the production of 29Si and 30Si. 29Si and 30Si can be synthesized further by neon burning. The ratio of 30Si/28Si depends on the neutron excess, which depends on the initial metallicity of the star (e.g. Woosley 1988; Kobayashi et al. 2011). Lower metallicity gives a lower neutron excess, resulting in a smaller production of neutron-rich isotopes. Because 30Si requires more neutrons than 29Si, and even more than 28Si, 28Si/30Si becomes even larger than 28Si/29Si at lower metallicity, compared to the solar metallicity.
Fig. 12 shows our ALMA lower limits for 28Si/29Si and 28Si/30Si, as a function of the assumed radex kinetic temperature. These ALMA lower limits are compared with theoretically predicted ratios from explosive nucleosynthesis models based on Sukhbold et al. (2016), with a more extensive reaction network included. The range of initial stellar mass is limited to 15–22 M⊙, close to the expected progenitor mass of SN 1987A (18–20 M⊙). The Sukhbold et al. (2016) model tested the explosion of SNe at solar metallicity for 9–120 M⊙ stars, and their models are calibrated against the stellar evolution models of SN 1987A. Here, only two types of models are plotted: models calibrated against W18, which originated from Woosley et al. (1988), and N20 (Saio, Nomoto & Kato 1988; Hashimoto, Nomoto & Shigeyama 1989; Shigeyama & Nomoto 1990). All these models are for solar metallicity, as in Sukhbold et al. (2016). We also plot the specific model for SN 1987A, which is substantially subsolar and based on the Woosley (1988) model with up-to-date nuclear reaction rates with a more extensive reaction network. The other SN 1987A model is based on Nomoto et al. (2013).
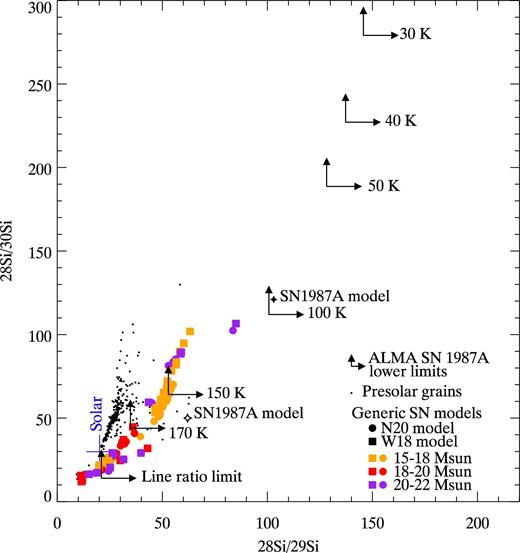
The Si isotope ratios. ALMA lower limits for SN 1987A are plotted with arrows, as a function of the assumed Tkin. The measured lower limits are compared with explosive nucleosynthesis models, including SN 1987A specific models (filled star: based on Woosley, Pinto & Weaver 1988; open star: based on Nomoto, Kobayashi & Tominaga 2013). Generic solar abundance models are from Sukhbold et al. (2016), as a function of zero-age main sequence mass. More details of these models are given in the main text. Solar isotope ratios are indicated by blue lines (Gonfiantini et al. 1997; Rosman & Taylor 1998; Asplund et al. 2009). The analysis of CO favours a temperature range of 30–50 K. If such a low temperature applies to SiO as well, the Si isotope ratios of SN 1987A could be rather a high value (>128). The measured Si isotope ratios in pre-solar grains follow a different sequence from those of the solar metallicity models.
Fig. 12 also includes measurements of the Si isotope ratios in pre-solar grains. Pre-solar grains are the dust grains that had been formed in stellar environments, and are now found in primitive meteorites in the Solar system (Zinner 1998, 2014). Some pre-solar grains are indicative of SN origin. The isotope ratios of pre-solar grains are taken from Washington University's data base (Hynes & Gyngard 2009), which assembled measurements from Hoppe et al. (1994), Zinner (1998), Amari, Zinner & Lewis (1999) and Nittler et al. (1996) etc. The values plotted in Fig. 12 are for X-type SiC grains, whose types had been formed in SN ejecta (Nittler et al. 1996; Pignatari et al. 2013).
Our ALMA estimates of 28Si/30Si and 28Si/29Si lower limits have SiO's Tkin dependence (Fig. 12). Although our SiO measurements have not well-constrained Tkin, measurements and modelling of CO favour 20–50 K. If SiO indeed also has this temperature range, the ALMA lower limits are 28Si/29Si > 128 and 28Si/30Si > 188, pointing to a lower metallicity than the solar metallicity models. The limits are even below the SN 1987A specific model, though the differences are less than a factor of 2. Additionally, the SN 1987A model, based on Sukhbold et al. (2016), used a different semiconvection treatment from red-supergiant models. That could also contribute to a change of the oxygen-shell structure at the time of the explosion, potentially resulting in a different silicon isotope ratio. Subtle changes in the input parameters may potentially match the ALMA measurements.
If the isotope ratios of 28Si/29Si and 28Si/30Si are indeed >128 and >188, respectively, they do not follow the sequence of these ratios in pre-solar grains. This is reasonable, because neutron-rich isotopes are less efficiently produced at lower metallicity (Woosley & Weaver 1995).
Obviously, our current interpretation of the ALMA results is limited by the available SiO isotopologue lines. Ill-constrained excitation conditions are the main concern in this current work. Detecting isotopologue lines and more SiO lines would significantly improve the derived abundance ratios.
Our ALMA measurements suggest carbon isotope ratios of 12C/13 C>21. This lower limit is consistent with the values predicted by explosive nucleosynthesis models. The revised SN 1987A models from Woosley (1988) predict 12C/13C = 2482, whereas Nomoto et al. (2013) predict 12C/13C = 158 for 18 M⊙ and Z = 0.08. The solar value is 89. It may be difficult to obtain a stronger constraint on 12C/13C from observations, due to the very low abundance of 13C.
6 CONCLUSIONS
From ALMA spectral scans at 210–300 and 340–360 GHz, we detected 12CO, 28SiO, HCO+ and SO. Upper limits for 29SiO and 30SiO, as well as 13CO, have been obtained.
The line profiles of SiO and CO clearly show differences, with a dip in the SiO line profile. The presence of the dip clearly shows that the SiO spatial distribution is asymmetric.
Our non-LTE models suggest the kinetic temperature and mass of CO to be 20–50 K and 1.0–0.02 M⊙, depending on the temperature. The parameter range for SiO is less constrained, with a temperature range of 20–170 K and a mass range of 2 × 10⁻³–4 × 10⁻⁵ M⊙. If the temperature of SiO and CO are more or less similar, the SiO mass range can be narrowed down to 2 × 10⁻³–5 × 10⁻⁴ M⊙. With a 40 K model, the upper limit for the HCO+ mass is 5 × 10⁻⁶ M⊙, and the SiS mass is <6 × 10⁻⁵ M⊙. The HCO+ mass is an upper limit because it has a potential line blending issue with SO2, although we expect that the dominant contributor is HCO+.
Together with a non-LTE model analysis and the detection of HCO+, which is a tracer of dense molecular clouds, the density of the line emitting region can be as high as 105–106 cm−3. Such a high density might be achieved, if the molecules are distributed in clumps with locally enhanced densities, rather than being smoothly distributed across the ejecta.
Existing chemical models underpredict the HCO+ mass, while the predicted SiS mass is far larger. One possible explanation is that macroscopic mixing allowed some hydrogen clumps from the hydrogen envelope to sink into the C+O zone, and C and O clumps floated up into the hydrogen envelope. That can enhance the probability of H2 and CO reactions forming HCO+. In the Si+S zone, some oxygen from the Si/O zone may have mixed in.
From our ALMA spectra, we have estimated lower limits for 28Si/29Si and 28Si/30Si. If the kinetic temperature of the SiO isotopologues are in the range of 20–50 K, similar to CO, its neutron-rich isotopes appear to be less abundant in SN 1987A, consistent with the predictions of nucleosynthesis models at lower metallicity.
Acknowledgments
We thank the referee for carefully reading the draft. Prof. D. A. Williams and J.M.C. Rawlings are thanked for discussions. MM and MJB acknowledge support from UK STFC grant (ST/J001511/1), and MM is further supported by an STFC Ernest Rutherford fellowship (ST/L003597/1). MJB acknowledges support from European Research Council (ERC) Advanced Grant SNDUST 694520. HLG acknowledges support from the European Research Council (ERC) in the form of Consolidator Grant CosmicDust (ERC-2014-CoG-647939). SW acknowledges support from supported by NASA grant (NNX14AH34G). This paper makes use of the following ALMA data: ADS/JAO.ALMA#2013.1.00280.S, ADS/JAO.ALMA#2013.1.00063.S and ADS/JAO.ALMA#2012.1.00075.S. ALMA is a partnership of ESO (representing its member states), NSF (USA) and NINS (Japan), together with NRC (Canada), NSC and ASIAA (Taiwan), and KASI (Republic of Korea), in cooperation with the Republic of Chile. The Joint ALMA Observatory is operated by ESO, AUI/NRAO and NAOJ.
