


Abstract
We use deep H i observations obtained as part of the extended GALEX Arecibo SDSS survey (xGASS) to study the cold gas properties of central galaxies across environments. We find that below stellar masses of 1010.2 M⊙, central galaxies in groups have an average atomic hydrogen gas fraction ∼0.3 dex higher than those in isolation at the same stellar mass. At these stellar masses, group central galaxies are usually found in small groups of N = 2 members. The higher H i content in these low-mass group central galaxies is mirrored by their higher average star formation activity and molecular hydrogen content. At larger stellar masses, this difference disappears and central galaxies in groups have similar (or even smaller) gas reservoirs and star formation activity compared to those in isolation. We discuss possible scenarios able to explain our findings and suggest that the higher gas content in low-mass group central galaxies is likely due to the contributions from the cosmic web or H i-rich minor mergers, which also fuel their enhanced star formation activity.
1 INTRODUCTION
Studies have long shown a relationship between galaxy morphology and environmental density (e.g. Hubble & Humason 1931; Dressler 1980; Postman & Geller 1984). At high densities, galaxy clusters are predominantly inhabited by gas-poor, red, passive galaxies, while increasingly low-density areas are populated by galaxies that are increasingly blue, gas-rich and actively star-forming. A strong relation has been shown between a galaxy's morphology and its cluster-centric radius (Whitmore, Gilmore & Jones 1993), which demonstrates the connections between environmental density and galaxy transformations. Galaxies falling into rich clusters are observed to experience rapid evolutionary transformations through dramatic mechanisms including ram pressure stripping (Chung et al. 2009) and starbursts (see also Boselli & Gavazzi 2006).
While striking and dramatic, these rapid transformations in high-density environments are not the most important environmental mechanism of galaxy evolution. Studies have shown that cluster infall alone is insufficient to process field galaxies into cluster galaxies while still maintaining observed scaling relations across environments (Blanton & Moustakas 2009). In order to maintain both global scaling relations and the morphology–density relation, galaxies must experience significant evolution through pre-processing in small groups before they eventually merge into larger clusters. This pre-processing can occur via mergers (Mihos 2004), through gas interactions (Fujita 2004) or through tidal interactions (Moore, Lake & Katz 1998), and has been observed in galaxy groups in the local Universe (Cortese et al. 2006).
Even though pre-processing makes a significant contribution to galaxy evolution, it is difficult to study in small groups. First, galaxy groups (with ≲10 members) are difficult to consistently identify in optical galaxy surveys for statistical reasons (see Section 4 and Berlind et al. 2006). Secondly, incompleteness in optically selected group catalogues is especially problematic for small groups, whose satellite members are often too faint for optical spectroscopy, but can be identified by deep H i observations (Kern et al. 2008) and blind H i surveys (e.g. Hess & Wilcots 2013; Odekon et al. 2016). Thirdly, since gas-removal is one of the hallmarks of group pre-processing, the most-processed galaxies will also be the most difficult (and important) to detect in H i and H2.
These challenges have led to a wide variety of results in the literature. In recent optical studies of environment, Bamford et al. (2008) found that at a fixed optical colour, the morphology–density relationship disappears, while Park et al. (2007) found that at a fixed morphology and stellar mass, no trends with environmental density are observed (in colour, concentration, size, star formation rate, SFR, etc.). Different studies have found that a galaxy's host dark matter halo mass is the primary driver behind environmental effects (e.g. Blanton & Berlind 2007), while others conclude that the local density field drives environmental effects (e.g. Kauffmann et al. 2004).
H i studies of otherwise similar galaxies across different environments have demonstrated that H i-deficient galaxies are common in the high-density cluster environment (Giovanelli & Haynes 1985; Solanes et al. 2001) and also in the lower density group environments (Verdes-Montenegro et al. 2001; Kilborn et al. 2009). However, observations have also shown that H i-rich galaxies in groups are more likely to be found in H i-rich environments (Wang et al. 2015), analogous to the conformity of galaxy colours in groups and clusters found by Kauffmann, Li & Heckman (2010). Continuing to the smallest group scales, simulations and observations of galaxies in pairs have found that they are enhanced in H i (Tonnesen & Cen 2012) and SFR (Lambas et al. 2003; Patton et al. 2013) compared to unpaired galaxies.
Taken together, most H i studies of environment comprise a heterogeneous set of observations with a variety of sensitivities, sample selections and multiwavelength coverage. Blind H i surveys such as the Arecibo Legacy Fast ALFA (ALFALFA; Giovanelli et al. 2005; Haynes et al. 2011) survey are providing large samples of galaxies, but cannot observe the gas-poor regime (i.e. those in group or cluster environments) except for the most nearby galaxies (Gavazzi et al. 2013).
The gas-rich population of ALFALFA galaxies has been used by Hess & Wilcots (2013) to study a sample of galaxy groups. They find that the fraction of H i-detected group members decreases as group membership increases. ALFALFA H i data have also been used in stacking analyses (e.g. Fabello et al. 2011) that combine H i spectra from non-detected galaxies, binned by other properties (like stellar mass). Brown et al. (2015) stack ALFALFA spectra in a sample of ∼25 000 galaxies to study H i scaling relations fully across the range of gas-rich to gas-poor galaxies. Still, the stacking studies are limited to making statistical conclusions about the average properties of galaxies in each bin.
To improve on the environmental coverage and depth of H i surveys, the GALEX Arecibo SDSS Survey (GASS; Catinella et al. 2010) observed a sample of ∼800 galaxies with Arecibo until they were detected in H i or reached an upper limit of 0.015–0.05 in H i gas fraction (M|$_{\rm H\,\small {I}}$|/M*). This sample was the first to simultaneously cover a substantial volume and measure H i in galaxies across the gas-rich and gas-poor regimes. One of GASS's main environmental findings was that massive galaxies (M*/M⊙ > 1010) in large haloes (1013 < Mh/M⊙ < 1014) have at least 0.4 dex lower H i gas fractions than those with similar M* in smaller haloes (Catinella et al. 2013).
In this work, we use the extended GASS sample (xGASS; Catinella et al., in preparation), that includes additional galaxies at lower stellar masses. Our H i observations are exceptionally deep and represent the largest sample of galaxies that probes the gas-poor regime across field and group environments. These H i measurements allow us to witness the full range of environmental effects on a galaxy's gas, from the delicate effects of pre-processing in loose groups to the conspicuous transformative effects in large clusters.
In particular, we focus on the effects of environment on the gas and star formation properties of ‘central’ galaxies. Central galaxies are the dominant (most massive) member in their group or cluster, but are sometimes also defined as the brightest cluster galaxy (BCG) or brightest group galaxy (BGG, as discussed further in Section 4). Central galaxies usually reside at the centre of the group's dark matter halo but can also be found in isolation. Central galaxies in groups grow primarily by mergers and interactions, while isolated galaxies experience mostly secular evolution (e.g. Lacerna et al. 2014, and references therein).
Central and satellite galaxies are thought to follow different evolutionary pathways as they are affected by different mechanisms. Satellite galaxies can experience a wide range of environmental effects (e.g. ram pressure stripping, tidal interactions, etc.), while the evolution of central galaxies is more closely tied to their halo mass, involving fewer mechanisms, and central galaxies make a greater contribution to the growth of stellar mass in galaxies (Rodríguez-Puebla et al. 2011). The environmental effects on the H i content of satellite galaxies are discussed in Brown et al. (2016) and will not be considered further in this work.
In this work, we compare central galaxies in groups and in isolation in order to identify possible environmental effects on their gas and star formation properties. We also consider the effects that group size (i.e. total dark matter halo mass or multiplicity) and local environmental density (i.e. the density of nearby galaxies within 1 Mpc) may have on the properties of central galaxies in our sample. These environmental metrics are some of the most commonly used when studying the role of environment on galaxy evolution (Blanton & Berlind 2007). Finally, we make comparisons between galaxies in different environments at fixed stellar mass, since many galaxy properties (e.g. star formation, size, luminosity) scale primarily with stellar mass (Kauffmann et al. 2003).
This paper is organized as follows. Section 2 describes and characterizes the sample of galaxies used in this work. Sections 3 and 4 describe our determinations of SFRs and environment metrics, respectively. Section 5 describes our main results, and Section 6 discusses these results and their implications. We summarize our main conclusions in Section 7. Throughout this work, we use a Lambda cold dark matter cosmology with H0 = 70 km s−1 Mpc−1 and ΩM = 0.3.
2 xGASS SAMPLE
The xGASS survey is an extension of GASS (Catinella et al. 2010) to include lower stellar mass galaxies (the GASS-low sample).
The original GASS sample (of Catinella et al. 2013) was selected to have a flat distribution of stellar mass between 1010 ≤ M*/M⊙ ≤ 1011.5 and redshifts 0.025 ≤ z ≤ 0.05. Each member of the GASS sample was observed in H i until detected or until an upper limit on the gas fraction (M|$_{\rm H\,\small {I}}$|/M*) of 0.01–0.05 was reached. Since GASS did not target galaxies already detected by ALFALFA, the observed sample lacked the most gas-rich objects that needed to be added back in proportions related to the ALFALFA detection fractions in the GASS parent sample (see Catinella et al. 2010, for complete details). This yielded the GASS representative sample (760 galaxies) that was based on statistics estimated from the 40 per cent data release of ALFALFA (Haynes et al. 2011) and also included the H i digital archive (Springob et al. 2005). With the recent 70 per cent data release (AA701) of the ALFALFA blind H i survey, we revisited the GASS representative sample to just include homogeneous AA70 observations and updated detection fractions. It is important to remind the reader that by construction, the representative sample still has as flat a stellar mass distribution as the original GASS sample. The updated GASS representative sample includes 781 galaxies.
Galaxies in the GASS-low sample are selected from a parent sample extracted from Sloan Digital Sky Survey Data Release 7 (SDSS DR7; Abazajian et al. 2009) having stellar masses 109 ≤ M*/M⊙ < 1010.2 and redshifts between 0.01 ≤ z ≤ 0.02. 208 galaxies selected randomly were observed with the Arecibo radio telescope. We followed the same gas fraction limited strategy as GASS, but without imposing a flat stellar mass distribution. This is because at these masses, the stellar mass function is flatter and we sample almost equally all the stellar mass range of interest by construction. As in the case of GASS, for GASS-low, we did not re-observe galaxies already detected by ALFALFA and we created a representative sample following an analogous procedure. The final xGASS representative sample, which includes both GASS and GASS-low samples, contains ∼1200 galaxies.
No environmental or other criteria are imposed on the GASS or GASS-low sample selections. Complete details of the xGASS sample selection and its properties are included in Catinella et al. (in preparation).
With its large (3.5 arcmin) beam, the Arecibo H i observations are susceptible to source confusion if multiple galaxies are nearby each other on the sky and have similar recession velocities. Each of the H i-detected xGASS targets are carefully checked and flagged if they have significant confusion from sources within ∼2 arcmin in projection (where the beam power drops to half its peak) and within ∼200 km s−1 in recession velocity. We also flag targets with more distant contaminants if the nearby sources are particularly gas-rich galaxies. Non-detections in xGASS are not checked for confusion. In all, we identify ∼10 per cent of xGASS targets as significantly impacted by confusion in H i (for complete details, see Catinella et al., in preparation). In this analysis, we only consider the non-confused sample; Appendix B shows the small changes to our results if these confused galaxies are not removed.
As will be discussed in Section 4, the xGASS sample only contains N = 38 non-confused low-mass (M*/M⊙ < 1010.2) central galaxies in groups. To improve these statistics, we searched for additional group central galaxies within the xGASS mass and redshift range in the Yang et al. (2007) group catalogue (see Section 4). We matched these galaxies to H i observations from AA70, several of which were already included in our xGASS representative sample. However, we found an additional 20 low-mass group central galaxies that were not included in xGASS, of which 17 are detected in H i by AA70, and 3 are non-detections. Because this sample of central galaxies is nearly complete in H i, we decided to include these 17 detected sources in our analysis and refer to them as the ‘AA70gcent’ population. The potential effects of the three undetected galaxies are small. If these were observed to have extremely low H i masses, our primary results would only weakly be affected, as our sample includes 55 low-mass group central galaxies.
In this work, we combine the xGASS and AA70gcent samples, removing H i-confused galaxies, those with no estimates of SFR (see Section 3) and those not matched in the group catalogue (see Section 4). This leaves a final sample of N = 1080 galaxies, of which there are 234 central galaxies in groups and 525 in isolation.
We also use CO(1–0) observations of a subset of the xGASS sample to estimate their molecular hydrogen (H2) content. These observations come from the CO Legacy Data base for the GASS survey (COLD GASS; Saintonge et al. 2011) and its low-mass extension (COLD GASS-low; Saintonge et al., in preparation). Analogously to COLD GASS, the low-mass extension is a follow-up of a random subset of GASS-low, hence its M* and z intervals are identical for xGASS and xCOLD GASS. The xCOLD GASS sample provides H2 estimates for ∼400 of the galaxies in xGASS. Full details about xCOLD GASS and its properties are included in Saintonge et al. (in preparation).
3 SFR DETERMINATION
In addition to the observations of the atomic and molecular gas for galaxies in our sample, we are also interested in quantifying the star formation processes underway in these objects. In an ideal dust-free galaxy, its ultraviolet (UV) luminosity would be an excellent tracer of recent (<100 Myr) star formation. However, dust absorbs up to ∼70 per cent of the UV flux and re-emits it at mid-infrared (MIR) wavelengths, requiring a correction to UV SFRs (Buat et al. 1999; Burgarella et al. 2013). Dust emission and absorption vary as a function of galaxy properties, so multiwavelength observations and corrections are required to determine the total SFRs in a sample of galaxies (e.g. Boquien et al. 2016).
Towards that end, we generate total SFRs for all galaxies in our sample using both UV and MIR observations. While there are a variety of well tested and statistically robust existing multiwavelength star formation indicators (e.g. the recent UV+MIR SFRs from Salim et al. 2016), the galaxies in our sample are too nearby and too extended to fully rely on automated MIR catalogue photometry, which is typically best suited for measuring fluxes of point-sources. Our total SFRs are determined using standard SFR indicators from UV (Schiminovich et al. 2007) and MIR (Jarrett et al. 2013) luminosity conversions, and include a correction for stellar MIR contamination (Ciesla et al. 2014). All luminosities are computed using luminosity distances determined from the SDSS redshifts for each source.
Our UV fluxes come from the Galaxy Evolution Explorer (GALEX; Martin et al. 2005; Morrissey et al. 2007) that collected UV images and spectroscopy from 2003 to 2012. We find matches to our sources from catalogues available in the GALEX CasJobs interface,2 including both the Bianchi, Conti & Shiao (2014) Catalogue (BSCAT),3 the GALEX Unique Source Catalogue (GCAT)4 and the GR6+7 data release5 to obtain observations from the Medium Imaging Survey (1500 s exposures) and All Sky Imaging Survey (100 s exposures). Given multiple NUV observations of the same target, we choose the GCAT measurements over the BSCAT measurements, and the MIS observations over the AIS observations. We use the ‘auto’ flux measurements within Kron-like elliptical apertures that are suitable for extended objects. GCAT-MIS provides fluxes for ∼60 per cent of our sample, GCAT-AIS provides ∼30 per cent, BSCAT-MIS and BSCAT-AIS together provide ∼1 per cent, GR6+7 provides ∼2 per cent and 14 objects do not have any UV flux measurements from GALEX.
Our MIR fluxes come from the Wide-field Infrared Survey Explorer (WISE; Wright et al. 2010), that mapped the whole sky between wavelengths of 3.4 and 22 μm. Its large angular resolution (6 arcsec/12 arcsec) means that most of its detections are unresolved, and the AllWISE data release6 includes only profile-fit flux measurements. While the AllWISE stacking process further blurs the images (to 10 and 17 arcsec), most of our targets are still resolved at this scale, so we are unable to use the profile-fit measurements. Instead, we perform aperture-photometry on the atlas images using SExtractor (Bertin & Arnouts 1996), and use ‘AUTO’ fluxes measured in Kron-like elliptical apertures. We use the w3 (12μm) and w4 (22μm) images and find that ∼90 per cent of our sources are detected in w3, and ∼60 per cent are detected in w4 which has coarser resolution and is less sensitive.
To ensure that our MIR flux measurements are not contaminated by neighbours, we flag all sources that SExtractor identifies as blended, and also those which have apertures overlapping by more than 25 per cent with a neighbour that has at least 25 per cent as much flux as the target (using a geometric algorithm from Hughes & Chraibi 2014). This identifies 46 w3 sources and 22 w4 sources as possibly contaminated.
We apply the standard aperture corrections (Jarrett et al. 2013) to our SExtractor ‘AUTO’ magnitudes of ± ∼0.03 mag, and corrections for Galactic Extinction in w1 and w2 (∼0.01 mag; Schlafly & Finkbeiner 2011), but not in w3 and w4 as they are negligible. We also include a colour correction to w4 of ∼0.1 mag when w2−w3 ≥ 1.3 mag, as recommended by Jarrett et al. (2013).
For all of the galaxies in our sample with w4 detections, the stellar MIR correction was never larger than the w4 SFR. For ∼50 per cent of the ∼250 galaxies detected in w3 and not w4, the stellar correction was larger than the w3 SFR, so the MIR contribution to the total SFR was set to zero. These ∼125 galaxies are among the reddest in the sample (NUV−r > 4.5) and are distributed uniformly across the sample volume (with w3 flux errors ≤ 3 per cent). The w3 emission in objects like these can be entirely attributed to old stellar populations, and not to recent star formation.
We verified at this point that there were no systematic differences between SFRW3 and SFRW4 estimates for the objects that were detected and unflagged in both bands. SFRW4 is a more reliable tracer of the SFR; the 12 μm luminosity is more affected by emission from polycyclic aromatic hydrocarbons and old stellar populations (Calzetti et al. 2007; Engelbracht et al. 2008), and its stellar MIR contamination correction factor is correspondingly larger.
Combined, this gives total SFRs for ∼70 per cent of the xGASS sample. For the remaining ∼30 per cent of sources where good MIR and NUV observations are not both available, we use SFRs determined from the SED fits of Wang et al. (2011), when available. For seven central galaxies in our sample, neither accurate NUV flux measurements nor SED-fitting SFRs are available. For the three galaxies with MIR-only detections, we compute MIR-only SFRs that are larger than the SFRs from MPA/JHU by 0.1–0.4 dex. We exclude four galaxies from our analysis for which none of the above methods can be applied, mainly as a result of blended sources. These four central galaxies are shown in Appendix B and their exclusion does not change our results.
We compared the UV+optical SED SFRs and the NUV+MIR SFRs for the sources in common and found that the SED SFRs are systematically 1.49 times larger than the NUV+MIR SFRs. We have appropriately corrected the SED SFRs to be consistent with the full NUV+MIR SFRs.
To further verify the SFRs determined from NUV+MIR photometry, we applied this same method to the H i-selected sample of Van Sistine et al. (2016), who determined SFRs from narrow-band H α imaging of ∼1400 nearby galaxies. For the ∼400 galaxies from their sample that have reliable and unflagged MIR+NUV observations, we find good agreement between the H α and MIR+NUV SFR estimates (across three orders of magnitude). The best-fitting line (in log-space) between these measurements has a slope of 0.95, an intercept of −0.01 and a scatter of ∼0.2 dex.
4 ENVIRONMENT METRICS
We use multiple metrics to evaluate the environment of the galaxies in our sample. Different metrics are sensitive to different aspects of environment, each affecting galaxy evolution in different ways.
First, we use the group catalogues of Yang et al. (2007) to identify whether galaxies are central (most massive) in their groups,7 satellite members of their group or not in a group. Yang et al. (2007) used a halo-based group finder (including enhancements to typical friends-of-friends algorithms) to identify groups in SDSS Data Release 4 (Adelman-McCarthy et al. 2006). An updated version based on DR7 (Abazajian et al. 2009) has been made available online.8
Yang et al. (2007) produce three versions of their DR7 group catalogue, including increasingly more objects from decreasingly reliable sources. Their ‘A’ catalogue includes only SDSS DR7 spectroscopic redshifts, ‘B’ adds spectroscopic redshifts from other surveys9 and ‘C’ adds ‘nearest-neighbour’ redshifts that are assigned to objects without spectra (due to fibre collisions) based on the redshifts of their nearest neighbours. Zehavi et al. (2002) find that in ∼40 per cent of cases, these assigned redshifts are significantly inaccurate. We adopt the ‘B’ catalogue as it is less contaminated by faulty redshifts than ‘C’, but more complete than ‘A’ (see also Section 3.2 of Skibba et al. 2011). Our results are not strongly dependent on this choice (see Appendix B).
As mentioned in Section 2, due to the scarcity of low-mass (109 ≤ M*/M⊙ < 1010.2) group central galaxies in xGASS, we supplement the sample with additional galaxies with H i observations from AA70. The xGASS representative sample already includes ALFALFA H i observations in the correct proportions, but we here consider the entire AA70 footprint (within 0.01 ≤ z ≤ 0.02) and include the additional 17 low-mass group central galaxies (AA70gcent) in our analysis.
All but 24 of the galaxies in our sample (xGASS+AA70gcent) are matched to members of the DR7 group catalogue ‘B’ of Yang et al. (2007). These 24 are typically unmatched because of their proximity to bright stars or survey edges, and are not included in our analysis. We also correct ‘false pairs’ from this catalogue, which are the cases where a single galaxy is broken into multiple objects, each separated by less than their own size (Skibba et al. 2009). After visual inspection, we find that a similar threshold identifies ∼20 false pairs in the ‘B’ catalogue, and we remove the smaller objects of each pair (see Appendix A for a list of changes to central galaxies in our sample). Some of these were identified as central galaxies in groups of N = 2, so were corrected to become groups of N = 1. Others were satellite galaxies in groups, so their group sizes are reduced by one. In one case (GASS 109081), a central galaxy in a group (of N = 5) has been shredded into three galaxies, so the group size is corrected to N = 3.
Having made these corrections, we can now characterize the xGASS+AA70gcent sample (now excluding galaxies that are confused in H i or have no SFR estimate) in terms of environmental identities. We find that ∼30 per cent are classified as satellite galaxies in groups (and not discussed further in this study), ∼50 per cent are identified as isolated central galaxies and ∼20 per cent are identified as group central galaxies (i.e. the most massive galaxy in their group), with at least two group members. Fig. 1 shows stellar mass, halo mass and group multiplicity for the xGASS and AA70gcent samples, after removing all confused galaxies and those without SFR estimates. Half of the groups that host central galaxies in our sample have multiplicities (total number of galaxies in the group) of N = 2, and ∼80 per cent are small groups with N ≤ 4; only above M* = 1011M⊙ are the central galaxies found in large groups with N > 10 members.
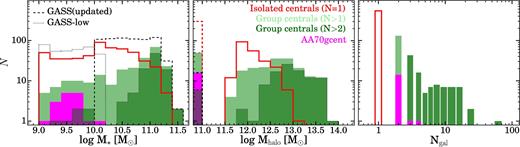
Left-hand panel: histograms of stellar mass for the GASS (dashed) and GASS-low (dotted) representative samples are shown in black. Central galaxies in our combined sample are shown in groups (shaded green) and isolation (red lines). Note that central galaxies are more frequent at larger stellar masses. Also shown are the 17 group central galaxies from AA70 (‘AA70gcent’). Centre panel: halo mass histogram for central galaxies by environment (central galaxies without assigned halo masses are shown as dashed histograms at Mh = 1011 M⊙). Right-hand panel: histograms of group multiplicity (the number of group members, Ngal).
At low masses (109 < M*/M⊙ < 1010.2), our group central galaxies are found exclusively in groups with 2–4 members: 89 per cent are found in groups of N = 2; 9 per cent in groups of N = 3, and 2 per cent in groups of N = 4. This distribution of multiplicities is similar to that of the full Yang et al. (2007) DR7 group catalogue, which includes ∼1300 group central galaxies within this mass range.
At higher masses (M*/M⊙ ≥ 1010.2), ∼75 per cent live in groups of N = 2–4 and the remainder are in larger groups up to N = 62. When we discuss results for group central galaxies, we include all groups regardless of multiplicity. At low stellar masses, our group centrals are dominated by N = 2 groups, while at high stellar masses, there are larger groups. We will distinguish the N = 2 and N > 2 populations to show which types of groups are driving the trends we see.
The group halo masses are assigned with an abundance-matching method and are only available for massive haloes with Mh ≳ 1011.5 M⊙ (Yang et al. 2007); smaller haloes do not have mass estimates.
It is worth noting that identifying galaxy groups (with ≲10 members) and assigning ‘central’ or ‘satellite’ identities to galaxies is increasingly difficult for smaller groups (Berlind et al. 2006). Studies using mock catalogues have shown that it is especially difficult to identify the galaxy at the centre of the halo (either as most massive or brightest) in the dark matter haloes of small groups. Skibba et al. (2011) used mock catalogues to show that the BGGs in ∼40 per cent of low-mass haloes (1012–1013 M⊙) are not located at the centre of the halo (i.e. the galaxy at the centre of the group's dark matter halo is not the brightest). The fraction of larger haloes (>1013 M⊙) with this discrepancy decreases to ∼25 per cent. Similarly, von der Linden et al. (2007) used SDSS observations of 625 galaxy clusters to show that ∼50 per cent of the BCGs are not at the centre of their cluster density fields. We bear these challenges in mind with our simple distinction between central and satellite galaxies based on their stellar mass ranking within their group.
Further complicating this picture is the possibility that central galaxies in small groups may experience multiple transitions between isolation and group environments. If two small isolated galaxies interact and become gravitationally bound, one will become a group central and the other a satellite. If they later merge, the resulting galaxy will become ‘isolated’ again. Park, Gott & Choi (2008) find that a significant fraction of isolated galaxies are actually the products of recent mergers, and that recent mergers are even more common among luminous isolated galaxies. These types of difficulties are inherent in any attempt to study the smallest galaxy groups, and must be kept in mind.
In addition to the group membership and environmental identity of the galaxies in our sample, we have also estimated the local density in fixed apertures around each object. This calculation is made using a sample of galaxies from SDSS DR7 (Abazajian et al. 2009) with M*/M⊙ ≥ 109 that fully encompasses the ALFALFA footprint (see section 2 of Brown et al. 2016, for more details). The local density around each target is determined by counting the number of galaxies within a 1 Mpc (projected) radius and 1000 km s−1 velocity difference. The projected densities are calculated in units of Mpc−2 and include the target galaxy itself (so have a minimum value of 1/π Mpc−2).
As a final check, we also verify that we are not being affected by undetected satellites around galaxies near the magnitude limit of our parent sample. Satellite galaxies are typically ∼2.5 mag optically fainter than their central galaxy, so we would be unable to detect any satellite galaxies around a central galaxy that is only ∼2.5 mag brighter than our magnitude limit (Lacerna et al. 2014). This could lead to an artificial increase in the fraction of isolated central galaxies in the faintest 2.5 mag of the sample.
To verify that this effect does not bias our results, we create a ‘bright’ subset of galaxies that only includes objects 2.5 mag brighter than the SDSS spectroscopic survey limit. At low masses (M*/M⊙ < 1010.2), ∼55 per cent of our central galaxies are included in this ‘bright’ subset, as are ∼75 per cent of central galaxies at high masses (M*/M⊙ > 1010.2). The isolated central galaxies in this ‘bright’ sample are more confidently isolated galaxies, and are not artificially isolated because their satellites are too faint to be detected. This ‘bright’ subset shows the same main relations and trends as the full sample, and is shown in detail in Appendix B.
5 RESULTS
5.1 Gas-rich central galaxies in small groups
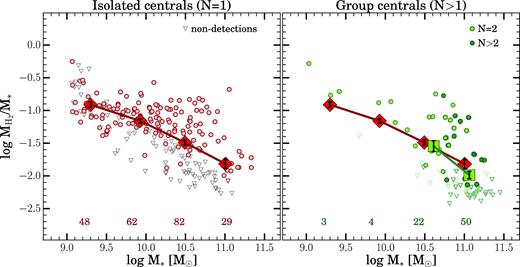
Our main goal is to understand the effects of the group environment on the H i properties of central galaxies. Towards that end, Fig. 2 shows the H i gas fraction (M|$_{\rm H\,\small {I}}$|/M*) as a function of stellar mass for central galaxies in our sample, separated between isolated (left-hand panel) and group (right-hand panel) environments. Across stellar masses, galaxies in both environments fully populate the ∼1.5 dex of H i gas fraction parameter space, but there are significant differences between the distributions. The average values of H i gas fraction in each stellar mass bin show a general decrease as a function of stellar mass, with lower mass galaxies being more gas-rich in both environments, as has been previously found (Kannappan, Guie & Baker 2009; Catinella et al. 2010; Cortese et al. 2011; Huang et al. 2012a; Brown et al. 2015, 2016).
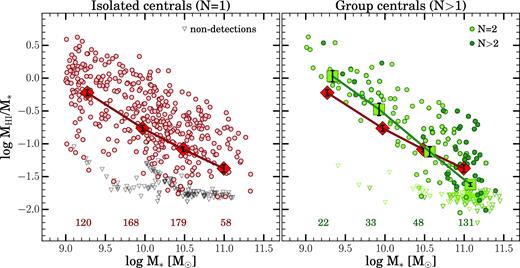
On both panels, H i gas fraction of our central galaxies is plotted as a function of stellar mass. For this and all subsequent figures, average values within bins are shown at the average x- and y-values of points within that bin, and error bars show standard error of the mean. Non-detections are included in averages at their upper limits. Left-hand panel shows isolated central galaxies while right-hand panel shows group central galaxies (N = 2 in dark green and N > 2 in light green); the average relations for isolated central galaxies are shown as large red diamonds in both panels and the averages for group centrals (at all multiplicities) are shown as large green squares. Open triangles show upper limits of non-detections; no H i-confused sources are included. Numbers at the bottom of both panels indicate how many galaxies were averaged in each bin. Heavy coloured lines connect averages of the logarithm of the H i gas fraction (〈log M|$_\mathrm{H\,\small {I}}$|/M*〉) in bins of stellar mass. At low stellar masses (M*/M⊙ < 1010.2), central galaxies in groups (green symbols) are rarely gas-poor and have H i gas fractions that are, on average, ∼0.3 dex larger than those in isolation (in red, both panels).
However, at low stellar mass (109 ≤ M*/M⊙ < 1010.2), the central galaxies in groups (shown as large green squares) have 0.3 dex larger average H i gas fractions than isolated central galaxies of the same mass (red diamonds), and are rarely found below the average value of the isolated galaxies. At these low masses, ∼90 per cent of the groups have multiplicity N = 2. We include non-detected galaxies at their upper limits averaging the H i gas fractions. At moderate masses (1010.2 ≤ M*/M⊙ < 1010.8), the group central galaxies have similar average H i gas fractions to isolated galaxies, and for M*/M⊙ ≥ 1010.8, they are more gas-poor than isolated galaxies.
In addition to the H i relations, we can also test for differences between the specific SFR (sSFR) of the central galaxies in groups and in isolation. H i and star formation are closely related (e.g. Kennicutt 1998), and we expect gas-rich galaxies to have higher sSFRs.
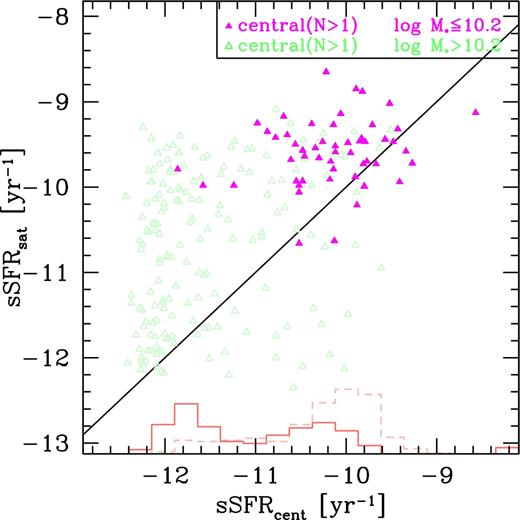
Fig. 3 shows the relationship between our sSFR estimates (described in Section 3) and stellar mass for our sample, divided by environmental identity. The average trends for sSFR in each environmental type are the same as those seen in the H i gas fraction plots. When comparing group central galaxies with isolated galaxies, those with low stellar mass show larger sSFRs by 0.2–0.3 dex.
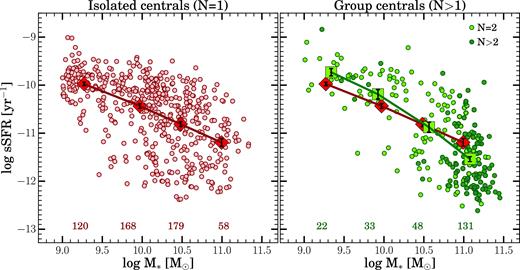
sSFR is plotted against stellar mass for central galaxies in both environments. The same galaxies are shown with the same colour-coding and averaging as in Fig. 2. The low-mass group central galaxies (shown in green) have sSFRs that are elevated by ∼0.2 dex compared with isolated central galaxies (shown in red, with average relation on both panels).
To better quantify the differences between group and isolated centrals, Fig. 4 shows the distributions of H i gas fraction and sSFR in bins of stellar mass. In the low-mass bin, the isolated central galaxies have a larger gas-poor population than the group central galaxies. Also shown are the p-values of a two-sided Kolmogorov–Smirnov test, which show that the group and isolated central distributions are significantly different. At low masses, the difference in average H i gas fraction between the group and isolated central galaxy populations is driven by a near-absence of gas-poor low-mass group central galaxies.
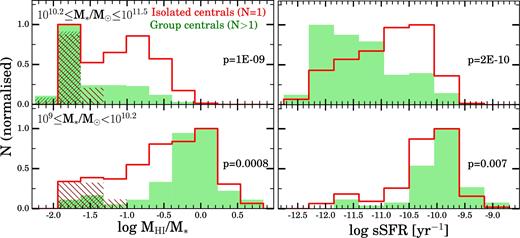
Each panel shows the H i gas fraction or sSFR distributions in large bins of stellar mass (ranges shown at top left). Group central galaxies are shaded in light green and isolated central galaxies are heavy red lines. All histograms are normalized to have the same peak value. In the left-hand column, non-detections in both environments are shown as shaded regions; no H i-confused sources are included in any panel. Also shown are the p-values from a two-sided Kolmogorov–Smirnov test comparing the group and isolated central galaxies (including H i non-detections at their upper limits). These distributions quantify the sSFR and H i differences between central galaxies in groups and in isolation.
5.2 Consistency with H i stacking and sSFR relations in larger samples
Given the inherent difficulties associated with identifying the smallest groups of galaxies (see Section 4) and the relatively small number of galaxies in our sample, we next explore ways to verify the properties of these low-mass group central galaxies with larger statistical samples.
First, to reach beyond the limits of our sample of H i-detected galaxies, we use an H i spectral stacking technique on a much larger sample of galaxies drawn from the ALFALFA blind H i survey. While the survey depth is insufficient to detect individual galaxies in the gas-poor regime, stacking many H i spectra can produce a statistical detection below its nominal sensitivity limit. We compare with the sample of N ∼25 000 H i spectra from and following the methodology of Brown et al. (2015) again using the Yang et al. (2007) DR7 group B catalogue to test whether this same difference is observed. We include any central galaxies that match our sample selection (i.e. between 109 ≤ M*/M⊙ < 1010.2 and 0.01 ≤ z ≤ 0.02, or between 1010 ≤ M*/M⊙ ≤ 1011.5 and 0.025 ≤ z ≤ 0.05) find ∼2400 in groups and ∼11 000 in isolation.
To avoid possible H i confusion in the stacking process, galaxies are not included in stacks if they have a neighbour within a projected separation of 2 arcmin and velocity difference smaller than ±200 km s−1regardless of their optical colour. This threshold is quite conservative, as the Arecibo beam power is at half its peak at this radius and red galaxies would be unlikely to contribute any H i flux to the observed H i signal. None the less, this confusion criterion eliminates ∼1 per cent of isolated central galaxies and ∼15 per cent of galaxies in groups, but still gives a statistically robust sample. As an additional test, we used even more aggressive thresholds of 3 arcmin and 300 km s−1, and the results are unchanged. While the confusion-cleaned stacks include fewer objects, the results are more reliable.
As described in Brown et al. (2015), we start the stacking process by shifting individual HI spectra (both detections and non-detections) to a common rest-frame frequency. Next, we weight each galaxy's spectrum by its stellar mass to stack in units of H i gas fraction (see Fabello et al. 2011). In each stack, the resulting spectrum is a strong detection, with signal-to-noise ratios (calculated as the peak flux divided by the rms noise) between 12 and 74.
Fig. 5 shows the H i gas fraction as a function of stellar mass for central galaxies in isolation and groups, as measured by stacking the H i spectra of galaxies in each bin. We stack the xGASS spectra in the same manner as the ALFALFA sample (including the same 2 arcmin and 200 km s−1 threshold cuts for confusion, which reduce the number of xGASS objects in each bin compared with Fig. 2). Because stacking is inherently a linear process, Fig. 5 shows the logarithm of the average H i gas fraction (log 〈M|$_\mathrm{H\,\small {I}}$|/M*〉), while our previous Fig. 2 showed the average of the logarithm of the H i gas fraction (〈log M|$_\mathrm{H\,\small {I}}$|/M*〉).
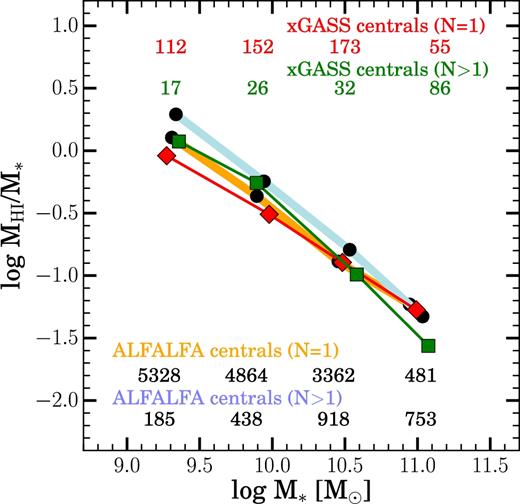
The logarithm of the stacked H i gas fraction (log〈M|$_\mathrm{H\,\small {I}}$|/M*〉) is plotted as a function of stellar mass for central galaxies in isolated (N = 1, thick orange line) and group (N > 2, light blue line) environments. Isolated (red line and points) and group (green line and points) central galaxies from our sample are also shown (confused galaxies are removed from both samples). Jack-knife estimates of uncertainties are not plotted on individual points, but are comparable to the size of the symbols. The number of galaxies in each stacked bin is shown at the bottom. The relations from the H i stacking sample show the same difference between the gas fractions of low mass central galaxies in groups and in isolation.
There is good agreement between the trends seen in the stacked xGASS H i gas fraction relations and those from the ALFALFA sample of Brown et al. (2015). In both samples, the low-mass (109 ≤ M*/M⊙ < 1010.2) group central galaxies have H i gas fractions that are ∼0.2 dex higher than isolated central galaxies of similar mass. In the highest mass bin (1010.8 ≤ M*/M⊙ ≤ 1011.5), the group central galaxies in xGASS have a lower average H i gas fraction by ∼0.25 dex than those in the stacked sample. This offset results from the difference in stellar mass distributions between xGASS (selected to have a flat distribution of M*) and the ALFALFA sample (volume-limited, with a steeper power-law decline at these masses). Within this bin, the xGASS galaxies have ∼0.1 dex lower sSFRs than those in the ALFALFA stacking sample. The disagreement between stacked xGASS and ALFALFA group central galaxies at high masses is a result of different sample selection, but both samples show an offset between group and isolated central galaxies at low masses.
To confirm our observed sSFR differences in a larger sample of galaxies, we use the MPA/JHU galaxy catalogue and the DR7 group catalogue of Yang et al. (2007), selected within the same stellar mass and redshift ranges as our sample. In this comparison, we also use the MPA/JHU sSFR estimates for galaxies in our sample, for consistency, between SFR calibrations. Fig. 6 shows the relationship between sSFR and stellar mass, binned in the same way as Fig. 3. The behaviour of central galaxies in isolation and small groups is well matched between xGASS and the large MPA/JHU sample. This large sample of ∼32 000 galaxies contains ∼3000 group centrals, ∼300 of which populate the lowest two bins of stellar mass.
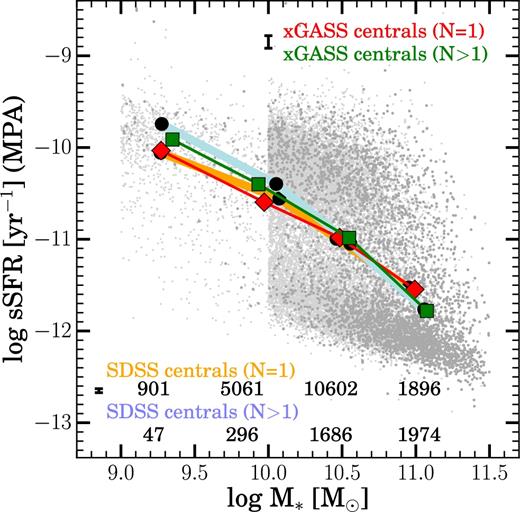
Average values of sSFR (from the MPA/JHU catalogue) are shown in bins of stellar mass for central galaxies. Relations from our sample are shown with thin lines as in Fig. 5. The SDSS central galaxies are shown as light grey (isolated) and dark grey (group) points, their average relations are shown as thick shaded lines and the number of galaxies in each bin are shown at the bottom. Heavy black error bars show the typical values of the standard error of the mean for each sample. The relations from the large comparison sample are in agreement with those from our sample, and again, the low-mass group central galaxies show larger sSFRs compared with those in isolation.
To summarize, the low-mass group central galaxies appear consistently elevated by 0.2–0.3 dex in H i gas fraction and sSFR, whether measured in our sample, in the H i stacking analysis, or in the MPA/JHU catalogue. This widespread agreement further confirms that these galaxies are unusually gas-rich and star-forming.
Next, we explore whether other properties of the low-mass group central galaxies (or their groups) might help explain their H i and sSFR properties. We consider the role of the group size (e.g. halo mass or multiplicity of members), the proximity of and star formation in their nearest satellite galaxy, and correlations with large-scale density measurements.
5.3 Trends with group multiplicity
Halo mass is an important property driving group evolution, and is closely related to hydrodynamical feedback effects like ram pressure stripping. However, it is very difficult to estimate the total dark matter halo mass in the small groups of our low-mass central galaxies. In particular, the DR7 group catalogue of Yang et al. (2007) does not provide any halo mass estimates for groups that have a central galaxy below M*/M⊙ < 1010.
Without group halo mass estimates for all of the central galaxies in our sample, we instead use group multiplicity to compare between different groups. At a fixed central galaxy stellar mass, there is a correlation between group halo mass and group multiplicity (for further discussion, see fig. B2 in Han et al. 2015). In this section, we compare central galaxies in groups of different multiplicity.
Fig. 7 shows the H i gas fraction as a function of group multiplicity (Ngal) for the central galaxies in our sample. The histograms against the y-axis show the H i gas fractions distributions for the isolated centrals at low (M*/M⊙ < 1010.2, in pink dashed lines) and high (M*/M⊙ ≥ 1010.2, as red solid lines) stellar masses. The average H i gas fractions of these two populations are shown as large dots and horizontal lines. Our group central galaxies at high (green) and low (magenta) masses are plotted against their group multiplicity. Averages within bins of group multiplicity are connected by thick lines.
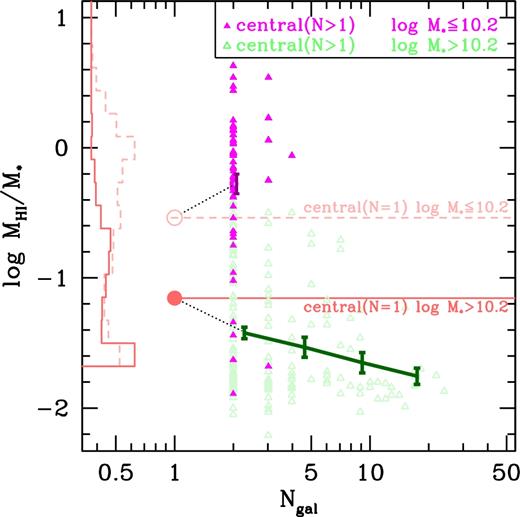
H i gas fraction as a function of Ngal for central galaxies. Isolated central galaxies (N = 1) are shown as red histograms against the y-axis in dashed (low-mass) and solid (high-mass) lines. Their average H i gas fractions are shown as open points and horizontal lines for comparison. Group central galaxies (N > 1) are shown as filled magenta triangles (low-mass) and open green triangles (high-mass), and average trends are shown with connected points. A dotted black line connects the relations between isolated and group environments. The trend among high-mass group centrals seems to smoothly continue up to the value of the isolated centrals. However, the low-mass group centrals are more H i-rich than comparable isolated galaxies.
The high-mass central galaxies (in green) show a continuously decreasing average H i gas fraction with group multiplicity from N = 1–20+, such that the most gas-rich high-mass central galaxies are those in isolation. The low-mass central galaxies do not follow this trend. Instead, the isolated low-mass central galaxies have lower average H i gas fractions than those in small groups, and the most gas-rich galaxies in this population are in groups of N = 2. Similar trends are also evident in sSFR as a function of group multiplicity, but are not plotted here. Additional explanation is required to show how a low-mass central galaxy with a satellite can be more H i-rich and star-forming than an otherwise similar isolated galaxy.
5.4 Characteristics of these small groups
Next, we explore the properties of the small groups that host our low-mass central galaxies that are unusually gas-rich and star-forming. We will explore whether they have any other unusual group properties that could explain the scarcity of H i-poor group central galaxies.
First, we consider the projected separation between our group central galaxies and their nearest satellites (dsat) to explore whether recent or strong interactions from nearby companions may be responsible for an enhancement in H i and SFR. Fig. 8 shows the H i gas fraction for central galaxies in our sample as a function of dsat, measured in kiloparsecs (in projection). Central galaxies are binned in two intervals of stellar mass, as in Fig. 7. Isolated central galaxies are shown as a histogram against the y-axis, separated by mass.
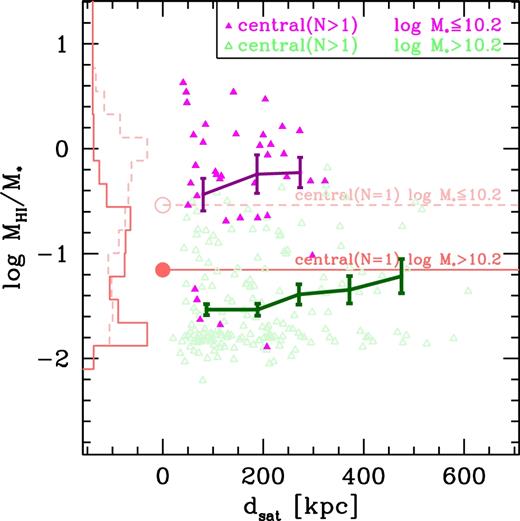
H i gas fraction is plotted as a function of projected separation between each central galaxy and its nearest satellite galaxy, using the same colours and styles as in Fig. 7. Averages and standard errors of the mean within bins are shown as connected points. A decreasing upper envelope is apparent across the full population; no strong trends are evident as a function of satellite distance.
The H i gas fractions of the group central galaxies at low and high masses show no strong trends with projected separation to their nearest satellite galaxy. Best-fitting linear relations (not shown) to both the low- and high-mass populations yield slopes consistent with zero (low-mass slope is −0.3 ± 0.7 Mpc−1, high-mass slope is 0.05 ± 0.25 Mpc−1). We also found no significant trends in sSFR as a function of dsat for these populations. The differences in the H i gas fraction and sSFR in the low-mass group central galaxies do not appear to be strongly dependent on having a nearby companion.
We next consider whether these small groups contain satellite galaxies that are unique in some way, which could lead to the differences we observe in the low-mass group central galaxies. This satellite galaxy population is not part of our sample – these are the satellite members of the groups (identified in DR7 group catalogue of Yang et al. 2007) that host the low-mass group central galaxies in our sample. We have obtained their optical photometry from the SDSS catalogue (Data Release 12; Alam et al. 2015) and their sSFR values from the DR7 MPA/JHU catalogue.
Starting from the population of group central galaxies in our sample, we identify the brightest satellite galaxy in each group. We compare the properties of each group central galaxy to its brightest satellite to see whether there are correlations that help to explain the differences between the group and isolated central galaxies. In terms of the stellar mass ratio between the brightest satellite and the group central, we find that our low-mass group central galaxies have 〈log M*, sat/M*, cent〉 = −1.09 ± 0.52. The broad distribution of mass ratios shows no trend with M* of the group central, with low- and high-mass group central galaxies showing a similar range and average mass ratios (about 10 per cent). From this, we can conclude that our population of low-mass group central galaxies are not members of groups with unusual mass ratios, but appear consistent with typical values. Larger groups (N > 4) have a narrower range of less extreme mass ratios with an average of 〈log M*, sat/M*, cent〉 = −0.40 ± 0.28 (all of these large groups have central galaxies with M*/M⊙ ≳ 1011).
We also compare sSFR values between group central galaxies and their brightest satellites in Fig. 9. Here the x-axis shows the sSFR of our group central galaxies and the y-axis shows the sSFR of their brightest satellite galaxies. As the stellar masses of satellites, by definition, are less than the stellar mass of their central galaxies, and lower mass galaxies typically have higher sSFRs, most of the points lie above the unity line (meaning that most satellite galaxies have a larger sSFR than their host central galaxies).
The x-axis encodes the sSFR of each group central galaxy in our sample and the y-axis shows the sSFR of its brightest satellite galaxy, which is not part of the xGASS sample. The same colour-coding is used as in Fig. 7 for high- and low-mass group central galaxies. Also shown on the x-axis are histograms of the isolated central galaxy population at low and high masses. The satellites of the group central galaxies in our sample typically have higher sSFRs than their host centrals, and this is especially the case for the low-mass group central galaxies (shown in purple).
The satellites of the low-mass group central galaxies appear to be consistent with this trend, and have higher sSFRs than their centrals in all but a few cases. Of the high-mass group central galaxies, ∼85 per cent have satellites with higher sSFRs. Similarly, ∼80 per cent of low-mass group central galaxies have a satellite with a higher sSFR. The satellite galaxies of the low-mass central galaxies have some of the highest sSFRs of any (brightest) satellites in this sample, which is not surprising as they are also some of the lowest mass satellites in this sample. This trend indicates that the low-mass group central galaxies have not become star-forming (or, by extension, gas-rich) at the expense of their satellites.
Finally, we also consider the local environmental density around each of the central galaxies in our sample, measured in 1-Mpc apertures (see Section 4). This type of density estimate represents a different environmental metric than isolated versus group categorization. Instead, the 1-Mpc scale density estimate relates to the nearby environment. This density measurement is not dependent on group-finding algorithms or any parametrization of large-scale structure, and instead simply measures the number of galaxies with M*/M⊙ ≥ 109 in the vicinity of each galaxy in our sample.
We find no significant trends in H i gas fraction or sSFR as a function of local density. For central galaxies in our sample, these 1-Mpc local density measurements span two orders of magnitude, from 0.3 to 50 galaxies per Mpc2. We note that the average differences in H i and sSFR between group and isolated central galaxies are still observed at fixed value of local density. That is, we find both group and isolated central galaxies distributed across all values of local density, and neither H i gas fraction nor sSFR shows a significant dependence on density.
5.5 H2 content of low-mass group central galaxies
While molecular gas observations are significantly more difficult to obtain than 21cm atomic hydrogen observations, the H2 properties of galaxies are critical to their star formation and evolutionary processes. Although H i is the fuel for star formation in galaxies, the detailed process of forming stars occurs in pockets of cold molecular gas (Kennicutt & Evans 2012), and molecular gas is observed to correlate much better with star formation than H i (Leroy et al. 2013, and references therein). Given this direct linkage between H2 and star formation, we explore whether the H2 observations of low-mass group central galaxies show similar differences as seen in H i and SFR.
Fig. 10 shows the H2 gas fraction versus stellar mass for group central galaxies separated by group multiplicity (compare Fig. 2). While it is immediately apparent that we have fairly poor statistics (less than a third of our sample has been observed in H2), it is still interesting to compare the findings. Even with only seven low-mass group central galaxies observed in H2, 6/7 have higher H2 gas fractions than the average of isolated galaxies at the same stellar masses. While this difference is only weakly significant, it is not inconsistent with our findings in H i and SFR. It suggests that the population of low-mass central galaxies in groups may have, on average, more molecular gas than those in isolation, as expected, given that their average H i gas fractions and sSFRs are also larger.
H2 gas fraction of central galaxies is shown as a function of stellar mass, for isolated (left-hand panel) and group (right-hand panel) environments. The same colours and averaging are used as in Fig. 2. Large symbols show averages within bins of stellar mass when there are more than 10 points in the bin. While there are only seven group central galaxies at low stellar mass (not enough for meaningful averages), these results are not inconsistent with the H i trends.
6 DISCUSSION
While previous works have shown that galaxies in groups have larger average SFRs over those in isolation at fixed stellar mass, this is the first study to show that there is also a difference in the H i content of galaxies in small groups as well. We have shown that low mass (109 ≤ M*/M⊙ < 1010.2) central galaxies in small (mostly N = 2) groups have larger average H i fractions compared to isolated central galaxies. This difference is driven more so by a relative lack of gas-poor group central galaxies, rather than by an enhancement in group central galaxies themselves. In the gas-rich star-forming regime, isolated and group central galaxies have similar H i and sSFR properties; it is largely in the gas-poor passive regime where group and isolated central galaxies differ. We next discuss and interpret this result and its place within the context of other studies of gas in galaxies across different environments.
Broadly, this difference in the H i properties of group central galaxies is consistent with the interpretation of the findings of Moorman et al. (2014) and Jones et al. (2016), who use the ALFALFA survey to measure the H i mass function in different environments. Both groups found that galaxies located in higher density regions (e.g. walls, filaments, groups) have 0.1–0.2 dex larger H i masses than those in low-density regions (e.g. voids). Even though they only probe the gas-rich regime and are not comparing galaxies at fixed stellar mass, there is broad agreement between these ALFALFA-based H i environmental studies and our deeper observations of central galaxies.
6.1 Connections to galaxy pairs and conformity
The differences we find in gas fraction and sSFR in low-mass group central galaxies are similar to enhancements observed in pairs of galaxies. Galaxy pairs are typically defined to have projected separations less than 100 kpc and velocity differences <350 km s−1 (Lambas et al. 2003), with some studies of interacting pairs reaching even smaller separations (e.g. Wong et al. 2011). When compared with otherwise-similar non-paired galaxies, the SFR in galaxy pair members is typically enhanced by 10–20 per cent in pairs with up to 150 kpc separations (Patton et al. 2013), but with the strongest enhancements (up to 30 per cent) at the smallest separations (Wong et al. 2011). Local environment density also plays a role, as isolated pairs have greater SFR enhancements compared to those in higher density regions (Ellison et al. 2010; Wong et al. 2011).
In our sample, ∼30 per cent of our low-mass group central galaxies could be classified as galaxy pairs (i.e. they have only one satellite which is within a projected distance of 100 kpc and 350 km s−1 of velocity). As we have removed all sources with significant H i-confusion (see Section 2), we have effectively removed the closest pairs from our sample. These ‘pair centrals’ in our sample appear to be similar to the other low-mass group central galaxies, with an average satellite-to-central mass ratio of ∼10 per cent and following the same distribution of H i gas fraction (three of the five most H i-poor low-mass group centrals are in this category). Broadening the definition of pairs to include galaxies with separations up to 200 kpc would include ∼65 per cent of our low-mass group central galaxies. As was the case for the 100 kpc pairs, these wider pairs are also similar to the full sample, and have larger average H i gas fractions than isolated central galaxies.
This is consistent with Fig. 8 that shows that nearby satellite galaxies do not have a significant effect on the H i content of central galaxies in our sample. While the pairs in our sample do have higher average H i gas fractions, the low-mass group central galaxies of multiplicity N = 2 with larger separations (spatially or kinematically) are also more H i-rich on average. The enhancements in H i seen in previous studies of galaxies pairs are not enough to explain the H i properties of our population of group central galaxies.
Simulations of galaxies in pairs have also shown that their SFR is statistically enhanced compared with unpaired galaxies, and the SFR enhancement depends sensitively on the orbital parameters of the galaxy–galaxy interaction (Perez et al. 2006). The tidal and hydrodynamical interactions are the triggers for star formation and increase the gas consumption rate (Park et al. 2008). More recently, cosmological hydrodynamical simulations have found that galaxies in pairs also have higher H i gas fractions than similar unpaired galaxies (Tonnesen & Cen 2012). This gas enhancement is thought to be a result of gravitationally induced hydrodynamical effects that increase cold gas formation from the hot halo. Observations of low-metallicity gas in the inner parts of the discs of galaxy pairs also suggest that interactions may trigger inflows of metal-poor gas from the halo (Rampazzo et al. 2005; Kewley et al. 2010). These galaxy–pair interactions may be analogous to some of the early stages of galaxy pre-processing, and are an important component of group evolution.
When comparing the sSFRs of our group central galaxies with their brightest satellites (shown in Fig. 9), the low-mass population was not distinctive from the high mass; the 13 ‘pair centrals’ among these are also not unique or extreme. It appears that the groups hosting star-forming low-mass central galaxies also host star-forming satellite galaxies. Optical studies have found similar conformity in the optical colours of galaxies in groups and clusters (Kauffmann et al. 2010). Recently, H i studies have also found that H i-rich central galaxies are more likely to be found in H i-rich environments (Wang et al. 2015). Combined, our findings and these results suggest that the satellite galaxies in these small groups are likely themselves gas-rich, and have not been stripped in order to enhance their group central galaxies. Rather, our gas-rich low-mass group central galaxies likely live in groups that are also gas-rich, presumably as a result of their local environment.
6.2 The evolution of low-mass central galaxies
The stellar mass of a central galaxy and of its total halo are considered inter-related fundamental parameters that control the evolution of galaxies in groups. However, at low stellar masses and in small groups, some of the relations from larger galaxies break down. For example, central stellar mass is a good tracer of halo and clustering properties for only the most massive central galaxies (M*/M⊙ > 1011; Wang, Li & Jing 2016). For central galaxies in large haloes (Mh ∼ 1013M⊙), most of their stellar mass growth comes from mergers, while in smaller haloes (Mh/M⊙ ∼ 1011.3), they grow primarily through star formation (Zehavi, Patiri & Zheng 2012). Furthermore, the relationship between central galaxy stellar mass growth and halo mass growth shows a dependence on environmental density (Tonnesen & Cen 2015). At lower halo masses (i.e. in small groups) and lower stellar mass, the evolution of central galaxies depends most strongly on secular factors, such as the availability of gas and presence of star formation.
Low-mass central galaxies in small groups are only weakly feeling the quenching effects of their group environment, and are still strongly affected by their own internal evolutionary processes. With halo masses too low to quench star formation (e.g. Yang et al. 2013; Zu & Mandelbaum 2016, and references therein), these central galaxies are at an intermediate evolutionary stage between field and cluster environments. In groups this size and at these stellar masses, our low-mass group central galaxies are unlikely to host an active galactic nuclei (see e.g. table 1 of Ellison et al. 2008), and their star formation is not strong enough to remove gas through galactic winds. Between their mild environments and lack of central feedback, they are overall unlikely to rapidly lose their gas and will continue forming stars.
To better understand the possible evolutionary paths that allow these low-mass group central galaxies to remain more H i-rich than their isolated counterparts, we next look at the previous results from observations and simulations on the role of gas in galaxies across different environments.
6.3 Observing and modelling gas in groups
Using H i observations of 72 compact groups, Verdes-Montenegro et al. (2001) proposed an evolutionary sequence for gas in groups of galaxies (see their fig. 7). Their sequence begins with a compact group of a small number of mostly late-type gas-rich star-forming member galaxies that have a low level of interaction. Next, galaxy–galaxy interactions produce tidal tails and remove or redistribute the gas from the galaxies, and morphologically transform them as well. Finally, most of the galaxies have been transformed into gas-poor early-types and most of the H i left in the group is in the form of a hot halo. The groups that host the low-mass group central galaxies in our sample are comparable to groups at the beginning of this evolutionary sequence: their central and satellite galaxies still have ongoing star formation, and the central galaxies have significant amounts of cold gas. However, it is not clear when or if our group central galaxies will evolve into gas-poor early-types, as the members of these small groups are more spread out (and have longer dynamical times) than the compact groups of Verdes-Montenegro et al. (2001).
On larger scales, gravitational and hydrodynamical simulations can provide insight on the origin and evolution of these groups. According to structure formation theory, dark matter haloes above a certain mass collapse (Birnboim & Dekel 2003), material from their surroundings tends to form filaments that funnel it on to the centres of the haloes. This filamentary assembly is evident in dark matter-only N-body simulations (e.g. Aubert, Pichon & Colombi 2004) as well as in cosmological hydrodynamical simulations (e.g. Pichon et al. 2011), in which both satellite galaxies and cold flows of gas follow filamentary structures as haloes grow in the high-redshift Universe. At lower redshifts, satellite galaxies similarly trace the filamentary structures (Welker et al. 2016), and these inflows are continuous from cosmological scales down to galactic scales (Danovich et al. 2015).
The large-scale flows into galaxies and groups can be either cold gas or hot gas (e.g. Ocvirk, Pichon & Teyssier 2008). For galaxies with M*/M⊙ > 1010.3 and in groups of Mh/M⊙ > 1011.4, most of the accretion is in the form of hot gas (Kereš et al. 2005). However, for the low-mass galaxies in smaller groups, accretion along filaments provides the primary source of fuel for star formation in the low-redshift Universe (Brooks et al. 2009). Minor mergers of H i-rich galaxies also contribute significantly to the growth of low-mass galaxies (Lehnert, van Driel & Minchin 2016).
Most relevant to this work is the strong connection in simulations between group environments and filamentary structure in the cosmic web. It is likely that our low-mass group central galaxies are being fed by the filamentary structures in which they are embedded. Galaxy groups form at the intersections of these filaments. The groups grow as galaxies and gas fall in along the filaments and can feed the group central galaxies, making them more likely to be gas-rich than those in isolation.
At fixed stellar mass, a central galaxy in a group will have access to more gas than an isolated central galaxy. At higher stellar masses and in larger groups, there are various quenching mechanisms (e.g. Yang et al. 2013; Zu & Mandelbaum 2016, and references therein) that reduce the amount of cold gas in central galaxies, erasing any evidence of this enhancement. However, at low stellar masses and in small groups, this H i richness can persist in central galaxies and is observed for the first time in this work.
7 SUMMARY
We use a sample of central galaxies in groups and isolation to investigate the effects of environment on their cold gas and star formation properties. In particular, we find that low-mass (109 ≤ M*/M⊙ < 1010.2) group central galaxies have gas fractions and sSFRs that are larger than isolated central galaxies by 0.2—0.3 dex, at fixed stellar mass. This difference is driven largely by the gas-poor central galaxies that are found significantly more often in isolation than in groups. The distinction between group and isolated central galaxies is consistently found across multiple group catalogues, our H i stacking analysis and in larger samples of galaxies. These low-mass central galaxies are found in small groups (usually N = 2) whose satellite members also have larger sSFRs. As discussed in Section 4, identifying the central galaxy in small groups is difficult; in this work, we simply define central galaxies as the most massive member of a group.
These small, gas-rich, star-forming groups are found in moderately overdense environments (intermediate between isolation and clusters) and might represent an early stage of group evolution. Their low-mass central galaxies have a large H i gas reservoir that, as simulations suggest, is likely fed by gas infall along filaments or from earlier mergers of gas-rich satellites. Low-mass central galaxies in small groups have not yet grown large enough to experience significant environmental or internal quenching. As these groups continue to grow through star formation and mergers, their central galaxies will become less gas-rich.
Further work is needed using much larger samples of galaxies across environments and at moderate and low H i gas fractions. Note that without reaching very low H i gas fractions (and upper limits), the populations of central, isolated and satellite galaxies would have been indistinguishable. While time-consuming, these deep H i observations are vital for understanding the evolutionary path of galaxies between gas-rich field and gas-poor cluster environments.
Acknowledgments
We thank our anonymous referee for very helpful suggestions that have improved this manuscript. We thank Charlotte Welker and Katinka Geréb for helpful discussions.
SJ, BC, and LC acknowledge support from the Australian Research Council's Discovery Project funding scheme (DP150101734). BC is the recipient of an Australian Research Council Future Fellowship (FT120100660). AS acknowledges the support of the Royal Society through the award of a University Research Fellowship.
This research has made use of NASA's Astrophysics Data System, and also the NASA/IPAC Extragalactic Database (NED), which is operated by the Jet Propulsion Laboratory, California Institute of Technology, under contract with the National Aeronautics and Space Administration. This research has also made extensive use of the invaluable Tool for OPerations on Catalogues And Tables (topcat;10 Taylor 2005).
Some of the data presented in this paper were obtained from the Mikulski Archive for Space Telescopes (MAST). STScI is operated by the Association of Universities for Research in Astronomy, Inc., under NASA contract NAS5-26555. Support for MAST for non-HST data is provided by the NASA Office of Space Science via grant NNX09AF08G and by other grants and contracts.
Funding for SDSS-III has been provided by the Alfred P. Sloan Foundation, the Participating Institutions, the National Science Foundation and the US Department of Energy Office of Science. The SDSS-III web site is http://www.sdss3.org/.
SDSS-III is managed by the Astrophysical Research Consortium for the Participating Institutions of the SDSS-III Collaboration including the University of Arizona, the Brazilian Participation Group, Brookhaven National Laboratory, Carnegie Mellon University, University of Florida, the French Participation Group, the German Participation Group, Harvard University, the Instituto de Astrofisica de Canarias, the Michigan State/Notre Dame/JINA Participation Group, Johns Hopkins University, Lawrence Berkeley National Laboratory, Max Planck Institute for Astrophysics, Max Planck Institute for Extraterrestrial Physics, New Mexico State University, New York University, Ohio State University, Pennsylvania State University, University of Portsmouth, Princeton University, the Spanish Participation Group, University of Tokyo, University of Utah, Vanderbilt University, University of Virginia, University of Washington and Yale University.
Obtained from http://egg.astro.cornell.edu/alfalfa/data/
Note that we use ‘group’ to refer to both groups and clusters.
REFERENCES
APPENDIX A: MODIFICATIONS TO THE DR7 YANG et al. GROUP CATALOGue
As described in Section 4, we have identified cases of galaxy shredding and ‘false pairs’ in the DR7 Yang et al. (2007) group catalogue. To correct these, we have removed the smaller shredded component and retained only the main galaxy in the catalogue (and have re-computed all relevant group multiplicities and satellite separations).
We closely examine all of our central galaxies which are not confused in H i and identify those that are affected by shredding. For central galaxies in groups, we also examine their satellite galaxy members to identify any that have been shredded (leading to an inflated group multiplicity). When we find that galaxies have been shredded, we remove the shredded component from the catalogue (based on its NYU ID) and re-determine environmental identities and group multiplicities. Complete details about our corrections are listed in Table A1.
NYU IDs and other details for the cases of shredding among non-confused central galaxies from the ‘Group B’ DR7 group catalogue of Yang et al. (2007). Columns: (1) xGASS ID; (2) NYU ID of xGASS target; (3) original environmental identity of xGASS target; (4) corrected environmental identity; (5) group ID in Yang et al. (2007) DR7 B catalogue; (6) NYU ID of removed shredded component; (7) original group multiplicity of xGASS target; (8) corrected group multiplicity; (9) detailed description.
| xGASS | NYU ID | Env. | Env. | Group ID | NYU ID(s) | Ngal | Ngal | Comment |
|---|---|---|---|---|---|---|---|---|
| target | orig. | corr. | removed | orig. | corr. | |||
| (1) | (2) | (3) | (4) | (5) | (6) | (7) | (8) | (9) |
| 109081 | 2483120 | group | group | 6743 | 2483121, 2483122 | 5 | 3 | target is shredded into three components |
| 3917 | 150390 | group | group | 10448 | 150388 | 3 | 2 | target is shredded into two components |
| 123010 | 348076 | group | isol. | 22677 | 348078 | 2 | 1 | target is shredded – should be isolated |
| 109065 | 948834 | group | isol. | 30433 | 948833 | 2 | 1 | '' |
| 23070 | 1073305 | group | isol. | 32293 | 1073306 | 2 | 1 | '' |
| 39346 | 1423425 | group | isol. | 39398 | 1423426 | 2 | 1 | '' |
| 110013 | 1821976 | group | isol. | 41473 | 1821977 | 2 | 1 | '' |
In two cases (xGASS 109081 and xGASS 3917), our target is a group central galaxy and is shredded, which incorrectly increases its group multiplicity (by 2 and 1 galaxies, respectively). We remove the shredded components and re-compute the group multiplicities. In the remaining cases, our target galaxy is shredded into two sources, one of which is identified as a ‘group central’ and the other as a ‘satellite’. We remove the shredded component, correct the group multiplicity to N = 1 and change the environmental identity from ‘group central’ to ‘isolated central’ galaxy. In no cases were the satellites around (non-confused) xGASS group central galaxies shredded.
APPENDIX B: RESULTS WITH DIFFERENT SUBSETS/DATA SETS
The following paragraphs and figures describe and show confirmations of our main results using different subsets of our galaxies or different group catalogues.
First, Fig. B1 shows the stacked H i gas fraction scaling relations (compare Fig. 5) for our sample including confused objects and for the ALFALFA stacking sample (also including confused sources). Note that the average H i gas fractions of the xGASS group centrals (in green) increase by up to ∼0.15 dex relative to their values in Fig. 5, as additional gas is being included from nearby confused satellites. Overall, there is no significant difference from the stacking comparison with confused galaxies removed, and our main conclusions remain unchanged.

Same as Fig. 5, including all H i-confused galaxies from xGASS and the ALFALFA stacking sample. Green/red lines and dots show stacked values of H i gas fraction in bins of the xGASS central galaxies in groups (N > 1) and isolation (N = 1); blue/yellow lines and black dots show the same for the ALFALFA stacking sample. Our main results are unchanged when including H i-confused galaxies.
Next, Fig. B2 shows our main H i gas fraction and sSFR relations using only the ‘bright’ subset of central galaxies, as described in Section 4. These galaxies were selected to be at least 2.5 mag brighter than the SDSS magnitude limit, to insure that isolated galaxies are not ‘artificially isolated’ because their satellites lurk below the SDSS spectroscopic sample threshold. Our main conclusions are unchanged when considering this ‘bright’ subset.

Fig. B3 shows our main H i gas fraction and sSFR relations for central galaxies now including all H i-confused objects and those for which SFR estimates are unavailable. Again, our results and conclusions are not affected.

We have also compared our group identities and group sizes with the other versions of the DR7 group catalogues of Yang et al. (2007). As mentioned in Section 4, these versions are built using different numbers of objects with redshifts from a variety of sources. We consistently find that low-mass group central galaxies have larger average H i gas fractions and sSFRs compared with isolated centrals at the same stellar mass. Figs B4 and B5 show the re-creations of our key results from Figs 2 and 3 using different group catalogues to obtain the environmental identities of our galaxy sample. Included are the identities from DR7 Group ‘A’, ‘B’ and ‘C’ catalogues of Yang et al. (2007). Each version includes increasingly more galaxies (see Section 4). We also use finer environmental categories in these figures: instead of contrasting isolated central galaxies (N = 1) from group central galaxies (N > 1); here we separately show group central galaxies in groups of different sizes. As noted in Section 4, all central galaxies in groups with N > 4 have M*/M⊙ > 1010.8.
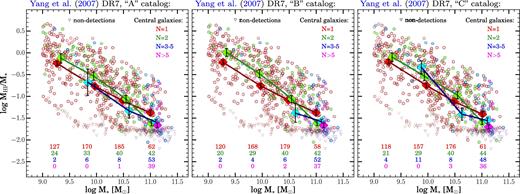
Same as Fig. 2, now using all three group catalogues from Yang et al. (2007). Here (and on Fig. B5), we plot isolated central galaxies in isolation (N = 1, red points) those in groups of different sizes, from N = 2 (green) to 3–5 (blue) and ≥5 (magenta). The elevated H i gas fractions at low stellar mass in group central galaxies are driven by the dominant population of N = 2 groups. No significant differences between catalogues are present and our main observational results are robust across group catalogues, and when considering groups of different multiplicities.
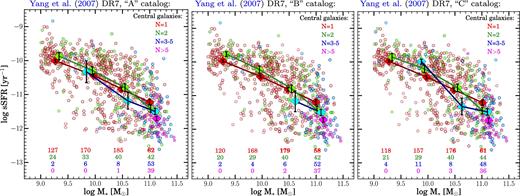
Same as Fig. 3, but using all three group catalogues. No significant differences between group catalogues are present and our main observational results are robust across group catalogues.
Regardless of the group catalogue used, we consistently see that at low stellar mass (M*/M⊙ < 1010.2), group central galaxies have elevated H i gas fractions and sSFRs compared with isolated central galaxies, and that this difference is largely driven by central galaxies in groups of N = 2.
