-
PDF
- Split View
-
Views
-
Cite
Cite
S. Alwin Mao, Jason Dexter, Eliot Quataert, The impact of non-thermal electrons on event horizon scale images and spectra of Sgr A*, Monthly Notices of the Royal Astronomical Society, Volume 466, Issue 4, May 2017, Pages 4307–4319, https://doi.org/10.1093/mnras/stw3324
Close - Share Icon Share
Abstract
Decomposing an arbitrary electron energy distribution into sums of Maxwellian and power-law components is an efficient method to calculate synchrotron emission and absorption. We use this method to study the effect of non-thermal electrons on submillimetre images and spectra of the Galactic Centre black hole, Sgr A*. We assume a spatially uniform functional form for the electron distribution function and use a semi-analytic radiatively inefficient accretion flow and a 2D general relativistic magnetohydrodynamic snapshot as example models of the underlying accretion flow structure. We develop simple analytic models that allow us to generalize from the numerical examples. A high-energy electron component containing a small fraction (few per cent) of the total internal energy (e.g. a ‘power-law tail’) can produce a diffuse halo of emission, which modifies the observed image size and structure. A population of hot electrons with a larger energy fraction (e.g. resulting from a diffusion in electron energy space) can dominate the emission, so that the observed images and spectra are well approximated by considering only a single thermal component for a suitable choice of the electron temperature. We discuss the implications of these results for estimating accretion flow or black hole parameters from images and spectra, and for the identification of the black hole ‘shadow’ in future millimetre-very long baseline interferometry data. In particular, the location of the first minimum in visibility profiles does not necessarily correspond to the shadow size as sometimes assumed.
1 INTRODUCTION
Using very long baseline interferometry (VLBI), the Event Horizon Telescope (EHT) project is, for the first time, attaining radio images that resolve event horizon scale structure around black holes. Such observations could detect the ‘shadow’ cast by the black hole on the emission from surrounding gas (Bardeen 1973; Falcke, Melia & Agol 2000), a signature of strong field gravity. The current objects of interest are the black holes with the largest angular sizes: supermassive black holes at the centres of nearby galaxies. In particular, Sagittarius A* (Sgr A*) at the centre of the Milky Way has the largest apparent size mostly due to its proximity (MBH ≃ 4 × 10⁶ M⊙ at a distance R0 ≃ 8 kpc; Chatzopoulos et al. 2015).
The observed image depends on the properties of the emitting particles near the black hole. The primary source of radio emission from the environment around Sgr A* is electron synchrotron radiation, and the nature of this emission depends on the energy distribution of the emitting electrons. Both the normalization and shape of the electron energy distribution are uncertain. Sgr A* radiates at a very small fraction (∼10−8) of its Eddington luminosity, due to both a low accretion rate (Agol 2000; Aitken et al. 2000; Quataert & Gruzinov 2000; Bower et al. 2003; Marrone et al. 2007) and likely a low radiative efficiency (e.g. Yuan, Quataert & Narayan 2003). The low accretion rate implies low particle densities and large mean free paths in the accretion flow. Since the Coulomb collision time-scale is much longer than the local dynamical time, it is expected that the electrons and ions do not remain thermally well coupled and there is no reason for the electron distribution function to be Maxwellian. Indeed, a small population of electrons accelerated to higher energies could explain the flat observed radio spectrum (Özel, Psaltis & Narayan 2000; Yuan et al. 2003).
Models of Sgr A* from magnetohydrodynamic (MHD) simulations often assume purely thermal distributions of electrons with a temperature set as a constant fraction of the ion temperature (Goldston, Quataert & Igumenshchev 2005; Mościbrodzka et al. 2009; Dexter et al. 2010), as a function of fluid properties such as magnetic field strength (Mościbrodzka & Falcke 2013), or by solving a separate electron energy equation (Sharma et al. 2007; Shcherbakov, Penna & McKinney 2012; Ressler et al. 2015). Alternatively, semi-analytic models have also used a hybrid thermal and power-law distribution function (Özel et al. 2000; Yuan et al. 2003; Broderick & Loeb 2006). More recently, Ball et al. (2016) considered injection of non-thermal electrons based on the local magnetic field strength. From fitting spectra and images with such models, one can obtain model-dependent estimates for parameters of the accretion flow and black hole, such as the accretion rate or black hole spin (e.g. Broderick et al. 2009; Dexter et al. 2010).
Here, we study the effects of a non-thermal distribution function on predicted submillimetre images of Sgr A*. We use relativistic radiative transfer calculations (Section 2), using two-sample distribution functions (Section 3) and models for the accreting gas (Section 4) to calculate sample images. We show that low energy electrons (below the brightness temperature for an event horizon scale angular size) do not necessarily contribute at all to the observed spectrum and image, leading to large uncertainties in accretion rate estimates from fitting models to data. In addition, even a small population of high-energy electrons can lead to an extended, low surface brightness ‘halo’ of emission (Section 5). The presence of this halo affects the inferred image size, and can modify or remove the null in the visibility amplitude caused by the presence of the black hole shadow. The image size can be understood analytically (Section 6) in terms of the overall fraction of the total thermal energy density in the highest energy electrons (Section 6.2), and so should apply to a wide range of possible distribution functions beyond the two specific examples studied here.
2 GRTRANS
We simulate EHT images, using the public relativistic radiative transfer code grtrans1 (Dexter 2016), which uses the public code geokerr (Dexter & Agol 2009, 2010) to perform ray tracing from an observer's camera to a simulated black hole and its accretion flow. Each pixel on the camera corresponds to a ray. Each point along each ray is assigned values describing the fluid, such as particle number densities, gas pressures, temperatures and magnetic field strengths, according to a fluid model (see Section 4). Then, grtrans solves the radiative transfer equation along each ray with those fluid values, assuming that the primary emission and absorption are electron synchrotron, and using a prescription for the electron energy distribution function (see Section 3). The result is a 2D image of the accretion flow, as seen from a distant observer. A Fourier transform of the image provides a visibility, simulating an observable from VLBI (in particular, the EHT). The image can also be summed, and multiple images at multiple frequencies can simulate a spectrum.
We use an image resolution of 150 × 150 pixels (rays) covering 50Rg × 50Rg with 400 points on each pixel (ray), which numerically converges with an accuracy at the few per cent level (Dexter et al. 2010; Dexter 2016). We pad the images with zeros to a size of 1024 × 1024, before performing Fourier transforms to improve the resolution in Fourier space. The simulation units are set by the black hole mass. For a given black hole spin, inclination and electron energy model, we adjust |$\dot{M}$| (or equivalently, the normalization of the particle number density in our fluid model) in order to match the observed 230 GHz (1.3 mm) flux, ≈3.4 Jy, following the approach of Mościbrodzka et al. (2009). Further constraints come from the spectral shape in the radio and infrared, the spectral index and angular size in the submillimetre. We consider these constraints when determining the allowed range of distribution functions (e.g. the fraction of internal energy in non-thermal electrons).
3 ELECTRON MODELS
We calculate images and spectra, using three-sample electron distribution functions: one thermal distribution, and two physically motivated extensions of this model to non-thermal distributions. For this work, we assume that the functional form of the electron distribution function is spatially uniform. Other complementary work (e.g. Ball et al. 2016) assumes that the energy fraction of the non-thermal electrons spatially varies with the strength of the magnetic field. This may arise from electron acceleration in magnetic reconnection or shock regions. We instead consider uniform injection as has been widely done for radiatively inefficient accretion flow (RIAF) models (e.g. Özel et al. 2000; Yuan et al. 2003) and is necessary to explain the radio spectrum of Sgr A* within these models. This simplification allows us to analytically understand how image properties connect to the electron distribution function (Section 6), while making predictions for the images and spectra arising from a spatially uniform electron distribution function. Because the electron synchrotron cooling time is long at the submillimetre wavelengths considered here, the non-thermal electrons are much more likely to be volume filling than electrons emitting at shorter wavelengths (e.g. infrared).
3.1 Thermal distribution
3.2 Power-law tail
The first non-thermal electron energy distribution, we investigate is a Maxwellian with a power-law tail of high energy electrons, following Özel et al. (2000) and Yuan et al. (2003). The physical picture is that the electrons are approximately thermal, but a small fraction is accelerated into a higher energy power-law tail.
Choosing p and η, we can solve this equation for the constant γmin/θ, which provides a simple linear relationship between γmin and θ. Moreover, the exponential behaviour of exp (−γmin/θ) causes the constant γmin/θ to vary slowly for a reasonable range p and η. For p = 3.5, the primary power-law tail we use, varying η 14 orders of magnitude between 0.5 × 10⁻¹⁴ and 0.5 results in only 1 order of magnitude change in γmin, from 46 to 4.6. Only the form (p − 2)η enters in equation (8), so that results for the submillimetre image at 230 GHz are also largely insensitive to the shape of the spectral tail (value of p). In particular, in the millimetre, electrons at energies ∼γmin are the most important, while p primarily affects the spectrum in the infrared.
In practice, equation (7) is numerically solvable for a variety of η, p and θ, and fairly simple fitting functions with tabulated coefficients can be used to precisely approximate γmin to within 4 per cent. The largest errors occur only for small (non-relativistic) values of θ, which are irrelevant in a largely relativistic fluid. We used the more accurate approach, solving equation (7) rather than equation (8).
Either of these approximate numerical techniques allows us to determine Npl and γmin at very low computational cost. A synchrotron emission model then determines the emission and absorption coefficients jν and αν, which is dependent on these power-law parameters (γmin, Npl and p). An example of a hybrid thermal and power-law tail electron energy distribution is depicted in Fig. 1.
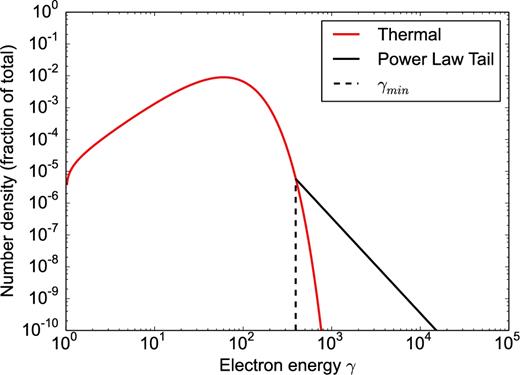
An example of a hybrid population of electrons as described in Section 3.2 with an electron temperature of θe = 30, non-thermal energy fraction η = 0.01 and power p = 3. The power-law tail begins at γ ≃ 300, ≃10 times the electron temperature.
3.3 Multi-Maxwellian model
In order to extend our study of non-thermal electrons to other electron energy distributions, it would be very useful to have a general technique for implementing an arbitrary electron energy distribution. Integrating over the electron energy distribution at all points along each geodesic would be the most general approach, but would require roughly 10 times the expense of our method for the same accuracy, assuming ≃100 energy bins for direct integration and ≃6–10 with component fits. The decomposition further allows us to calculate images and spectra separately for the various components, which we use in Section 6 to generalize the results here to arbitrary distribution functions and fluid models.
Instead, it would be possible either to (i) find fitting functions or calculate lookup tables for a desired non-thermal distribution function for desired parameter ranges, or (ii) describe non-thermal distribution functions as linear combinations of thermal and power-law distributions, for which we have good approximations for the emission and absorption coefficients (e.g. Mahadevan, Narayan & Yi 1996; Yuan et al. 2003; Leung, Gammie & Noble 2011). We find the second method more convenient to implement and so use it in this work. For example, the power-law tail distribution function combines a single Maxwellian distribution with a single power-law tail, and then finds the emission and absorption coefficients for the two distributions separately. Then, the net emission and absorption are calculated by combining the coefficients for each distribution.
Note that the total number density of electrons n should be equal to the sum of the number densities in each Maxwellian. Hence, |$n = \sum _{0}^{N-1} n_{i}$|, which makes it convenient to define |$c_{i} = \frac{n_{i}}{n}$|, where |$\sum _{0}^{N-1} c_{i} = 1$|. These normalized constants determine the shape of the electron energy distribution. Throughout this work, we use the coefficients {ci} = {0.017, 0.074, 0.225, 0.364, 0.228, 0.088}, which fit the electron distribution function from second-order Fermi acceleration at two different times (fig. 4 of Lynn et al. 2014) by changing δ from δ ≈ 2 to ≈3. An example of this distribution is shown in Fig. 2. The only case where we use a different set of coefficients is in Fig. 9, where ‘1/10 Maxwellian’ decreases c5 by a factor of 10 and renormalizes all of the coefficients.
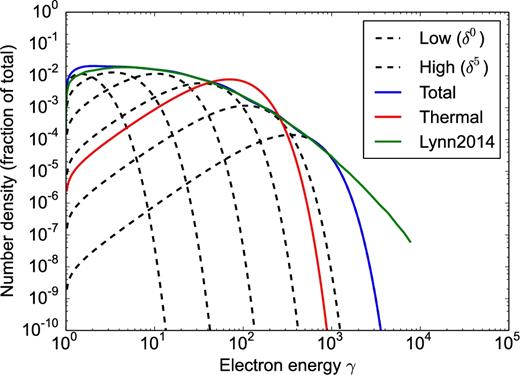
An example of the multi-Maxwellian model described in Section 3.3 for a population of electrons with electron temperature |$ \theta _{\rm e} = 35$| and spacing |$ \delta = 3$|. The component Maxwellians are shown in black dashed lines, and the total distribution function is shown in a blue solid line. Comparing the total multi-Maxwellian distribution to an equivalent thermal distribution (red solid line) with the same total electron energy and total number density, the total multi-Maxwellian distribution has more high-energy electrons, compensating by also including more low-energy electrons. The multi-Maxwellian distribution was produced by a fit to the curve taken from Lynn et al. (2014), as shown in green.
This method leads to a factor of <N slowdown compared to using a thermal distribution, from N calls to the thermal synchrotron radiation solver. Here N = 6, so this multi-Maxwellian approach is a computationally feasible method of implementing arbitrary non-thermal electron energy distribution models.
4 FLUID MODELS
Calculating model images and spectra using the distribution functions described above requires models for the state of the accreting gas near Sgr A*. We use two RIAF models (e.g. Narayan, Yi & Mahadevan 1995; Yuan et al. 2003) as example fluid models. One is a numerical solution of the general relativistic ideal MHD equations, while the other is a self-similar version of the solution found by Yuan et al. (2003).
4.1 HARM
We use a single snapshot of a general relativistic MHD solution for accretion on to a spinning black hole in axisymmetry with a spin of a = 0.9375, calculated using the public code harm (Gammie, McKinney & Tóth 2003; Noble et al. 2006). The code evolves the ideal MHD equations in a Kerr space–time starting from a torus of gas in hydrostatic equilibrium threaded with a weak magnetic field. The initial configuration is unstable to the magnetorotational instability (MRI), which leads to turbulence and stresses in the fluid, causing angular momentum transport outward and accretion on to the central black hole. The sample snapshot used here is from Dexter et al. (2010), and is from a time t = 2000GM/c3, once turbulence has developed in the gas but before it dies down due to the axisymmetric simulation grid.
We scale the dimensionless code units to cgs units as in previous work (e.g. Schnittman, Krolik & Hawley 2006; Noble et al. 2007; Dexter et al. 2010) by fixing the black hole mass and accretion rate. The accretion rate is chosen by normalizing the 230 GHz flux of the model to 3.4 Jy. The electron internal energy is set to a constant fraction of the total internal energy in the simulation (from electrons and ions). We denote this fraction as |$\frac{U_{\rm e}}{U_{\rm sim}}$|. For a thermal distribution function, this is equivalent to choosing a fixed ion–electron temperature ratio (Ti/Te).
Although we consider only a single simulation snapshot instead of averaging observables over time (e.g. as done in Mościbrodzka et al. 2009), we find similar results for submillimetre spectral indices and image sizes when using a thermal distribution function. This is not surprising, since for images and static spectra, 2D harm simulations have been shown to agree well with time-averaged, 3D calculations (Dexter et al. 2010) for these types of models. This is in contrast to models based on tilted discs (Dexter & Fragile 2013) or unstable jets (Medeiros et al. 2016) that exhibit a large degree of structural variability. The simulation used here is a reasonable example for our purpose of studying the effects of varying the electron distribution function. We use these fluid examples to test our analytic results described in Section 6.
4.2 SARIAF
For modelling Sgr A*, we choose β = 10 as a fiducial value and vary |$n^{0}_{{\rm e,th}}$| for a chosen |$T^{0}_{\rm e}$| to fix the 230 GHz flux at 3.4 Jy in the same way as choosing |$\dot{M}$| in the harm model described above. Total intensity-simulated images of Sgr A* using this model are in good agreement with those in Broderick & Loeb (2006) for similar parameters.
The radial dependence reflected in this model provides a convenient semi-analytic means to understand how different radii contribute to the overall size of an image of the accretion flow, or to the shape of a model spectrum. This is most apparent in Section 6.1, where we use the radial dependence in a SARIAF model to predict the size of an image. Furthermore, unlike the harm simulation data, which has a defined boundary, the SARIAF model is self-similar and so can be used at all radii. This is especially useful in our study of the size of EHT images, to ensure that the sizes we find from our simulations are not biased by artificial simulation boundaries.
5 RESULTS
To understand the impact of non-thermal electrons on model images of Sgr A*, we compare images from the harm simulation fluid snapshot at fixed flux for a thermal distribution function (Fig. 3) with the two non-thermal distributions described in Section 3 (Figs 4 and 5).
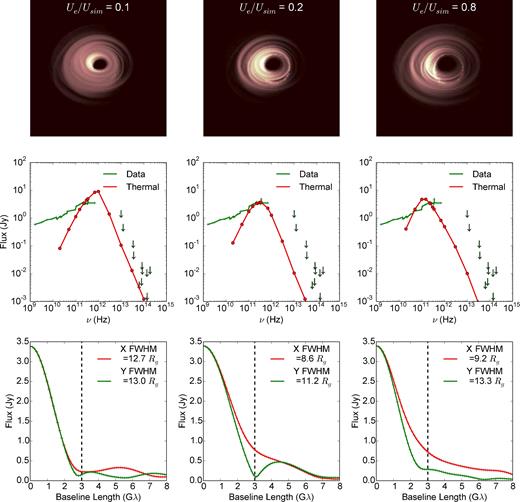
A sequence of purely thermal images (top), spectra (middle) and visibility profiles (bottom) from a harm fluid model of Sgr A* illustrating the effect of increasing electron temperature (left to right) at fixed 230 GHz flux density and inclination cos i = 0.7. The spectra (red lines and circles) are compared to Sgr A* data (green lines and upper limits as arrows) in the radio (Falcke et al. 1998; An et al. 2005), submillimetre (Marrone 2006; Bower et al. 2015) and infrared (Melia & Falcke 2001; Genzel et al. 2003; Dodds-Eden et al. 2011). Note that the image size minimum is at an intermediate temperature and that the spectral peak shifts to lower frequencies at higher temperatures. Images depict a 50 × 50 Rg (or 25 × 25 Rs) region. The red and green visibility profiles are for the X- and Y-axis in the image, respectively, representing the two extreme perpendicular axes. The full width at half-maximum (FWHM) size in real space is estimated by fitting a Gaussian to the visibility profile (Fourier space), inverting the size to the real space size and multiplying by |$2\sqrt{2\ln {2}}$| for the FWHM real space size. The vertical dashed line represents the predicted location (∼3Gλ) of a minimum in the visibility profile due to the black hole shadow.
5.1 Thermal distribution
Fig. 3 shows a sequence of 230 GHz harm images (top), spectra (middle) and visibility amplitude profiles (bottom) with fixed inclination i = 45° and increasing electron energy fraction (temperature). The spectra are plotted in comparison with Sgr A* radio (Falcke et al. 1998; An et al. 2005), submillimetre (Marrone 2006; Bower et al. 2015) and infrared data. The data points in the mid-infrared are true upper limits (Melia & Falcke 2001), while we treat the measured near-infrared mean (Dodds-Eden et al. 2011; Schödel et al. 2011) and flaring (Genzel et al. 2003; Dodds-Eden et al. 2011) flux density measurements as upper limits since their blue spectral shape and high amplitude, short time-scale variability characteristics are inconsistent with models like those shown here (e.g. Yuan et al. 2003; Dexter et al. 2010).
At low electron temperatures, the emission is optically thick and requires a larger emitting area to produce the observed flux at 230 GHz (left-hand panel). With increasing temperature, the photosphere recedes and the image size decreases (middle panel). At still higher electron temperatures (right-hand panel), the image is completely optically thin. Electrons further from the event horizon still have enough energy to significantly contribute to the image, and so the size increases again. At fixed 230 GHz flux, increasing the temperature then shifts the peak to lower rather than higher frequencies. This is an optical depth effect: at low temperature the flow is optically thick and so the spectrum at 230 GHz is similar in shape to a blackbody. At high temperature, the accretion flow is optically thin and so the spectral index is steep. This result was previously found in submillimetre models of Sgr A* by Mościbrodzka et al. (2009).
A prediction of general relativity is that a black hole should cast a shadow with apparent diameter ≃10Rg, roughly independent of the black hole spin (varying by ∼10 per cent with spin) or orientation, due to the location of the circular photon orbit and lensing effects (Bardeen 1973; Falcke et al. 2000; Takahashi 2004). Detecting this feature in millimetre-VLBI observations of Sgr A* (Falcke et al. 2000) is the main science goal of the EHT (Doeleman et al. 2009). Current mm-VLBI data are too sparse to be used for imaging, and instead models are fit to visibility amplitudes (the absolute value of the Fourier transform of the image). The minima at a baseline length of ≃3Gλ in the left (both orientations) and middle (green curve) panels of the bottom row in Fig. 3 correspond to the predicted feature of a sharp ring of emission at the location of the photon orbit (e.g. Dexter, Agol & Fragile 2009, modelled as a δ function of emission and shown as the dashed line). In many models, the minimum in the visibility amplitude at ≃3Gλ corresponds to the presence of bright emission surrounding the shadow (e.g. Bromley, Melia & Liu 2001; Broderick et al. 2009; Dexter et al. 2009, 2010; Mościbrodzka et al. 2009; Mościbrodzka & Falcke 2013; Chan et al. 2015).
It is clear from the bottom right-hand panels of Figs 3 and 4, however, that more complex image structure can move the minimum of the visibility profile away from the simple shadow prediction, or greatly decrease the contrast between the minimum and secondary maximum in the visibility amplitude, even though the shadow is still apparent in the centre of the top right-hand image. The presence or lack of the 3Gλ visibility minimum then, on its own, does not necessarily confirm or rule out the existence of a black hole shadow in the image. This has also been seen in previous work using thermal distribution functions, in which complex image structure and structural variability move the location of the visibility minimum (Dexter & Fragile 2013; Medeiros et al. 2016). The possible presence of non-thermal electrons adds another layer of uncertainty to its interpretation.
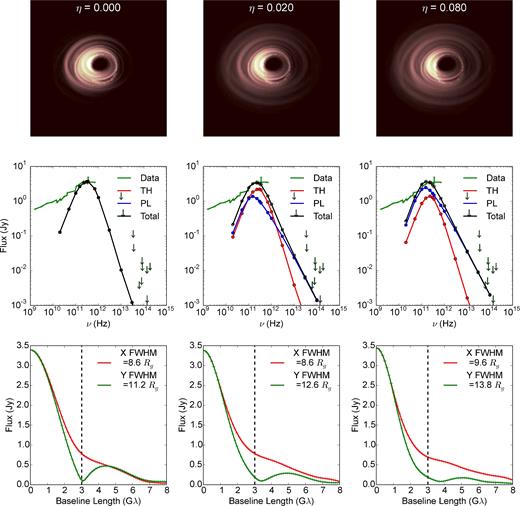
As Fig. 3 for hybrid images from purely thermal (η = 0) to a significant power-law tail component (η = 0.08). For all images Ue/Usim = 0.2. As the thermal core shrinks, the power-law diffuse halo grows with increasing η. Images depict a 50 × 50 Rg region. The total spectra (black, ‘Total’) are decomposed into the thermal (red, ‘TH’) and power-law (blue, ‘PL’) components and compared to Sgr A* data (green lines and upper limits as arrows). The data are described in Fig. 3. Since the 230 GHz flux is fixed to be 3.4 Jy, the higher η images are made with a lower number of densities.
5.2 Hybrid power-law tail
Fig. 4 shows a sequence of harm images from the hybrid distribution function (Section 3.2) with increasing η at fixed values of i = 45° and Ue/Usim = 0.2. The main effect of changing η is to increase the fraction of electrons in the power-law tail because the fraction γmin/θ remains relatively constant. Since power-law tail electrons have values of γ typically a factor of ≃3–10 higher than thermal electrons, they radiate more efficiently (P ∝ γ2). Thus, increasing η while keeping the 230 GHz flux fixed increases (decreases) the fraction of the total flux produced by power-law (thermal) electrons, and decreases the total number density of electrons. Importance of this effect is discussed in Section 6.1.
The lower flux produced by thermal electrons causes the thermal ‘central core’ of the images in Fig. 4 to shrink with growing η. The growing fraction of power-law flux is contained in a diffuse, low-intensity ‘halo’ component. The large size of this component is due to the efficient radiation of the high-energy power-law electrons out to a larger distance from the black hole, and is similar in appearance to images of single temperature Maxwellian models with large |$\frac{U_{\rm e}}{U_{\rm sim}}$| (see Fig. 3).
As η increases, the overall size of the image becomes larger. Furthermore, the spectrum becomes more like the power-law spectrum as the power-law contribution to the overall radiated flux increases. The power-law tail only requires a small fraction of the total internal energy (η ≳ 0.01) in order to have a noticeable impact on the images and spectra. The spectra found here agree with those from previous work (Özel et al. 2000; Yuan et al. 2003; Broderick et al. 2009).
Larger η also leads to a steeper 690/230 GHz (submm) spectral index. This is both because the power-law component typically peaks at somewhat lower frequency, and because decreasing the flux in the thermal component decreases its optical depth and so steepens its spectrum. Although the example spectrum in Fig. 4 nearly violates a few of the IR limits, this is a result of choosing p = 3.5 for the slope of the non-thermal power-law tail. Images with a steeper power law (e.g. p = 7) have less flux at high frequencies, but have similar 230 GHz images. This is because a small change in p does not alter γmin/θ or Npl very much, but it does remove the high-energy electrons producing near-infrared emission in the model.
The growing image size with increasing η is also reflected in the visibility profiles in Fig. 4. In addition to the overall size increasing, the first minimum in the profile changes in both location and contrast as the power-law halo becomes more prominent, even though the black hole shadow is apparent and of the same size in all images. Again this indicates that the location of a minimum in the visibility, if present, depends on the overall image size and shape, and so does not necessarily appear at the predicted location for a surrounding bright ring of emission.
Fig. 6 shows a contour plot of 690/230 GHz spectral index versus Ue/Usim and η. The observed flat submillimetre spectral index ≃−0.4 (Marrone 2006; Bower et al. 2015; Liu et al. 2016a,b) constrains the maximum value of η. This value is degenerate with the total internal energy of the thermal electrons. Although only one inclination is displayed, the maximum value of η for other inclinations is still a few per cent. Values of Ue/Usim below 0.1 require unrealistically high mass accretion rates in order to produce the observed 230 GHz flux, and in these cases η must be less than 0.06 to match the observed spectral index.
5.3 Multi-Maxwellian model
The top two panels of Fig. 5 show a sequence of images and spectra using the harm simulation fluid model and the multi-Maxwell distribution function with |$\frac{U_{\rm e}}{U_{\rm sim}}$| = 0.3 and with varying values of the width parameter δ. The spectra are decomposed into each of the six Maxwellian components. For values of δ ≳ 1.4 the highest temperature Maxwellian component dominates both the spectrum and the image.
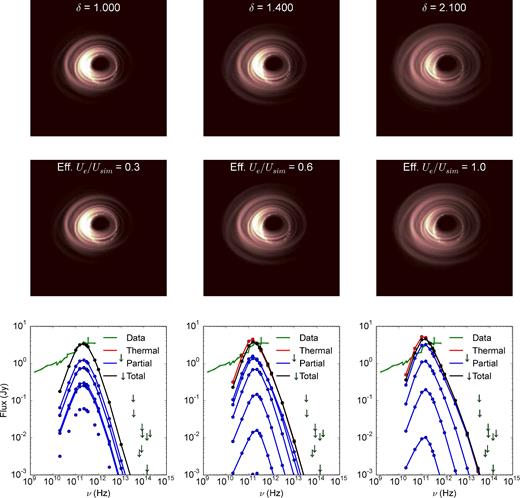
A comparison between Fermi acceleration multi-Maxwellian images (top) at fixed total thermal energy (Ue/Usim = 0.3), varying δ from 1.0 (thermal) to 2.1 (comparable to Lynn et al. 2014) and purely thermal images (middle). The thermal images have a temperature corresponding to the highest temperature Maxwellian in the multi-Maxwellian decomposition. The bottom panel compares the total multi-Maxwellian spectra in black to the thermal spectra in red. The spectra of the individual Maxwellian components are shown in blue. The spectra and images of this single-Maxwellian thermal counterpart are very similar to the multi-Maxwellian model demonstrating that for a sufficiently non-thermal distribution function, lower energy electrons can be completely hidden and not contribute at all to the millimetre images and spectra.
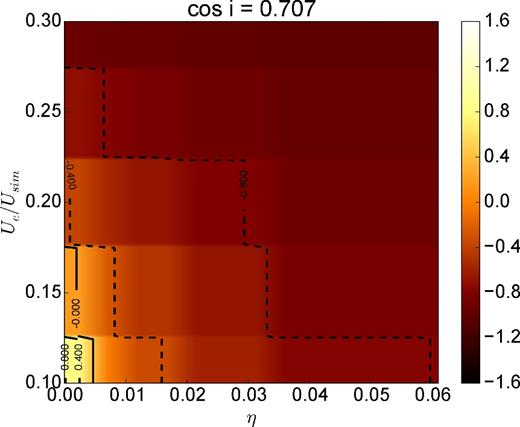
A grid of submillimetre 690/230 GHz spectral slopes for Sgr A* calculated from a harm simulation fluid model with hybrid electron distribution function, varying the power-law energy fraction η from 0 (thermal) to 0.06 and the electron energy Ue/Usim from 0.1 to 0.3. At fixed Ue/Usim, the spectral index becomes steeper for stronger power-law tail components. The observed spectral slope of −0.4 constrains the possible values of η (e.g. ≲0.03 in this example).
By using equation (11), the effective |$\frac{U_{\rm e}}{U_{\rm sim}}$| of the highest temperature Maxwellian component can be calculated for each value of δ by multiplying the overall |$\frac{U_{\rm e}}{U_{\rm sim}}$| = 0.3 by |$\delta ^{N-1}/\sum _{i=0}^{N-1} c_{i}\delta ^{i}$|.
We then make equivalent thermal images and spectra (bottom two panels of Fig. 5) using this effective electron temperature, and varying the total electron number density in order to normalize the flux at 230 GHz. Roughly, since the highest Maxwellian contains 8 per cent of the electrons, the equivalent thermal image number density is about 8 per cent of the total multi-Maxwellian model number density, as expected. However, it is not exact, because the number density is tied to the mass accretion rate and to the magnetic field strength, which affects the emission and absorption coefficients. Nonetheless, it is clear from the spectra in Fig. 5 that the highest temperature Maxwellian causes a small percentage of the electrons to dominate the image and spectrum.
The agreement between each multi-Maxwell image and spectrum with its equivalent thermal model is excellent, showing that despite the broad, non-thermal distribution function used in the middle and right-hand panels of Fig. 5, the results are almost identical to those from using a single temperature distribution function. However, the temperature and number density of this component do not follow in the normal way from the value of |$\frac{U_{\rm e}}{U_{\rm sim}}$| and |$\dot{M}$| chosen: the total number density in the multi-Maxwell model is much larger, due to the presence of lower energy electrons that do not contribute to the image or spectrum. Similarly, the temperature can be much higher than expected from the value of |$\frac{U_{\rm e}}{U_{\rm sim}}$| if δ is large.
Fig. 7 shows the 690/230 GHz spectral slope as a function of the highest Maxwellian temperature (TN − 1/Tsim) relative to the simulation temperature and temperature spacing δ in the multi-Maxwellian model. Although only one inclination is displayed, the qualitative dependence of the spectral slope on inclination is similar to that on the temperature: a low temperature is similar to an edge-on inclination. Both amplify the effects of absorption, and edge-on inclinations are predisposed towards larger spectral slopes at higher frequencies. Since the spectra and images are mostly determined by the temperature of the highest Maxwellian component, δ has little effect on the spectral slope.
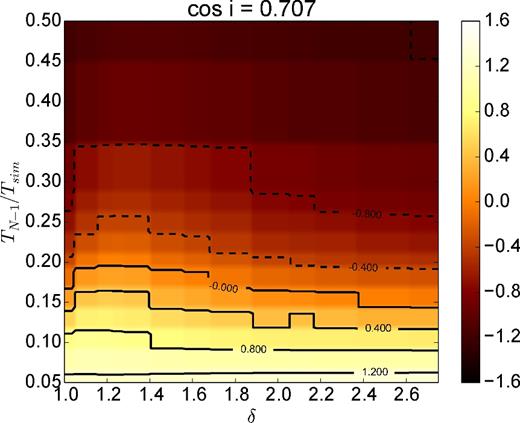
A grid of submillimetre 690/230 GHz spectral slopes for Sgr A* calculated from a harm simulation fluid model with a multi-Maxwellian electron distribution function, varying the temperature spacing δ from 1.0 (thermal) to 2.8 and the electron temperature of the highest Maxwellian relative to the simulation temperature (TN − 1/Tsim) from 0.05 to 0.5. The spectra are sensitive to the maximum electron temperature, but much less so to the width of the distribution function, since the highest temperature electrons often dominate. The observed spectral slope of −0.4 constrains the temperature of the highest Maxwellian.
6 ANALYTIC INTERPRETATION
For the thermal, power-law tail (Section 3.2) and multi-Maxwellian (Section 3.3) electron energy distribution models, an analytic approach can be used in tandem with a self-similar fluid description (e.g. the SARIAF model, Section 4.2) to predict the size of an image. We use these results to understand the numerical image size results from harm models above, and then show how the results for our two sample non-thermal distribution functions can be generalized to other distribution functions.
6.1 Image sizes
Since the spectrum drops off sharply for frequencies above νc, for a given observing frequency νo, very little emission is expected from regions where νc is below νo. In accretion flows or jets, it is expected that the magnetic field strength B and the internal energy (related to γ) fall monotonically with increasing distance from the black hole. The critical synchrotron frequency hence also falls monotonically, and the radius at which νo = νc (rc) provides an estimate of the size of the emission region for optically thin plasma. Outside of this radius (r > rc), νo > νc, so very little emission is produced.
The power-law tail component has |$f \simeq \gamma _{\rm min}/\theta _{\rm e}^{0} \simeq 10$|. For the thermal component, the typical electron energy γ ≃ 3θ so f ≃ 3. From equation (19), since the size is proportional to |$(f\theta _{\rm e}^{0})^{2/2.73}$|, the power-law tail component is expected to be ≈2–3 times the size of the thermal component. However, the final image size does not simply grow by this large factor. As discussed in Section 5.2, an increase in η at fixed 230 GHz flux necessitates a decrease in the number density. Since the size depends weakly on the number density through its scaling with the magnetic field (equation 19), both the thermal and power-law sizes decrease. An increase in η increases the non-thermal flux fraction, which weights the overall size towards the larger power-law size. The shrinking due to number density combined with the growth due to a larger power-law halo contribution is consistent with the net increase in size found in the hybrid images (Figs 4 and 10).
Quantitatively, the image size estimate of equation (19) also agrees with the most extended part of the image of the high-temperature thermal distribution (the top right-hand panel of Fig. 3), and for the diffuse halo in the hybrid case. The field strength and temperature scale differently in the harm simulation than in the SARIAF model, but are similar enough that using these scalings should not significantly affect the size (Dexter et al. 2010).
The estimate in equation (19) is valid only when the accretion flow is optically thin at the observed frequency νo. When the flow is optically thick, the intensity is a blackbody from a τ ≈ 1 photosphere, so for matching the measured luminosity of Sgr A*, increasing the model temperature necessitates decreasing the size. In contrast, when the accretion flow is optically thin, increasing the model temperature increases the size. In both cases, increasing the model temperature while maintaining the same total flux corresponds to decreasing the particle number density. In the optically thick case, decreasing the particle number density moves the photosphere inward due to decreasing optical depth. In the optically thin case, the size increases because electrons further from the black hole gain enough energy to contribute when the model temperature is increased.
In the hybrid case, Özel et al. (2000) showed that the thermal electrons provide the absorption at low temperatures while the non-thermal electrons provide the emission. A more sophisticated version of the brightness temperature estimate would account for the change in source function, but otherwise the same argument holds.
We next quantitatively compare these analytic size estimates to numerical ones, using simulated 2D images with a SARIAF fluid model (Section 4.2) and a thermal electron distribution function (Section 3.3). In general, the larger of the two estimates rb and rc provides a good predictor of the size. The face-on (cos i ≈ 1) case was chosen because it reduces effects of asymmetry, Doppler beaming and absorption by the disc. The size was measured for these images by fitting a Gaussian to the Fourier transform and taking the standard deviation (not the FWHM). We also compare the ray-tracing simulation results with sizes taken from a 1D semi-analytic one zone model. Using the SARIAF fluid model and synchrotron emission and absorption coefficients, we produce radial brightness profiles. The radius that encloses 68 per cent of the flux is taken to be the size estimate. The result is shown in Fig. 8, which demonstrates the behaviour described in the analytics above. Not only does the size first fall then rise with increasing temperature but also there is good quantitative agreement between the measured sizes (x size and y size) and the predicted sizes (critical frequency radius rc = r(ν = νc) and brightness temperature radius rb). This is especially true at the low-temperature end (very optically thick) and high-temperature end (very optically thin), where the analytic approximations are most applicable.
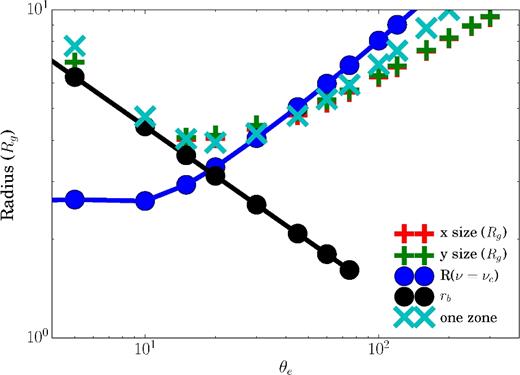
A comparison between simulated sizes and estimated analytic sizes. The red ‘x size’ and green ‘y size’ crosses are sizes derived from relativistic ray tracing, fitting the visibility profile to a Gaussian, and reporting the rms width along two extreme directions. The filled circles are sizes estimated analytically by finding the radius at which the observed frequency is equal to the synchrotron critical frequency (blue), and the radius inferred from equating the brightness temperature to the electron temperature (black), as described in Section 6.1. The cyan ‘one zone’ crosses are sizes estimated using a 1D semi-analytic one zone model, selecting the radius which encapsulates 68 per cent of the flux. We use a SARIAF fluid model and a thermal electron distribution function. The analytic sizes agree well with the simulated sizes and explain why the size increases with increasing electron temperature. Note that the FWHM sizes would be greater by a factor of |$2\sqrt{2\ln {2}}\approx 2.4$|. This result generalizes to non-thermal electron distribution functions, replacing the temperature with a typical electron energy.
6.2 Emission fraction
For the hybrid power-law tail, the energy density is proportional to nthθe for the thermal component and nplγmin for the power-law component. Since the energy density fraction is η and γmin ≈ 10θe, emission |$\zeta = \frac{n_{\rm pl}\gamma _{\rm min}^{2}}{n_{\rm th}\theta _{\rm e}^{2}} = \frac{\gamma _{\rm min}}{\theta _{\rm e}}\eta \approx 10\eta$|.
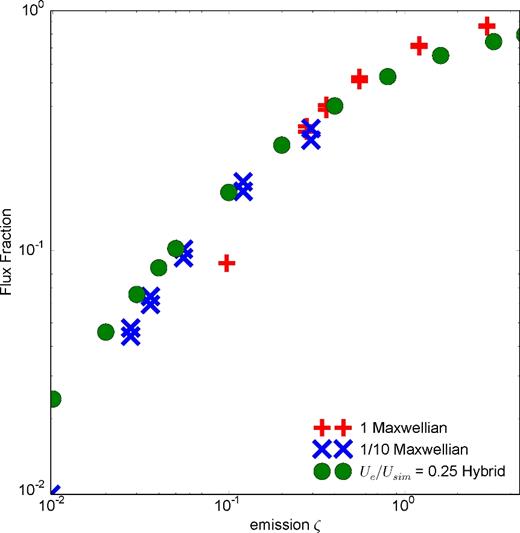
Fraction of the total flux in the non-thermal component of various electron energy distributions versus the emission fraction ζ = nγ2 (equation 23) for the three distribution functions considered. ‘1 Maxwellian’ is the multi-Maxwellian model with coefficients which fit to the diffusion model of Lynn et al. (2014). ‘1/10 Maxwellian’ uses the same coefficients except for the highest Maxwellian, whose coefficient is decreased by a factor of 10 (and all other coefficients are renormalized), which decreases the emission ζ by a factor of 10. For the multi-Maxwellian models, the flux fraction and emission ζ shown are those of the highest temperature component. Emission ζ is adjusted by adjusting the Maxwellian spacing δ, and each Maxwellian model has two points at each value of emission ζ because we use two values of Ue/Usim, 0.25 and 0.3. ‘0.25 Hybrid’ is the hybrid model described in Section 3.2 with Ue/Usim = 0.25, and the flux fraction and emission ζ of the power-law tail are shown. Despite differences between the three distribution functions, emission ζ is a fairly good predictor of flux fraction. Image sizes for an arbitrary distribution function can thus be estimated by calculating the emission ζ for its various components.
For a general electron distribution function decomposed into Maxwellian and power-law components, the emission fraction provides a quick way to estimate which of the components will dominate or contribute to the emission. In the specific case of the multi-Maxwellian model with coefficients ci, by comparing emission ζi = ciδ2i for a given δ, it is clear why the highest temperature Maxwellian dominates for δ ≳ 2. The lowest temperature components are suppressed by powers of δ2 and the second highest Maxwellian only has a factor of ∼3 larger ci. In the specific case of the hybrid power-law tail model, since emission ζ ≈ 10η, even a small η ≈ 0.02 power-law component will contribute significantly, and η ≈ 0.1 will dominate, which is apparent in Fig. 4. A general electron distribution function can be decomposed into Maxwellian and power-law components. Each component can be assigned a relative emission ζ using equation (23). When ζ is large for a single component, that single component will dominate, as in the multi-Maxwellian model. When ζ is large for multiple components, multiple components can be expected to contribute significantly. After identifying the components of the distribution function that contribute significantly to the emission, the image size can be roughly estimated using the approach of Section 6.1 (in particular by calculating rb and rc for the relevant components). In cases where one component dominates, many properties of the image and spectrum can be estimated from a single component, ignoring the other components.
7 DISCUSSION
We have used two-simple, physically motivated examples to study the effect of the electron distribution function on resolved images of synchrotron emission from low-luminosity black hole accretion flows, with the particular application to EHT observations of Sgr A*. The intensity profile (and so observed image size) depends on the energy of the emitting electrons (Section 6.1 and Fig. 3). Cold electrons (with Te < Tb for brightness temperature Tb) require a large emitting area to produce the observed flux density (≃3 Jy for Sgr A* at 230 GHz), and therefore a large image size, which grows with decreasing temperature at fixed flux density. The image size reaches a minimum as Te ≈ Tb and the fluid becomes optically thin down to the black hole. For Te > Tb, a range of radii contributes significantly to the intensity profile, out to a radius r(ν = νc), where νc is the critical frequency for synchrotron radiation. This frequency scales as |$\nu _{\rm c} \propto T_{\rm e}^2$|, and so the maximum radius and image size increase with increasing temperature.
A high-energy power-law tail of electrons can produce an extended image, whose total flux is non-negligible even when they contain a small fraction (few percentages) of the total internal energy density and even when the non-thermal electrons do not substantially change the millimetre spectrum. The size of this halo is set by the radius where ν ≃ νc. The size of an observed image constrains the amount of flux density arising from any given size, which in turns constrains the distribution function and magnetic field strength profile.
Fig. 10 shows an example of this for the single harm snapshot with fixed parameters considered here. The top panel shows the correlated flux density on two baselines as a function of the fraction of flux in the power-law component, which corresponds to η in our hybrid model. For increasing amounts of flux in the power law, the correlated flux on shorter baselines drops due to resolving out the more extended halo component. Similarly, the best-fitting FWHM Gaussian size increases (bottom panel). The magnitude of the effect is comparable to the errors in current data, and so should be possible to constrain with future mm-VLBI data.
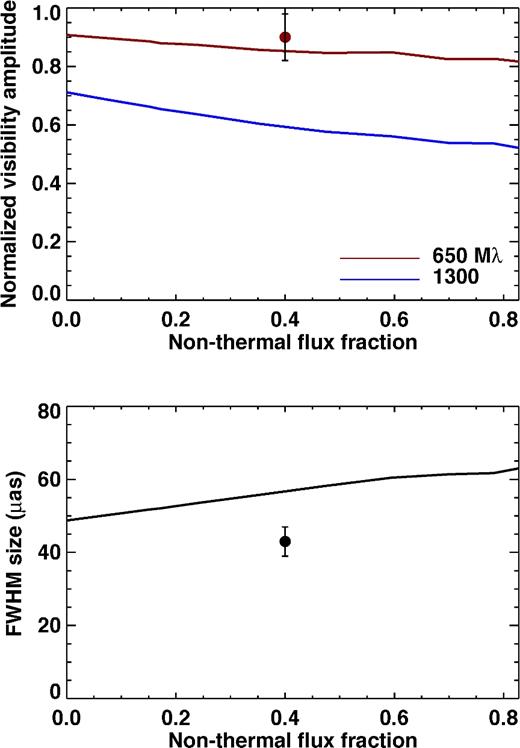
The correlated flux density on two characteristic baseline lengths (top) and corresponding best-fitting Gaussian FWHM sizes (bottom) from the hybrid distribution function and the harm simulation snapshot as a function of the fraction of the total flux produced by the power-law component. The data points show the constraints from current mm-VLBI data (Doeleman et al. 2008; Fish et al. 2011). Future data, especially on a baseline length corresponding to LMT-SMTO (≃1300Mλ), should be able to constrain the flux in a non-thermal halo and therefore the electron distribution function.
A broadened thermal distribution, motivated by a Fermi acceleration model for electron energy evolution (Lynn et al. 2014), instead leads to images that are dominated by the highest temperature electrons. This is because the high-energy electrons in this case receive a significant fraction of the internal energy, η ≳ 0.1, and so dominate the emission. The bulk of the particle distribution (at lower energies) contributes negligibly to the emission in this case. Fitting the spectrum to data only constrains the properties of the emitting particles. For this reason, estimates of the accretion rate from the emitting particle density (Mościbrodzka et al. 2009; Dexter et al. 2010; Shcherbakov et al. 2012) are lower limits, since they do not constrain the properties of colder electrons. Similarly, the image size is only sensitive to the typical electron energies of the hottest subpopulation of electrons. Faraday rotation can independently constrain the properties of the colder electrons that do not produce significant emission.
The electron distribution function also affects the shape of the peak of the observed spectrum. At fixed flux density, higher energy electrons have softer spectra, since lower particle densities and therefore optical depths are required to produce the observed flux. The spectral index therefore becomes more negative with increasing η, mimicking the effect of a lower black hole spin or observer's inclination angle (e.g. Mościbrodzka et al. 2009). For a given observed spectrum then, using models with η = 0 could bias estimated parameters towards lower black hole spin or inclination if the true distribution is non-thermal.
For a thermal electron distribution function with high electron temperature (the right-hand panel of Fig. 3), a multi-Maxwellian distribution function with a high-temperature component (the middle and right-hand panels of Fig. 5) or a hybrid electron distribution with a power-law tail (Fig. 4), the presence of high-energy electrons leads to a larger, more diffuse image. The prediction of a minimum of the visibility profile at 3Gλ is the first minimum of the square of a Bessel function J0, the Fourier transform of a thin ring of emission around the black hole shadow. However, with a larger, more diffuse image, additional emission is produced at larger radii, changing the Fourier transform from a simple Bessel function. This change in the image structure moves the first minimum of the visibility profile away from the expected shadow prediction at 3Gλ and decreases its contrast. However, the black hole shadow is clearly visible in our simulated images. Hence, the location of the first minimum in the visibility profile does not directly reflect the size of the black hole shadow. Uncertainties in the electron distribution function around Sgr A* need to be considered for interpreting EHT observations, particularly given that a small non-thermal component can significantly change the visibility profiles.
The hybrid particle distribution function used here is taken from previous work with semi-analytic RIAFs (Özel et al. 2000; Yuan et al. 2003). Broderick et al. (2009) calculated images from a similar model with a hybrid distribution function, but did not find the same extended ‘halo’ we find here. This is because Broderick et al. (2009) use a much more compact spatial distribution for their non-thermal electrons than for thermal ones, preventing the halo from forming.
We expect the results of this study to generalize to images and spectra from an arbitrary distribution function and to a variety of accretion disc models. The results of Section 6 do not assume a particular form of the distribution function and can be applied to any underlying fluid model approximated with power laws of radius.
In this paper, we have also investigated a method of decomposing arbitrary distribution functions into Maxwellian and power-law components, which is convenient not only for radiative transfer calculations (reducing ≃100 integration steps to ≃10 components) but also for understanding the contribution of the different components (≃1–3 dominant components) of the distribution function to the observed emission.
This method provides an alternative to choosing a particular form for a non-thermal distribution function (e.g. Pandya et al. 2016), is implemented in the public code grtrans (Dexter 2016), and would be straightforward to use with any other radiative transfer code. Moreover, it provides a quick way to make analytic estimates from an arbitrary distribution function, even if the latter lacks a tractable analytic form.
Acknowledgments
We thank the referee, Feryal Özel, for thorough and constructive comments that improved the paper. This work was supported in part by NSF grant AST 13-33612, a Simons Investigator Award from the Simons Foundation, the David and Lucile Packard Foundation, a Sofja Kovalevskaja Award from the Alexander von Humboldt Foundation of Germany and a UC-HiPACC Summer Astrocomputing Project Grant. This paper is based upon the work supported by the National Science Foundation Graduate Research Fellowship under Grant No. DGE-1148900.


