


Abstract
Space-based photometric measurements first revealed low-amplitude irregularities in the pulsations of Cepheid stars, but their origins and how commonly they occur remain uncertain. To investigate this phenomenon, we present MOST space telescope photometry of two Cepheids. V473 Lyrae is a second-overtone, strongly modulated Cepheid, while U Trianguli Australis is a Cepheid pulsating simultaneously in the fundamental mode and first overtone. The nearly continuous, high-precision photometry reveals alternations in the amplitudes of cycles in V473 Lyr, the first case of period doubling detected in a classical Cepheid. In U TrA, we tentatively identify one peak as the fX or 0.61–type mode often seen in conjunction with the first radial overtone in Cepheids, but given the short length of the data, we cannot rule out that it is a combination peak instead. Ground-based photometry and spectroscopy were obtained to follow two modulation cycles in V473 Lyr and to better specify its physical parameters. The simultaneous data yield the phase lag parameter (the phase difference between maxima in luminosity and radial velocity) of a second-overtone Cepheid for the first time. We find no evidence for a period change in U TrA or an energy exchange between the fundamental mode and the first overtone during the last 50 yr, contrary to earlier indications. Period doubling in V473 Lyr provides a strong argument that mode interactions do occur in some Cepheids and we may hypothesize that it could be behind the amplitude modulation, as recently proposed for Blazhko RR Lyrae stars.
1 INTRODUCTION
Classical Cepheids, also known as δ Cep-type stars or just Cepheids, are Population I instability strip pulsators crucial for understanding stellar structure and evolution. Most Galactic Cepheids pulsate in one mode with remarkably stable amplitudes and periods, although space-based photometry reveals that they are not entirely regular clocks. Observations with CoRoT, Kepler and MOST detect short-term, low-amplitude irregular variability or ‘jitter’ in the pulsation cycles of some classical Cepheids (Derekas et al. 2012; Evans et al. 2015; Poretti et al. 2015).
One exception is V473 Lyrae (α2000.0 =19h15m59|${^{\rm s}_{.}}$|49, δ2000.0 = +27|$^\circ$|55΄34|${^{\prime\prime}_{.}}$|6, V = 6.18 mag), the only known classical Cepheid in the Galaxy that undergoes strong amplitude and phase modulations. The changes in the pulsation amplitude were first noted by Burki & Mayor (1980). Percy & Evans (1980) estimated the modulation period to be 3.3–3.4 yr, which was later measured to be 1210 d by Breger (1981), and 1258 d by Cabanela (1991), respectively. The origin of this modulation was extensively discussed in the literature, with theories ranging from mode beating (Breger & Kolenberg 2006) to magneto-convective cycles (Stothers 2009). A recent analysis of extensive ground-based observations collected during 1966–2011 (Molnár & Szabados 2014) confirmed that V473 Lyrae pulsates in the second overtone, modulated with a primary period of 1205 ± 3 d. Molnár & Szabados (2014) also discovered a second, longer modulation cycle with a period of 5300 ± 150 d, and concluded that the modulation closely resembles the Blazhko effect seen in RR Lyrae stars. V473 Lyrae is unique among Galactic Cepheids: the closest counterparts are V1154 Cyg, in which the Kepler space telescope detected modulation but with a very low amplitude (Kanev, Savanov & Sachkov 2015; Derekas et al. 2017) and SV Vul, with a suspected, much longer modulation period of order 30 yr (Engle 2015). Beyond our Galaxy, strong amplitude modulation was recently found in three classical Cepheids in the Magellanic Clouds (Soszyński et al. 2015).
Although modulation appears to be very rare among Cepheids, the phenomenological properties of the light variations of V473 Lyr closely resemble the Blazhko effect, a common feature among RR Lyrae stars. Thanks to space-based photometry, we now know that many modulated RR Lyrae stars show low-amplitude additional modes and/or alternating high- and low-amplitude cycles known as period doubling (Benkő et al. 2010; Szabó et al. 2010, 2014). Numerical models suggest that mode resonances that generate the period doubling can also be responsible for the modulation itself (Buchler & Kolláth 2011). It is not unreasonable, therefore, to postulate that similar mechanisms could operate in modulated Cepheids too.
Unfortunately, the pulsation period of V473 Lyr, P = 1.4909 d, means that one cannot observe consecutive pulsation maxima from a single ground-based site. This makes it virtually impossible to detect period doubling, a challenge also faced in ground-based RR Lyrae observations. Therefore, we proposed to gather continuous observations of the star with the MOST space telescope for a timespan of 1 month in order to search for cycle-to-cycle variations.
MOST serendipitously also observed another Cepheid, U TrA, just before the run that targeted V473 Lyr. A campaign aimed at the Wolf–Rayet star WR 71 included this beat Cepheid within the same field of view. U TrA (α2000.0 =16h07m19|${^{\rm s}_{.}}$|01, δ2000.0 = –62|$^\circ$|54΄38|${^{\prime\prime}_{.}}$|0, V = 7.89 mag), along with TU Cas were the first Cepheids in which beating (the characteristic feature caused by double-mode pulsation) was observed (Oosterhoff 1957a,b). U TrA pulsates in the fundamental mode and the first overtone, with periods P0 = 2.568 42 d and P1 = 1.824 87 d (Pardo & Poretti 1997). After an investigation of the relative amplitudes of the pulsation modes over time, Faulkner & Shobbrook (1979) proposed that pulsation energy might have been redistributed from the fundamental mode to the first overtone, an intriguing concept that can be tested with new measurements. Together with earlier observations of RT Aur and SZ Tau (Evans et al. 2015), MOST's Cepheid sample now totals four stars.
This paper is structured as follows. Section 2 describes the various observations we carried out; Sections 3 and 4 include the analysis and obtained results for V473 Lyr and U TrA, respectively; Section 5 closes with discussion and summary of the findings presented in the paper.
2 OBSERVATIONS
The stars were observed by the MOST (Microvariability & Oscillations of STars) space telescope: a Canadian microsatellite designed to observe bright stellar targets continuously for up to 2 months at a time (Walker 2003). We also obtained spectroscopy for both stars with various ground-based instruments.
2.1 MOST observations and data reduction
Neither of the two stars was observed continuously during each 101-min orbit of the MOST satellite.
In the case of U TrA, in the field of the MOST Primary Science Target WR 71, each orbit was shared with another Primary Science field. U TrA was observed for 28 d during 2014 May 29–June 25. As MOST has to use the science CCD for guiding purposes too, it takes short individual exposures that are stacked on board to boost the stellar signals. The sampling cadence is 123.8 s.
In the case of V473 Lyrae, the star is located in the sky where MOST must point at too large an angle relative to the Sun, heating the satellite beyond the thermal limits for its battery. But the V473 Lyrae run coincided with the ‘eclipse season’ for MOST, when the Sun skims briefly below the Earth horizon once per orbit for a few minutes. It was possible to point MOST at V473 Lyrae for a few minutes per orbit, leading to an effective sampling cadence of 101 min. Each orbit contains 2–10 measurements, with a cadence of 62.2 s. The star was observed for 27 d during 2014 June 28–July 23, but communication problems with the satellite and deliberate interruptions to observe other targets introduced some longer gaps. We have data from 57 per cent of the MOST orbits in the overall run.
MOST photometric reduction processes are well established (see e.g. Reegen et al. 2006; Rowe et al. 2006) and have recently been successfully applied to other Cepheids (Evans et al. 2015). MOST data experience modulation of scattered Earthshine with the 101-min orbital period. Also, as the instrument regains thermal equilibrium after switching from two widely separated points in the sky, there are short-lived trends after switching from one field to another. Stray light modulation is filtered in the reduction process; extreme outliers were removed by sigma-clipping the flux values. In instances of substantially poor pointing, data were filtered by sigma-clipping outliers in the pointing positions and the measured flux values.
To preserve the intrinsic Cepheid variations, slow trends were filtered from the data and clipping applied to the residuals. The filtered data were phased with the orbital period and averaged in bins to remove modulations caused by stray light. We note that V473 Lyr is much less affected by stray light than U TrA as it was observed only when MOST was in the shadow of the Earth. Finally, the large-amplitude variation was restored to the data. Any remaining slow trends were then subtracted by a simple linear fit. The final light curves (times, magnitudes and errors) are shown in Fig. 1.
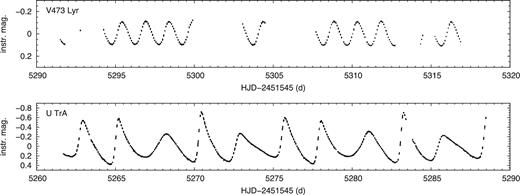
MOST light curves of V473 Lyr and U TrA. Brightnesses are in MOST instrumental units.
2.2 Spectroscopic observations and reduction
We organized an extended spectroscopic campaign to follow the radial velocity (RV) variations of V473 Lyrae, during 2014 April 12–August 10. We used a Shelyak Instruments eShel echelle spectrograph (resolving power of =11 000 in the spectral range 4200–8700 Å) mounted on the 0.5-m telescope of the Gothard Astronomical Observatory, Hungary (GAO), and for 1 week on the 1-m telescope at the Piszkéstető Mountain Station of the Konkoly Observatory (PO). For detailed descriptions of the device and the telescopes, see Csák et al. (2014). A similar spectrograph was used at Kutztown University Observatory, Pennsylvania, USA (KUO), mounted on a 0.6-m telescope. The combined observations from Hungary and the USA extended the phase coverage, as the star returns to the same pulsation phase every third night owing to its near-1.5-d pulsation period.
We repeated the campaign during 2015 June 5–July 25, with observations collected at GAO and KUO, and during 2016 April 16–21 from KUO. All spectra were reduced using iraf1 standard tasks, including bias and flat-field corrections, aperture extraction, and wavelength calibration (using Th–Ar lines). We then normalized the continuum of the spectra. RV values were determined by cross-correlating the object spectra with R = 11 500 synthetic spectra chosen from the Munari et al. (2005) library using the fxcor task of iraf. Correlations were calculated between 4870 and 6550 Å excluding Balmer lines, NaD and telluric regions. This method resulted in a 100–200 m s−1 uncertainty in the individual RV values. Barycentric Julian dates and velocity corrections for mid-exposures were calculated using the BARCOR code of Hrudková (2006).
We also obtained two higher resolution (R = 20 000) spectra of V473 Lyr from PO in 2016. For those, barycentric correction was produced from iraf. RVs were determined by the cross-correlational method using metal lines in the wavelength region 4800–5600 Å. We fitted the cross-correlated line profiles with a Gaussian function to determine the RV values.
U TrA was observed spectroscopically by the members of SASER (Southern Astro Spectroscopy Email Ring),2 a group of advanced amateur and professional astronomers equipped with various instruments, with contributions from other observers as well. They collected 4 spectra in 2014 and 10 more in 2015. The observations include three low-resolution (R ∼ 1000–1500) spectra covering a wide wavelength range (3199–7199 Å), and 11 higher resolution spectra (R ∼ 4000–13 000) spanning a few hundred Å. RVs were determined with the task fxcor in iraf, applying the cross-correlational method using a well-matching theoretical template spectrum from the extensive spectral library of Munari et al. (2005).
Since the observed spectra cover different wavelength ranges, we determined velocities from each spectrum individually using their own wavelength region as listed in Table A1. We then made barycentric corrections to every RV value. However, we could not determine velocities from every spectrum, because of either the low resolution or the low number of lines in the observed wavelength region. Depending on the S/N and resolution of the spectrum, the estimated RV uncertainty ranges from 2 to 5 km s−1. Derived values are listed in Table A1 and discussed in Section 4.2.
2.3 Additional photometric data
The photometric campaign for V473 Lyr by Molnár & Szabados (2014) ended well before the MOST run. We did not initiate a new photometric campaign, but searched data bases of various surveys for data we might use. Unfortunately V473 Lyrae is too bright for most instruments used for exoplanet and asteroid searches. However, we managed to find data from three sources, mostly from various sky surveys that utilize various CCD cameras attached to telephoto lenses.
The American Association of Variable Star Observers (AAVSO) provided us with BVRI observations taken with their Bright Star Monitor instrument and the 0.5 m telescope at Sonoita Research Observatory, Arizona (USA). We have received data from the Pi of the Sky survey, taken by the prototype array in white light during 2006–2009 and in R colour during 2011–2012 from Chile (Mankiewicz et al. 2014). Finally and most importantly, the northern instrument of the Kilodegree Extremely Little Telescope survey (KELT-N) measured V473 Lyrae extensively during 2008–2014 (Pepper et al. 2007). The KELT-N data is the only photometry that overlaps with the MOST run itself, providing a most important hook to determine the actual modulation phase of the star during the space-based observations. We note that data for V473 Lyrae were obtained from the KELT-N observations with simple aperture photometry instead of their differential imaging pipeline. A journal of observations is included in Table 1. The light curves and RV data are displayed in Fig. 2.
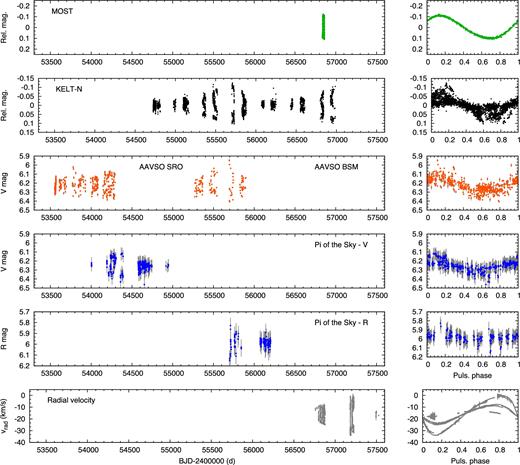
New light curves and RV measurements of V473 Lyrae (left-hand panels). Phased curves (right-hand panels) are folded with the inverse frequency P = 1/0.670 775 d.
Journal of ground-based spectroscopic and photometric observations of V473 Lyrae. Time ranges are in HJD 2400000+ d. The KELT survey uses Kodak Wratten No. 8 red-pass filters (Pepper et al. 2007). Aperture ratios and focal lengths are provided for the telephoto lens-based systems.
| Observer/survey | Method | Telescope | Detector | Parameters | No. of obs. | Range |
|---|---|---|---|---|---|---|
| AAVSO BSM | Phot. | Takahashi FS-60CB | SBIG ST-8XME | BVRI | 4×127 | 55 269.91–55 896.60 |
| AAVSO Sonoita | Phot. | C14 0.3 m | SBIG STL-1001E | BVRI | 4×487 | 53 556.81–54 292.84 |
| KELT-N | Phot. | Mamiya 645 f/1.9 80mm | Apogee AP16E | red-pass filter | 2894 | 54 725.65–56 986.59 |
| Pi of the Sky (1) | Phot. | Canon EF f/1.2 85mm | custom CCDs | white light | 774 | 54 004.50–54 946.88 |
| Pi of the Sky (2) | Phot. | Canon EF f/1.2 85mm | custom CCDs | R | 285 | 55 697.80–56 200.49 |
| GAO run 1 | Spectr. | 0.5 m RC | eShel echelle | R = 11000 | 681 | 56 760.50–56 874.59 |
| GAO run 2 | Spectr. | 0.5 m RC | eShel echelle | R = 11000 | 554 | 57 179.42–57 226.52 |
| Kutztown run 1 | Spectr. | 0.6 m RC | eShel echelle | R = 11000 | 393 | 56 796.68–56 879.74 |
| Kutztown run 2 | Spectr. | 0.6 m RC | eShel echelle | R = 11000 | 242 | 57 183.61–57 228.84 |
| Kutztown run 3 | Spectr. | 0.6 m RC | eShel echelle | R = 11000 | 59 | 57 494.76–57 499.88 |
| Piszkéstető | Spectr. | 1.0 m RCC | eShel echelle | R = 11000 | 216 | 56 837.39–56 845.57 |
3 ANALYSIS OF V473 L|$\bf {{\rm yr}}$|
We analysed the MOST and ground-based light curves with Period04 software (Lenz & Breger 2005). For both stars, the light curves obtained by MOST included only a handful of pulsation cycles, resulting in low-frequency resolution. Nevertheless, the high precision and quasi-continuity of the light curves provided us with advantages ground-based observations cannot offer. We present the analysis of V473 Lyr in this section, and that of U TrA in the subsequent one. Throughout the paper, we designate the frequencies corresponding to the fundamental mode and the first and second overtones as f0, f1 and f2, respectively.
3.1 Period doubling in v473 lyrae
Although the light curve of V473 Lyrae contains gaps, it samples enough pulsation extrema to confirm the presence of alternating high and low pulsation maxima. In Fig. 3, we connect the odd and even maxima with blue and orange lines, respectively, to show that the alternation is present throughout the light curve. Alternation is observed in the maxima but not in the minima. Such repetition of two slightly different pulsation cycles is known as period doubling. The same method was used to investigate period doubling in RR Lyraes and RV Tau stars (Molnár et al. 2012; Plachy et al. 2014). The differences here are rather small compared to the scatter of points; therefore, the method of comparing the heights of the maxima in itself gives only moderate confidence that period doubling is present.
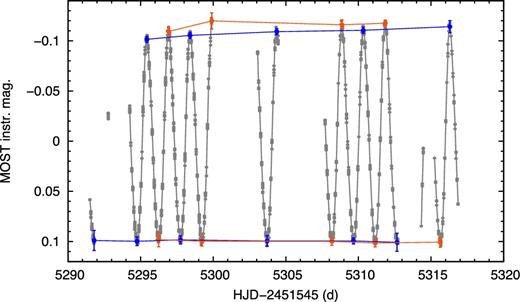
Period doubling in V473 Lyrae. Odd and even maxima are connected with the blue and orange lines, respectively.
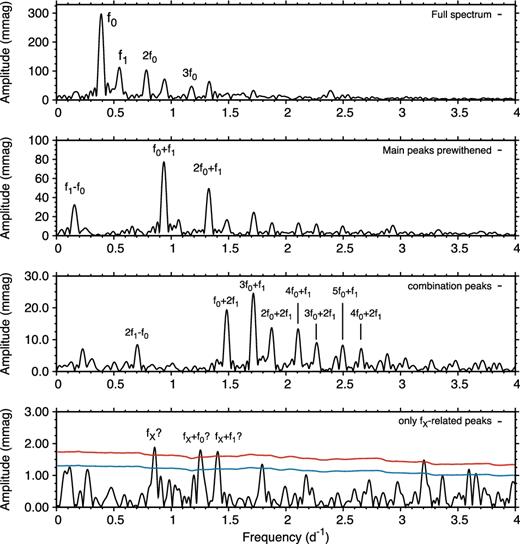
The Fourier spectrum of V473 Lyrae is shown in Fig. 4. The second-overtone pulsation produces a very sinusoidal light curve and indeed we detect only the principal pulsation frequency and its two harmonics. The presence of period doubling leads to the appearance of half-integer frequencies ((2n + 1)/2 f2) in the spectrum. In this case, we are able to detect only a single additional peak at 2.5 f2 with high (>4) signal-to-noise ratio (SNR). The 0.5 and 1.5 f2 peaks can also be identified but their SNR may fall below 4, the canonically accepted value in the literature, depending on the exact calculation of the noise level. After the subtraction of the frequencies listed in Table A5, the rms scatter of the residual was found to be 3.1 mmag.
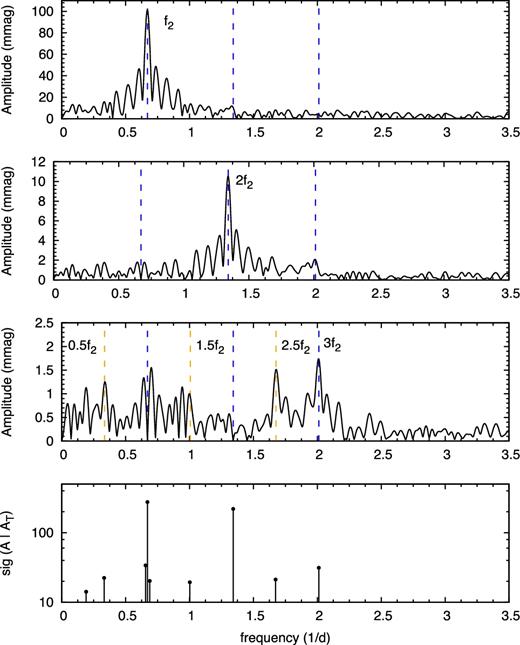
Fourier spectra of the MOST data of V473 Lyr. Top: full spectrum, middle: pre-whitened with f2, and with f2 and 2f2. Positions of the main harmonics and subharmonics are indicated with vertical lines. Bottom: spectral significance values for all identified peaks.
However, the low SNRs of the frequency components can be misleading in this case. Estimating the SNR, especially for low-frequency signals, can be unreliable as it depends on the level of pre-whitening applied to the data. Moreover, here the pulsation amplitude and phase of the star were changing slightly over the MOST observations due to the modulation, and thus the residual spectrum contains small side peaks that account for these changes and may be difficult to properly pre-whiten.
Therefore instead of relying only on the SNR estimate alone, we also calculated the spectral significance values with SigSpec (Reegen 2007). The spectral significance is just the logarithm of the inverse of the false-alarm probability of the frequency component. The analysis revealed three half-integer components (0.5, 1.5 and 2.5 f2) with significance values between 19 and 22, clearly confirming the presence of period doubling in the star. Side peaks around the f2 peak are also detected with high significance, as expected from the modulation-induced variations. One more peak can be identified with high significance level (sig = 14.1) at f΄ = 0.191 05 d−1, but it is likely spurious, as it is not detected if the data are binned per orbit.
To further confirm the presence of period doubling, we also checked the frequency content of the data obtained for the guide star used by MOST, HD 337939 (V = 9.55 mag). A single low-amplitude peak can be identified at 1.00 d−1, which is likely caused by the daily variation in the amount of stray light. Although this frequency coincides with the 1.5 f2 subharmonic peak we identified in V473 Lyr, and has a similar amplitude, it cannot explain the presence of the other two subharmonics, and its phase is also significantly different from that of the 1.5 f2 peak in V473 Lyr. We can conclude that stray light may add uncertainty to the amplitude and phase of the 1.5 f2 peak but otherwise has no adverse effects on the detection of period doubling.
Alternating minima or maxima were first identified in RV Tau stars (Seares & Haynes 1908; van der Bilt 1916) and were discovered in other Type II Cepheids and in RR Lyrae stars much later (Templeton & Henden 2007; Szabó et al. 2010; Smolec et al. 2012; Plachy et al. 2017). With this detection, classical Cepheids, at least those pulsating in the second overtone, join the group of other classical pulsators where period doubling has been detected.
3.2 Ground-based photometry
The data we acquired from the three different ground-based surveys are shown in Fig. 2. As seen in this figure, the coverage and quality of the measurements are very different. The Pi of the Sky data, in particular, suffer from large photometric uncertainties. The pulsation amplitudes are also different, partly because of the use (or lack) of different filters, and contamination from nearby stars. However, we were able to determine the temporal variation of the A1 and ϕ1, and in some cases, the A2 and ϕ2 Fourier parameters from all data sets. Here, indices 1 and 2 refer to frequency components f2 and 2f2. We then scaled the amplitudes to the values presented by Molnár & Szabados (2014).
The amplitude and phase modulation curves are displayed in Fig. 5. The new observations confirm that a strong amplitude maximum occurred around JD 2455700, with A1 exceeding 0.2 mag in the V band. Comparison of the very end of the data set with the MOST data point suggests that the pulsation amplitude was still increasing during the space-based observations, although they were obtained very close to the calculated time of the amplitude maximum. The shape of the phase modulation (ϕ1(t)) curve changed from an upward to a downward slope sometime around JD 2454500, following the extrapolated sine fit of the secondary modulation determined by Molnár & Szabados (2014). This further supports that a long-period secondary modulation is at work in the star.
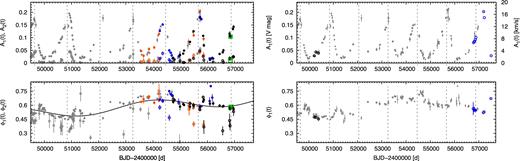
Long-term variation of the pulsation amplitude and phase of V473 Lyrae. Top left: photometric amplitude modulation. Filled (A1) and open (A2) green, orange, blue and black symbols are the MOST, AAVSO/BSM, Pi of the Sky and KELT-N data, respectively. Grey symbols are data from Molnár & Szabados (2014). Note that indices 1 and 2 correspond to the main pulsation peak (f2) and its first harmonic (2f2), respectively. Bottom left: the same for phase modulation. Grey dashed lines mark the amplitude maxima of the short modulation cycles, while the black line shows the long modulation cycle in the phase variation. Top right: new (blue) and some old (black) RV amplitudes overlaid on the photometric amplitudes. Bottom right: the same for RV phases.
3.3 RV measurements
RV variations of V473 Lyrae were monitored for an extended period of time by Burki (2006), but measurements ceased after 1997 (JD 2450568). Molnár & Szabados (2014) showed that the changes in the amplitudes and phases of earlier RV data follow the modulation observed in the photometric amplitudes and phases closely. Comparison of our new photometric and RV data sets shows that this is still the case. The observations indicate that the RV variations follow both the short and long modulations in accordance with the photometry, confirming that both modulations are intrinsic to the pulsation of the star. We compared the pulsation-averaged, or γ-velocities of the available data sets to search for any signs of binarity. The scatter of points does not exceed 0.3 km s−1 for our campaigns. Older data sets show considerably larger deviations, but even those are in the range of 1.3 km−1. Assuming that either of the phase modulations is caused by light-time effect, much larger projected velocities would be required to account for the observed differences. We conclude that V473 Lyrae has no binary companions, at least with orbital periods shorter than several decades.
3.4 Phase lag and physical parameters
The phase lag (ΔΦ1) is the difference in phase between the luminosity and velocity variations. For their model calculations, Szabó, Buchler & Bartee (2007) defined it as the difference between the phase of the light curve and the star-centric velocity that is the opposite of the measured RV. At the time, there were no observations of second overtones with which they could compare their models. Although extensive photometric and spectroscopic data have been collected separately about V473 Lyr during the past decades, the phase lag of the star was not calculated before our work. Since the star's pulsations are modulated, we selected various modulation phases with coincident (or nearly coincident) photometric and spectroscopic observations. The phase lag indeed shows some variation between ΔΦ1 = −0.49… − 0.59, decreasing from low to high pulsation amplitudes. We found the phase lag to be ΔΦ1 = −0.538 ± 0.012 during the MOST run that was coincident with our first spectroscopic campaign. These values, with the pulsation period of logP(d) = 0.1734 d, put the star well below the first overtone sequence, as Fig. 6 illustrates. Although V473 Lyrae has a longer pulsation period than the second-overtone regime presented by Szabó et al. (2007), the extent of the non-linear regime depends on the convective parameters of the models, and different parameters could extend it to longer periods. Our result supports the findings of Molnár & Szabados (2014) that the star pulsates in the second overtone.
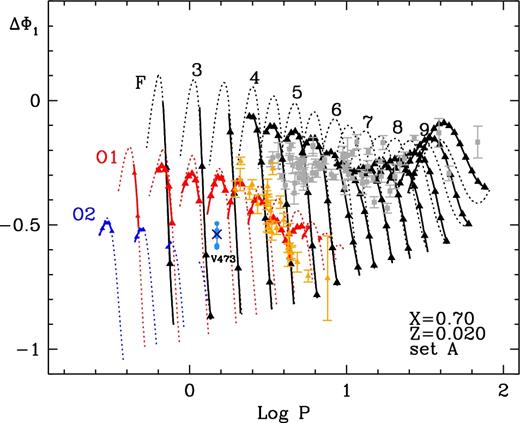
Phase lag of V473 Lyrae (light blue dots are our analysis of the older data sets, and blue cross is for the MOST run), compared to the model calculations of Szabó et al. (2007). Grey and orange symbols are the fundamental-mode and first-overtone Cepheids collected by Ogłoza, Moskalik & Kanbur (2000). The star is clearly separated from the first-overtone ones and follows the second-overtone model family.
Finally, we derived the fundamental stellar parameters of the star from the spectra according to the recipe described by Moór et al. (2015). We summed 20 individual spectra taken at KUO on 2015 July 16 (HJD 2457219) and compared this master spectrum with templates taken from the spectral library of Munari et al. (2005). We used an iterative method to estimate the stellar parameters. After transforming the measured spectrum to the laboratory system, we compared it to a grid of Munari synthetic spectra in the 4400–5500 Å range, excluding the Hβ region. The grid was compiled by varying effective temperature, surface gravity and projected rotational velocity of the model spectra, while the metallicity was fixed at [Fe/H] = 0.0. After finding the global minimum, we used the derived Teff and log g parameters to determine M/H metallicity and vsin i. This iterative approach is stable against the parameter degeneracies, especially between Teff and M/H. By linear interpolation around the minimum, we derived the final parameter set as Teff = 6175 ± 150 K, log g = 2.7 ± 0.2, vsin i = 17 ± 5 km s−1. These values agree well with those derived by Andrievsky et al. (1998).
4 ANALYSIS OF U TrA
4.1 Possible detection of |$\bf {f_X}$|
The MOST light curve of U TrA is very well sampled and shows the characteristic beating pattern of double-mode pulsation. Although the frequency resolution is limited by the short length of the data, the Fourier spectrum revealed numerous combination peaks between the fundamental mode and the first overtone (Fig. 7). The rms scatter of the residual light curve after pre-whitening with the frequencies listed in Table A6 is 5.7 mmag.
Fourier spectra of the MOST data of U TrA. Red and blue lines indicate SN ratios 4 and 3.
Observations of the OGLE survey revealed that many first-overtone Cepheids both in the Galactic Bulge and in the Magellanic Clouds show one or more low-amplitude additional modes in the period range of P/P1 ∼ 0.61–0.64 (Soszyński et al. 2008, 2010; Moskalik & Kołaczkowski 2009). The same modes were also identified in a few beat Cepheids (Soszyński et al. 2015). First-overtone and double-mode RR Lyrae stars also show very similar modes. Notations used for these modes in the literature are f0.61 or, simply fX.
We tentatively identify peaks in the frequency spectrum of U TrA that may correspond to the fX mode at 0.8615 d−1, with a frequency ratio of f1/fX = 0.636, as shown in the lowest panel of Fig. 7. Two other peaks can be identified as the fX + f0 and fX + f1 combinations, respectively. All peaks have SNRs larger than 4 (red line). Unlike in the case of V473 Lyr, the mode amplitudes appear to be constant, hence the SNR can be calculated more accurately for U TrA.
However, given the short data set and hence the low frequency resolution, the three peaks we associated with the fX mode can be fitted as combination peaks too. The position of the suspected fX peak and the nearest combination, 5f0 − 2f1, differ only by 0.010 d−1, much less than the actual Δf = 1/ΔT = 0.037 d−1 frequency resolution of the MOST light curve. This also means that the fX + f1 peak overlaps with the much stronger 5f0 + f1 peak, but we note that a common frequency fit does assign significant amplitude to both peaks.
Overall, although it is plausible that U TrA, as many Cepheid stars pulsating in the first overtone, contains the fX mode, the overlaps with the combination peaks and the limited frequency resolution prevent us from an unambiguous identification. A decisive study would require much longer observations to disentangle the nearby frequency components. Unfortunately, data on U TrA from the next space-based photometric mission, TESS, will most likely also be limited to 27 d, i.e. the same length as the MOST data. Other beat Cepheids that are closer to the ecliptic will be observed during the K2 mission of the Kepler space telescope that provides us with longer observations and higher photometric accuracy, making it possible to search for the fX mode in other stars too (Molnár, Plachy & Szabó 2014).
4.2 RV measurements
In the case of U TrA, time-resolved RV measurements are scarce: data presented by Stibbs (1955), Laustsen (1957) and Usenko et al. (2014) are limited to a handful of points. Only Stobie & Balona (1979) provided observations with good phase coverage. Unfortunately, our coverage was sparse as well. Nevertheless, we compared these measurements and fitted them with the pulsation periods determined from the photometric data (Fig. 8, see also Section 4.3) to search for any signs of γ-velocity variations that would indicate orbital motion caused by a binary companion. We did not detect any systematic variations larger than ±4 km s−1, the scatter of the residual RV data.
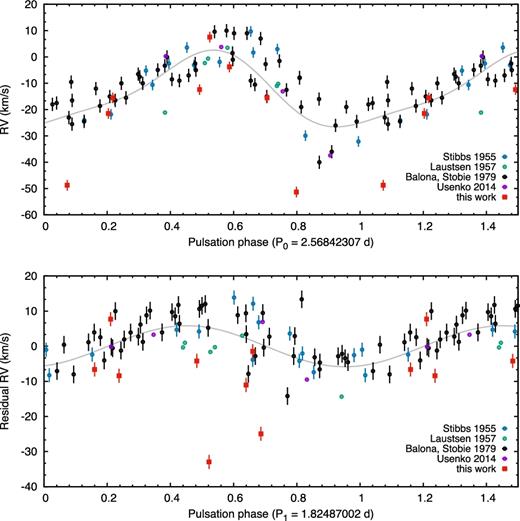
Archival (grey, blue, purple circles), and newly obtained SASER RV data (red sqares) of U TrA, phased with the two pulsation periods. Top: original data set, with a two-component fit of the fundamental mode, the full amplitude of the curve is AFM = 29.1 km s−1. Bottom: residual with a fit to the first overtone, A1O = 11.7 km s−1. The two outlier points around –50 km s−1 were not used when fitting the amplitudes.
4.3 Search for energy exchange and period variations
Faulkner & Shobbrook (1979) raised the possibility of pulsation energy exchange between the two pulsation modes via mode coupling in U TrA. To see if any change has occurred in the almost four decades since, we analysed Hipparcos photometry, observations by Mitchell et al. (1964); Berdnikov (1995, 2008) and the MOST light curve. We also re-analysed photometry by Jansen (1962) and Stobie & Balona (1979). Following the notation of Faulkner & Shobbrook (1979), we define the energy terms as ∑(fijAij)2, where i and j refer to the pulsation modes. Indices i = j = 0 correspond to peaks belonging to the fundamental mode, i = j = 1 to the first overtone, and i ≠ j to the combination (or cross-coupling) terms in the Fourier solution.
The relative energy levels we calculate show considerable scatter from one data set to another, as can be seen in Fig. 9. Despite the scatter, we see no evidence of energy exchange between the two pulsation modes on a decadal time-scale. The energy level of the first overtone remains essentially flat over the time spanned by the data, although some variation can be seen between the fundamental mode and the combination peaks. Considering the scatter of points, we conclude that the relative pulsation energy levels of the fundamental mode and the first overtone did not experience changes exceeding ±7 and ±5 per cent, respectively. The derived ratio of the energy levels of the two modes (lower panel of Fig. 9) is more uncertain, and the scatter of points reaches ±13 per cent.
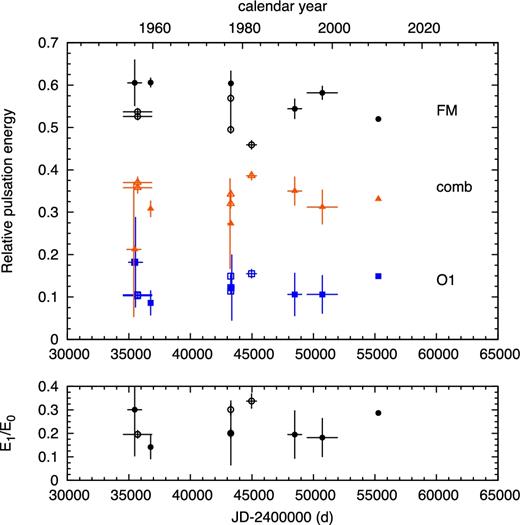
Top: relative pulsation energy levels in U TrA (sum of the energy terms corresponding to each group divided by the total sum of the energy terms). Open symbols are the values calculated by Faulkner & Shobbrook (1979) and Faulkner & Shobbrook (1983); data that were analysed in both studies are connected with vertical lines. Filled symbols: our analysis of the following data sets: Jansen (1962), Mitchell et al. (1964), Stobie & Balona (1979), Hipparcos (ESA 1997), Berdnikov (1995, 2008) and MOST. Bottom: E1/E0 energy relation of the first overtone and the fundamental mode.
We also investigated the stability of the pulsation periods in U TrA. Classical O–C methods, based on the timings of the extrema of the cycles, or on the moments of the median brightness on the ascending branch of the light curve, are less effective for beat Cepheids, so period changes in these stars have been rarely explored. Here, we fit the available data sets with the same frequency components and estimate changes in pulsation phases of the fundamental mode and first overtone (f0 and f1) simultaneously. We also determine the pulsation periods to high accuracy by minimizing the linear slopes of the two O–C curves: P0 = 2.568 423 07 d and P1 = 1.824 870 02 d.
Fig. 10 shows that neither mode in U TrA undergoes clear variations in time, nor does the ϕ1 − ϕ0 difference in phase between them. This suggests a lack of nearby companion stars, in agreement with the RV data, and very stable pulsation periods, in agreement with the findings of Pardo & Poretti (1997). There is some scatter in the phase of the fundamental mode from one data set to another, but that is likely due to uncertainties arising from their sparse samplings. We note that HST direct imaging revealed two candidate companions to U TrA, but the general conclusion of the survey is that stars with separations as wide as these are not physical companions. In any case, if they were companions, they would have orbital periods in the range of 105–106 yr around the Cepheid, so their effects would be undetectable in our timing data (Evans et al. 2016).
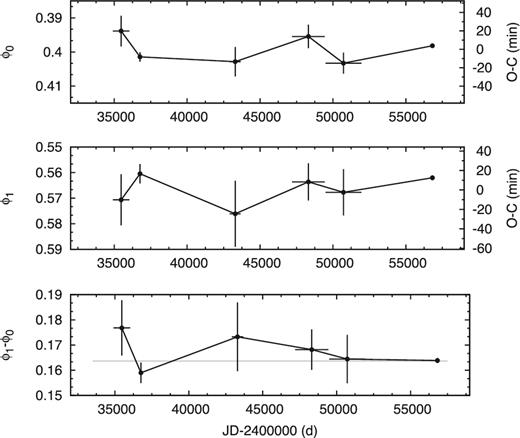
Pulsation phase variations in U TrA. Top: fundamental mode, middle: first overtone, bottom: phase difference between the two modes. The horizontal line marks the average difference of ϕ1 − ϕ0 = 0.1637. Units are in rad/2π. The reference periods we used are P0 = 2.568 423 07 d and P1 = 1.824 870 02 d.
5 DISCUSSION AND SUMMARY
5.1 Additional modes in cepheids
The detection of low-amplitude additional modes in Cepheid and RR Lyrae stars, often below mmag level, was a major advancement in the field of classical pulsating stars in the last decade (see e.g. Gruberbauer et al. 2007; Soszyński et al. 2008; Benkő et al. 2010; Molnár 2016). While some modes have been explained (Kolláth, Molnár & Szabó 2011; Kolláth 2016), the mechanism for others, like the fX mode(s), between PX/P0 ∼ 0.60–0.64, are still disputed. The most promising hypothesis was presented by Dziembowski (2016), who attributed the signal at fX to the first harmonic of three different non-radial modes at frequencies of fX/2 with orders of ℓ = 7–9. These modes experience strong cancellation at the pulsation frequency, making the fX = 2 fℓ component the strongest one observationally. If the peak we found in U TrA is indeed such a mode, it would belong to the central, ℓ = 8 group.
We did not detect additional modes in V473 Lyrae directly, but based on prior experience, the presence of period doubling strongly suggests that at least one more mode is excited in the star, and is in resonance with the main mode. Our hypothesis is based on the assumption that even though the evolutionary states of RR Lyrae and various Cepheid stars are very different, the structure of their envelopes and thus their pulsations are remarkably similar. In fact, radial pulsations in RR Lyrae, classical, and type II Cepheids can be modelled with minimal changes to the same hydrodynamic codes (Kolláth et al. 2002; Smolec & Moskalik 2008).
In the case of RR Lyrae stars, the origin of period doubling was unambiguously traced back to the P0: P9 = 9: 2 resonance between the fundamental mode and the 9th overtone, which is a strange mode (Kolláth et al. 2011). For Type II Cepheids, non-linear hydrodynamical models point towards a 3:2 resonance with the first overtone and a 5:2 resonance with the second overtone for the BL Her and W Vir subtypes, respectively, and low-amplitude modulation was also identified (Smolec & Moskalik 2012; Smolec 2016). In the case of second-overtone classical Cepheids, only linear model calculations have been carried out so far, suggesting that resonances can occur in the vicinity of the physical parameters of V473 Lyrae (Molnár & Szabados 2014). The best candidates are the 4th and 8th overtones with possible 3:2 or 5:2 resonances, but a non-linear model survey is needed to pin down the exact mode that may cause the period doubling. Nevertheless, the simultaneous presence of the modulation and period doubling shows a striking similarity to what we see in both RR Lyrae stars and type II Cepheid models, therefore we consider it to be plausible that both phenomena may originate from mode resonances in RR Lyrae and Cepheid stars alike (Buchler & Kolláth 2011).
5.2 Summary
We analysed the light curves of the Cepheids V473 Lyr and U TrA obtained by the MOST space telescope, supported by ground-based photometry and spectroscopy. The MOST observations provided us with 1 month of each star, with nearly continuous coverage of U TrA and 57 per cent of V473 Lyrae (but nearly continuous coverage outside the long gaps).
Our space-based photometry produced new insights into both stars:
We see period doubling (alternating higher and lower maxima) in V473 Lyrae, the first detection of this phenomenon in a classical Cepheid star. The combination of strong amplitude and phase modulation (a clear phenomenological analogue to the Blazhko effect seen in RR Lyrae stars) and period doubling suggests that mode resonances could be the common explanation for modulation in Cepheids and RR Lyrae stars (Buchler & Kolláth 2011).
In U TrA, we tentatively identify one frequency component as an fX mode, but because of the limited frequency resolution of the data, we cannot exclude the possibility that it is instead a combination peak.
Data from the AAVSO BSM, Pi of the Sky and KELT-N surveys fill the large gap between the last observations of V473 Lyrae in Molnár & Szabados (2014) and the MOST run. Together, they show that V473 Lyrae did not reach maximum pulsation amplitude by the time of the MOST run, due to the phase shift caused by the secondary modulation.
Observations of U TrA, one of the first beat or double-mode Cepheids discovered, extend back to the 1950s. Analysis of all available data points to no energy exchange (larger than 5 per cent) between the fundamental mode and the first overtone, disproving the suggestion made by Faulkner & Shobbrook (1979). We also found no significant changes in the phase of either pulsation period.
We measured the phase lag between the luminosity and RV variations in V473 Lyrae. This is the first time for a second overtone Cepheid. Our results agree very well with the theoretical predictions of Szabó et al. (2007). We refined the following fundamental physical parameters of V473 Lyrae: Teff = 6175 ± 150 K, log g = 2.7 ± 0.2, vsin i = 17 ± 5 km s−1.
In our new RV data for three different modulation phases of V473 Lyr (during amplitude increase near maximum amplitude and on the descending branch), combined with archival spectra, we detect no γ-velocity changes larger than 0.3 and 1.3 km s−1 that could indicate binarity.
Our few new RV measurements for U TrA, combined with archival spectra, do not show changes in the γ-velocity of the star beyond ±4 km s−1.
The detection of period doubling in a modulated Cepheid raises the possibility of a unified mode resonance model for the Blazhko effect in RR Lyrae and Cepheid stars. V473 Lyrae will be observed by the TESS space telescope to further investigate this phenomenon. TESS will be able to observe the star for about the same length of time as MOST (about 1 month), although V473 Lyr may fall into the overlapping part of two neighbouring sectors of the TESS observing scheme, extending the possible coverage.
Other bright Cepheids have been and will be observed by other space photometry missions (Kepler and BRITE; Pablo et al. 2016) and new observations are possible with MOST to look for such effects. TESS will observe several Cepheids, including stars like Polaris and the archetype δ Cep. But given long pulsation periods for some Cepheids, extending to weeks or months, these measurements are sometimes just snapshots giving tantalizing glimpses of the underlying dynamics (see e.g. Plachy et al. 2017).
An important takeaway from our study is the level of benefit of combining space-based photometry with extended ground-based photometry and spectroscopy. While current ground-based photometric surveys designed to search for exoplanets and asteroids (such as KELT) provide valuable data, other projects aimed at simultaneous all-sky coverage and higher duty cycles have even greater potential to investigate Cepheids. New survey machines like MASCARA, Evryscope (Snellen et al. 2013; Law et al. 2015) and especially the multicolour Fly's Eye project (Pál et al. 2013) will be natural extensions of the TESS mission. We believe combining the results of all these tools is the best way forward to further our understanding of the physical properties of Cepheids and their pulsations.
Acknowledgments
This paper is based on data from MOST (Microvariability & Oscillations of STars), which was, at the time the data reported here were collected, a Canadian Space Agency mission operated jointly by Microsatellite Systems Canada Inc. (MSCI, formerly the Space Division of Dynacon Inc.) and the Universities of Toronto and British Columbia, with support from the University of Vienna. We thank Matthew Templeton for his assistance with the AAVSO observations of V473 Lyr. This project has been supported by the Lendület LP2012-31 and LP2014-17 Programs of the Hungarian Academy of Sciences and by the NKFIH K-115709, K-119517, PD-116175 and PD-121203 grants of the Hungarian National Research, Development and Innovation Office. The research leading to these results has received funding from the ESA PECS Contract No. 4000110889/14/NL/NDe and from the European Community's Seventh Framework Programme (FP7/2007-2013) under grant agreement no. 312844 (SPACEINN). LM and ÁS were supported by the János Bolyai Research Scholarship of the Hungarian Academy of Sciences. AD has been supported by the Postdoctoral Fellowship Programme of the Hungarian Academy of Sciences and by the Tempus Közalapítvány and the MÁEÖ. AD, BCs, JK and GyMSz would like to thank the City of Szombathely for support under Agreement No. 67.177-21/2016. MS acknowledges the support of the postdoctoral fellowship programme of the Hungarian Academy of Sciences at the Konkoly Observatory, MTA CSFK as a host institution. NDR is grateful for postdoctoral support by the University of Toledo and by the Helen Luedtke Brooks Endowed Professorship. AFJM and JMM are grateful for financial aid from NSERC (Canada) and FQRNT (Québec). This publication is based (in part) on spectroscopic data obtained through the collaborative Southern Astro Spectroscopy Email Ring (SASER) group. This research has made use of the SIMBAD data base, operated at CDS, Strasbourg, France, and NASA's Astrophysics Data System.
iraf is distributed by the National Optical Astronomy Observatories, which are operated by the Association of Universities for Research in Astronomy, Inc., under cooperative agreement with the National Science Foundation.
REFERENCES
ESA
SUPPORTING INFORMATION
Supplementary data are available at MNRAS online.
utra_most_photometry.txt
v473lyr_most_photometry.txt
v473lyr_radial_velocity.txt
Please note: Oxford University Press is not responsible for the content or functionality of any supporting materials supplied by the authors. Any queries (other than missing material) should be directed to the corresponding author for the article.
APPENDIX A: DATA TABLES
This appendix contains various data tables used in the paper. RV measurements are presented in Tables A1 and A2. The observations of the MOST space telescope are listed in Tables A3 and A4 for V473 Lyr and U TrA, respectively. Tables A5 and A6 contain the Fourier coefficients we determined for V473 Lyr and U TrA.
Journal of spectroscopic observations of U TrA by the members of SASER and from ICRAR (Luckas). Top: spectra, with successful RV determination, time is corrected to BJD. Values in parentheses are offset from the literature data and likely erroneous. Bottom: spectra where we could not determine reliable RV values. Time is in JD.
| Time | RV | Observer | Detector | Wavelength | Resolution |
|---|---|---|---|---|---|
| (BJD/JD) | (km s−1) | range (Å) | Δλ/λ | ||
| 2456817.10503 | –12.37 | Heathcote | 4570–4792 | 5343 | |
| 2456818.96822 | –15.53 | Heathcote | 4571–4791 | 6754 | |
| 2456851.04387 | –15.53 | Heathcote | 4573–4791 | 4011 | |
| 2456860.02710 | –21.47 | Heathcote | 4577–4792 | 6125 | |
| 2457173.04020 | (–48.7) | Luckas | 5641–5774 | 9408 | |
| 2457180.04022 | (–51.3) | Luckas | 6065–6189 | 12884 | |
| 2457200.04302 | –3.76 | Bohlsen | 6080–6606 | 7606 | |
| 2457205.02001 | +7.56 | Bohlsen | 3799–7198 | 1464 | |
| 2457174.991 | – | Bohlsen | 3799–7199 | 1159 | |
| 2457194.578 | – | Cacella | 5785–6298 | 4289 | |
| 2457194.585 | – | Cacella | 5785–6298 | 4289 | |
| 2457194.592 | – | Cacella | 5785–6298 | 4289 | |
| 2457194.600 | – | Cacella | 5785–6298 | 4289 | |
| 2457224.998 | – | Bohlsen | 3799–7199 | 1504 |
RV data of V473 Lyr. This is a sample only, the entire table is accessible in the online version of the paper.
| BJD–2450000 | RV | Uncertainty | Observatory |
|---|---|---|---|
| (d) | (km s−1) | (km s−1) | |
| 6760.500400 | −12.80 | 0.12 | GAO |
| 6760.507449 | −12.86 | 0.14 | GAO |
| 6760.514498 | −12.73 | 0.12 | GAO |
| 6760.521559 | −12.46 | 0.13 | GAO |
| 6760.528608 | −12.24 | 0.14 | GAO |
| ... | |||
Photometric data of V473 Lyr obtained by the MOST space telescope. This is a sample only; the entire table is accessible in the online version of the paper. Units are in the instrumental magnitudes of MOST.
| HJD–2451545 | Brightness | Uncertainty |
|---|---|---|
| (d) | (MOST mag) | (MOST mag) |
| 5291.507433 | 12.195 46 | 0.000 43 |
| 5291.508872 | 12.195 86 | 0.000 43 |
| 5291.573474 | 12.207 19 | 0.000 43 |
| 5291.574194 | 12.208 30 | 0.000 43 |
| 5291.574913 | 12.208 76 | 0.000 43 |
| ... | ||
| HJD–2451545 | Brightness | Uncertainty |
|---|---|---|
| (d) | (MOST mag) | (MOST mag) |
| 5291.507433 | 12.195 46 | 0.000 43 |
| 5291.508872 | 12.195 86 | 0.000 43 |
| 5291.573474 | 12.207 19 | 0.000 43 |
| 5291.574194 | 12.208 30 | 0.000 43 |
| 5291.574913 | 12.208 76 | 0.000 43 |
| ... | ||
Photometric data of U TrA obtained by the MOST space telescope. This is a sample only; the entire table is accessible in the online version of the paper. Units are in the instrumental magnitudes of MOST.
| HJD–2451545 | Brightness | Uncertainty |
|---|---|---|
| (d) | (MOST mag) | (MOST mag) |
| 5261.701539 | 13.389 36 | 0.000 54 |
| 5261.702972 | 13.392 79 | 0.000 54 |
| 5261.707270 | 13.389 89 | 0.000 54 |
| 5261.708703 | 13.389 48 | 0.000 54 |
| 5261.710136 | 13.389 34 | 0.000 53 |
| ... | ||
| HJD–2451545 | Brightness | Uncertainty |
|---|---|---|
| (d) | (MOST mag) | (MOST mag) |
| 5261.701539 | 13.389 36 | 0.000 54 |
| 5261.702972 | 13.392 79 | 0.000 54 |
| 5261.707270 | 13.389 89 | 0.000 54 |
| 5261.708703 | 13.389 48 | 0.000 54 |
| 5261.710136 | 13.389 34 | 0.000 53 |
| ... | ||
Results of the frequency analysis of V473 Lyr.
| ID | Frequency | Amplitude | Phase |
|---|---|---|---|
| (d−1) | (mag) | (rad/2π) | |
| f2 | 0.670 71(29) | 0.104 64(13) | 0.0482(20) |
| 2 f2 | 1.3416(25) | 0.010 48(14) | 0.3372(23) |
| 3 f2 | 2.0116(30) | 0.001 57(40) | 0.560(12) |
| 0.5 f2 | 0.3359(30) | 0.0016(5) | 0.600(12) |
| 1.5 f2 | 1.0000(19) | 0.001 37(15) | 0.768(12) |
| 2.5 f2 | 1.6754(25) | 0.001 61(22) | 0.155(16) |
Results of the frequency analysis of U TrA.
| ID | Frequency | Amplitude | Phase |
|---|---|---|---|
| (d−1) | (mag) | (rad/2π) | |
| f0 | 0.389 377(8) | 0.300 50(15) | 0.449 66(6) |
| 2 f0 | 0.778 72(2) | 0.099 39(14) | 0.498 71(18) |
| 3 f0 | 1.168 26(6) | 0.038 64(14) | 0.4693(5) |
| 4 f0 | 1.5581(2) | 0.015 12(14) | 0.8976(12) |
| 5 f0 | 1.9461(4) | 0.006 27(15) | 0.876(3) |
| 6 f0 | 2.3355(9) | 0.002 72(14) | 0.975(7) |
| f1 | 0.547 97(2) | 0.113 92(13) | 0.577 58(16) |
| 2 f1 | 1.096 06(16) | 0.014 71(13) | 0.9631(12) |
| 3 f1 | 1.6511(9) | 0.0025(9) | 0.736(7) |
| f0 + f1 | 0.937 21(3) | 0.076 55(14) | 0.1290(2) |
| 2 f0 + f1 | 1.326 86(5) | 0.048 89(14) | 0.5661(4) |
| 3 f0 + f1 | 1.715 87(9) | 0.024 63(15) | 0.4039(7) |
| 4 f0 + f1 | 2.105 69(18) | 0.013 05(14) | 0.9232(14) |
| 5 f0 + f1 | 2.4944(3) | 0.006 96(14) | 0.367(3) |
| 6 f0 + f1 | 2.8820(6) | 0.003 64(14) | 0.678(5) |
| 7 f0 + f1 | 3.2639(15) | 0.001 59(14) | 0.630(11) |
| f0 + 2 f1 | 1.485 70(12) | 0.018 91(15) | 0.4091(10) |
| 2 f0 + 2 f1 | 1.875 47(18) | 0.013 28(14) | 0.2408(14) |
| 3 f0 + 2 f1 | 2.2640(2) | 0.009 37(15) | 0.351(2) |
| 4 f0 + 2 f1 | 2.653 31(4) | 0.006 33(13) | 0.762(3) |
| 5 f0 + 2 f1 | 3.0394(7) | 0.003 24(15) | 0.886(6) |
| 6 f0 + 2 f1 | 3.4318(14) | 0.001 63(14) | 0.817(11) |
| 7 f0 + 2 f1 | 3.8180(16) | 0.001 47(13) | 0.566(12) |
| 8 f0 + 2 f1 | 4.2101(19) | 0.001 18(15) | 0.702(15) |
| f0 + 3 f1 | 2.0293(7) | 0.003 54(13) | 0.539(5) |
| 2 f0 + 3 f1 | 2.4247(6) | 0.004 02(13) | 0.604(5) |
| 3 f0 + 3 f1 | 2.8141(9) | 0.002 77(15) | 0.414(7) |
| f1 − f0 | 0.158 27(7) | 0.033 31(15) | 0.6674(5) |
| 2 f0 − f1 | 0.2304(3) | 0.006 91(13) | 0.627(3) |
| 3 f0 − f1 | 0.6158(10) | 0.002 41(14) | 0.515(8) |
| 4 f0 − f1 | 1.0040(8) | 0.003 14(14) | 0.408(6) |
| 5 f0 − f1 | 1.4024(12) | 0.0020(3) | 0.968(9) |
| 2 f1 − f0 | 0.7070(3) | 0.007 55(14) | 0.453(2) |
| 2 f1 − 2 f0 | 0.3212(7) | 0.003 20(14) | 0.398(6) |
| fX? | 0.8551(13) | 0.001 85(13) | 0.283(10) |
| fX + f1? | 1.2632(9) | 0.0027(3) | 0.568(7) |
| fX + f0? | 1.276 02(15) | 0.001 61(16) | 0.417(11) |
