


Abstract
Supernova (SN) 2015bh (or SNhunt275) was discovered in NGC 2770 on 2015 February with an absolute magnitude of Mr ∼ −13.4 mag, and was initially classified as an SN impostor. Here, we present the photometric and spectroscopic evolution of SN 2015bh from discovery to late phases (∼1 yr after). In addition, we inspect archival images of the host galaxy up to ∼21 yr before discovery, finding a burst ∼1 yr before discovery, and further signatures of stellar instability until late 2014. Later on, the luminosity of the transient slowly increases, and a broad light-curve peak is reached after about three months. We propose that the transient discovered in early 2015 could be a core-collapse SN explosion. The pre-SN luminosity variability history, the long-lasting rise and faintness first light-curve peak suggests that the progenitor was a very massive, unstable and blue star, which exploded as a faint SN because of severe fallback of material. Later on, the object experiences a sudden brightening of 3 mag, which results from the interaction of the SN ejecta with circumstellar material formed through repeated past mass-loss events. Spectroscopic signatures of interaction are however visible at all epochs. A similar chain of events was previously proposed for the similar interacting SN 2009ip.
INTRODUCTION
Massive stars are known to lose mass via steady state winds or through dramatic eruptions in which they increase significantly their brightness, becoming intermediate-luminosity optical transients. In some cases, these non-terminal outbursts compete in luminosity with real supernovae (SNe), and may also mimic their observables. For this reason, they are commonly known as ‘SN impostors’ (e.g. Van Dyk et al. 2000). As a consequence, these luminous eruptions of massive stars may be misclassified as genuine SNe. This is what frequently happens with giant eruptions of massive stars such as luminous blue variable (LBV) stars, whose spectra are characterized by incipient narrow (full width at half-maximum – FWHM – lower than about 1000 km s−1) hydrogen lines in emission, resembling those observed in Type IIn SNe. In Type IIn SNe, the narrow features are usually interpreted as signatures of interaction between the SN ejecta and the circumstellar medium (CSM) embedding the SN. In general, the discrimination between SN impostors and Type IIn SNe is often controversial (see e.g. SN 2011ht-like objects, Roming et al. 2012; Mauerhan et al. 2013b; or even SN 1961V, Van Dyk, Filippenko & Li 2002; Chu et al. 2004; Kochanek, Szczygiel & Stanek 2011; Van Dyk & Matheson 2012), and in some cases even the inspection of the sites in deep, high-spatial resolution images obtained many years after the explosion does not provide unequivocal verdicts (e.g. see Van Dyk & Matheson 2012).
The mechanisms triggering these eruptions are still unknown (see Humphreys & Davidson 1994; Smith et al. 2011). A connection between some LBVs with SNe IIn as proposed by for example (Kotak & Vink 2006; Smith & Owocki 2006; Trundle et al. 2009), and occasionally LBVs have been proved to explode as bright SNe IIn (e.g. Gal-Yam et al. 2007; Gal-Yam & Leonard 2009). However, although LBVs are the most usual channel to explain the bursty activity of the SN impostors, these outburst have also been linked to lower mass stars (e.g. the cases of SN 2008S and NGC 3000-OT; Bond et al. 2009; Smith et al. 2009), or the interaction of massive binaries (e.g. Kashi 2010). Outbursts of massive stars may be precursors of terminal SN explosions (e.g. see Ofek et al. 2014), and these instabilities are presumably related to physical processes occurring when the stars approach the end of their life (for instance, after the beginning of neon or oxygen burning – weeks to years prior the explosion; e.g. Fraser et al. 2013b; Smith & Arnett 2014). Such outbursts were very likely observed in a few cases, including LSQ13zm (Tartaglia et al. 2016), SN 2010mc (Ofek et al. 2013), or the well-studied case of SN 2009ip. The latter had experienced repeated outbursts from – at least – 2009 to early 2012 (Pastorello et al. 2013), followed by a more luminous, double-peaked re-brightening in summer-autumn 2012 (Fraser et al. 2013a; Mauerhan et al. 2013a; Pastorello et al. 2013; Prieto et al. 2013; Graham et al. 2014; Margutti et al. 2014). The mid-to-late 2012 event was interpreted as the terminal core-collapse SN explosion (e.g. Smith, Mauerhan & Prieto 2014), as a merger burst event in a close binary system (Kashi, Soker & Moskovitz 2013; Soker & Kashi 2013), or as collisions of massive shells formed through repeated mass-loss events with the progenitor still alive (Fraser et al. 2015; Moriya 2015). What is clear, in the case of SN 2009ip, is that there is a complex environment surrounding the central object (e.g. Levesque et al. 2014; Margutti et al. 2014; Martin et al. 2015; Mauerhan et al. 2014) which is impeding our inspection of the inner region of the nebula to verify whether the central star is still alive or not.
In other cases, repeated intermediate-luminosity outbursts have been registered, without leading (so far) to an SN explosion. This sample of rare transients includes SN 2000ch (Wagner et al. 2004; Pastorello et al. 2010), SNhunt248 (Kankare et al. 2015; Mauerhan et al. 2015), and UGC 2773-OT (Smith et al. 2016).
A recent example of a transient with a long variability history is SN 2015bh (α = 09|$^{\rm h}09^{\rm m}35{^{\rm s}_{.}}$|12, δ = +33°07΄21|${^{\prime\prime}_{.}}$|3; J2000.0; Fig. 1), also known as SNhunt275, iPTF13efv, PSN J09093496+3307204 or PSN J09093506+3307221. It was discovered in NGC 2770 on 2015 February 07.39 ut, with an unfiltered magnitude of 19.9, by Stan Howerton and the Catalina Real Time Transient Survey (CRTS; Howerton et al. 2015),1 although it was first detected in 2013 by the Intermediate Palomar Transient Factory (iPTF;2 Ofek et al. 2016). Independent discoveries were also reported by Z.-j. Xu (Nanjing, Jiangsu, China) and X. Gao (Urumqi, Xinjiang, China; Howerton et al. 2015). A spectrum was taken on 2015 February 09.93 UTC (Elias-Rosa et al. 2015), by the Asiago Transient Classification Program (Tomasella et al. 2014). It shows a strong Hα emission line with both a broad (FWHM ∼ 6800 km s−1) and a narrow (FWHM ∼ 900 km s−1) component, resembling the spectra of the SN/impostors 2000ch (Wagner et al. 2004; Pastorello et al. 2010) and 2009ip (before the explosion of 2012 June; e.g. Pastorello et al. 2013).
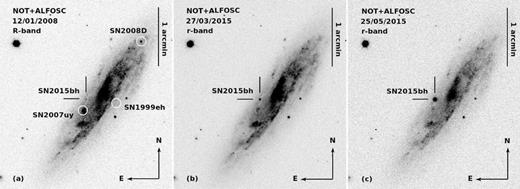
R- and r-band images of SN 2015bh in NGC 2770 obtained with the 2.56 m Nordic Optical Telescope+ALFOSC at Roque de los Muchachos Observatory (Spain) on 2008 January 12 (a), 2015 March 27 (b), and 2015 May 25 (c). The locations of the transient and those of the three SNe exploded in NGC 2770 are indicated.
In this manuscript, we investigate the nature of SN 2015bh. In the next section (Section 2), we describe the host galaxy of SN 2015bh. In Sections 3 and 4, we present the photometric and spectroscopic results, and in Section 5 we constrain the properties of the progenitor star. The combination of all this information is discussed in detail in Section 6. Finally, the main results are summarized in Section 7. Notice that a study on SN 2015bh has already been published by Ofek et al. (2016), and further discussed by Soker & Kashi (2016) and Thöne et al. (2016), confirming the complex nature of SN 2015bh. Different possible interpretations of the chain of events of this object are presented in these works (equation 6).
HOST GALAXY, DISTANCE AND REDDENING OF SN 2015BH
The host galaxy, NGC 2770, is morphologically classified as a spiral galaxy with a small bulge, open and clumpy spiral arms, and large H i mass [SA(s)c3]. Its star formation rate is comparable to the values estimated for the Milky Way. The galaxy has a small irregular companion, NGC 2770B, with high star formation rate (see e.g. Thöne et al. 2009). NGC 2770 has already hosted three Type Ib SNe: 1999eh (Hurst, Armstrong & Boles 1999), 2007uy, and 2008D (see e.g. Mazzali et al. 2008; Soderberg et al. 2008), being consequently branded as a possible SN Ib factory (Thöne et al. 2009).
Throughout the paper, we will adopt a distance to NGC 2770 of 29.3 ± 2.1 Mpc (μ = 32.33 ± 0.15 mag), as derived from the recessional velocity of the galaxy (Haynes et al. 1997) corrected for Local Group infall into the Virgo cluster (Mould et al. 2000) vVir = 2137 ± 17 km s−1(z = 0.007), and assuming H0 = 73 km s−1Mpc−1 (values taken from NED).
We will also adopt the total reddening value of |$E(B-V) = 0.21^{+0.08}_{-0.05}$| mag towards SN 2015bh, as derived by Thöne et al. (2016) from the equivalent width (EW) of the interstellar Na iD lines in a high-resolution spectrum taken on 2015 June 04.
PHOTOMETRY
Observations and data reduction
Optical UBVRI (Johnson Cousins system) and ugriz (Sloan system) images of SN 2015bh were taken using a large number of observing facilities, listed in Table A1. We also collected archival and unfiltered data from amateur astronomers taken since 1994, i.e. ∼21 yr before the target discovery. The data set was completed with images taken in the near-infrared (NIR) domain, and observations from space telescopes such as the Ultraviolet and Optical Telescope (UVOT) on board of the SWIFT satellite, and the Hubble Space Telescope (HST).
Photometric observations were pre-processed following the standard recipe in iraf4 for CCD images (overscan, bias, and flat-field corrections). For infrared exposures, we also applied an illumination correction and sky background subtraction using the external iraf package NOTCam (version 2.5)5 for the NOT images and a custom idl routines for the CPAPIR images (Artigau et al. 2004). The SN magnitudes were measured using a dedicated pipeline (snoopy; Cappellaro 2014). This consists of a collection of python scripts calling standard iraf tasks (through pyraf), and other specific analysis tools, in particular SExtractor, for instrument extraction and star/galaxy separation, daophot, to measure the instrumental magnitude via point spread function (PSF) fitting, and hotpants,6 for image difference with PSF matching.
In order to calibrate the transient's instrumental magnitudes to standard photometric systems, we used Sloan Digital Sky Survey (SDSS) stars in the field as reference. When needed, these were converted to the Johnson Cousins system using the relations in Chonis & Gaskell (2008). For the infrared photometry, we used as reference for the calibration the Two Micron All Sky Survey (2MASS) catalogue.
Unfiltered instrumental magnitudes from amateur images were also measured through the PSF fitting technique. These were then rescaled to Sloan r-band magnitudes, as this best matches the quantum efficiency peaks of the detectors used for these observations.
When the transient was not detected, upper limits were estimated, corresponding to a peak of 2.5 times the background standard deviation. Error estimates were obtained through an artificial star experiment, combined (in quadrature) with the PSF fit error returned by daophot, and the propagated errors from the photometric calibration.
The final calibrated magnitudes of SN 2015bh are listed in Tables A2–A4. Optical UBVRI and NIR data are reported in vegamag scale, while ugriz data are in ab mag scale.
SWIFT pointed to the field of SN 2015bh at different epochs since 2008 with ultraviolet (UV) and optical filters thanks to the follow-up campaigns of SNe 2007uy and 2008D. A preliminary analysis showed that the transient was not visible in 2008. We estimated upper limits of 19.6, 19.6, and 19.4 mag for SWIFT, UVW2, UVM2, and UVW1, respectively. We therefore combined all images of 2008, and used the resulting stacked image as a template for the analysis of images obtained in subsequent epochs. The magnitudes of the transient were obtained using the pipeline from the Swift's Optical/Ultraviolet Supernova Archive (SOUSA; Brown et al. 2014), which uses revised zero-points on the UVOT-Vega system (Breeveld et al. 2011) and includes time-dependent sensitivity corrections. The derived magnitudes are listed in Table A5. As the UVOT U band is much bluer than Johnson Cousins U or Sloan u, we will treat these bands separately.
Finally, HST observed the SN 2015bh field with WFPC2 in a large set of filters between 2008 and 2009 (see Table A6). The magnitudes of the transient in vegamag were obtained using the hstphot7 package (Dolphin 2000).
Light curves
The UVOT UV and uUBgVrRiIzJHK light curves of SN 2015bh after the discovery on 2015 February 07 are shown in Fig. 2. The light curve of the transient shows a slow rise of ∼1.5 mag in around 100 d in all bands, which we label as the ‘2015a’ event. This episode is followed by a sudden steeper increase in the light-curve brightness (by about 3 mag in less than 10 d), labelled as the ‘2015b’ event (this re-brightening was also reported by de Ugarte Postigo et al. 2015, and independently detected by R. Arbour,8 South Wonston, UK). This leads to a light-curve peak of −17.81 mag in the r band, followed by a slow decline for the next 30 d. The observational campaign was subsequently interrupted because of the alignment with the Sun, and observations restarted about 3 months later. At that time, the transient was still visible but had dimmed by over 4 mag (see Table A2). We also notice that, after the 2015b peak, the luminosity of the object decreases more rapidly in the blue bands than the red bands, indicating that the peak of the spectral energy distribution (SED) progressively shifts to longer wavelengths. Table 1 reports the peak magnitudes of the 2015a event, as well as the peak epochs and magnitudes for the 2015b event, all obtained by fitting the light curves with low-order polynomials. Post-maximum and tail decline rates are also disclosed in the same table. In the following, we will adopt as reference epoch that of the 2015b r-band maximum, i.e. 2015 May 24.28, or MJD 57166.28 ± 0.29.
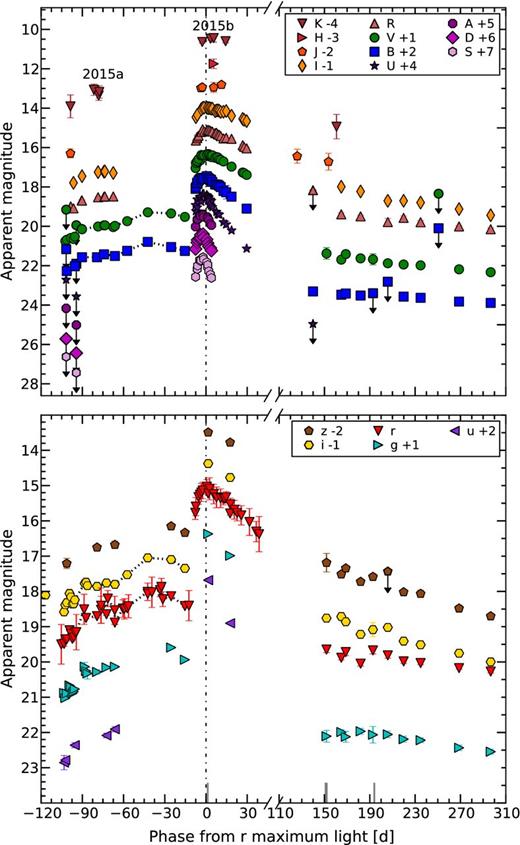
Optical light curves of SN 2015bh. Upper limits are indicated by a symbol with an arrow. The solid marks on the abscissa axis indicate the phases at which spectra are obtained. The dotted line connects the magnitudes during the 2015a event. The dot–dashed vertical line indicates the r-band maximum light of SN 2015bh. The light curves have been shifted for clarity by the amounts indicated in the legend. Note that the filters named as SDA correspond to the SWIFT, UVW2, UVM2, UVW1 filters, respectively. The uncertainties for most data points are smaller than the plotted symbols. A colour version of this figure can be found in the online journal.
Peak epochs, peak apparent magnitudes, and decline rates of SN 2015bh in different bands.
| Banda | MJDmax, 2015a | mmax, 2015a | MJDmax, 2015b | mmax, 2015b | Decline from max. | Tail rate at ≳150 d |
|---|---|---|---|---|---|---|
| (mag) | (mag) | [mag (30 d)−1]b | [mag (100 d)−1] | |||
| U | – | – | 57165.04 (0.10) | 14.67 (0.05) | 2.81 (0.05) | – |
| B | 57131.35 (2.03) | 18.87 (0.06) | 57165.34 (0.33) | 15.50 (0.05) | 1.27 (0.05) | 0.31 (0.05) |
| V | 57134.07 (1.00) | 18.28 (0.06) | 57167.03 (0.11) | 15.38 (0.05) | 1.07 (0.05) | 0.72 (0.13) |
| R | – | – | 57166.71 (0.20) | 15.11 (0.05) | 0.95 (0.05) | 0.52 (0.21) |
| I | – | – | 57166.26 (0.13) | 14.98 (0.05) | 0.70 (0.05) | 1.21 (0.20) |
| u | – | – | – | – | 2.28 (0.50) | – |
| g | – | – | – | – | 1.17 (0.25) | 0.38 (0.07) |
| r | 57132.35 (1.00) | 18.11 (0.06) | 57166.28 (0.29) | 15.10 (0.20) | 1.06 (0.16) | 0.46 (0.07) |
| i | 57134.35 (0.59) | 18.07 (0.06) | – | – | 0.73 (0.20) | 1.01 (0.09) |
| z | 57136.00 (1.00) | 18.19 (0.06) | – | – | 0.55 (0.20) | 1.03 (0.16) |
| J | – | – | 57170.69 (1.20) | 14.81 (0.20) | – | – |
| K | – | – | 57172.87 (0.62) | 14.44 (0.20) | – | – |
| UVW2 | – | – | 57163.92 (0.23) | 14.62 (0.05) | 7.02 (0.11) | – |
| UVM2 | – | – | 57163.56 (0.31) | 14.48 (0.05) | 5.00 (0.06) | – |
| UVW1 | – | – | 57163.46 (0.35) | 14.42 (0.05) | 4.10 (0.06) | – |
aThe maximum magnitude of the 2015a event of the uUgRIJHK and UV light curves could not be constrained. The same is true for the ugizH peaks of the 2015b event.
bConsidering an interval of 30 d from maximum light. In the case of ugiz, we extrapolate to 30 d the decline estimated between the only two detections in these bands after maximum.
As we mentioned before, the site of SN 2015bh was monitored for more than 20 yr before the transient's discovery (see Fig. 1 and Tables A2, A3, A5 and A6). A large fraction of data was collected by amateur telescopes, complemented by a few deep images obtained with the Isaac Newton Telescope (see Table A1) and the Pan-STARRS telescope (Kaiser et al. 2010) during its 3Π survey operations (the filter system and calibration are described in Schlafly et al. 2012; Tonry et al. 2012; Magnier et al. 2013). In these deeper images, we detect a source at the position of SN 2015bh. In addition, examining the data from the extensive follow-up campaigns of SNe 2007uy and 2008D, additional detections are found in 2008 and 2009, including data taken with HST. Interestingly, the transient is detected only at red wavelengths during these years from ground-based telescopes, and we could obtain only upper limits in the other bands. In Fig. 3, we plot the historic rR absolute light curve of SN 2015bh (r magnitudes in the Sloan system have been scaled to the vegamag system by adding a conversion value of 0.16; Blanton & Roweis 2007). The pre-discovery detections and upper limits indicate that the target likely remained at a magnitude below −14 for almost 21 yr, except for an outburst at r ∼ −14.5 mag in 2013 December (detected with a 0.4 m telescope), coincident with the iPTF detection (Duggan et al. 2015; Ofek et al. 2016). Neglecting this outburst, we may note a long-duration brightening, and some signatures of erratic variability.
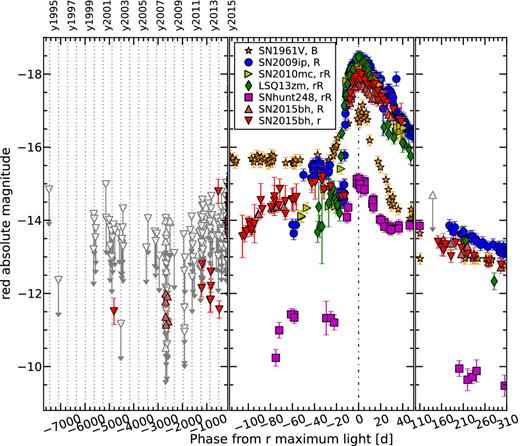
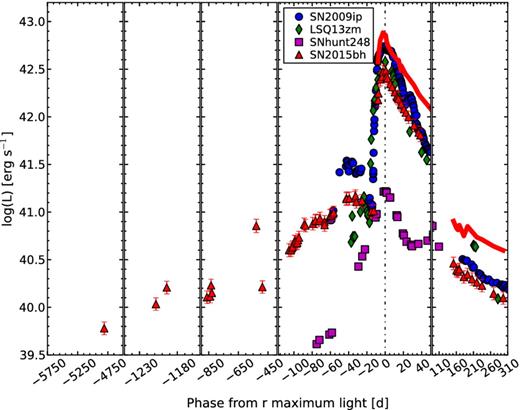
Historical absolute vegamagrR light curve of SN 2015bh (filled triangles), shown along with those of SNe 1961V (in B band; stars), 2009ip (circles), 2010mc ( rotated triangles), LSQ13zm (diamonds), and SNhunt248 (squares). SN 2015bh's upper limits are indicated by empty triangles with arrows. The dot–dashed vertical line indicates the r-band maximum light of SN 2015bh. A colour version of this figure can be found in the online journal.
The rR absolute magnitude light curve of SN 2015bh is compared in Fig. 3 with those of other objects with multipeaked light curves, namely the controversial SNe 1961V (Bertola 1963, 1964, 1965, 1967), 2009ip (Maza et al. 2009; Pastorello et al. 2010, 2013; Smith et al. 2010; Foley et al. 2011; Fraser et al. 2013a, 2015; Mauerhan et al. 2013a; Margutti et al. 2014), SN 2010mc (Ofek et al. 2013), LSQ13zm (Tartaglia et al. 2016), and SNhunt248 (Kankare et al. 2015). Only the latter was clearly an impostor, although its multipeaked light curve shows some resemblance with the other objects of the sample. The light curves of the comparison objects have been computed accounting for the distance and extinction values obtained from the literature.9 From the comparison, we note that both the 2015a and 2015b events of SN 2015bh are fainter than the equivalent events observed in SNe 2009ip, 2010mc and LSQ13zm, but brighter than those of the impostor SNhunt248. All the precursor outbursts of these transients show shorter duration than 2015a, except for SN 1961V. In general, the absolute magnitude of SN 2015bh during the 2015b event falls in the interval of peak magnitudes observed in SNe IIn, which is between −16 and −19 mag (Kiewe et al. 2012; the 2015a event reaches a maximum value of ∼− 14.8 mag in the r band). It is significantly brighter than SNhunt248, which is one of the most luminous confirmed SN impostors. All of this may suggest that the 2015b event was an actual SN explosion. However, as we will see in Section 4, spectroscopic considerations may lead to different conclusions.
One additional property is that, during the 2015a event, the SN 2015bh light curves possibly show some small-scale fluctuations superposed on the broad curvature (see Fig. 2). A more evident modulation was seen in the SN 2009ip light curve, although after the 2012b peak (e.g. Martin et al. 2015), and was attributed to clumps or heterogeneity in the gas shells expelled by the progenitor star in previous mass-loss events10
Finally, around 150 d after maximum, SN 2015bh has faded to Mr = −13.26 ± 0.17 mag, ∼4 mag dimmer than at maximum, showing a slow decline, mostly notable in the redder bands (see Table 1). This behaviour suggests a still ongoing CSM interaction. The luminosity at these phases is ∼2 mag higher than at the first detection of SN 2015bh in 2002 March (see Table A3). Moreover, as we can see in Fig. 3, SN 2015bh remains always fainter than SN 2009ip at coeval epochs.
In Fig. 4, we show the evolution of intrinsic Johnson–Cousins colour indices for SN 2015bh, SN 2009ip, LSQ13zm and SNhunt248. SN 2015bh shows a relatively flat colour evolution during the 2015a event, but suddenly becomes bluer when the 2015b event takes place. After maximum it turns again towards the red and at late times, i.e. ≳150 d after the maximum light, the (B − V)0 colour of SN 2015bh is roughly the same as that registered during the 2015a event. A similar colour evolution is also seen in the comparison objects during the most luminous outbursts, whilst there are some differences during the first event.
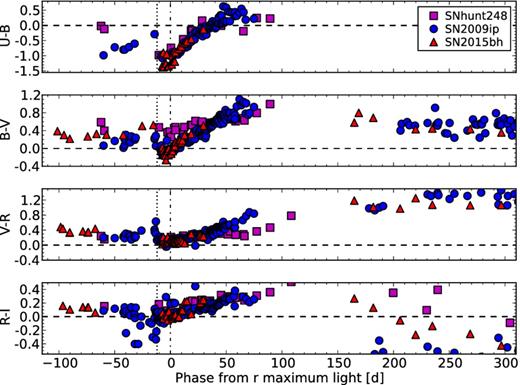
Intrinsic colour curves of SN 2015bh (filled triangles), compared with those of SN 2009ip (circles), and SNhunt248 (squares). The dotted vertical line marks the approximate date of the beginning of the 2015b event. The dot–dashed vertical line indicates the r-band maximum light of SN 2015bh. A colour version of this figure can be found in the online journal.
We computed a pseudo-bolometric light curve of SN 2015bh for each event separately (see Fig. 5). The fluxes at the effective wavelengths were derived from extinction-corrected apparent magnitudes. We computed the bolometric luminosity at epochs when observations in the r band were available. When no observation in another filter was available, the missing photometric point was recovered by interpolating the values from epochs close in time or, when necessary, by extrapolating the missing photometry assuming a constant colour. We estimated the pseudo-bolometric flux at each epoch integrating the SED using the trapezoidal rule, and assuming zero flux outside the integration boundaries. Finally, the luminosity was derived from the measured flux accounting for the adopted distance. For phases <−10 d, we integrated the flux only for the optical wavelength range, i.e. from U to z band, while for the 2015b event, we computed the pseudo-bolometric curve considering first the optical bands only, and then including the UV and NIR bands.
Pseudo-bolometric optical light curves of SN 2015bh (triangles) compared with those of SN 2009ip (circles), LSQ13zm (diamonds), and SNhunt248 (squares). The UV-optical-NIR light curve of SN 2015bh during the 2015b event is also shown (thick solid line). The dot–dashed vertical line indicates the r-band maximum light of SN 2015bh. A colour version of this figure can be found in the online journal.
The errors in the bolometric luminosity account for the uncertainties in the distance estimate, the extinction and the apparent magnitudes.
By fitting low-order polynomials to the pseudo-bolometric light curve, we estimated that SN 2015bh reached a peak of luminosity of (1.4 ± 0.3) × 1041 erg s−1 during the first event, and (29.3 ± 6.1) × 1041 erg s−1 during the 2015b event – which increases to (72.9 ± 16.0) × 1041 erg s−1 if we include the UV and the NIR contribution (see Table 2). In Fig. 5, we include also the pseudo-bolometric light curves (from U to z band) of SN 2009ip, LSQ13zm and SNhunt248, which we calculated in a similar manner as that of SN 2015bh (for LSQ13zm we have no contribution estimated in the U band). As we can see in the figure, while the overall luminosity of SN 2015bh is fainter than those of SN 2009ip and LSQ13zm (but more luminous than SNhunt248).
Peak of the pseudo-bolometrica light curves of SN 2015bh and comparison transients.
| Object | Luminositymax, 2015a | Luminositymax, 2015b |
|---|---|---|
| (× 1041 erg s−1) | (× 1041 erg s−1) | |
| SN 2009ip | – | 53.0 (7.3) |
| LSQ13zm | – | 38.6 (5.4) |
| SNhunt248 | – | 1.6 (0.2) |
| SN 2015bh | 1.4 (0.3) | 29.3 (6.1) |
| SN 2015bhb | – | 72.9 (16.0) |
| Object | Luminositymax, 2015a | Luminositymax, 2015b |
|---|---|---|
| (× 1041 erg s−1) | (× 1041 erg s−1) | |
| SN 2009ip | – | 53.0 (7.3) |
| LSQ13zm | – | 38.6 (5.4) |
| SNhunt248 | – | 1.6 (0.2) |
| SN 2015bh | 1.4 (0.3) | 29.3 (6.1) |
| SN 2015bhb | – | 72.9 (16.0) |
aFrom U to z bands but for LSQ13zm in which the U band was not available.
bIncluding the UV and the NIR contribution.
SPECTROSCOPY
Observations and data reduction
Spectroscopic monitoring of SN 2015bh started soon after the discovery, on 2015 February 09.97 ut, and lasted until 2016 March 05.89 ut, interrupted by ∼100 d when the transient was too close to the Sun. Basic information on our spectra is reported in Table A7.
All spectra were reduced following standard procedures with iraf routines. The two-dimensional frames were de-biased and flat-field corrected, before performing the extraction of the 1D spectra. The wavelength calibration was accomplished with the help of arc-lamp exposures obtained in the same night, and then the accuracy of the calibration was checked using night-sky lines. The spectra were flux calibrated using the high signal-to-noise exposure of spectrophotometric standards stars (Oke 1990; Hamuy et al. 1992, 1994). Finally, the flux calibrated spectra were checked against the photometry at coeval epochs and a correction factor was applied to the flux in case of discrepancy. The standard star spectra were also used to remove the strongest telluric absorption bands (in some cases, residuals are still present after the correction).
Evolution of the spectral continuum and the major features
Fig. 6 shows the sequence of optical spectra of SN 2015bh. During the early stages of the 2015a event, i.e. from −100 to −60 d, the spectra exhibit a mildly blue continuum and very little evolution. They are dominated by multicomponent Balmer lines in emission and Fe ii features. Instead, the spectrum at −15.4 d (our last spectrum of the 2015a event), shows a red continuum, indicating that the temperature of the emitting regions has decreased (more detail is given below). However, at the onset of the 2015b event, the continuum temperature changes drastically, increasing by a factor 2, and then cools down again when the luminosity declines. During the first days after maximum light, the only visible features in the spectra are the Balmer lines, along with weak He i λ5876 (possibly blended with Na i), λ6678, and λ7065 features. From +16 d onwards, when the continuum becomes redder, the He i lines fade in intensity and the Fe ii line forest reappears. In particular, we note at some early epochs (<30 d) the presence of one or two weak absorptions features on the blue side of the Hα line.
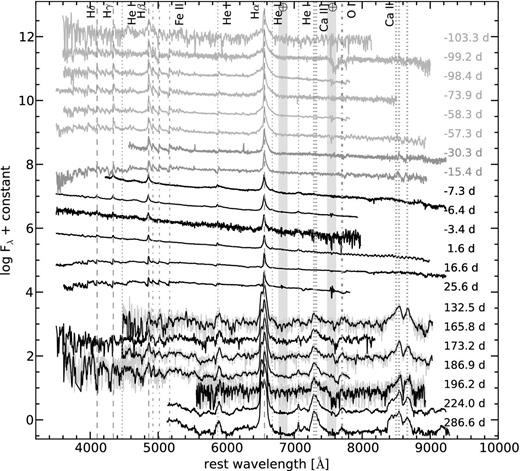
Sequence of optical spectra of SN 2015bh taken from 2015 February 09.97 UTC to 2016 March 05.89 ut. Shades of grey are used for spectra obtained during the 2015a event, spectra taken during and after the 2015b event are in black. The late spectra at 132.5, 173.2, 186.9, and 196.2 d are shown in grey, with a boxcar-smoothed (using a 8 pixel window) version of the spectra overplotted in black. The locations of the most prominent spectral features are indicated by vertical lines.
At late phases (>130 d), when the transient was recovered after the seasonal gap, the spectra show a deep change. The narrow lines have disappeared and broad lines are now evident. The He i features are more intense, and lines of calcium such as Ca ii] λλ7291, 7323, and Ca ii λλλ8498, 8542, 8662, along with sodium (Na i λλ5891, 5897; possible blended with He i λ5876) and weak oxygen (O i λ7774 and λ8446, and [O i] λ5577 and λλ6300, 6364) are also present. The Hα profile has also changed showing now three components. See Section 4.4 for more details.
The photospheric temperature is estimated by fitting the SED of SN 2015bh with a blackbody function after removing the strongest features of the spectra. The temperature evolution of SN 2015bh is shown in the panel (a) of Fig. 7. A conservative uncertainty for the temperature of about ± 500 K is assumed in our temperature estimates. As aforementioned, it increases from an average Tbb of 8500 K during the 2015a event, to Tbb ∼ 20 000 K at the peak of the 2015b event, after passing through a short-lasting temperature minimum, at Tbb ∼ 7100 K, just before the major re-brightening (see also Fig. 6). Within approximately 15 d from maximum light, the temperature decreases again to a similar value as during the 2015a event, i.e. ∼8000 K. These values are comparable with those of SN 2009ip (e.g. Margutti et al. 2014), or luminous interacting SNe IIn (Taddia et al. 2013), but somewhat higher (by around 30 per cent) than those of LSQ13zm (Tartaglia et al. 2016).
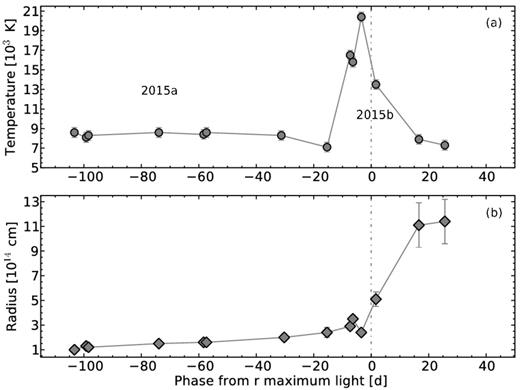
Panel (a): evolution of the best-fitting blackbody temperatures. Panel (b): evolution of the radius at the photosphere. The solid line connects the temperature and radius measurements. The dot–dashed vertical line indicates the r-band maximum light of SN 2015bh (MJDmax = 57166.28 ± 0.29). Both 2015a and 2015b events are also indicated.
Given the temperature and the pseudo-bolometric luminosity of SN 2015bh, we approximate the evolution of the radius of the photosphere. As displayed in panel (b) of Fig. 7, the photospheric radius could have a very slow increase from 1 × 10¹⁴ to 3 × 1014 cm in about 100 d. Then, the radius sharply increases during the re-brightening of SN 2015bh (2015b). The same overall behaviour of the radius is also observed, for instance, in SNe 2009ip.
Note that this is a rough estimation of the photospheric radius since we are making assumptions in deriving the temperature and the luminosities of SN 2015bh. For instance, we are assuming a blackbody spectrum where the real spectra are also affected by the metal line blending, while we integrate the luminosity over a limited range of wavelength (from U to z band).
Evolution of the Balmer lines
The Balmer line profiles, in particular those of Hα, show evident changes in morphology with time (Fig. 8). In particular, we note strong differences in the line profiles between early and late phases. Analysing the evolution of the Hα components may allow us to probe the transient's environment, and hence the nature of SN 2015bh. We attempt to reproduce the entire line profile at different epochs using a least-squares minimization python script, which provides a multicomponent fit considering a χ2 close to one.11 Fig. 9 presents the results of the multicomponent fit at some representative epochs: before (−98.4 d), during (−6.4 d), and after (25.6 and 165.8 d) the 2015b maximum. The best fit of the Hα profiles are obtained using Lorentzian components in emission (a narrow and a broad component at early epochs, and three components at late time), and Gaussian components in absorption for the P-Cygni, when they were visible. The velocity estimates for the emission components are derived measuring their FWHM, while those of the absorbing gas shells are estimated from the wavelengths of the P-Cygni minima with respect to the Hα rest wavelength. The velocities of the different gas components are listed in Table 3, and their evolution is shown in Fig. 10. The velocity uncertainties were estimated with a bootstrap resampling technique, varying randomly the flux of each pixel according to a normal distribution having variance equal to the noise of the continuum. We did this procedure 100 times, and then took the error as the standard deviations of the fit parameters.
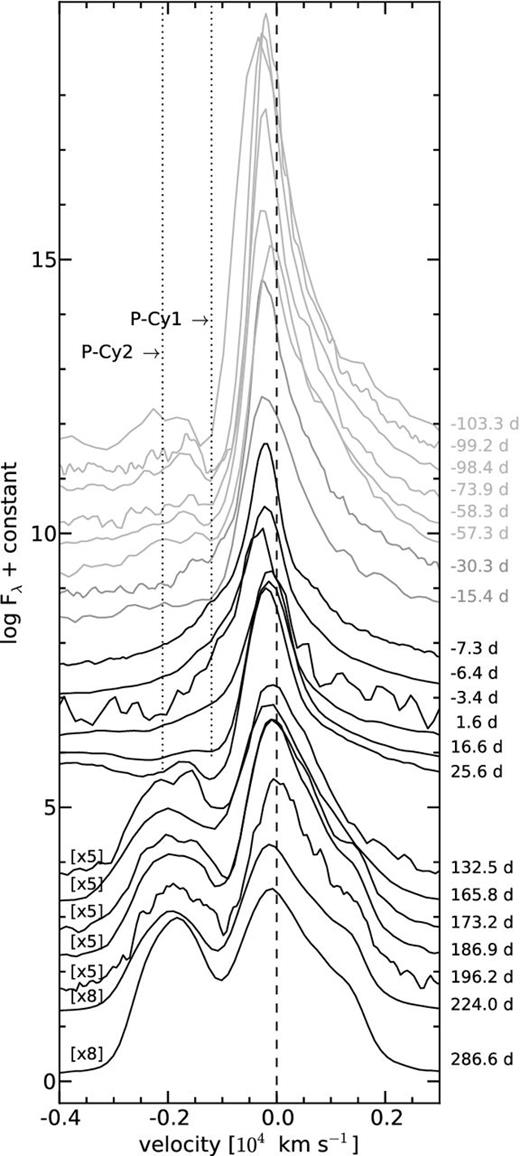
Evolution of the Hα profile in velocity space. The dotted lines indicate the major blue absorption components distinguished in the Hα line profile. The dashed lines mark the rest wavelength of Hα. Spectra have been vertically shifted for clarity by an arbitrary amount.
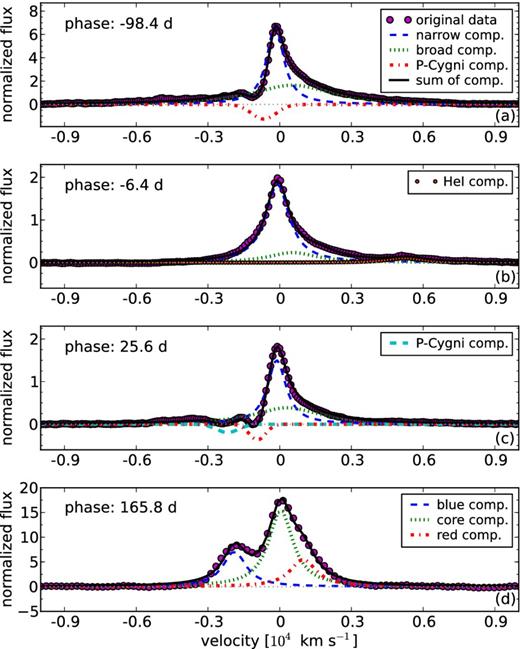
Decomposition of the Hα emission line of SN 2015bh before (−98.4 d), during (−6.4 d) and after (26.1 and 165.8 d) the 2015b event. A colour version of this figure can be found in the online journal.
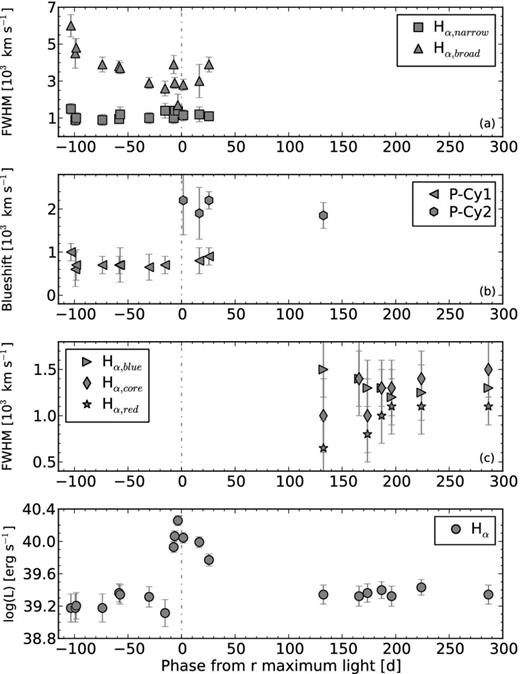
Panel (a): FWHM evolution for the broad and narrow Hα emissions. Panel (b): evolution of the blueshift of the P-Cy1 and P-Cy2 absorptions. Panel (c): FWHM evolution for the blue, core, and red Hα components at late phases. Panel (d): evolution of the total luminosity of Hα. The dot–dashed vertical line indicates the r-band maximum of SN 2015bh.
Main parameters as inferred from the spectra of SN 2015bh. The velocities are computed from the decomposition of the Hα profile.
| Date | MJD | Phase | Temperaturea | Radiusb | FWHMH α, nar | FWHMH α, br | vP-Cy1 | vP-Cy2 | LuminosityH α | EWH αc |
|---|---|---|---|---|---|---|---|---|---|---|
| (d) | (K) | (× 1014 cm) | (km s−1) | (km s−1) | (km s−1) | (km s−1) | (× 1039 erg s−1) | Å | ||
| 20150209 | 57062.97 | −103.3 | 8600 | 1.0 (0.1) | 1500 (300) | 6000 (600) | 1000 (200) | – | 1.5 (0.6) | 400 (80) |
| 20150214 | 57067.07 | −99.2 | 8100 | 1.3 (0.2) | 900 (300) | 4500 (800) | 600 (400) | – | 1.5 (0.6) | 300 (70) |
| 20150214 | 57067.88 | −98.4 | 8300 | 1.2 (0.2) | 1000 (300) | 4800 (500) | 700 (350) | – | 1.6 (0.6) | 300 (70) |
| 20150311 | 57092.37 | −73.9 | 8600 | 1.5 (0.2) | 900 (300) | 3900 (400) | 700 (200) | – | 1.5 (0.6) | 300 (60) |
| 20150326 | 57107.95 | −58.3 | 8400 | 1.6 (0.2) | 950 (200) | 3800 (300) | 700 (200) | – | 2.3 (0.6) | 200 (50) |
| 20150327 | 57108.93 | −57.3 | 8600 | 1.6 (0.2) | 1200 (400) | 3700 (300) | 700 (400) | – | 2.2 (0.6) | 250 (50) |
| 20140424 | 57136.00 | −30.3 | 8300 | 2.0 (0.3) | 1000 (300) | 2900 (300) | 650 (300) | – | 2.0 (0.6) | 150 (30) |
| 20150508 | 57150.90 | −15.4 | 7100 | 2.4 (0.4) | 1400 (400) | 2600 (400) | 700 (200) | – | 1.3 (0.5) | 100 (20) |
| 20150516 | 57158.96 | −7.3 | 16 500 | 2.9 (0.3) | 1000 (300) | 3900 (500) | – | – | 8.5 (1.3) | 70 (20) |
| 20150517 | 57159.90 | −6.4 | 15 800 | 3.5 (0.3) | 1400 (200) | 2900 (300) | – | – | 11.6 (1.8) | 70 (20) |
| 20150520 | 57162.84 | −3.4 | 20 400 | 2.4 (0.2) | 1400 (300) | 1700 (600) | – | – | 18.1 (2.6) | 70 (20) |
| 20150525 | 57167.91 | 1.6 | 13 500 | 5.1 (0.6) | 1150 (300) | 2800 (300) | – | 2200 (800) | 11.1 (1.7) | 50 (10) |
| 20150609 | 57182.89 | 16.6 | 7900 | 11.1 (1.8) | 1200 (400) | 3000 (900) | 800 (300) | 1900 (600) | 9.8 (1.5) | 60 (10) |
| 20150618 | 57191.90 | 25.6 | 7300 | 11.4 (1.8) | 1100 (200) | 3900 (400) | 900 (200) | 2200 (200) | 5.9 (1.0) | 50 (10) |
| FWHMblue | FWHMcore | FWHMred | vP-Cy2 | |||||||
| (km s−1) | (km s−1) | (km s−1) | (km s−1) | |||||||
| 20151003 | 57298.78 | 132.5 | – | – | 1500 (300) | 1000 (400) | 650 (300) | 1850 (300) | 2.2 (0.6) | 900 (180) |
| 20151105 | 57332.04 | 165.8 | – | – | 1400 (300) | 1400 (400) | 100 (300) | – | 2.1 (0.6) | 950 (190) |
| 20151113 | 57339.95 | 173.7 | – | – | 1300 (300) | 1000 (400) | 800 (300) | – | 2.3 (0.6) | 1000 (200) |
| 20151126 | 57353.13 | 186.9 | – | – | 1300 (200) | 1300 (300) | 1000 (300) | – | 2.5 (0.6) | 1200 (240) |
| 20151206 | 57362.45 | 196.2 | – | – | 1200 (300) | 1300 (300) | 1100 (300) | – | 2.1 (0.6) | 1200 (240) |
| 20160102 | 57390.25 | 224.0 | – | – | 1250 (300) | 1400 (300) | 1100 (300) | – | 2.7 (0.6) | 1500 (300) |
| 20160305 | 57452.89 | 286.6 | – | – | 1300 (200) | 1500 (300) | 1100 (200) | – | 2.2 (0.6) | 1500 (300) |
aWe consider a conservative uncertainty in the temperature of about ± 500 K.
bWe have propagated the uncertainties from the Stefan–Boltzmann equation.
cWe consider a conservative uncertainty in the EW of about 20 per cent of the measurements.
At phases <30 d, the best fit of Hα was obtained with two Lorentzian emission components, and one blueshifted absorption component. The FWHM of the narrow Hα emission remains nearly constant, with an average value of ∼1200 km s−1, while the broader component has a fast decline from ∼6000 km s−1 at early phases to ∼2600 km s−1 at −15.4 d, later on remaining roughly constant. We note that at 25.6 d, the broad component reaches a velocity of ∼3950 km s−1. This measurement is affected by some uncertainty and cannot be confirmed by a spectrum taken in the following days.
After a careful analysis of the Hα line profiles, we are able to distinguish a shallow absorption feature (hereafter labelled P-Cy1) in the blue wing of Hα, visible from day −103.3 to day −15.4, thus before the 2015b event. The P-Cy1 absorption is blueshifted by a constant amount of ∼750 km s−1. At the time of the 2015b event, this absorption is no longer visible. The increased temperature allows the formation of features such as the He i λ6678 line, as well as other He i lines. When the temperature falls (at phases > 15 d), the P-Cy1 feature becomes detectable again at an unchanged velocity. At the same time, a second absorption (hereafter labelled as P-Cy2) is observable, blueshifted by ∼2100 km s−1.
After the seasonal gap, at later phases (>130 d), the Hα profile is well reproduced with three Lorentzian components, which we will call blue, core, and red components, following the labelling in Benetti et al. (2016) for the Type II-L SN 1996al. The blue and core components are centred at an average wavelength of 6522 and 6563 Å, respectively. Instead, the red component displays a slight evolution from 6577 (at 132.5 d) to 6587 Å (at 286.6 d). The FWHM of these components shows different behaviour: the blue and red components start from different values, but after 190 d converge to similar and relatively constant widths of 1250/1100 km s−1. The width of the core component, instead, experiences a slow increase the same time interval from ∼1050 to ∼1500 km s−1. A small absorption can also be noticed on the top of the Hα profile's blue component in the first spectrum obtained after the transient's disappearance behind the Sun. This feature may correspond to the P-Cy2 absorption discussed before, with a velocity of ∼1850 km s−1 (see Fig. 10).
We also estimated the evolution of the total luminosity of the Hα line (see bottom panel of Fig. 10, and Table 3). As expected, the Hα luminosity evolves in a similar fashion as the broad-band light curves. It is roughly constant at ∼1.7 × 1039 erg s−1 during the 2015a event, then peaks at 18.0 × 1039 erg s−1 in the 2015b maximum, and decreases thereafter. At late phases it remains nearly constant at ∼2.3 × 1039 erg s−1.
Late-time spectra
The detailed inspection of the latest spectra of SN 2015bh (Fig. 11) is an excellent opportunity to peer into the very centre of the ejecta star, and constrain the mechanism that gives rise to the 2015a and 2015b events.
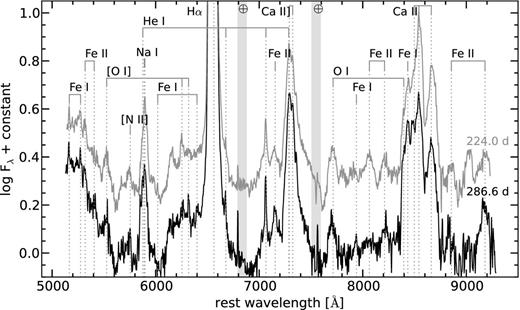
Late-time optical spectra of SN 2015bh at +224.0 (grey line) and +286.6 d (black line). The locations of the most prominent spectral features are indicated. A blueshift of 2500 km s−1 has been applied to the vertical lines that mark the rest wavelength of the oxygen.
As seen before, the late-time spectra still show narrow lines, although combined with by broader features than those seen in the earlier phases. The main change in the spectra is the profile of Hα. This emission line that dominated the spectra at early time was composed of two components, a narrow feature on top of a broader one. Instead, at late times, the Hα profile shows three components, interpreted as the result of the interaction between mostly spherical ejecta with an asymmetric CSM (see Section 4.3 and Benetti et al. 2016), where the blueshifted Hα component arises from faster material than the redshifted one. Note that Hβ is too weak to distinguish this change in the profile.
Resolved narrow lines of He i λ6678, λ7065, and λ7283 are also present at their rest position with FWHM around 500 km s−1. We do not see any narrow line of He i λ5876 in the spectrum at 224.0 d, but instead, we find a broad profile of FWHM ∼ 2500 km s−1. At 286.6 d, a weak line of He i appears in the blue side of the profile. In this case, the photons emitted by He i λ5876 may be scattered in the optically thick Na iD lines, resulting in an Na i doublet feature instead of a He i feature in the spectra. This mechanism only works if the He i lines originate in the inner layers of the SN ejecta at these late phases (e.g. see Benetti et al. 2016 for more details).
SN 2015bh late-time spectra also present primordial calcium features (Ca ii] λλ7291, 7323, and Ca ii λλλ8498, 8542, 8662), similar to core-collapse SNe. We tentatively identify lines of O i (λ7774 and λ8446) and [O i] (λ5577 and λλ6300, 6364), blueshifted by approximately 2500 km s−1. This suggests asymmetric SN ejecta, where a possible ‘blob’ of material, which is coming towards us, is being partially ionized by the SN ejecta. Interestingly, the [O i] doublet, is significantly narrower than the permitted oxygen lines (FWHM ≈ 1700 km s−1 versus 2800 km s−1), hence suggesting that these [O i] lines form in the photoionized CSM. Note that the [O i] doublet is weak and we could have misidentified the feature.
Overall, the spectra of SN 2015bh at late phases are still strongly influenced by the CSM interaction, judging by the presence of narrow emission lines, the pseudo-continuum of the iron forest blueward of 5450 Å, as well as of the double-peaked Hα profile, and the boxy profile of the Ca ii NIR triplet. Besides the He i lines, we can also distinguish other narrow lines at ∼5166, 5275, 6020, 6400, 7941, and 8439 Å, due to Fe i from the multiplet 26.
Spectral comparison
Fig. 12 shows the optical spectra of SN 2015bh at three different epochs, together with the approximately coeval spectra of SN 2009ip (Fraser et al. 2013a; Pastorello et al. 2013), SN 2010mc (Ofek et al. 2013), LSQ13zm (Tartaglia et al. 2016), and SNhunt248 (Kankare et al. 2015).12 The phases of the spectra are relative to their primary maximum (brightest peak of the light curves), and they have been corrected for extinction and redshift using values from the literature.

Comparison of SN 2015bh spectra during (a) the 2015a event, (b) around the maximum of the major peak, and (c) around 224–256 d after the peak, with those of the transients SNe 2009ip, 2010mc, LSQ13zm, and SNhunt248 at coeval epochs. The Hα profile is blown-up in the insert of panel (c). All spectra have been corrected for their host-galaxy recession velocities and for extinction (values adopted from the literature).
During the first burst [panel (a) in Fig. 12], SNe 2015bh and 2009ip show similar narrow features, though SN 2009ip presents a slightly higher temperature of the continuum and broad P-Cygni features associated with the Balmer lines, which are not visible in SN 2015bh. Around the main maximum [panel (b)], all transients of our sample are remarkably similar: this is very likely the phase in which the strength of the ejecta/CSM interaction reaches its peak (cf. Section 6). In passing, we note that the SNhunt248 spectrum at this epoch shows even stronger resemblance to the 2015a rather than the 2015b event. Finally, at late phases [panel (c)], SNe 2015bh and 2009ip show broader features, both in comparison with the other two transients, and with the spectra taken in previous epochs. At these phases, the main difference between these two SNe is the Hα profile [see blow-up window in the panel (c) of Fig. 12], which in the case of SN 2015bh, is broader and double-peaked, as observed before in interacting SNe such as SN 1996al (Benetti et al. 2016). Whilst SNhunt248 is considered an SN impostor (Kankare et al. 2015; Mauerhan et al. 2015), LSQ13zm and SN 2009ip have been proposed to be genuine SNe (e.g. Smith et al. 2014; Tartaglia et al. 2016, respectively).
HST ARCHIVAL IMAGES OF SN 2015BH
As described in Section 3, the SN 2015bh site was also observed by HST with WFPC2 between 2008 and 2009 (WFPC2 Prog. Ids 10877, PI: W. Li, and 11161, PI: A. Soderberg). The field was observed at different times and wavelengths from F336W (∼U) to F814W (∼I) filters. A clear source was detected at the transient position in all the images with rms uncertainties < 0.05 arcsec, through comparison with ground-based, post-discovery NOT+ALFOSC images taken on 2015 March 27 (Fig. 13). We performed relative astrometry by geometrically transforming the pre-explosion images to match these post-explosion ones. Assuming these as the deepest images of our collection, we will use them to characterize the nature of SN 2015bh before its discovery.
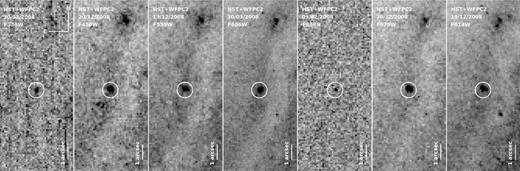
Subsections of HST WFPC2 images taken between 2008 and 2009 from F336W (first panel on the left) to F814W (last panel on the right) filters. The positions of the source at the position of SN 2015bh are indicated by a 5σ positional uncertainty circle (0.05 arcsec).
During the observation period, the star seemed to have some erratic variability (Fig. 14 and Table A6) in a range of ≲1.7 mag. At the same time, other stars (with comparable brightness as our source) observed in the same field remained practically constant. Comparing our SED with the ATLAS synthetic spectra13 of Castelli & Kurucz (2004), we approximate the effective temperature of the precursor star for the different HST epochs as shown in Fig. 15 and Table 4. We assume near solar metallicity based on the position of the transient in the host galaxy, the assumption of solar metallicity in the centre of NGC 2770, and a metallicity gradient of −0.06 dex kpc−1 from the nuclear region (Thöne et al. 2009).14 Accounting for the extinction and distance modulus reported in Section 2, we also estimate the corresponding luminosity at such epochs (Table 4).
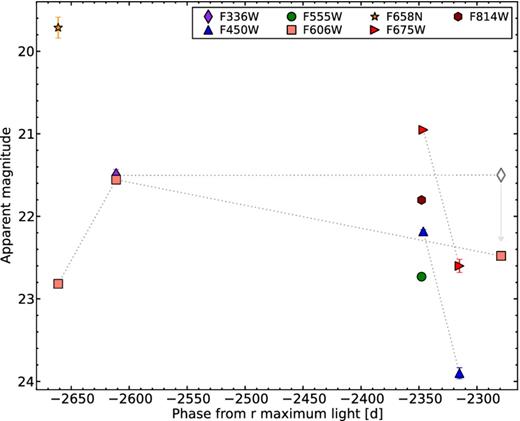
Archival HST light curves of SN 2015bh. The upper limit is indicated by a symbol with an arrow. The uncertainties for most data points are smaller than the plotted symbols. A colour version of this figure can be found in the online journal.
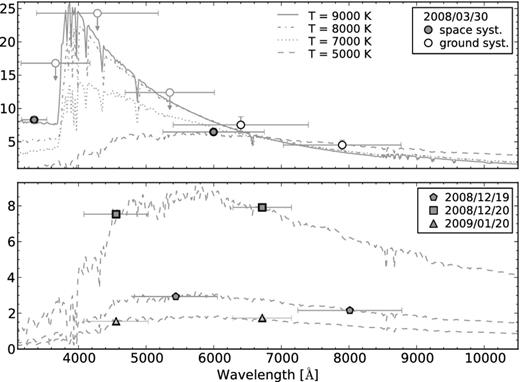
Observed SED of the candidate progenitor as measured from multi-epoch images from HST (filled symbols) and ground-based telescopes (when coeval detections were available; empty symbols). ATLAS synthetic spectra for a star with Teff of 9000, 8000, 7000 (log g = 2.0), and 5000 K (log g = 1.5) are also shown. The spectra were obtained assuming solar metallicity. The error bars along the x-axis match the bandwidths of the corresponding filters.
Properties of the progenitor star of SN 2015bh.
| Date | MJD | Phase | T | L | Ea | FWHMH α, nar | FWHMH α, br | Noteb |
|---|---|---|---|---|---|---|---|---|
| (d) | (K) | (× 1039 erg s−1) | (× 1048 erg) | (km s−1) | (km s−1) | |||
| 20020322 | 52355.89 | −4810.4 | – | 6 | – | – | – | GBT |
| 20080113 | 54478.21 | −2688.1 | – | 21 | – | – | – | GBT |
| 20080330 | 54555.45 | −2610.8 | 9000 | 13 | – | – | – | HST |
| 20081219 | 54819.05 | −2347.2 | 5000 | 5 | – | – | – | HST |
| 20081220 | 54820.51 | −2345.8 | 5000 | 15 | – | – | – | HST |
| 20090120 | 54851.70 | −2314.6 | 5000 | 3 | – | – | – | HST |
| 20120215 | 55972.39 | −1193.9 | – | 16 | – | – | – | GBT |
| 20130111 | 56303.54 | −862.7 | – | 13 | – | – | – | GBT |
| 20130208 | 56331.36 | −834.9 | – | 17 | – | – | – | GBT |
| 20131211 | 56637.03 | −529.3 | – | 72 | – | – | – | GBT |
| 20140121 | 56678.53 | −487.8 | – | 16 | – | – | – | GBT |
| 20150420 | 57132.35 | −33.9 | 8300 | 140 | 2 | 1150 | 2800 | 2015a eventc |
| 20150524 | 57166.28 | 0 | 13500 | 2900 | 13 | 1000 | 2900 | 2015b event |
aRadiated energy was estimated considering a peak of approximately 140 d during the 2015a event, and 50 d during the 2015b event.
bGBT = Ground Based Telescope; HST = Hubble Space Telescope.
cEffective temperature and FWHM velocities were derived from spectra taken at phases −30.3 and 1.6 d.
The temperature and luminosity derived for the first epoch (2008 March 30.45 ut) correspond to a massive star of spectral type A, and are consistent with those of massive stars such as LBVs in outburst (e.g. see Humphreys & Davidson 1994 or Vink 2012). These values are confirmed by ground-based observations (RI) and limits (UBV) obtained with the NOT+ALFOSC on 2008 March 30.89 UTC (Table A2).15 Notice that the temperature at this epoch is mostly determined by the F336W magnitude. The other three HST epochs taken 9 months after, instead, indicate a cooler star (even cooler than normal LBVs in eruption), similar to spectral type G.
The behaviour of the temperature and luminosity is puzzling (see Fig. 14 and Table 4). While the irregularity in luminosity is a fair reflection of the variability of this object, the fast subsequent increase in luminosity by a factor of ∼3 in 1 d from 2008 December 19 to 20 is questionable (this would roughly imply that the radius of the star on 2008 December 19 was 70 per cent smaller than a day later).
Giant LBV-like eruptions (e.g. η Car; Davidson & Humphreys 1997), along with major changes in the temperature, are expected to cause variations in the bolometric luminosity (Humphreys, Davidson & Smith 1999). The high luminosity of the first HST epoch of SN 2015bh is consistent with an eruptive state of the transient, while the subsequent HST observations show the progenitor star to have variable luminosity and redder (by 5000 K) colours. These HST observations very likely represent different stages of instability of the star. Notice that this star is always above or close to the Humphreys–Davidson limit (Humphreys & Davidson 1979), confirming severe instabilities in the stellar envelope and interior. Unfortunately, the exact time when the eruption occurs or ends is not clear from our measurements.
Massive stars have been associated with other transients, as is the case of SN 2009ip, where the star was most likely an LBV, with a probable MZAMS of 50–80 M⊙ (Smith et al. 2010; Foley et al. 2011).
ON THE NATURE OF SN 2015BH
In the previous sections, we analysed the observed properties of SN 2015bh. Combining the information from the light curves, with the evidence of CSM interaction present in the spectra, and the characteristics of the progenitor star, we can attempt to constrain the nature of SN 2015bh.
As mentioned in the introduction, SN 2009ip has been the benchmark to understand this family of transients. In the past years, several interpretations have been proposed to explain the nature of the most luminous event of SN 2009ip in 2012 (Kashi et al. 2013; Mauerhan et al. 2013a; Pastorello et al. 2013; Soker & Kashi 2013; Margutti et al. 2014; Smith et al. 2014; Fraser et al. 2015; Moriya 2015). Although the non-terminal outburst of a massive star plus subsequent shell–shell collision cannot be ruled out, one of the proposed scenarios for SN 2009ip invokes a faint SN explosion of a compact blue supergiant during the first peak in 2012 (after a series of LBV-like eruptions including the giant eruption in 2009), followed by the interaction of the SN ejecta with a circumstellar shell, producing the 2012b event (Mauerhan et al. 2013a; Smith et al. 2014). Below, we will adopt this scenario in our attempt to explain the chain of events observed in SN 2015bh.
The first detection of SN 2015bh in archival data dates back to 2002 March 22.89 UTC (MJD = 52355.89), with Mr = −11.35 ± 0.36 mag [log(L/L⊙) ∼6.2]. Later on, the transient was occasionally detected before 2013. As for SN 2009ip, it is likely that SN 2015bh has experienced repetitive outbursts for many years. However, no outbursts have been brighter than Mr = −12.9 mag. Properties of these detections are listed in Table 4.
It is well known that massive stars occasionally produce giant eruptions during which they can largely increase their luminosity for months to years, and experience major mass-loss (e.g. Smith 2014). Besides, these massive stars are often unstable, possibly alternating between episodes of erratic variability, outbursts and quiescence. Thus, in our case, we may conceive that a shell was expelled around 2002, or even before, and is travelling at approximately 1000 km s−1(as derived from both the FWHM of the narrow component of Hα and the blueshift of P-Cy1).
At the end of 2013, SN 2015bh experienced an outburst with an absolute magnitude Mr = −14.6 mag. This was also detected by Ofek et al. (2016), but their detections are around 2 mag fainter (Fig. 16). As we can see in the insert of the Fig. 16, there is a detection of a clear source in one amateur image at the transient position on 2013 December 11.03.16 However, the subsequent decline in a few hours is quite puzzling. A spectrum taken 2 d after our data is presented by Ofek et al. (2016). This shows evidence for a fast outflow with a velocity of several thousand km s−1, similar to that displayed in the SN 2009ip spectra taken 1 yr before the 2012a event (Pastorello et al. 2013). It is noticeable that also this SN 2015bh spectrum was taken around 1 yr before the 2015a event. Pastorello et al. (2013) suggested that these episodes of ejection of fast material are due to a blast wave probably originated in explosions deeper in the star. Similar phenomena have been related to LBV eruptions, or even with the Homunculus Nebula surrounding η Carinae (Smith 2008). This blast wave could be the origin of our bright detection (but see also Soker & Kashi 2016).
As discussed by Ofek et al. (2016), a P-Cygni absorption is also seen during the 2013 outburst spectrum, with a velocity of ∼1000 km s−1. This feature is in agreement with that found in our spectra taken after 2015 February, confirming that material is travelling ahead of that fast outflow. The fact that we do not identify any additional P-Cygni absorptions related with this blast wave at a faster velocity during the 2015a event is however puzzling.
At the end of 2014, although we cannot definitely rule out a very massive envelope ejection and no terminal explosion, we favour a scenario where the massive star core-collapsed producing SN 2015bh. This episode has been previously named as the 2015a event. Smith et al. (2014) favour the scenario of core-collapse SNe from a compact blue supergiants during the faint 2012a event of SN 2009ip. In analogy, the slow rise of the SN 2015bh light curve could be attributed to the explosion of a small initial radius blue progenitor star. Interestingly we find a good agreement between the SN 2015bh and SN 1987A light curves [Fig. 17; panel (a)]. However, SN 2015bh is ∼2 mag fainter compared to SN 1987A, or other normal Type II SNe (typically <−16 mag; e.g. Li et al. 2011; Taddia et al. 2016). One possible explanation is that the progenitor of SN 2015bh was a very massive star (≥ 25 M⊙) which experienced large fallback of material on to the collapsed core, resulting in a low explosion energy and small amount of ejected 56Ni (e.g. Heger et al. 2003 or Moriya et al. 2010). We also note that relatively 56Ni poor SNe II with blue supergiant precursors have been already observed (e.g. SN 2009E; Pastorello et al. 2012).
In addition, we note that the CSM is playing a dominant role in all the SN 2015bh evolution. In the panel (b) of Fig. 17 we have overplotted an early spectrum of SN 1987A at ∼− 65 d (manipulated using a blue blackbody to match the continuum of SN 2015bh), and a spectrum of SN 2015bh at −98.4 d.17 Although some difference exists in the broad-line velocities, both spectra match surprisingly well, except for the narrow line components visible in SN 2015bh. This indicates that the spectra of SN 2015bh are likely formed by two components: an SN photosphere whose radiation is slowly diffused, and a blackbody from the ongoing CSM–ejecta interaction.
The SN 2015bh spectra during the 2015a event also show a multicomponent Hα line (Section 4.3), typical of interacting SNe. These can be explained by radiation coming from different regions of the SN environment. In the case of SN 2015bh, the narrow component is likely due to recombined gas ejected by the star years before, travelling at a velocity ≤ 1000 km s−1. Instead, the broader component (with a velocity of several thousand km s−1) provides the velocity of the most recent mass ejection, which decreases with time as the reverse shock propagates into the expanding ejecta. The fact that we can detect this broad Hα emission may mean that the cool dense shell formed by the interaction between the SN ejecta and the dense CSM is probably patchy.
Shortly after 2015 May 08 (MJD = 57150.90), the newly ejected material collides with a slower and dense CSM, and produces a re-brightening during the 2015b event. This dense material must have been ejected by the star during a recent stellar mass-loss events. However, given the erratic activity of the SN 2015bh progenitor star (see Section 5 and also Fig. 3 and 14), it is difficult to accurately compute when this gas was expelled. A similar phenomena was also proposed as the cause of the major 2012b peak of SN 2009ip (Smith et al. 2014). The CSM interaction becomes the primary energy source thanks to the efficient conversion of the kinetic energy into radiation, which is responsible for the increase of the photospheric temperature (see Fig. 7), the Hα luminosity (see panel d of Fig. 10), and the appearance of He i emission lines.
In order to roughly sketch the opacity of the CSM-interaction region, we derived the total Hα emission EW for SN 2015bh following the analysis of Smith et al. (2014). As we can see in Fig. 18, the EW decreases during the 2015a event to arrived to a minimum during the 2015b peak, to then rise to higher values at late times. We can understand this as the SN ejecta is moving into a denser and thicker CSM during the first phases, to then find a more transparent CSM at late times. The collision with that dense CSM is the cause of the re-brightening during 2015b. The late-time EW behaviour of SN 2015bh is consistent with SN 2009ip and other interacting SNe (see Smith et al. 2014), and thus, we expect that the EW of Hα can grow in the future.
In this context, the disappearance of the P-Cyg1 absorption remains a puzzle. Perhaps the material is initially photoionized by the SN, which later recombines. Although, this material was expelled in 2002 or earlier, it does not remain unaffected by the hard radiation produced during the 2015b event.
Once the shock passes the dense CSM, we see again an absorption at ∼1000 km s−1, along with a second one (P-Cy2) travelling at ∼2100 km s−1. If this first absorption originates in the same gas region that produced the similar absorption observed during the 2015a event (P-Cy1), it is hard to explain why it is now detectable again. The new absorption may be part of the unshocked and relatively dense shell expelled before the SN explosion (which we assume was travelling at a low velocity), and is now shocked by the SN ejecta. This can also be some material ejected after the 2013 outburst (though before the 2015 May event) which, being initially hot and generating wide emission lines, is now cool and detected in absorption, as proposed by Ofek et al. (2016). All in all, these blueshifted absorptions indicate that at least two shells or clumps of cooler material move at different velocities along the observer's direction. Evidences of clumpy CSM surrounding very massive stars have been found for LBVs and other supergiant stars. See for example the cases of the progenitors of SNe 1987A (Gvaramadze et al. 2015) and 1996al (Benetti et al. 2016), but also the Homunculus nebulae in η Car (Smith 2012). However, constraining these asymmetries is a difficult task given the limited available data.
As we can see in Fig. 19, the spectra obtained during the 2015a event (in particular the one at −15 d), and that taken at day +26 (2015b event) when the brightness of the transient had faded, show very similar features and line velocities. Once again, this could be explained invoking an asymmetric CSM, or assuming that the CSM is becoming optically thinner after the re-brightening. This claim is also supported by the modest changes in the colour/temperature between the early and late phases.
Finally, at late times, after day +135, the SN ejecta overtakes the denser CSM region. Broad lines in emission, with the strongest being the NIR Ca ii feature and Ca ii] λλ7291, 7323(see Fig. 6, and Section 4.4), are detected. Besides, the Hα profile changed showing now three components due to the interaction between mostly spherical ejecta with an asymmetric CSM. These spectra are very similar to those of interacting core-collapse SNe such as SN 1996al. The flat light curves suggest that there is still SN ejecta/CSM interaction, preventing the SN following the decline rate predicted by the 56Co decay (e.g. see Fig. 17).
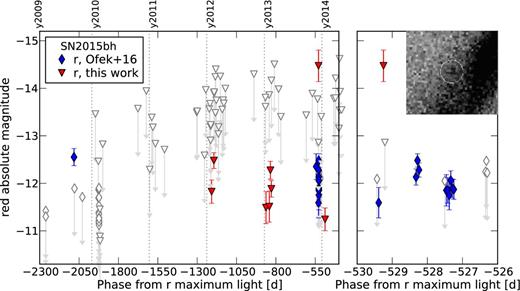
Historical absolute vegamagr-band light curve of SN 2015bh (filled triangles) from 2009 to 2014. For comparison, we included also the coeval data from Ofek et al. (2016, diamonds). Upper limits are indicated by empty symbols with arrows. The right-hand panel shows a zoom of the light curve around the 2013 outburst. The insert is a magnification of the transient position in the image taken on 2013 December 11. A colour version of this figure can be found in the online journal.
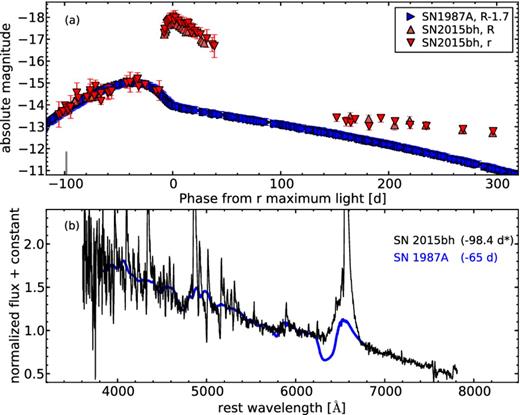
Panel (a): comparison of the absolute vegamagrR-band light curve of SN 2015bh (filled triangles), with that of SN 1987A (right rotated triangles). The SN 1987A light curve has been shifted down by 1.7 mag to match the SN 2015bh light curve at maximum of the 2015a event. The solid mark on the abscissa axis indicate the phase at which SN 2015bh spectrum of panel (b) was obtained. Panel (b): spectral comparison of SN 2015bh at −98.4 d, with that of SN 1987A at coeval epochs. To match the continuum of SN 2015bh, we added a blue blackbody contribution to the continuum of the SN 1987A spectrum. Both spectra have been corrected for their host-galaxy recession velocities, and normalized to the SN 2015bh spectrum continuum. * Note that the SN 2015bh spectrum is dated at −98.4 d from the r-band 2015b maximum, and at −64.5 d from the r-band 2015a maximum. A colour version of this figure can be found in the online journal.
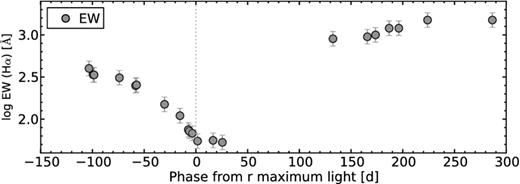
Evolution of the total Hα emission EW of SN 2015bh.
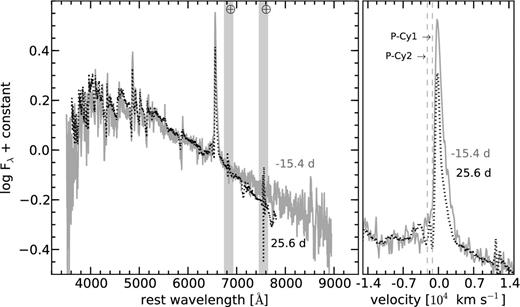
Superposition of the 2015 May 08.90 UTC (−15.4 d) and 2015 June 18.90 UTC (25.6 d) spectra of SN 2015bh. The right-hand panel shows a zoom of the Hα profiles.
The chain of events of SN 2015bh seems a replica of those observed in SN 2009ip. Hence, the similarity between the two transients is remarkable, and can be here summarized as follows.
Strong evidence of pre-explosion variability or stellar outbursts.
Faint light-curve peak during the first brightening episode.
Much brighter second peak (episode b), along with strong spectroscopic evidence of ejecta–CSM interaction.
Very similar late-time spectra, including the possible detection of very weak [O i] lines.
As for SN 2009ip, the interpretation of SN 2015bh is controversial. In this case, we notice a slow rise in the light curve on the 2015a event which closely resembles that of an SN with a blue supergiant progenitor. For this reason, an SN 1987A-like explosion within a H-rich cocoon is a reasonable scenario for SN 2015bh, similar to that proposed for SN 2009ip by Mauerhan et al. (2013a) and Smith et al. (2014). Furthermore, we note that an LBV-like outburst has been proposed to explain the nebula surrounding SK-69202 (the blue supergiant progenitor of SN 1987A; Smith 2007). Both SN 2009ip and SN 2015bh have a faint maximum luminosity of the first peak, which may be indicative that the massive progenitors experienced subenergetic explosions, facing significant mass fallback on to their stellar cores. Consequently, the amount of ejected 56Ni is expected to be small. This is consistent with the upper limit of MNi ≤ 0.04 M⊙ (Smith et al. 2014) measured for SN 2009ip.18 Large fallback would also explain the lack of prominent [O i] lines in both SNe (but see the discussion in Fraser et al. 2015).
Ofek et al. (2016) and Thöne et al. (2016), still not ruling out alternative scenarios, also seem to favour the final core-collapse for the progenitor of SN 2015bh but during the 2015b event.
Lastly, despite the clues found, the option that the stars did not die still remains a plausible option. In this case, the 2015a+b events can be interpreted as a further (though more severe) mass-loss episode plus shell–shell collisions, without leading to a terminal SN explosion. As an additional alternative, the behaviour of SN 2015bh can also be explained in a binary system scenario (Soker & Kashi 2016).
CONCLUSIONS
SN 2015bh was classified as ‘SN impostor’ because of its spectrum, which presents multicomponent Hα features reminiscent of those of transients such as SN 2009ip. Although the transient showed a slow evolution in luminosity and a modest variability in its spectral appearance for several months, later on SN 2015bh experienced a major re-brightening during which it increased its luminosity by about 3 mag.
Analysing in detail the photometric and spectroscopic evolution of SN 2015bh, we have been able to follow a chain of events similar to that observed in SN 2009ip. Adopting an explosion scenario similar to that proposed by Mauerhan et al. (2013a) and Smith et al. (2014) for SN 2009ip, we propose that the SN 2015bh precursor was likely a massive blue star, possibly similar to that of SN 1987A. However, the progenitor of SN 2015bh experienced outbursts presumably accompanied by mass-loss event along the years. An outburst probably occurred on 2002 (or before), expelling a shell travelling at an average velocity of ∼1000 km s−1. A second one happened at the end of 2013, ejecting material at fast velocity. At the end of 2014, the progenitor star of SN 2015bh possibly explodes experiencing massive fallback of material on to the collapsed core causing a low-luminosity explosion. This would be consistent with the low energy of the explosion and the small ejected 56Ni mass. Later on, fast SN ejecta collide with an outer, dense, and probably non-uniform CSM, producing the re-brightening registered in 2015 May. Broad lines of elements such as Ca II and O i, are only detected in the late-time spectra, with the weakening of the ejecta-CSM contaminating contribution. None the less, the CSM interaction which is still affecting the late SN appearance (judging from the flat light-curve tail and the presence of boxy and narrow lines in the nebular spectra) prevent us to definitely rule out the non-terminal eruption scenario for SN 2015bh.
One way to shed light on the true nature of SN 2015bh would be to continue a photometric and spectroscopic relaxed monitoring to check whether the object vanishes (as expected in the case of an SN), or if another outburst will occur if the progenitor star is still alive, Alongside this, hydrodynamic and/or spectral modelling could bring extra constraints to the nature of the star (stars) that generate SN 2015bh.
Erupting massive stars and SN explosions are rare in nearby galaxies. For this reason, the search of these transients is crucial to determine their nature, especially if the link between SN impostors (i.e. luminous pre-SN outbursts) and real SN explosions is proved. Obviously, multiwavelength and high-cadence monitoring, along with detailed studies in the X-ray and radio wavelength ranges are crucial for better revealing the structure of the circumstellar environment, and hence to reconstruct the recent stellar mass-loss activity of this type of transients.
Acknowledgments
We thank S. Leonini for his observations at the Montarrenti Observatory (Siena, Italy), E. E. O. Ishida and U. M. Noebauer for their observations obtained on 2015 March 12, E. Kankare for the SNhunt248 spectra, and A. Harutyunyan for his help.
The research leading to these results has partially been funded by the European Union Seventh Framework Programme (FP7/2007-2013) under grant agreement no. 267251 ‘Astronomy Fellowships in Italy’ (AstroFIt). NER, AP, SB and LT are partially supported by the PRIN-INAF 2014 (project ‘Transient Universe: unveiling new types of stellar explosions with PESSTO’). N.E.R. acknowledges financial support by MIUR PRIN 2010-2011, ‘The dark Universe and the cosmic evolution of baryons: from current surveys to Euclid’. GT and SJS acknowledges European Research Council under the European Union's Seventh Framework Programme (FP7/2007-2013)/ERC Grant agreement no.[291222]. AMG acknowledges financial support by the Spanish Ministerio de Economía y Competitividad (MINECO) grant ESP2013-41268. MF is supported by the European Union FP7 programme through ERC grant number 320360. ST is supported by TRR 33 ‘The Dark Universe’ of the German Research Foundation. NDR acknowledges postdoctoral support by the University of Toledo and by the Helen Luedtke Brooks Endowed Professorship. The work made use of Swift/UVOT data reduced by P. J. Brown and released in the SOUSA. SOUSA is supported by NASA's Astrophysics Data Analysis Program through grantNNX13AF35G.
This research is based on observations made with: the Nordic Optical Telescope, operated by the Nordic Optical Telescope Scientific Association at the Observatorio del Roque de los Muchachos, La Palma, Spain, of the Instituto de Astrofísica de Canarias; the Gran Telescopio Canarias (GTC), installed in the Spanish Observatorio del Roque de los Muchachos of the Instituto de Astrofísica de Canarias, on the island of La Palma; the Italian Telescopio Nazionale Galileo (TNG) operated on the island of La Palma by the Fundacin Galileo Galilei of the INAF (Istituto Nazionale di Astrofisica) at the Spanish Observatorio del Roque de los Muchachos of the Instituto de Astrofísica de Canarias; The Liverpool Telescope is operated on the island of La Palma by Liverpool John Moores University in the Spanish Observatorio del Roque de los Muchachos of the Instituto de Astrofísica de Canarias with financial support from the UK Science and Technology Facilities Council; the 1.82-m Copernico Telescope and the Schmidt 67/92 cm of INAF-Asiago Observatory; the 1.22 m Galileo Telescope of Dipartimento di Fisica e Astronomia (Università di Padova) at the Asiago Observatory; the Telescopi Joan Oró of the Montsec Astronomical Observatory, which is owned by the Generalitat de Catalunya and operated by the Institute for Space Studies of Catalunya (IEEC); the 2 m HCT, operated by the Indian Institute of Astrophysics. Observations reported here were also obtained at Haute-Provence Observatory, CNRS, France This paper includes data gathered with the 6.5 metre Magellan Telescopes located at Las Campanas Observatory, Chile. This work is based in part on observations obtained at the MDM Observatory, operated by Dartmouth College, Columbia University, Ohio State University, Ohio University, and the University of Michigan. Observations reported here were also obtained at the MMT Observatory, a joint facility of the Smithsonian Institution and the University of Arizona. The Pan-STARRS1 Surveys (PS1) have been made possible through contributions of the Institute for Astronomy, the University of Hawaii, the Pan-STARRS Project Office, the Max-Planck Society and its participating institutes, the Max Planck Institute for Astronomy, Heidelberg and the Max Planck Institute for Extraterrestrial Physics, Garching, The Johns Hopkins University, Durham University, the University of Edinburgh, Queen's University Belfast, the Harvard–Smithsonian Center for Astrophysics, the Las Cumbres Observatory Global Telescope Network Incorporated, the National Central University of Taiwan, the Space Telescope Science Institute, the National Aeronautics and Space Administration under Grant no.NNX08AR22G issued through the Planetary Science Division of the NASA Science Mission Directorate, the National Science Foundation under Grant no.AST-1238877, the University of Maryland, and Eotvos Lorand University (ELTE) and the Los Alamos National Laboratory. This work was based in part on observations obtained with CPAPIR at the Observatoire du Mont Mégantic, funded by the Université de Montréal, Université Laval, the Natural Sciences and Engineering Research Council of Canada (NSERC), the Fond québécois de la recherche sur la Nature et les technologies (FQRNT) and the Canada Economic Development programme. These results also made use of the Discovery Channel Telescope at Lowell Observatory. Lowell is a private, non-profit institution dedicated to astrophysical research and public appreciation of astronomy and operates the DCT in partnership with Boston University, the University of Maryland, the University of Toledo, Northern Arizona University and Yale University. The Large Monolithic Imager construction was supported by a grantAST-1005313 from the National Science Foundation.
This paper is also based on observations made with the Swift telescope: we thank their staffs for excellent assistance; on data obtained from the Isaac Newton Group Archive which is maintained as part of the CASU Astronomical Data Centre at the Institute of Astronomy, Cambridge; and on observations made with the NASA/ESA HST, obtained from the data archive at the Space Telescope Science Institute. STScI is operated by the Association of Universities for Research in Astronomy, Inc. under NASA contract NAS 5-26555. This work has made use of the NASA/IPAC Extragalactic Database (NED), which is operated by the Jet Propulsion Laboratory, California Institute of Technology, under contract with NASA.
NED, NASA/IPAC Extragalactic Database; http://nedwww.ipac.caltech.edu/
iraf is distributed by the National Optical Astronomy Observatory, which is operated by the Associated Universities for Research in Astronomy, Inc., under cooperative agreement with the National Science Foundation.
hstphot is a stellar photometry package specifically designed for use with HST WFPC2 images. We used v1.1.7b, updated 2009 September 8. http://americano.dolphinsim.com/hstphot/
SN 1961V: E(B − V)tot = 0.05 mag, μ = 29.84 mag; SN 2009ip: E(B − V)tot = 0.02 mag, μ = 32.05 mag; SN 2010mc: E(B − V)tot = 0.01 mag, μ = 35.79 mag; LSQ13zm: E(B − V)tot = 0.02 mag, μ = 35.43 mag; SNhunt248: E(B − V)tot = 0.05 mag, μ = 31.76 mag.
Hβ line profiles were not decomposed because of the large contamination of the continuum near the line profile, which may affect the line measurements. Note that the χ2 strongly depends on the accuracy of the variance estimation.
The spectra are available in the public WISeREP repository (Yaron & Gal-Yam 2012).
For the projected distance from the centre of NGC 2770 to SN 2015bh (2.2 kpc), we estimate 12 + log(O/H) ≈ 8.5, which is nearly solar metallicity, following the consideration in Smartt et al. (2009).
Note that this last epoch was also used to estimate the temperature of the precursor star on 2008 March 30 (top panel of Fig. 15).
Note that this detection is based on a single observation. The field was observed shortly after from another site, and no source brighter than −13 mag was detected.
The SN 2015bh spectrum is dated at −98.4 d from the r-band 2015b maximum, and at −64.5 d from the r-band 2015a maximum.
REFERENCES
APPENDIX A: TABLES OF PHOTOMETRY AND SPECTROSCOPY OF SN 2015bh
Basic information about the telescopes and instruments used (in alphabetical key order).
| Table key | Telescope | Instrument | Pixel-scale | Location |
|---|---|---|---|---|
| (arcsec pixel−1) | ||||
| AFOSC | 1.82 m Copernico Telescope | AFOSC | 0.52 | Mount Ekar Obs., Asiago, Italy |
| AGBX | 1.00 m Jacobus Kapteyn Telescope | Acquisition and Guidance Unit | 0.31 | Roque de Los Muchachos Obs., La Palma, Spain |
| ALFOSC | 2.56 m Nordic Optical Telescope | ALFOSC | 0.19 | Roque de Los Muchachos Obs., La Palma, Spain |
| ANDOR | 0.80 m Cassegrain Telescope | Andor DW436 CCD | 0.77 | Haute-Provence Obs., Alpes-de-Haute-Provence, France |
| B&C | 1.22 m Galileo Telescope | B&C | – | Mount Pennar Obs., Asiago, Italy |
| CAFOS | 2.20 m Calar Alto Telescope | CAFOS | 0.53 | Calar Alto Obs., Almería, Spain |
| CPAPIR | 1.60 m Ritchey–Chretien Telescope | CPAPIR | 0.89 | Observatoire du Mont Mégantic, Québec, Canada |
| FORS2 | 8.20 m Very Large Telescope-UT1 | FORS2 | 0.13 | European Southern Obs., Cerro Paranal, Chile |
| GPC1 | 1.80 m Pan-STARRS Telescope 1 | GPC1 | 0.25 | Mount Haleakala Obs., Maui, USA |
| HFOSC | 2.00 m Himalayan Chandra Telescope | HFOSC | 0.30 | Indian Astronomical Obs., Hanle, India |
| HST | 2.40 m HST | WFPC2 | 0.05/0.10a | – |
| IMACS | 6.50 m Magellan Telescope | IMACS | 0.11 | Las Campanas Observatory, Chile |
| IO:O | 2.00 m Liverpool Telescope | IO:O | 0.30 | Roque de Los Muchachos Obs., La Palma, Spain |
| ISIS | 4.20 m William Hershel Telescope | ISIS | – | Roque de Los Muchachos Obs., La Palma, Spain |
| LMI | 4.30 m Discovery Channel Telescope | LMI | 0.24 | Lowell Observatory, Happy Jack, AZ, USA |
| LRS | 3.58 m Telescopio Nazionale Galileo | LRS | 0.25 | Roque de Los Muchachos Obs., La Palma, Spain |
| MEIA | 0.80 m Joan Oró Telescope | MEIA | 0.13 | Montsec Astronomical Obs., Catalunya, Spain |
| MMT | 6.50 m Multiple Mirror Telescope | BlueChannel | 0.60 | MMT Observatory, Arizona, USA |
| NOTCAM | 2.56 m Nordic Optical Telescope | NOTCAM | 0.24 | Roque de Los Muchachos Obs., La Palma, Spain |
| OSIRIS | 10.40 m Gran Telescopio CANARIAS | OSIRIS | 0.25 | Roque de Los Muchachos Obs., La Palma, Spain |
| OSMOS | 2.40 m Hiltner Telescope | OSMOS | 0.27 | Michigan-Dartmouth-MIT Obs., Arizona, USA |
| PFCU | 2.54 m Isaac Newton Telescope | Prime Focus Cone Unit | 0.59 | Roque de Los Muchachos Obs., La Palma, Spain |
| PRIME | 4.20 m William Herschel Telescope | Prime Imaging | 0.42 | Roque de Los Muchachos Obs., La Palma, Spain |
| RATCam | 2.00 m Liverpool Telescope | RATCam | 0.28 | Roque de Los Muchachos Obs., La Palma, Spain |
| SDSS | 2.50 m Telescope | Sloan Digital Sky Survey CCD | 0.39 | Apache Point Obs., New Mexico, USA |
| SWIFT | 0.30 m Ritchey-Chretien UV/optical Telescope | SWIFT | 0.50 | – |
| WFC | 2.54 m Isaac Newton Telescope | Wide Field Camera | 0.33 | Roque de Los Muchachos Obs., La Palma, Spain |
| CAO | 0.36 m Celestron C-14 Telescope | Apogee AP7 CCD | 1.27 | Coddenham Astronomical Obs., Coddenham, UK |
| CO | 0.30 m Maioni Telescope | SBIG ST-8 | 2.10 | Cortina Obs., Italy |
| GO | 0.25 m Newtonian Telescope | DSI-PRO | 1.23 | Gavena Obs., Firenze, Italy |
| IAO | 0.60 m reflector telescope | KAF-1001E | 1.45 | Itagaki Astronomical Obs., Teppo-cho, Japan |
| MAO | 0.50 m Newtonian Telescope | FLI Proline 4710 CCD | 2.32/1.16b | Monte Agliale Obs., Lucca, Italy |
| MMAO | 0.36 m Celestron C-14 Telescope | Starlight MX 916 | 1.45 | Monte Maggiore Astronomical Obs., Forlí, Italy |
| MO | 0.53 m Ritchey–Chrétien Telescope | Apogee Alta U4000 | 1.11 | Montarrenti Obs., Siena, Italy |
| OO | 0.40 m Dal Kirkam Telescope | DTA-Electra CCD | 1.17 | Orciatico Obs., Pisa, Italy |
| PO | 0.36 m Celestron C-14 Telescope | Starlight SXV-H9 | 1.27 | Pennell Obs., South Wonston, UK |
aWFPC2 contains four chips. SN 2015bh field was observed with the WF4 chip (0.10 arcsec px−1) in some epochs, and with the Planetary Camera (0.05 arcsec px−1) in others.
bThe image taken on 20120116 was done with binning 1×1 and so, the pixel-scale is 1.16 arcsec pixel−1.
Optical Johnson Cousins photometry of SN 2015bh (Vega magnitudes).
| Date | MJD | Phasea | U | B | V | R | I | Instrument key |
|---|---|---|---|---|---|---|---|---|
| (d) | (mag) | (mag) | (mag) | (mag) | (mag) | |||
| 19940409 | 49451.93 | −7714.3 | – | >21.0 | >20.1 | – | – | AGBX |
| 19960111 | 50093.19 | −7073.1 | – | – | – | – | >19.8 | AGBX |
| 19961013 | 50095.14 | −7071.1 | – | – | – | – | >18.4 | AGBX |
| 19970305 | 50513.00 | −6653.3 | – | >20.0 | – | – | – | PRIME |
| 20080109 | 54474.46 | −2691.8 | >19.1 | >20.2 | >19.7 | >19.4 | >19.3 | AFOSC |
| 20080110 | 54475.94 | −2690.3 | – | >19.3 | >19.2 | >18.9 | >17.5 | AFOSC |
| 20080112 | 54477.24 | −2689.0 | – | >21.8 | >20.3 | – | – | RATCam |
| 20080112 | 54477.54 | −2688.7 | – | – | – | 21.09 (0.18) | 21.10 (0.23) | ALFOSC |
| 20080112 | 54477.54 | −2688.7 | >21.0 | >22.6 | >22.8 | – | – | ALFOSC |
| 20080113 | 54478.21 | −2688.1 | – | – | – | 21.50 (0.27) | 20.77 (0.30) | LRS |
| 20080113 | 54478.27 | −2688.0 | – | – | – | 20.86 (0.09) | – | FORS2 |
| 20080114 | 54479.57 | −2686.7 | – | – | – | – | 21.91 (0.43) | ALFOSC |
| 20080114 | 54479.57 | −2686.7 | >21.6 | >22.7 | >22.8 | >22.3 | – | ALFOSC |
| 20080115 | 54480.19 | −2686.1 | – | >21.8 | >20.8 | – | – | RATCam |
| 20080116 | 54481.20 | −2685.1 | – | >20.3 | >20.2 | – | – | RATCam |
| 20080116 | 54481.24 | −2685.0 | – | – | – | >21.6 | – | FORS2 |
| 20080117 | 54482.27 | −2684.0 | – | >21.3 | >20.4 | – | – | RATCam |
| 20080118 | 54483.26 | −2683.0 | – | >21.3 | >20.1 | – | – | RATCam |
| 20080120 | 54485.08 | −2681.2 | – | >19.3 | >18.7 | – | – | RATCam |
| 20080125 | 54490.90 | −2675.4 | – | >21.3 | >20.2 | – | – | RATCam |
| 20080128 | 54493.01 | −2673.3 | – | – | – | 21.72 (0.46) | – | CAFOS |
| 20080128 | 54493.01 | −2673.3 | >21.4 | >20.0 | >21.9 | – | >21.4 | CAFOS |
| 20080129 | 54494.12 | −2672.2 | – | >21.9 | >20.9 | – | – | RATCam |
| 20080130 | 54495.12 | −2671.2 | – | >20.2 | >19.3 | – | – | RATCam |
| 20080131 | 54497.08 | −2669.2 | – | >22.2 | >21.6 | – | – | RATCam |
| 20080206 | 54502.11 | −2664.2 | – | >22.3 | >21.6 | – | – | RATCam |
| 20080208 | 54504.15 | −2662.1 | – | >21.3 | >20.2 | – | – | RATCam |
| 20080211 | 54507.09 | −2659.2 | – | – | – | >20.2 | >20.4 | LRS |
| 20080211 | 54507.93 | −2658.3 | – | >21.7 | – | – | – | RATCam |
| 20080212 | 54508.10 | −2658.2 | – | >21.1 | >19.6 | >19.2 | >18.7 | CAFOS |
| 20080228 | 54524.99 | −2641.3 | – | >21.2 | >21.0 | – | – | RATCam |
| 20080301 | 54526.97 | −2639.3 | – | >22.6 | >21.8 | – | – | RATCam |
| 20080304 | 54529.96 | −2636.3 | – | >22.5 | >21.7 | – | – | RATCam |
| 20080310 | 54535.94 | −2630.3 | – | >21.1 | >20.5 | – | – | RATCam |
| 20080330 | 54555.89 | −2610.4 | >21.0 | >21.1 | >21.6 | – | – | ALFOSC |
| 20080330 | 54555.89 | −2610.4 | – | – | – | 20.95 (0.18) | 20.84 (0.17) | ALFOSC |
| 20080415 | 54571.95 | −2594.3 | – | >20.8 | >20.9 | – | – | RATCam |
| 20080421 | 54577.92 | −2588.4 | – | – | >20.9 | – | – | RATCam |
| 20080427 | 54583.04 | −2583.2 | – | – | – | 21.62 (0.23) | – | FORS2 |
| 20080707 | 54654.76 | −2511.5 | >18.4 | >20.4 | >19.4 | >18.9 | >18.9 | AFOSC |
| 20080708 | 54655.60 | −2510.7 | – | >19.3 | >20.1 | >18.9 | >19.8 | AFOSC |
| 20090221 | 54883.69 | −2282.6 | >20.0 | >20.3 | >19.4 | – | – | SWIFT |
| 20150210 | 57063.90 | −102.4 | – | – | 19.75 (0.18) | – | – | AFOSC |
| 20150211 | 57064.51 | −101.8 | >18.7 | >19.2 | >18.2 | – | – | SWIFT |
| 20150211 | 57064.95 | −101.3 | – | 20.27 (0.06) | 19.68 (0.05) | – | – | AFOSC |
| 20150214 | 57067.83 | −98.4 | – | – | 19.59 (0.04) | 18.99 (0.02) | – | HFOSC |
| 20150216 | 57069.82 | −96.5 | – | – | 19.64 (0.03) | 19.09 (0.03) | 18.79 (0.04) | HFOSC |
| 20150217 | 57070.79 | −95.5 | – | 20.03 (0.04) | 19.53 (0.05) | – | – | AFOSC |
| 20150218 | 57071.89 | −94.4 | >19.6 | >19.9 | >18.9 | – | – | SWIFT |
| 20150222 | 57075.83 | −90.4 | – | – | 19.13 (0.04) | 18.68 (0.04) | – | HFOSC |
| 20150223 | 57076.04 | −90.2 | – | 19.57 (0.02) | 19.15 (0.03) | 18.70 (0.03) | 18.46 (0.04) | ALFOSC |
| 20150305 | 57086.97 | −79.3 | – | 19.57 (0.20) | – | – | – | IO:O |
| 20150306 | 57087.74 | −78.5 | – | – | 19.01 (0.03) | 18.53 (0.03) | 18.25 (0.03) | HFOSC |
| 20150311 | 57092.07 | −74.2 | – | 19.42 (0.03) | 18.95 (0.03) | 18.50 (0.03) | 18.23 (0.03) | ALFOSC |
| 20150311 | 57092.64 | −73.6 | – | – | 18.95 (0.03) | 18.48 (0.03) | 18.21 (0.04) | HFOSC |
| 20150317 | 57098.79 | −67.5 | – | – | 19.04 (0.02) | 18.49 (0.03) | 18.29 (0.03) | HFOSC |
| 20150318 | 57099.97 | −66.3 | – | 19.51 (0.05) | 18.98 (0.04) | – | – | AFOSC |
| 20150327 | 57108.90 | −57.4 | – | 19.25 (0.03) | 18.74 (0.03) | – | – | ALFOSC |
| 20150411 | 57123.90 | −42.4 | – | 18.79 (0.03) | 18.29 (0.03) | – | – | ALFOSC |
| 20150428 | 57140.90 | −25.4 | – | 19.05 (0.04) | 18.34 (0.04) | – | – | ALFOSC |
| 20150508 | 57150.93 | −15.3 | – | 19.25 (0.03) | 18.52 (0.02) | – | – | ALFOSC |
| 20150516 | 57158.72 | −7.6 | 14.92 (0.06) | 16.10 (0.07) | 16.04 (0.09) | – | – | SWIFT |
| 20150516 | 57158.94 | −7.3 | 15.23 (0.03) | 16.02 (0.05) | 15.79 (0.04) | 15.65 (0.07) | 15.46 (0.04) | MEIA |
| 20150517 | 57159.88 | −6.4 | – | 15.82 (0.08) | 15.72 (0.11) | 15.53 (0.12) | – | LRS |
| 20150517 | 57159.90 | −6.4 | 15.04 (0.03) | 15.78 (0.07) | 15.70 (0.04) | 15.46 (0.10) | 15.35 (0.05) | MEIA |
| 20150517 | 57159.92 | −6.4 | 14.64 (0.06) | 15.85 (0.07) | 15.79 (0.08) | – | – | SWIFT |
| 20150518 | 57160.19 | −6.1 | 14.63 (0.05) | 15.84 (0.06) | 15.68 (0.07) | – | – | SWIFT |
| 20150518 | 57160.91 | −5.4 | – | 15.68 (0.07) | 15.59 (0.07) | 15.39 (0.09) | – | MEIA |
| 20150519 | 57161.66 | −4.6 | 14.52 (0.05) | 15.61 (0.06) | 15.57 (0.07) | – | – | SWIFT |
| 20150520 | 57162.23 | −4.1 | 14.50 (0.05) | 15.59 (0.07) | 15.65 (0.09) | – | – | SWIFT |
| 20150520 | 57162.85 | −3.4 | – | 15.61 (0.01) | 15.42 (0.03) | 15.20 (0.03) | 15.05 (0.02) | ANDOR |
| 20150520 | 57162.89 | −3.4 | 14.76 (0.04) | 15.54 (0.06) | 15.38 (0.04) | 15.21 (0.06) | 15.07 (0.05) | MEIA |
| 20150521 | 57163.84 | −2.4 | – | 15.59 (0.05) | 15.40 (0.01) | 15.07 (0.02) | 14.99 (0.04) | ANDOR |
| 20150521 | 57163.89 | −2.4 | 14.36 (0.05) | 15.54 (0.06) | – | – | – | SWIFT |
| 20150522 | 57164.19 | −2.1 | – | – | 15.40 (0.06) | – | – | SWIFT |
| 20150522 | 57164.55 | −1.7 | 14.36 (0.05) | 15.54 (0.06) | 15.49 (0.07) | – | – | SWIFT |
| 20150522 | 57164.85 | −1.4 | – | 15.59 (0.03) | 15.39 (0.01) | 15.19 (0.04) | 14.97 (0.02) | ANDOR |
| 20150524 | 57166.81 | 0.5 | 14.41 (0.05) | 15.46 (0.06) | 15.35 (0.07) | – | – | SWIFT |
| 20150524 | 57166.90 | 0.6 | – | 15.46 (0.03) | 15.37 (0.06) | 15.12 (0.05) | 14.98 (0.04) | MEIA |
| 20150525 | 57167.48 | 1.2 | 14.47 (0.05) | 15.59 (0.06) | 15.40 (0.07) | – | – | SWIFT |
| 20150525 | 57167.89 | 1.6 | – | 15.54 (0.02) | 15.33 (0.02) | 15.11 (0.05) | 15.00 (0.03) | ALFOSC |
| 20150525 | 57167.90 | 1.6 | 14.71 (0.04) | – | 15.37 (0.07) | 15.14 (0.03) | 15.00 (0.04) | MEIA |
| 20150526 | 57168.04 | 1.8 | 14.52 (0.05) | – | – | – | – | SWIFT |
| 20150526 | 57168.34 | 2.1 | 14.55 (0.05) | 15.58 (0.06) | 15.44 (0.07) | – | – | SWIFT |
| 20150526 | 57168.90 | 2.6 | 14.88 (0.02) | 15.61 (0.02) | 15.36 (0.02) | 15.13 (0.01) | 15.00 (0.02) | MEIA |
| 20150527 | 57169.47 | 3.2 | 14.65 (0.05) | 15.67 (0.06) | 15.40 (0.07) | – | – | SWIFT |
| 20150527 | 57169.92 | 3.6 | 14.96 (0.04) | 15.63 (0.06) | 15.40 (0.05) | 15.18 (0.04) | 15.03 (0.05) | MEIA |
| 20150528 | 57170.24 | 4.0 | 14.71 (0.05) | 15.74 (0.06) | 15.49 (0.07) | – | – | SWIFT |
| 20150528 | 57170.90 | 4.6 | 15.03 (0.04) | 15.75 (0.06) | 15.40 (0.07) | 15.19 (0.07) | 15.02 (0.03) | MEIA |
| 20150530 | 57172.90 | 6.6 | – | 15.87 (0.08) | 15.52 (0.06) | 15.27 (0.06) | 15.15 (0.09) | MEIA |
| 20150531 | 57173.90 | 7.6 | 15.27 (0.04) | 15.88 (0.07) | 15.48 (0.05) | 15.25 (0.09) | 15.12 (0.04) | MEIA |
| 20150601 | 57174.92 | 8.6 | 15.39 (0.11) | 15.89 (0.05) | 15.50 (0.05) | 15.34 (0.05) | 15.11 (0.04) | MEIA |
| 20150602 | 57175.92 | 9.6 | 15.41 (0.12) | 15.95 (0.03) | 15.61 (0.04) | 15.35 (0.05) | 15.13 (0.06) | MEIA |
| 20150604 | 57177.00 | 10.7 | – | 16.01 (0.04) | 15.63 (0.03) | 15.42 (0.04) | 15.19 (0.03) | MEIA |
| 20150606 | 57179.00 | 12.7 | 15.79 (0.04) | 16.21 (0.02) | 15.71 (0.04) | 15.54 (0.05) | 15.19 (0.04) | MEIA |
| 20150608 | 57181.00 | 14.7 | 15.90 (0.15) | 16.27 (0.34) | – | 15.51 (0.13) | 15.15 (0.16) | MEIA |
| 20150611 | 57184.90 | 18.6 | 16.21 (0.03) | 16.50 (0.04) | 15.97 (0.02) | 15.56 (0.04) | 15.38 (0.06) | ALFOSC |
| 20150620 | 57193.00 | 26.7 | – | – | 16.27 (0.03) | 15.88 (0.05) | 15.55 (0.03) | MEIA |
| 20150621 | 57194.00 | 27.7 | – | – | 16.30 (0.05) | 15.97 (0.09) | 15.60 (0.04) | MEIA |
| 20150622 | 57195.89 | 29.6 | 17.13 (0.03) | 17.10 (0.03) | 16.39 (0.02) | 16.04 (0.06) | 15.66 (0.04) | ALFOSC |
| 20151011 | 57306.17 | 139.9 | >21.0 | – | – | >18.2 | – | ALFOSC |
| 20151011 | 57306.17 | 139.9 | – | 21.31 (0.19) | – | – | – | ALFOSC |
| 20151023 | 57318.12 | 151.8 | – | – | 20.38 (0.29) | – | – | AFOSC |
| 20151105 | 57331.12 | 164.8 | – | 21.48 (0.07) | 20.69 (0.05) | 19.39 (0.09) | 18.99 (0.09) | ALFOSC |
| 20151109 | 57335.11 | 168.8 | – | 21.41 (0.22) | 20.41 (0.14) | – | – | AFOSC |
| 20151122 | 57348.15 | 181.9 | – | 21.52 (0.06) | 20.63 (0.06) | 19.50 (0.06) | 19.23 (0.10) | ALFOSC |
| 20151203 | 57359.10 | 192.8 | – | – | 20.68 (0.28) | – | – | AFOSC |
| 20151203 | 57359.10 | 192.8 | – | >21.4 | – | – | – | AFOSC |
| 20151216 | 57372.18 | 205.9 | – | – | 20.88 (0.11) | 19.79 (0.18) | 19.71 (0.18) | ALFOSC |
| 20151216 | 57372.18 | 205.9 | – | >20.8 | – | – | – | ALFOSC |
| 20151230 | 57386.13 | 219.8 | – | 21.57 (0.09) | 20.94 (0.07) | 19.57 (0.10) | 19.70 (0.06) | ALFOSC |
| 20160114 | 57401.11 | 234.8 | – | 21.63 (0.09) | 20.98 (0.07) | 19.79 (0.09) | 19.80 (0.10) | ALFOSC |
| 20160129 | 57417.00 | 250.7 | – | >18.1 | >17.3 | – | – | ALFOSC |
| 20160217 | 57435.05 | 268.8 | – | 21.82 (0.13) | 21.18 (0.07) | 20.01 (0.05) | 20.13 (0.07) | ALFOSC |
| 20160315 | 57462.96 | 296.7 | – | 21.89 (0.07) | 21.33 (0.07) | 20.15 (0.07) | 20.44 (0.08) | ALFOSC |
aPhases are relative to r maximum light, MJD = 57166.28 ± 0.29.
Optical Sloan photometry of SN 2015bh (AB magnitudes).
| Date | MJD | Phasea | u | g | r | i | z | Instrument key |
|---|---|---|---|---|---|---|---|---|
| (d) | (mag) | (mag) | (mag) | (mag) | (mag) | |||
| 19941204 | 49690.14 | −7476.1 | – | – | >18.1 | – | – | PFCU |
| 19951224 | 50075.18 | −7091.1 | – | – | >20.5 | – | – | PFCU |
| 19991205 | 51517.12 | −5649.2 | – | – | >19.7 | – | – | CAO |
| 19991213 | 51525.12 | −5641.2 | – | – | >18.7 | – | – | CAO |
| 20000105 | 51548.03 | −5618.2 | – | – | >18.9 | – | – | CAO |
| 20000221 | 51595.93 | −5570.3 | – | – | >19.4 | – | – | CAO |
| 20000306 | 51609.86 | −5556.4 | – | – | >19.1 | – | – | CAO |
| 20010420 | 52019.99 | −5146.3 | – | – | >17.9 | – | – | CAO |
| 20010508 | 52037.90 | −5128.4 | – | – | >18.8 | – | – | CAO |
| 20010909 | 52161.15 | −5005.1 | – | – | >18.9 | – | – | CAO |
| 20011016 | 52198.19 | −4968.1 | – | – | >19.6 | – | – | CAO |
| 20011029 | 52211.13 | −4955.2 | – | – | >19.1 | – | – | CAO |
| 20011208 | 52251.07 | −4915.2 | – | – | >19.2 | – | – | CAO |
| 20011226 | 52269.99 | −4896.3 | – | – | >19.9 | – | – | CAO |
| 20020125 | 52299.12 | −4867.2 | – | – | >19.4 | – | – | CAO |
| 20020301 | 52334.07 | −4832.2 | – | – | >19.0 | – | – | CAO |
| 20020322 | 52355.89 | −4810.4 | – | – | 21.55 (0.33) | – | – | WFC |
| 20020424 | 52388.89 | −4777.4 | – | – | >19.2 | – | – | CAO |
| 20021102 | 52580.11 | −4586.2 | – | – | >19.1 | – | – | CAO |
| 20021231 | 52639.33 | −4526.9 | >21.5 | >22.1 | >21.7 | >21.8 | >20.4 | SDSS |
| 20030105 | 52644.97 | −4521.3 | – | – | >19.4 | – | – | CAO |
| 20030202 | 52672.99 | −4493.3 | – | – | >19.5 | – | – | CAO |
| 20030219 | 52689.05 | −4477.2 | – | – | >19.4 | – | – | CAO |
| 20030312 | 52710.04 | −4456.2 | – | – | >19.1 | – | – | CAO |
| 20030326 | 52724.01 | −4442.3 | – | – | >18.6 | – | – | CAO |
| 20030402 | 52731.93 | −4434.3 | – | – | >19.6 | – | – | CAO |
| 20051105 | 53679.14 | −3487.1 | – | – | >19.6 | – | – | CAO |
| 20060121 | 53756.14 | −3410.1 | – | – | >18.8 | – | – | CAO |
| 20061027 | 54035.81 | −3130.5 | – | – | >19.2 | – | – | IAO |
| 20061126 | 54065.96 | −3100.3 | – | – | >19.5 | – | – | CAO |
| 20070114 | 54114.98 | −3051.3 | – | – | >19.3 | – | – | CAO |
| 20070422 | 54212.88 | −2953.4 | – | – | >19.9 | – | – | CAO |
| 20080112 | 54477.20 | −2689.1 | – | – | >21.1 | >20.4 | – | RATCam |
| 20080115 | 54480.25 | −2686.0 | – | – | >20.4 | >20.1 | – | RATCam |
| 20080116 | 54481.20 | −2685.1 | >20.8 | – | >19.9 | >19.9 | – | RATCam |
| 20080117 | 54482.27 | −2684.0 | >20.3 | – | >21.1 | >20.5 | – | RATCam |
| 20080118 | 54483.27 | −2683.0 | – | – | >20.7 | >20.4 | – | RATCam |
| 20080120 | 54485.09 | −2681.2 | – | – | >18.8 | >18.7 | – | RATCam |
| 20080125 | 54490.92 | −2675.4 | – | – | >20.1 | >20.0 | – | RATCam |
| 20080129 | 54494.13 | −2672.2 | >21.7 | – | >20.1 | >19.8 | – | RATCam |
| 20080130 | 54495.13 | −2671.2 | >20.7 | – | >19.4 | >18.5 | – | RATCam |
| 20080131 | 54497.05 | −2669.2 | >21.9 | – | >21.4 | >21.3 | – | RATCam |
| 20080206 | 54502.12 | −2664.2 | – | – | >21.9 | >21.4 | – | RATCam |
| 20080208 | 54504.17 | −2662.1 | – | – | >20.1 | – | – | RATCam |
| 20080229 | 54525.00 | −2641.3 | – | – | >21.0 | >19.8 | – | RATCam |
| 20080301 | 54526.99 | −2639.3 | – | – | >22.3 | >22.4 | – | RATCam |
| 20080304 | 54529.97 | −2636.3 | – | – | >21.7 | >21.8 | – | RATCam |
| 20080310 | 54535.96 | −2630.3 | – | – | >20.8 | – | – | RATCam |
| 20080415 | 54571.97 | −2594.3 | – | – | >19.9 | – | – | RATCam |
| 20080421 | 54577.93 | −2588.3 | – | – | >21.7 | – | – | RATCam |
| 20081230 | 54830.01 | −2336.3 | – | – | >19.8 | – | – | MO |
| 20100124 | 55220.05 | −1946.2 | – | – | >19.3 | – | – | MAO |
| 20100211 | 55238.43 | −1927.8 | – | >22.0 | – | – | – | GPC1 |
| 20100211 | 55238.82 | −1927.5 | – | – | >20.3 | – | – | CAO |
| 20100221 | 55248.29 | −1918.0 | – | >21.3 | >21.3 | >20.9 | >20.5 | GPC1 |
| 20100222 | 55249.29 | −1917.0 | – | >21.5 | >21.9 | >21.4 | >21.1 | GPC1 |
| 20100223 | 55250.29 | −1916.0 | – | >21.8 | >22.0 | >21.4 | >20.9 | GPC1 |
| 20100304 | 55259.45 | −1906.8 | – | – | – | >19.9 | – | GPC1 |
| 20100311 | 55266.43 | −1899.8 | – | – | >19.9 | – | – | GPC1 |
| 20100317 | 55272.43 | −1893.8 | – | >21.4 | – | – | – | GPC1 |
| 20101021 | 55490.13 | −1676.2 | – | – | >19.2 | – | – | CAO |
| 20101213 | 55543.17 | −1623.1 | – | – | >18.8 | – | – | MAO |
| 20110104 | 55565.08 | −1601.2 | – | – | >20.5 | – | – | MAO |
| 20110117 | 55578.10 | −1588.2 | – | – | >19.4 | – | – | MAO |
| 20110124 | 55585.15 | −1581.1 | – | – | >19.6 | – | – | OO |
| 20110208 | 55600.93 | −1565.3 | – | – | >19.9 | – | – | CAO |
| 20110329 | 55650.24 | −1516.0 | – | – | – | – | >21.0 | GPC1 |
| 20110407 | 55658.87 | −1507.4 | – | – | >20.0 | – | – | CAO |
| 20111029 | 55863.71 | −1302.6 | – | – | >19.3 | – | – | IAO |
| 20111101 | 55866.75 | −1299.5 | – | – | >19.2 | – | – | IAO |
| 20111206 | 55901.65 | −1264.6 | – | – | – | – | 20.31 (0.12) | GPC1 |
| 20111217 | 55912.97 | −1253.3 | – | – | >20.2 | – | – | OO |
| 20111226 | 55921.09 | −1245.2 | – | – | >18.8 | – | – | MAO |
| 20120117 | 55943.07 | −1223.2 | – | – | >19.2 | – | – | MAO |
| 20120121 | 55947.91 | −1218.4 | – | – | >19.1 | – | – | GO |
| 20120125 | 55951.89 | −1214.4 | – | – | >19.8 | – | – | OO |
| 20120126 | 55952.02 | −1214.3 | – | – | >19.5 | – | – | MAO |
| 20120126 | 55952.82 | −1213.5 | – | – | >19.5 | – | – | CAO |
| 20120201 | 55958.03 | −1208.2 | – | – | 20.92 (0.19) | – | – | WFC |
| 20120211 | 55968.37 | −1197.9 | – | – | – | 21.37 (0.23) | – | GPC1 |
| 20120215 | 55972.39 | −1193.9 | – | 21.27 (0.11) | 20.26 (0.07) | – | – | GPC1 |
| 20120216 | 55973.56 | −1192.7 | – | – | >18.8 | – | – | IAO |
| 20120216 | 55973.89 | −1192.4 | – | – | >18.8 | – | – | GO |
| 20120224 | 55981.53 | −1184.8 | – | – | >18.5 | – | – | IAO |
| 20120225 | 55982.04 | −1184.2 | – | – | >19.3 | – | – | CAO |
| 20120227 | 55984.51 | −1181.8 | – | – | >18.3 | – | – | IAO |
| 20120301 | 55987.59 | −1178.7 | – | – | >19.0 | – | – | IAO |
| 20120314 | 56000.86 | −1165.4 | – | – | >19.7 | – | – | OO |
| 20120316 | 56002.87 | −1163.4 | – | – | >19.6 | – | – | MAO |
| 20120327 | 56013.48 | −1152.8 | – | – | >18.5 | – | – | IAO |
| 20120408 | 56025.49 | −1140.8 | – | – | >19.2 | – | – | IAO |
| 20120414 | 56031.49 | −1134.8 | – | – | >19.0 | – | – | IAO |
| 20120415 | 56032.27 | −1134.0 | – | 20.97 (0.10) | – | – | – | GPC1 |
| 20120418 | 56035.44 | −1130.8 | – | – | >19.1 | – | – | IAO |
| 20120428 | 56045.47 | −1120.8 | – | – | >18.7 | – | – | IAO |
| 20121026 | 56226.75 | −939.5 | – | – | >18.4 | – | – | IAO |
| 20121210 | 56271.63 | −894.7 | – | – | – | – | >20.4 | GPC1 |
| 20130107 | 56299.97 | −866.3 | – | – | >18.9 | – | – | OO |
| 20130108 | 56300.05 | −866.2 | – | – | >19.1 | – | – | MAO |
| 20130111 | 56303.54 | −862.7 | – | – | 21.25 (0.30) | – | – | GPC1 |
| 20130131 | 56323.64 | −842.6 | – | – | >18.9 | – | – | IAO |
| 20130201 | 56324.44 | −841.8 | – | – | 21.23 (0.29) | – | – | GPC1 |
| 20130208 | 56331.36 | −834.9 | – | 21.15 (0.21) | 20.47 (0.11) | – | – | GPC1 |
| 20130214 | 56337.33 | −828.9 | – | 21.49 (0.12) | 20.86 (0.09) | – | – | GPC1 |
| 20130214 | 56337.89 | −828.4 | – | – | >18.6 | – | – | GO |
| 20130305 | 56356.61 | −809.7 | – | – | >18.2 | – | – | IAO |
| 20130401 | 56383.41 | −782.9 | – | – | >18.8 | – | – | IAO |
| 20130415 | 56397.83 | −768.4 | – | – | >19.3 | – | – | MAO |
| 20130923 | 56558.80 | −607.5 | – | – | >19.3 | – | – | IAO |
| 20131101 | 56597.76 | −568.5 | – | – | >18.9 | – | – | IAO |
| 20131118 | 56614.57 | −551.7 | – | – | – | – | >21.3 | GPC1 |
| 20131205 | 56631.09 | −535.2 | – | – | >19.0 | – | – | MAO |
| 20131211 | 56637.03 | −529.2 | – | – | 18.27 (0.30) | – | – | OO |
| 20131211 | 56637.07 | −529.2 | – | – | >19.9 | – | – | MAO |
| 20131226 | 56652.65 | −513.6 | – | – | – | – | >20.4 | GPC1 |
| 20131228 | 56654.03 | −512.2 | – | – | >19.3 | – | – | OO |
| 20140121 | 56678.53 | −487.8 | – | – | 21.50 (0.19) | – | – | GPC1 |
| 20140318 | 56734.78 | −431.5 | – | – | >19.0 | – | – | MAO |
| 20140328 | 56744.64 | −421.6 | – | – | >18.9 | – | – | IAO |
| 20140329 | 56745.80 | −420.5 | – | – | >18.5 | – | – | MAO |
| 20140419 | 56766.90 | −399.4 | – | – | >19.6 | – | – | CAO |
| 20140423 | 56770.55 | −395.7 | – | – | >18.1 | – | – | IAO |
| 20140424 | 56771.55 | −394.7 | – | – | >19.2 | – | – | IAO |
| 20140426 | 56773.88 | −392.4 | – | – | >18.8 | – | – | MAO |
| 20140506 | 56783.49 | −382.8 | – | – | >19.2 | – | – | IAO |
| 20140518 | 56795.83 | −370.4 | – | – | >19.4 | – | – | MAO |
| 20140607 | 56815.27 | −351.0 | – | – | – | >21.1 | – | GPC1 |
| 20140919 | 56919.81 | −246.5 | – | – | >18.5 | – | – | IAO |
| 20141004 | 56934.16 | −232.1 | – | – | >19.3 | – | – | MAO |
| 20141009 | 56939.82 | −226.5 | – | – | >18.2 | – | – | IAO |
| 20141023 | 56953.78 | −212.5 | – | – | >18.7 | – | – | IAO |
| 20141028 | 56958.12 | −208.2 | – | – | >19.6 | – | – | CO |
| 20141028 | 56958.13 | −208.2 | – | – | >19.0 | – | – | MAO |
| 20141030 | 56960.73 | −205.5 | – | – | >18.8 | – | – | IAO |
| 20141101 | 56962.11 | −204.2 | – | – | >19.4 | – | – | MAO |
| 20141107 | 56968.72 | −197.6 | – | – | >17.9 | – | – | IAO |
| 20141212 | 57003.08 | −163.2 | – | – | >19.1 | – | – | MAO |
| 20141222 | 57013.07 | −153.2 | – | – | >20.0 | – | – | MAO |
| 20141223 | 57014.98 | −151.3 | – | – | 19.21 (0.41) | – | – | CO |
| 20141227 | 57018.03 | −148.2 | – | – | >18.5 | – | – | MAO |
| 20150127 | 57049.41 | −116.9 | – | – | – | 19.11 (0.12) | – | GPC1 |
| 20150207 | 57060.95 | −105.3 | – | – | 19.50 (0.56) | – | – | MMAO |
| 20150209 | 57062.96 | −103.3 | 20.85 (0.20) | 19.88 (0.07) | 19.49 (0.07) | 19.58 (0.07) | – | AFOSC |
| 20150210 | 57063.89 | −102.4 | 20.78 (0.06) | 20.02 (0.05) | 19.36 (0.04) | 19.38 (0.05) | – | AFOSC |
| 20150211 | 57064.93 | −101.3 | – | 19.89 (0.06) | 19.36 (0.05) | 19.32 (0.06) | 19.21 (0.14) | AFOSC |
| 20150213 | 57066.96 | −99.3 | – | 19.67 (0.02) | 19.10 (0.02) | 19.06 (0.02) | – | IO:O |
| 20150214 | 57067.94 | −98.3 | – | 19.71 (0.03) | 19.21 (0.01) | 19.16 (0.02) | – | IO:O |
| 20150216 | 57069.01 | −97.3 | – | 19.89 (0.03) | 19.34 (0.04) | 19.36 (0.04) | – | IO:O |
| 20150216 | 57069.96 | −96.3 | – | 19.84 (0.02) | 19.30 (0.02) | 19.35 (0.02) | – | IO:O |
| 20150217 | 57070.76 | −95.5 | 20.36 (0.07) | 19.77 (0.05) | 19.16 (0.04) | 19.24 (0.05) | – | AFOSC |
| 20150218 | 57071.88 | −94.4 | – | – | 19.15 (0.50) | – | – | MAO |
| 20150224 | 57077.58 | −88.7 | – | – | 18.51 (0.43) | – | – | IAO |
| 20150225 | 57078.02 | −88.3 | – | 19.13 (0.12) | – | 18.77 (0.12) | – | IO:O |
| 20150225 | 57078.96 | −87.3 | – | 19.26 (0.03) | 18.75 (0.02) | 18.74 (0.03) | – | IO:O |
| 20150226 | 57079.97 | −86.3 | – | 19.33 (0.16) | – | 18.84 (0.12) | – | IO:O |
| 20150305 | 57086.97 | −79.3 | – | 19.28 (0.07) | 18.70 (0.05) | 18.86 (0.07) | 18.75 (0.05) | IO:O |
| 20150308 | 57089.88 | −76.4 | – | – | 18.52 (0.38) | – | – | PO |
| 20150308 | 57089.97 | −76.3 | – | – | 18.40 (0.50) | – | – | OO |
| 20150312 | 57093.85 | −72.4 | 20.09 (0.07) | 19.16 (0.04) | 18.65 (0.03) | 18.76 (0.04) | – | AFOSC |
| 20150313 | 57094.81 | −71.5 | – | – | 18.20 (0.23) | – | – | MAO |
| 20150318 | 57099.87 | −66.4 | – | – | 18.53 (0.40) | – | – | MAO |
| 20150318 | 57099.95 | −66.3 | 19.91 (0.08) | 19.14 (0.05) | 18.89 (0.05) | 18.80 (0.05) | 18.68 (0.10) | AFOSC |
| 20150324 | 57105.85 | −60.4 | – | – | 18.49 (0.25) | – | – | PO |
| 20150325 | 57106.87 | −59.4 | – | – | 18.50 (0.29) | – | – | PO |
| 20150327 | 57108.92 | −57.4 | – | – | 18.48 (0.03) | 18.53 (0.03) | – | ALFOSC |
| 20150328 | 57109.87 | −56.4 | – | – | 18.42 (0.33) | – | – | MMAO |
| 20150411 | 57123.85 | −42.4 | – | – | 18.01 (0.25) | – | – | MMAO |
| 20150411 | 57123.92 | −42.4 | – | – | 18.07 (0.03) | 18.05 (0.02) | – | ALFOSC |
| 20150414 | 57126.92 | −39.4 | – | – | 18.02 (0.43) | – | – | CO |
| 20150420 | 57132.88 | −33.4 | – | – | 17.96 (0.19) | – | – | PO |
| 20150421 | 57133.82 | −32.5 | – | – | 17.87 (0.24) | – | – | MAO |
| 20150422 | 57134.84 | −31.4 | – | – | 18.22 (0.21) | – | – | MAO |
| 20150428 | 57140.91 | −25.4 | – | 18.59 (0.05) | 18.14 (0.03) | 18.10 (0.03) | 18.15 (0.04) | ALFOSC |
| 20150508 | 57150.94 | −15.3 | – | 18.94 (0.02) | 18.41 (0.03) | 18.35 (0.03) | 18.34 (0.04) | ALFOSC |
| 20150511 | 57153.88 | −12.4 | – | – | 18.40 (0.43) | – | – | CO |
| 20150516 | 57158.51 | −7.8 | – | – | 15.77 (0.19) | – | – | IAO |
| 20150516 | 57158.93 | −7.3 | – | – | 15.60 (0.26) | – | – | PO |
| 20150518 | 57160.90 | −5.4 | – | – | 15.33 (0.21) | – | – | PO |
| 20150519 | 57161.96 | −4.3 | – | – | 15.26 (0.10) | – | – | PO |
| 20150520 | 57162.90 | −3.4 | – | – | 15.20 (0.25) | – | – | PO |
| 20150521 | 57163.91 | −2.4 | – | – | 15.14 (0.23) | – | – | PO |
| 20150524 | 57166.90 | 0.6 | – | – | 15.03 (0.20) | – | – | PO |
| 20150525 | 57167.89 | 1.6 | 15.68 (0.03) | 15.37 (0.03) | 15.22 (0.02) | 15.38 (0.03) | 15.49 (0.03) | ALFOSC |
| 20150526 | 57168.91 | 2.6 | – | – | 15.09 (0.31) | – | – | PO |
| 20150529 | 57171.92 | 5.6 | – | – | 15.24 (0.28) | – | – | PO |
| 20150531 | 57173.92 | 7.6 | – | – | 15.34 (0.29) | – | – | PO |
| 20150603 | 57176.93 | 10.7 | – | – | 15.36 (0.27) | – | – | PO |
| 20150605 | 57178.94 | 12.7 | – | – | 15.37 (0.17) | – | – | PO |
| 20150606 | 57179.92 | 13.6 | – | – | 15.37 (0.12) | – | – | PO |
| 20150607 | 57180.93 | 14.7 | – | – | 15.33 (0.16) | – | – | PO |
| 20150610 | 57183.85 | 17.6 | 16.90 (0.04) | 15.99 (0.04) | 15.79 (0.05) | 15.77 (0.03) | 15.78 (0.06) | AFOSC |
| 20150610 | 57183.93 | 17.7 | – | – | 15.53 (0.17) | – | – | PO |
| 20150613 | 57186.93 | 20.7 | – | – | 15.68 (0.26) | – | – | PO |
| 20150615 | 57188.95 | 22.7 | – | – | 15.78 (0.22) | – | – | PO |
| 20150618 | 57191.95 | 25.7 | – | – | 15.84 (0.27) | – | – | PO |
| 20150624 | 57197.93 | 31.7 | – | – | 16.03 (0.38) | – | – | PO |
| 20150629 | 57202.93 | 36.7 | – | – | 16.30 (0.29) | – | – | PO |
| 20150701 | 57204.93 | 38.7 | – | – | 16.38 (0.50) | – | – | PO |
| 20151023 | 57318.11 | 151.8 | – | 21.11 (0.17) | 19.65 (0.08) | 19.76 (0.08) | 19.19 (0.26) | AFOSC |
| 20151031 | 57326.94 | 160.7 | – | 21.22 (0.22) | 19.82 (0.15) | 19.85 (0.18) | 19.50 (0.42) | LMI |
| 20151105 | 57331.14 | 164.9 | – | 20.99 (0.07) | 19.88 (0.06) | 19.71 (0.06) | 19.51 (0.08) | ALFOSC |
| 20151109 | 57335.11 | 168.8 | – | 21.12 (0.15) | 19.72 (0.10) | 19.86 (0.10) | 19.34 (0.07) | AFOSC |
| 20151122 | 57348.19 | 181.9 | – | 20.97 (0.08) | 20.05 (0.07) | 20.22 (0.08) | 19.73 (0.08) | ALFOSC |
| 20151203 | 57359.08 | 192.8 | – | 21.06 (0.23) | 19.67 (0.10) | 20.08 (0.20) | 19.59 (0.09) | AFOSC |
| 20151216 | 57372.17 | 205.9 | – | 21.05 (0.09) | 19.81 (0.08) | 20.02 (0.10) | – | ALFOSC |
| 20151216 | 57372.17 | 205.9 | – | – | – | – | >19.4 | ALFOSC |
| 20151230 | 57386.15 | 219.9 | – | 21.19 (0.08) | 19.98 (0.06) | 20.41 (0.09) | 20.02 (0.08) | ALFOSC |
| 20160114 | 57401.14 | 234.9 | – | 21.22 (0.07) | 20.03 (0.05) | 20.51 (0.06) | 20.07 (0.10) | ALFOSC |
| 20160217 | 57435.07 | 268.8 | – | 21.43 (0.08) | 20.17 (0.03) | 20.75 (0.06) | 20.48 (0.09) | ALFOSC |
| 20160315 | 57462.99 | 296.7 | – | 21.54 (0.07) | 20.27 (0.04) | 21.00 (0.07) | 20.70 (0.08) | ALFOSC |
aPhases are relative to r maximum light, MJD = 57166.28 ± 0.29.
NIR photometry of SN 2015bh (Vega magnitudes).
| Date | MJD | Phasea | J | H | K | Instrument key |
|---|---|---|---|---|---|---|
| (d) | (mag) | (mag) | (mag) | |||
| 20150214 | 57067.64 | −98.6 | 18.30 (0.23) | – | 17.91 (0.58) | CPAPIR |
| 20150303 | 57084.69 | −81.6 | – | – | 17.06 (0.29) | CPAPIR |
| 20150307 | 57088.14 | −78.1 | – | – | 17.36 (0.25) | NOTCAM |
| 20150307 | 57088.57 | −77.7 | – | – | 17.18 (0.31) | CPAPIR |
| 20150520 | 57162.57 | −3.7 | 14.98 (0.07) | – | – | CPAPIR |
| 20150521 | 57163.58 | −2.7 | 14.94 (0.10) | – | 14.64 (0.06) | CPAPIR |
| 20150527 | 57169.57 | 3.3 | – | – | 14.47 (0.08) | CPAPIR |
| 20150529 | 57171.89 | 5.6 | 14.95 (0.26) | 14.75 (0.24) | 14.44 (0.21) | NOTCAM |
| 20150604 | 57177.58 | 11.3 | 14.81 (0.10) | – | – | CPAPIR |
| 20150607 | 57180.57 | 14.3 | – | – | 14.60 (0.09) | CPAPIR |
| 20150927 | 57292.25 | 126.0 | 18.44 (0.36) | – | – | NOTCAM |
| 20151024 | 57319.92 | 153.6 | 18.72 (0.43) | – | – | CPAPIR |
| 20151031 | 57326.92 | 160.6 | – | – | 18.94 (0.62) | CPAPIR |
aPhases are relative to r maximum light, MJD = 57166.28 ± 0.29.
UV photometry of SN 2015bh (Vega magnitudes).
| Date | MJD | Phasea | UVW1 | UVM2 | UVW2 | Instrument key |
|---|---|---|---|---|---|---|
| (d) | (mag) | (mag) | (mag) | |||
| 20090221 | 54883.69 | −2282.6 | >20.8 | >20.4 | >20.3 | SWIFT |
| 20131210 | 56636.57 | −529.7 | – | >20.6 | – | SWIFT |
| 20131217 | 56643.23 | −523.0 | – | >20.6 | – | SWIFT |
| 20131224 | 56650.10 | −516.2 | – | >20.6 | – | SWIFT |
| 20131231 | 56657.31 | −509.0 | – | >20.6 | – | SWIFT |
| 20140107 | 56664.29 | −502.0 | – | >20.6 | – | SWIFT |
| 20140116 | 56673.40 | −492.9 | – | >20.6 | – | SWIFT |
| 20140121 | 56678.73 | −487.5 | – | >20.7 | – | SWIFT |
| 20140128 | 56685.44 | −480.8 | – | >20.6 | – | SWIFT |
| 20140204 | 56692.33 | −474.0 | – | >20.5 | – | SWIFT |
| 20140211 | 56699.34 | −466.9 | – | >20.6 | – | SWIFT |
| 20140218 | 56706.37 | −459.9 | – | >20.6 | – | SWIFT |
| 20140225 | 56713.34 | −452.9 | – | >20.8 | – | SWIFT |
| 20140304 | 56720.65 | −445.6 | – | >20.6 | – | SWIFT |
| 20140311 | 56727.16 | −439.1 | – | >20.7 | – | SWIFT |
| 20140318 | 56734.21 | −432.1 | – | >20.5 | – | SWIFT |
| 20140325 | 56741.59 | −424.7 | – | >20.8 | – | SWIFT |
| 20140401 | 56748.61 | −417.7 | – | >20.6 | – | SWIFT |
| 20140407 | 56754.69 | −411.6 | – | >20.7 | – | SWIFT |
| 20140415 | 56762.08 | −404.2 | – | >20.6 | – | SWIFT |
| 20140422 | 56769.39 | −396.9 | – | >20.7 | – | SWIFT |
| 20140503 | 56780.29 | −386.0 | – | >20.7 | – | SWIFT |
| 20140507 | 56784.95 | −381.3 | – | >20.6 | – | SWIFT |
| 20140513 | 56790.89 | −375.4 | – | >20.6 | – | SWIFT |
| 20140520 | 56797.36 | −368.9 | – | >20.7 | – | SWIFT |
| 20140527 | 56804.54 | −361.7 | – | >20.6 | – | SWIFT |
| 20140604 | 56812.17 | −354.1 | – | >20.6 | – | SWIFT |
| 20150211 | 57064.51 | −101.8 | >19.6 | >19.7 | >19.2 | SWIFT |
| 20150218 | 57071.90 | −94.4 | >20.4 | >20.4 | >20.0 | SWIFT |
| 20150516 | 57158.73 | −7.6 | 15.57 (0.08) | 15.15 (0.06) | 15.02 (0.07) | SWIFT |
| 20150517 | 57159.92 | −6.4 | 15.17 (0.07) | 14.83 (0.06) | 14.67 (0.06) | SWIFT |
| 20150518 | 57160.19 | −6.1 | 15.01 (0.06) | 14.70 (0.07) | 14.63 (0.05) | SWIFT |
| 20150519 | 57161.49 | −4.8 | – | 14.62 (0.06) | – | SWIFT |
| 20150519 | 57161.66 | −4.6 | 14.71 (0.06) | 14.64 (0.06) | 14.46 (0.05) | SWIFT |
| 20150520 | 57162.23 | −4.1 | 14.77 (0.06) | 14.59 (0.06) | 14.46 (0.06) | SWIFT |
| 20150520 | 57162.50 | −3.8 | 14.72 (0.05) | 14.43 (0.06) | – | SWIFT |
| 20150521 | 57163.89 | −2.4 | – | – | 14.39 (0.05) | SWIFT |
| 20150522 | 57164.19 | −2.1 | 14.57 (0.05) | 14.40 (0.05) | 14.43 (0.05) | SWIFT |
| 20150522 | 57164.55 | −1.7 | 14.67 (0.05) | 14.57 (0.06) | 14.53 (0.05) | SWIFT |
| 20150524 | 57166.82 | 0.5 | 14.82 (0.06) | 14.67 (0.06) | – | SWIFT |
| 20150525 | 57167.24 | 1.0 | – | – | 14.53 (0.05) | SWIFT |
| 20150525 | 57167.48 | 1.2 | 15.07 (0.06) | 14.86 (0.06) | 14.60 (0.06) | SWIFT |
| 20150525 | 57167.58 | 1.3 | 14.96 (0.06) | – | – | SWIFT |
| 20150526 | 57168.34 | 2.1 | 15.28 (0.07) | 15.02 (0.06) | 14.67 (0.06) | SWIFT |
| 20150527 | 57169.47 | 3.2 | 15.45 (0.07) | 15.10 (0.06) | 14.87 (0.06) | SWIFT |
| 20150528 | 57170.24 | 4.0 | 15.62 (0.07) | 15.24 (0.06) | 14.94 (0.06) | SWIFT |
aPhases are relative to r maximum light, MJD = 57166.28 ± 0.29.
HST photometry of SN 2015bh (Vega magnitudes).
| Date | MJD | Phasea | F336W | F450W | F555W | F606W | F658N | F675W | F814W |
|---|---|---|---|---|---|---|---|---|---|
| (d) | (mag) | (mag) | (mag) | (mag) | (mag) | (mag) | (mag) | ||
| 20080209 | 54505.50 | −2660.8 | – | – | – | 22.82 (0.04) | 19.71 (0.13) | – | – |
| 20080330 | 54555.45 | −2610.8 | 21.50 (0.07) | – | – | 21.56 (0.02) | – | – | – |
| 20081219 | 54819.05 | −2347.2 | – | – | 22.73 (0.04) | – | – | – | 21.80 (0.02) |
| 20081220 | 54820.51 | −2345.8 | – | 22.18 (0.02) | – | – | – | 20.95 (0.02) | – |
| 20090120 | 54851.68 | −2314.6 | – | 23.90 (0.07) | – | – | – | 22.60 (0.08) | – |
| 20090229 | 54887.57 | −2278.7 | >21.5 | – | – | 22.48 (0.02) | – | – | – |
aPhases are relative to r maximum light, MJD = 57166.28 ± 0.29.
From WFPC2 manual: F336W: WFPC2 U (λc = 3342 Å); F450W: Wide B (λc = 4519 Å); F555W: WFPC2 V (λc = 5398 Å); F606W: Wide V (λc = 5935 Å); F656N: Hα (λc = 6564 Å); F675W: WFPC2 R (λc = 6696 Å); F814W: WPFC2 I (λc = 7921 Å).
Log of spectroscopy observations of SN 2015bh.
| Date | MJD | Phasea | Instrument key | Grism or grating + slit | Spectral range | Resolution |
|---|---|---|---|---|---|---|
| (d) | (Å) | (Å) | ||||
| 20150209 | 57062.97 | −103.3 | AFOSC | gm4+1.69 arcsec | 3400–8200 | 14 |
| 20150214 | 57067.07 | −99.2 | ISIS | R300B/R316R+GG495+1.50 arcsec | 3200–9100 | 5 |
| 20150214 | 57067.88 | −98.4 | OSIRIS | R1000B+1.00 arcsec | 3650–7850 | 7 |
| 20150311 | 57092.37 | −73.9 | MMT | 300 +1.00 arcsec (slit) | 3350–8550 | 7 |
| 20150326 | 57107.95 | −58.3 | OSIRIS | R1000B+1.00 arcsec | 3650–7850 | 7 |
| 20150327 | 57108.93 | −57.3 | ALFOSC | gm4+1.00 arcsec | 3400–9000 | 14 |
| 20150423 | 57136.00 | −30.3 | IMACS | 300 +0.70 arcsec (slit) | 4250–8500 | 4 |
| 20150508 | 57150.90 | −15.4 | ALFOSC | gm4+1.00 arcsec | 3400–9000 | 14 |
| 20150516 | 57158.96 | −7.3 | IMACS | 300 +0.70 arcsec (slit) | 4250–8500 | 4 |
| 20150517 | 57159.90 | −6.4 | LRS | LR-B+1.00 arcsec | 3400–8000 | 12 |
| 20150520 | 57162.84 | −3.4 | B&C | 300+4.00 arcsec | 3350–8000 | 11 |
| 20150525 | 57167.91 | 1.6 | ALFOSC | gm4+1.00 arcsec | 3300–9000 | 14 |
| 20150609 | 57182.89 | 16.6 | LRS | LR-B/LR-R+1.00 arcsec | 3300–9300 | 11 |
| 20150618 | 57191.90 | 25.6 | OSIRIS | R1000B+1.00 arcsec | 3650–7850 | 7 |
| 20151003 | 57298.78 | 132.5 | OSMOS | VPH-R+1.00 arcsec (slit) | 4500–9100 | 4.1 |
| 20151105 | 57332.04 | 165.8 | AFOSC | gm4+1.69 arcsec | 3400–8250 | 15 |
| 20151113 | 57339.45 | 173.2 | OSMOS | VPH-R+1.00 arcsec (slit) | 4500–9100 | 4.1 |
| 20151126 | 57353.13 | 186.9 | OSIRIS | R1000B+1.00 arcsec | 3640–7870 | 7 |
| 20151206 | 57362.45 | 196.2 | OSMOS | VPH-R+1.20 arcsec (slit) | 5600–9000 | 5.5 |
| 20160102 | 57390.25 | 224.0 | OSIRIS | R1000R+1.00 arcsec | 5100–9300 | 8 |
| 20160305 | 57452.89 | 286.6 | OSIRIS | R1000R+1.00 arcsec | 5100–9300 | 8 |
aPhases are relative to r maximum light, MJD = 57166.28 ± 0.29.
