


Abstract
We present a hard X-ray Nuclear Spectroscopic Telescope Array (NuSTAR) observation of PSR J0437−4715, the nearest millisecond pulsar. The known pulsations at the apparent pulse period |${\sim }5.76{\,{\rm ms}}$| are observed with a significance of 3.7σ, at energies up to 20 keV above which the NuSTAR background dominates. We measure a photon index Γ = 1.50 ± 0.25 (90 per cent confidence) for the power-law fit to the non-thermal emission. It had been shown that spectral models with two or three thermal components fit the XMM–Newton spectrum of PSR J0437−4715, depending on the slope of the power-law component, and the amount of absorption of soft X-rays. The new constraint on the high-energy emission provided by NuSTAR removes ambiguities regarding the thermal components of the emission below |$3{\,{\rm keV}}$|. We performed a simultaneous spectral analysis of the XMM–Newton and NuSTAR data to confirm that three thermal components and a power law are required to fit the 0.3–20 keV emission of PSR J0437−4715. Adding a ROSAT-PSPC spectrum further confirmed this result and allowed us to better constrain the temperatures of the three thermal components. A phase-resolved analysis of the NuSTAR data revealed no significant change in the photon index of the high-energy emission. This NuSTAR observation provides further impetus for future observations with the NICER mission (Neutron Star Interior Composition Explorer) whose sensitivity will provide much stricter constraints on the equation of state of nuclear matter by combining model fits to the pulsar's phase-folded light curve with the pulsar's well-defined mass and distance from radio timing observations.
INTRODUCTION
PSR J0437−4715 (J0437, hereafter), currently the nearest millisecond pulsar (MSP) to the Earth, was discovered in the 70 cm Parkes radio pulsar survey (Johnston et al. 1993) and subsequently in the X-rays with ROSAT (Becker & Trümper 1993). Since then, it has been extensively studied in multiple energy bands. Radio observations allow precise measurements of the pulsar spin (|$P=5.76{\,{\rm ms}}$|), intrinsic spin-down rate (|$\dot{P}=5.8\,{{\times} 10^{-20}}{\rm \,{\,{\rm s}\,{\rm s^{-1}}}}$|), binary system orbital properties (Verbiest et al. 2008), as well as the distance |$156.3\pm 1.3{\rm \,pc}$| (Deller et al. 2008). In the infrared and optical bands, the emission from the white-dwarf companion dominates, leading to constraints on its properties (Durant et al. 2012). J0437 has also been detected in the near- and far-ultraviolet (UV), where the Rayleigh–Jeans tail of the pulsar surface thermal emission is thought to dominate the thermal emission of the white-dwarf companion (Durant et al. 2012). Previous XMM–Newton fast-timing mode observations of J0437 have permitted the interpretation of the phase-modulated soft X-ray flux as the thermal emission from two polar caps moving in and out of the line of sight as the pulsar rotates (Bogdanov 2013). Observations with the Fermi Gamma-Ray Space Telescope have also detected |$>\!\! 100{\rm \,MeV}$| pulsed emission from J0437, thought to originate far from the neutron star (NS) surface (Abdo et al. 2009).
However, because of its faintness in the hard X-ray band (∼5–100 keV), as well as its proximity on the sky (∼4 arcmin) to the bright active galactic nucleus RX J0437.4−4711 (Halpern, Martin & Marshall 1996), the emission of J0437 in this band has been inaccessible to the previous generation of hard X-ray telescopes, such as INTEGRAL (Winkler et al. 2003) or the Swift Burst Alert Telescope (Krimm et al. 2013). The metal oxide semi-conductor (MOS) detectors of XMM–Newton cover part of the hard X-ray band (|${\lesssim } 10{\,{\rm keV}}$|), but the drop in effective area above 4 keV limits the constraints on the high-energy tail of the spectrum (Bogdanov 2013). When it was launched, the Nuclear Spectroscopic Telescope Array (NuSTAR), with its hard X-ray focusing optics capabilities, opened a new window on the hard X-ray sky (Harrison et al. 2013), with unrivalled sensitivity in the 3–79 keV range. In addition, the angular resolution of NuSTAR (18 arcsec full-width half-maximum) allows us to obtain the high-energy spectrum of J0437 without the contaminating photons from the nearby active galactic nucleus.
With the XMM observations, phase-averaged (with XMM-mos) and pulse phase-resolved (with XMM-pn in fast-timing mode) analyses were used to determine the system geometry and to characterize the surface emission (Bogdanov 2013, using the method presented in Bogdanov, Grindlay & Rybicki 2008). In turn, these analyses led to some constraints on the compactness of the pulsar |${M_{\rm NS}}/{R_{\rm NS}}$|. The independently measured mass, |${M_{\rm NS}}=1.76\pm 0.20{\,\mathrm{M}_{\odot }}$| from radio timing (Verbiest et al. 2008), therefore restricted the range of possible radii to values |${\gtrsim } 11.1{\,{\rm km}}$|. Recent radio timing measurements of J0437 have led to a mass estimate of |${M_{\rm NS}}=1.44\pm 0.07{\,\mathrm{M}_{\odot}}$| (Reardon et al. 2016), which would allow slightly lower radii according to the analysis of Bogdanov (2013).
Measurements of the NS radii are crucial to determine their interior properties, and study the behaviour of dense nuclear matter (e.g. Lattimer & Prakash 2007; Heinke 2013; Miller 2013, for reviews). Specifically, the equation of state of matter at and above nuclear density can only be determined by observations of NSs, and in particular, measurements of their radii. In addition to the pulse profile modelling of MSPs, other methods exist to measure the NS radius, including constraints from the photospheric radius expansion bursts of type I X-ray bursting NSs (e.g. Özel & Psaltis 2009; Güver et al. 2010; Suleimanov et al. 2011; Özel et al. 2016), and the measurement of RNS from the surface emission of NSs in quiescent low-mass X-ray binaries (Heinke et al. 2006, 2014; Webb & Barret 2007; Guillot et al. 2011, 2013; Guillot & Rutledge 2014). However, all methods are affected by systematic uncertainties and it is important to understand and test them all until they converge to consistent results.
For J0437, the measurement of the compactness (i.e. radius measurement) relies on observations of the pulsed thermal surface emission. However, it has been shown that the poorly constrained high-energy tail, modelled with a power law (PL), affects how well the thermal emission can be constrained (Bogdanov 2013). Specifically, depending on the PL index, two or three thermal components were necessary to fit the soft X-ray emission of J0437: with a softer PL index ∼2.5, the third thermal component (|${kT_{\rm eff}}\sim 50{\,{\rm keV}}$|) is unnecessary. This can be explained by the fact that a PL with Γ ∼ 2.5 fitted to the high-energy tail starts dominating the emission in the 0.1–0.3 keV range where the fluxes from the two hottest thermal components (corresponding to the spot emission) decline. On the other hand, a harder PL with Γ ∼ 1.5 leaves an excess of counts in the 0.1–0.3 keV band which is then well fit by a cold thermal component.
Since the constraints on |${M_{\rm NS}}/{R_{\rm NS}}$| are extracted from the pulse profile and the thermal components normalizations, the poorly constrained PL limits the precision of the |${M_{\rm NS}}/{R_{\rm NS}}$| measurement. In other words, an independent measurement of the PL index can provide a better constraint on the thermal components and therefore on the radius of J0437. This is of particular importance since this MSP is the primary target for the upcoming Neutron Star Interior Composition Explorer (NICER, Gendreau, Arzoumanian & Okajima 2012, expected launch date: early 2017). The large effective area of this future mission mounted on the International Space Station will collect ∼106 photons from J0437 (amongst other NSs) for the sole purpose of analysing its pulsed emission and measuring its compactness. It is therefore crucial to know and constrain, ahead of time, the nature of the high-energy emission of this key NICER target.
This paper presents a NuSTAR observation of J0437, as well as a joint analysis with archival XMM observations. Analysis of an archival ROSAT-PSPC observation complements the XMM-MOS data by providing an energy coverage to lower energies. Combined with the NuSTAR observation, the spectral data presented in this work cover an energy range from 0.1 to 20 keV. In Section 2, the observations are described together with the data reduction and analysis procedures. The results of the timing and spectral analysis are presented in Sections 3 and 4, respectively. Finally, Section 5 summarizes and discusses the results.
OBSERVATIONS AND ANALYSIS
NuSTAR observations
The NuSTAR Observatory consists of two co-aligned telescopes focusing hard X-rays in the 3–79 keV range on to two focal planes modules, FPMA and FPMB (Harrison et al. 2013). It provides relatively low-background imaging capabilities (18 arcsec full-width half-maximum) in the hard X-ray band with a |$2{\rm \,\mu s}$| relative timing resolution.
An |${\sim } 200{\,{\rm ks}}$| (total on source) observation of J0437 was performed in 2015 December/January (see Table 1). The FPMA and FPMB data were re-processed following the standard pipeline of the NuSTAR data analysis system, nupipeline v0.4.3 and heasoft v16.0, together with the NuSTAR calibration files from caldb v4.6.8. During the data processing, photon time tags were barycentred to the Solar system reference frame using the position of J0437 obtained from radio timing.
For the spectral analysis, the size of the circular extraction region was chosen to maximize the signal-to-noise ratio (S/N). Specifically, a range of source extraction radii were tested between 10 arcsec and 120 arcsec, with various annuli around the source regions for the backgrounds. A 35 arcsec circular source region maximizes the S/N and was therefore used to generate the spectra. For the background, an annulus region with inner radius 80 arcsec and outer radius of 87.2 arcsec was used to ensure that both the source and background regions have the same area. Because the background noise dominates the source signal above 20 keV, counts above that energy are discarded, restricting the spectral analysis to the 3–20 keV energy range. The background subtracted count rates for J0437 are |$1.50\pm 0.15{\rm \,counts\,ks^{-1}}$| for FPMA and |$1.60\pm 0.16{\rm \,counts\,ks^{-1}}$| for FPMB, in the 3–20 keV energy range. Data from each module were combined to generate one spectrum for each module (including the response files), and following that step, photon events were grouped with a minimum of 40 counts per bin. Note that the FPMA and FPMB spectra are not combined together. Instead a cross-normalization constant between them is used during the spectral analysis to account for cross-calibration uncertainties between the two modules (see Section 4.1).
XMM–Newton observations
This work used a continuous 130 ks archival observation of J0437 whose analysis was presented in detail in a previous work (Bogdanov 2013). The fast readout cadence (30 μs) of the European Photon Imaging Camera (EPIC) pn instrument in timing mode allowed the measurement of the pulse profile of J0437, while the EPIC MOS1 and MOS2 instruments were used for the spectral analysis. In this work, the raw pn and MOS data were reprocessed with the pnchain and emchain tasks of the xmmsas v14.0 package and with the latest calibration files, following the standard data reduction and analyses procedures. As in Bogdanov (2013), the time intervals of high background were removed leading to the exposure times listed in Table 1. For the MOS1/2 imaging data, circular extraction regions were used with 60 arcsec radii for the source regions. The MOS1/2 spectra were generated in the 0.3–10 keV band since the calibration below 0.3 keV is unreliable. Specifically, quantum efficiency inhomogeneities in the detector itself are present at low energy (see XMM calibration document CAL-TN-00181), and are not considered in the xmmsas (private communication, J. Ebrero, XMM–Newton Science Operation Center). For all spectra, the response matrix and ancillary response files were obtained with the tools rmfgen and arfgen, respectively. The MOS1 and MOS2 spectra (extracted with identical parameters) and their response files were combined into a single spectrum using the task epicspeccombine, and events were then binned with a minimum of 100 counts per bin. Overall, the data reduction of the XMM data was very similar to that of Bogdanov (2013), except for the energy range used.
Selected X-ray observations of J0437.
| ObsID | Telescope/ | Start | Usable exposure |
|---|---|---|---|
| instrument | time (ut) | (ks) | |
| 701184 | ROSAT-PSPC | 1992-09-20 17:51:32 | 6.1 |
| 0603460101 | XMM-mos1 | 2009-12-15 19:41:16 | 118.2 |
| 0603460101 | XMM-mos2 | 2009-12-15 19:41:16 | 119.3 |
| 0603460101 | XMM-pn | 2009-12-15 20:00:24 | 117.0 |
| 30001061002 | NuSTAR-FPMA | 2014-12-29 14:51:07 | 78.8 |
| 30001061002 | NuSTAR-FPMB | 2014-12-29 14:51:07 | 78.8 |
| 30001061004 | NuSTAR-FPMA | 2014-12-31 18:26:07 | 68.4 |
| 30001061004 | NuSTAR-FPMB | 2014-12-31 18:26:07 | 68.4 |
| 30001061006 | NuSTAR-FPMA | 2015-01-02 17:16:07 | 67.9 |
| 30001061006 | NuSTAR-FPMB | 2015-01-02 17:16:07 | 67.9 |
A 2002 observation of J0437 with XMM is also publicly available. However, the X-ray flux decreased by ∼5 per cent between 2002 and 2009. This decrease was measured by fitting the spectra of both epochs with the same model, except for a multiplicative constant (fixed to unity for the 2002 data, and free to vary for the 2009 data). We found a statistically acceptable fit, and a multiplicative constant c = 0.945 ± 0.014 (90 per cent confidence). We note that an accumulation of contaminants on the MOS detectors since the launch of XMM have affected the sensitivity in the low-energy range.2 However, this effect has been accounted for in the publicly available XMM calibration files since xmmsas v13.5. It is beyond the scope of this paper to present a detailed analysis of the soft X-ray variability of J0437. We therefore choose to use only the longest and most recent observation of this MSP, and we leave it for future work to investigate the origin of this possible soft X-ray variability.
ROSAT-PSPC observations
This work also took advantage of the energy response of the ROSAT-PSPC camera down to 0.1 keV. Using pre-processed data sets, the spectral extraction was performed with the ftools package xselect. Source counts were selected with a circular region centred around the radio position of J0437, with a radius of 70 arcsec. For the background, a source-centred annulus was chosen, with inner radius 70 arcsec and outer radius 110 arcsec. The response matrix file is provided by caldb3 and the ancillary response file with the ftools command pcarf. Channels were grouped with a minimum of 40 counts per bin.
TIMING ANALYSIS
To study the 2.0–20 keV NuSTAR pulse profile of J0437, the barycentred photon event times were folded using the radio ephemeris, obtained at the Molonglo Observatory (see Appendix A), with the photon plugin4 of the tempo2 pulsar timing package (Edwards, Hobbs & Manchester 2006). The phases obtained from folding were then grouped into 10 phase bins, with Poisson errors in each bin (Fig. 1). An H-test was performed to evaluate the significance of the observed pulse (de Jager, Raubenheimer & Swanepoel 1989). We found an H-test probability of 0.000 22, which quantifies the significance of the H-value by estimating the probability of obtaining, by chance, an H-value as large, or larger, from sampling a uniform distribution. The H-test probability found corresponds to an ∼3.7σ significance. By separating photons from the on- and off-pulse parts of the profile (see divisions in Fig. 1), spectra were obtained during these two different phases of the rotation. This is further discussed in Section 4.3.
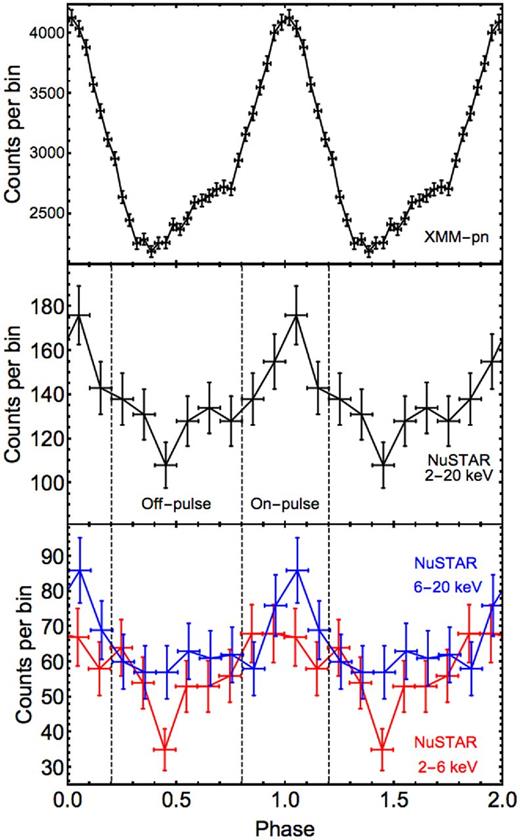
Top: XMM-pn pulse profile of J0437 in the 0.5–2.0 keV energy range, as analysed in Bogdanov (2013). Middle: NuSTAR pulse profile of J0437 obtained by folding photons in the 2–20 keV band at the known radio ephemeris. The H-test probability associated with this pulse profile is 0.000 22 (∼3.7σ). The vertical dashed lines separate the on- and off-pulse regions used to generate the phase-resolved spectra presented in Section 4.3. Bottom: 2–6 keV and 6–20 keV NuSTAR pulse profiles of J0437. When the photons are split into two energy bands, the pulsation detection significance diminishes (see text) due to the decrease in S/N. Note that the pulse profiles of J0437 observed by NuSTAR might be distorted from the true morphology by the NuSTAR clock drift (see Section 3.1).
The resulting pulsed fraction, defined as the fraction of counts above the minimum,5 of the J0437 profile is 24 ± 6 per cent (1σ, all pulse fractions errors provided thereafter are given at the 1σ level), for photons in the energy range 2–20 keV. Note that NuSTAR is sensitive to photons below |$3{\,{\rm keV}}$|, and while those photons cannot formally be used for a spectral analysis (due to the current absence of calibration below |$3{\,{\rm keV}}$|), they were used here to study the pulse profile. When compared to the pulse fractions measured in the soft X-ray band with XMM (32 ± 1, 35 ± 1, 37 ± 1, 37 ± 1, and 35 ± 2 per cent in the 0.275–0.35, 0.35–0.55, 0.55–0.75, 0.75–1.1, and 1.1–1.7 keV bands, respectively, Bogdanov 2013), there appears to be a decrease in the pulsed fraction as energy increases. Photons were then split into two separate bands, 2–6 and 6–20 keV, before being folded with the method described in the previous paragraph. The separation energy is chosen to have similar number of photons in both bands. The pulse fractions in these two bands are: 32 ± 9 and 20 ± 8 per cent, respectively. These pulse fractions are different from 0 at the 99.92 per cent and 98.76 per cent confidence level, respectively, which correspond to 3.4σ and 2.5σ. Although the S/N does not allow one to draw a firm conclusion, these values appear to reinforce the suggestion that the pulsed fraction decreases with increasing photon energy. We also note that although the detection of pulsations in the full 2–20 keV energy range is significant, the detection is only marginal in the two separate energy bands: the H-test probabilities are 0.0057 for the low energy band (equivalent to 2.7σ), and 0.015 for the high energy band (equivalent to 2.4σ).
It is important to keep in mind that the true morphology of the pulse profile might be distorted by a drift in the NuSTAR clock, causing a smearing of the pulse, and therefore a decrease in the measured pulsed fraction. The attempt to correct for the NuSTAR clock drift is discussed in Section 3.1 and the smearing of the pulse is quantified in Section 3.2.
Searching and correcting for the residual clock drift
The NuSTAR onboard photon time stamping clock is known to suffer drifts that are due to temperature variations as the telescope orbits the Earth and is exposed to a variable environment. The largest fraction of this clock drift can be corrected for during the processing of NuSTAR data with up-to-date clock files6 provided by the NuSTAR calibration team. However, there remains a residual clock drift. Therefore, while the NuSTAR temporal resolution is |$2{\rm \,\mu s}$|, inaccuracies in the time stamping due to the clock-drift limit the timing accuracy to |${\sim } 0.5{\,{\rm ms}}$|.
This residual clock drift has been noticed in observations of the Crab pulsar (Madsen et al. 2015). Residuals in the timing exhibited modulations at a period of |${\sim } 97{\rm \,min}$|, the satellite's orbital period. The detection of this residual clock drift in the timing analysis of the Crab pulsar was only possible because this source is bright enough that pulse time-of-arrivals can be obtained on time-scales of |${\sim } 5{\rm \,min}$|, much shorter than the |${\sim } 97{\rm \,min}$| orbital period. The residual drifts of the photon time stamps cause a smearing of the otherwise sharper pulse. While this did not significantly affect the pulse shape of the Crab pulsar (spin period |$P=33{\,{\rm ms}}$|), the effects on a faint 5.76 ms pulse could be more dramatic.
Each pair of parameters (A, ϕ) therefore resulted in a corrected profile in which the significance of a pulse was investigated using an H-test. From this search, a grid of H values was obtained, or equivalently, H-test probabilities that allows one to determine whether the corrections applied by each pair of parameters result in a detected/improved pulse for J0437. The clock-drift amplitudes and phases were sampled in the ranges 0–2.5 ms (step of 0.0125 ms) and 0 − 2π (step of π/200), respectively. Fig. 2 shows the H-test probabilities obtained from the grid search. Low H-test probabilities (dark purple) correspond to peaks in the H-score. We found that none of the detected peaks gives an H-test probability significantly higher than that for the zero amplitude clock-drift correction. In particular, the peak at |$A\sim 1.2{\,{\rm ms}}$| is likely to be a statistical coincidence since there is no evidence from the Crab pulsar timing that the clock-drift amplitude is that large. However, the less-significant peak at |$A\sim 0.3{\,{\rm ms}}$| is closer to the expected residual clock-drift amplitude (see above, and Madsen et al. 2015), but the low significance of the improvement prevents us from making any firm conclusions. More importantly, the |$A\sim 0.3{\,{\rm ms}}$| solution does not change significantly the pulsed fraction or the morphology of the pulse profile.
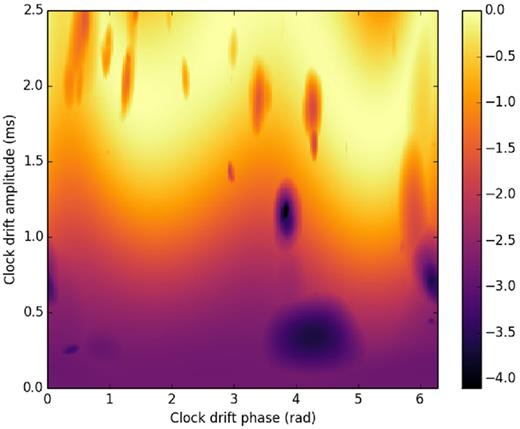
Results of the search for the NuSTAR clock drift using the pulse profile of J0437. The clock drift is assumed to be sinusoidal, with unknown phase and amplitude, and with a period equal to that of the NuSTAR orbit. The colour scale corresponds to the H-score log-probability of such a score happening by chance (see Section 3.1).
Effect of the residual clock drift on the pulsed fraction
To estimate the magnitude of the smearing effect on the observed pulse profile, we simulated photons randomly drawn from a pulse profile distribution (with |$P=P_{\rm J0437}=5.76{\,{\rm ms}}$|) over a total time equal to the time span of our NuSTAR observation. The randomly drawn times of these photons were then modified by a small time difference equal to what the clock drift would cause, following equation (1) (assuming ϕ = 0.0). After folding these clock-drift modified photon times at the period |$P=5.76{\,{\rm ms}}$|, the pulsed fraction of this constructed pulse profile was calculated. It was then compared to the pulsed fraction of the pulse profile obtained before altering the photon times with the clock-drift effect. This process was repeated for a range of clock-drift amplitudes between 0.0 and 1.0 ms, and 100 times for each amplitude. Finally, we calculated the average difference between the intrinsic pulsed fraction and that affected by a clock drift. This simulation was performed for a purely sinusoidal pulse profile, as well as for a small duty cycle pulse profile – we used a Gaussian profile with 1σ = 0.05PJ0437. The per cent decreases of the pulse fractions in these two cases are shown in Fig. 3. If the true residual clock drift of NuSTAR has an amplitude of 0.4 ms, as suggested by the observations of the Crab Pulsar (Madsen et al. 2015), and by the clock-drift search described in Section 3.1, the measured pulsed fraction is underestimated by about ∼16 per cent in the case of a short duty cycle pulse profile, and by ∼5 per cent in the case of a sinusoidal pulse profile. While this effect is currently buried in the statistical uncertainties for J0437, it can become significant with deeper observations, and for other bright MSPs with |$P_{\rm spin}\lesssim 5{\,{\rm ms}}$|. For example, faster pulsars, such as SAX J1808.4−3658 (|$P_{\rm spin} = 2.5{\,{\rm ms}}$|; Wijnands & van der Klis 1998), observed with NuSTAR, can expect to have their measured pulsed fraction biased by ∼40 per cent due to a 0.4 ms clock drift, assuming a small duty cycle pulse profile.
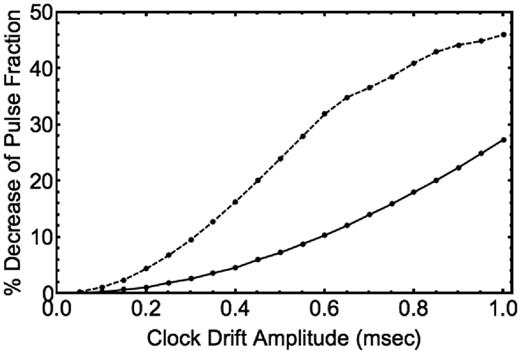
Fractional difference between the intrinsic pulsed fraction of a 5.76 ms sinusoidal pulse profile and the pulsed fraction of a pulse profile distorted by the NuSTAR clock drift, as a function of the clock-drift amplitude. The solid line corresponds to a sinusoidal simulated pulse profile, and the dashed line corresponds to simulated narrow Gaussian pulse profile with a 10 per cent duty cycle (1σ width). For a clock-drift amplitude of 0.4 ms (Madsen et al. 2015), the measured pulsed fraction is artificially reduced by ∼5 per cent, assuming a sinusoidal pulse profile, and by ∼16 per cent for a short duty cycle profile.
SPECTRAL ANALYSIS
As was reported in previous work, the spectrum of J0437 contains multiple components: two thermal components, and a non-thermal component modelled with a PL (Zavlin et al. 2002; Zavlin 2006; Durant et al. 2012; Bogdanov 2013). A third thermal component (with |${kT_{\rm eff}}\sim 40{\,{\rm eV}}$|) has been suggested to fit the lowest energy range available in the XMM-MOS data (Bogdanov 2013). Furthermore, Hubble Space Telescope observations also seem to advocate for a third thermal component representing the cold emission from the NS surface, for which the Rayleigh–Jeans tail is detected in the far-UV and appears in excess of the modelling of the white-dwarf companion atmosphere (Durant et al. 2012). The NuSTAR spectrum of J0437 complements the XMM-MOS spectra up to 20 keV range, and provides a useful handle on the non-thermal emission. However, because the NuSTAR and XMM observations were obtained at a different epoch, the joint analysis described below assumes that J0437 is a non-variable source. This assumption is based on the lack of evidence for long term variability of the thermal emission in non-accreting MSPs like J0437 (Kaspi, Roberts & Harding 2006).
NuSTAR spectroscopy
The analysis of the NuSTAR data was first performed without the XMM-MOS data. In the 3–20 keV range covered by NuSTAR, the non-thermal component dominates the emission, and a simple unabsorbed PL spectral model was used. Absorption of X-rays by the Galactic interstellar medium in that energy range plays a negligible role. A multiplicative constant c, fixed to unity for the FPMA spectrum and fitted for the FPMB spectrum, was added to take into account the cross-correlation uncertainties between the two modules. All following parameters resulting from the spectral analyses are quoted with 90 per cent confidence. The photon index measured is Γ = 1.60 ± 0.25, consistent with, but significantly restricting the range of values previously tested or reported (Durant et al. 2012; Bogdanov 2013). The multiplicative constant is consistent with unity, |$c=1.17{^{+ 0.28}_{- 0.23}}$|. Adding a hot |$kT=260{\,{\rm eV}}$| blackbody (as observed in the XMM-MOS data analysis of Bogdanov 2013) with a fixed temperature and free normalization did not result in any significant change in the photon index.
Joint spectral analysis
This subsection concerns the joint fit of the XMM-MOS and NuSTAR spectra. Fig. 4 shows the count spectra obtained with XMM-MOS and NuSTAR, together with their respective backgrounds.
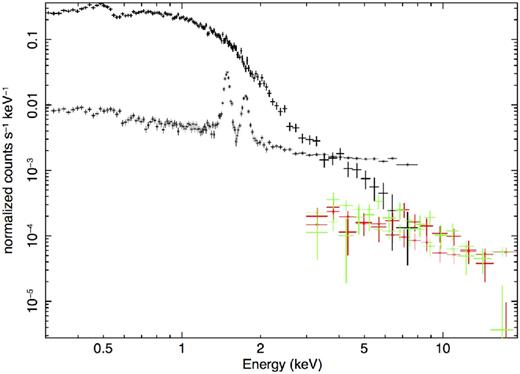
XMM-MOS (black), NuSTAR-FPMA (red) and NuSTAR-FPMB (green) count spectra of J0437 (data points with thick lines), together with their respective background spectra (‘×’ data points with thin error bars).
In the previous work, the low S/N of the XMM-MOS data at energies above |${\sim }3{\,{\rm keV}}$| allowed the measured PL component to have indices in the range ∼0.8–2.9 at the 90 per cent confidence level (Durant et al. 2012; Bogdanov 2013), depending on the number and types of the thermal components fitting the soft X-ray emission. Specifically, two or three thermal components both led to statistically acceptable fits, but resulted in different PL photon indices. Omitting the third (coldest) thermal component could be compensated for by a soft PL (higher Γ) which would dominate the very-soft emission and account for the excess of counts in the softest energy band (|$<\!0.3{\,{\rm keV}}$|). We note that this emission at |$E<0.3{\,{\rm keV}}$| is detected in the XMM-MOS data (Bogdanov 2013), but in an energy band where the spectral calibration is undetermined.
Constraints on the non-thermal emission from the NuSTAR data therefore permit differentiation between the range of possible soft X-ray emission models proposed. The NuSTAR spectrum was simultaneously fit with the XMM-MOS spectrum. As performed above, a multiplicative constant c was used to account for cross-correlation uncertainties between the MOS (fixed c) and the FPMA/B spectra (one fitted c parameter for each module). In this section, blackbody components were used for the thermal emission. Section 5 discusses the use of NS atmosphere models to describe the hotspot emission and demonstrates that the choice of atmosphere model or Planck spectrum does not significantly affect the measured PL index. Finally, the Galactic absorption was quantified with the column density of hydrogen NH (noted NH, 20 thereafter, when expressed in units of |${10^{20}}{\rm \,atoms{\,{\rm cm^{-2}}}}$|). It was modelled using the phabs model, with the bcmc cross-sections (Balucinska-Church & McCammon 1992) and the wilm abundances (Wilms, Allen & McCray 2000). Alternative abundances have also been tested, as well as the tbabs absorption model. The fits were insensitive to these changes: all parameters were consistent well within the 1σ uncertainties of the values obtained with phabs and wilm.
As found in the previous work, the models blackbody+powerlaw and blackbody+blackbody are not statistically acceptable fits to present data. The former, with a null hypothesis probability p ∼ 10−6, presents highly structured residuals, especially above |$6{\,{\rm keV}}$|. The latter has p ∼ 10−45, and does not fit any of the high-energy emission above |$3{\,{\rm keV}}$|. Considering the spectral model blackbody+blackbody+powerlaw (2BB+PL hereafter) resulted in a statistically acceptable fit (Fig. 5), with |$\chi ^2_\nu$|/dof (prob.) = 1.13/147 (0.13), and with a PL photon index Γ = 1.75 ± 0.25. In this case, the hydrogen column density remains unconstrained, |${N_{\rm H,20}}<0.3$|, and consistent with zero.
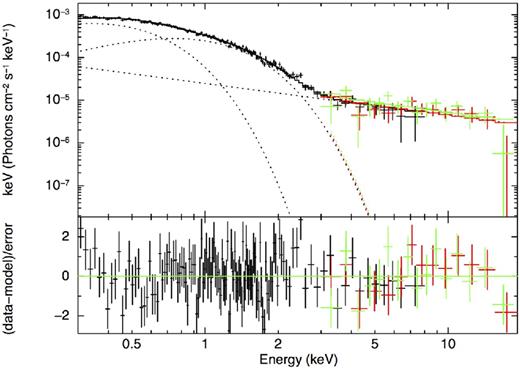
XMM-MOS (black), NuSTAR-FPMA (red) and NuSTAR-FPMB (green) unfolded spectra of J0437 fitted with an absorbed double-blackbody plus PL model. While the fit is statistically acceptable, some structure in the residuals can be seen below 1 keV.
The two multiplicative constants used for the two NuSTAR spectra are consistent with unity: |$c_{\rm FPMA}=1.03{^{+ 0.25}_{- 0.21}}$| and |$c_{\rm FPMB}=1.20{^{+ 0.28}_{- 0.24}}$|. Because of the low S/N, the multiplicative constants have large error bars, but they are none the less consistent with those obtained with the high-S/N data of NuSTAR calibration sources (Madsen et al. 2015). To investigate the possibility that the large value of cFPMB is skewing the results, we performed a fit by fixing the multiplicative constant between FPMA and FPMB to 1.03, the typical value measured with the calibration sources (Madsen et al. 2015); a single free multiplicative constant between XMM and the NuSTAR detectors is still fitted to account for cross-calibration uncertainties between the two observatories. In this exercise,7 the parameters changed by <0.5 per cent, i.e. they are all consistent well within the uncertainties presented in Table 2. This indicates that the results are not skewed by the fitted multiplicative constants.
Phase-averaged spectral analysis of J0437.
| Spectral | NH, 20 | kT1 | Reff, 1 | kT2 | Reff, 2 | kT3 | Reff, 3 | ΓPL | NPLa | |$\chi ^2_\nu$|/dof (n.h.p) | f-test |
|---|---|---|---|---|---|---|---|---|---|---|---|
| model | (eV) | (km) | (eV) | (km) | (eV) | (km) | probabilityb | ||||
| NuSTAR FPMA/B | |||||||||||
| PLc | – | – | – | – | – | – | – | 1.60 ± 0.25 | 1.9|$^{+ 1.3}_{- 0.8}$| | 1.02/27 (0.43) | – |
| XMM-MOS1/2 + NuSTAR FPMA/B | |||||||||||
| 2 BB+PLd | <0.3 | – | – | 120 ± 6 | 0.25|$^{+ 0.03}_{- 0.02}$| | 262 ± 10 | 0.051|$^{+ 0.006}_{- 0.005}$| | 1.75 ± 0.25 | 2.5|$^{+ 1.2}_{- 0.8}$| | 1.14/147 (0.13) | – |
| 3 BB+PLe | <8.9 | 34|$^{+ 54}_{- 14}$| | 11|$^{+ 55}_{- 7}$| | 124|$^{+ 50}_{- 12}$| | 0.24|$^{+ 0.21}_{- 0.13}$| | 270|$^{+ 40}_{- 13}$| | 0.046|$^{+ 0.009}_{- 0.016}$| | 1.65 ± 0.25 | 2.1|$^{+ 1.0}_{- 0.7}$| | 1.04/145 (0.34) | 0.0009 |
| ROSAT-PSPC + XMM-MOS1/2 + NuSTAR FPMA/B | |||||||||||
| 2 BB+PLd | <0.6 | – | – | 111|$^{+ 5}_{- 6}$| | 0.26|$^{+ 0.05}_{- 0.09}$| | 250 ± 7 | 0.056|$^{+ 0.006}_{- 0.005}$| | 2.15|$^{+ 0.55}_{- 0.20}$| | 4.5|$^{+ 4.6}_{- 0.4}$| | 1.38/175 (0.0006) | – |
| 3 BB+PLe | 2.4|$^{+ 1.3}_{- 1.2}$| | 32|$^{+ 7}_{- 5}$| | 11|$^{+ 23}_{- 5}$| | 125|$^{+ 10}_{- 9}$| | 0.25|$^{+ 0.06}_{- 0.04}$| | 271|$^{+ 14}_{- 12}$| | 0.046|$^{+ 0.007}_{- 0.006}$| | 1.65 ± 0.24 | 2.1|$^{+ 0.9}_{- 0.7}$| | 1.02/173 (0.41) | 2× 10⁻¹² |
| 2 Hatm+BB+PLf | 3.3|$^{+ 1.6}_{- 1.3}$| | 27|$^{+ 5}_{- 4}$| | 10–100 | 51 ± 6 | 4.5|$^{+ 2.3}_{- 1.7}$| | 147|$^{+ 11}_{- 8}$| | 0.4 ± 0.1 | 1.50 ± 0.25 | 1.4|$^{+ 0.7}_{- 0.5}$| | 1.00/173 (0.48) | – |
aPL normalization in units of |${10^{-5}}{\rm \,photons\,keV^{-1}{\,{\rm cm^{-2}}}{\,{\rm s^{-1}}}}$|.
bf-test probability of adding an additional thermal component, obtained by comparing the χ2 fit to the fit directly above.
cSpectral model used: phabs×powerlaw.
dSpectral model used: phabs×(blackbody+blackbody+powerlaw).
eSpectral model used: phabs×(blackbody+blackbody+blackbody+powerlaw).
fSpectral model used: phabs×(blackbody+nsatmos+nsatmos+powerlaw). The nsatmos components assumed RNS = 13.5 km and MNS = 1.44 M⊙ (see text).
The Reff values are deduced from the fitted normalization parameters of the nsatmos model.
The temperatures of the two blackbodies obtained with the 2BB+PL model are consistent with those of the two hottest blackbodies in the three blackbody case of Bogdanov (2013). It is important to note that in the present analysis, the 0.1–0.3 keV range, where the coldest thermal component dominates, is excluded due to the lack of calibration of the XMM-MOS detector below |$0.3{\,{\rm keV}}$|.
None the less, adding a third thermal component in the present analysis improved the statistics: |$\chi ^2_\nu$|/dof (prob.) = 1.04/145 (0.34). The f-test gives a probability of 0.0009 of the χ2 improvement happening by chance when adding the thermal blackbody. The temperature of this added component is |${kT_{\rm eff}}=34{^{+ 54}_{- 14}}{\,{\rm eV}}$|, consistent with the value reported previously (Bogdanov 2013) using the MOS data down to |$0.1{\,{\rm keV}}$|. This new fit improves the residuals in the lowest energy bins: 0.3–0.35 keV (Fig. 6), but results in a poorly constrained temperature because of the limited energy range where this cold thermal component dominates. Therefore, this fit indicates that the third thermal component, emitted by the NS surface, likely exists. However, because of the lack of calibration, it is not recommended to include the 0.1–0.3 keV MOS data to better constrain this cold thermal emission and draw any firm conclusions.
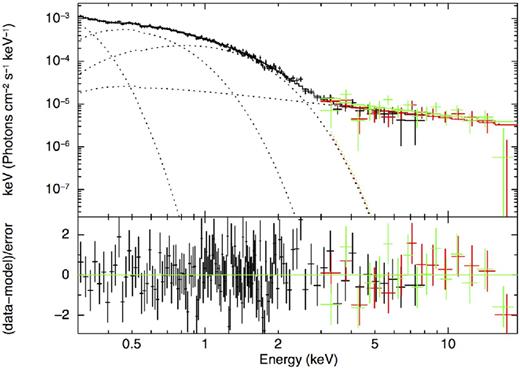
XMM-MOS (black), NuSTAR-FPMA (red) and NuSTAR-FPMB (green) unfolded spectra of J0437 fitted with an absorbed triple-blackbody plus PL model. The addition of a third thermal component improves the fit (f-test probability of 0.0009), and improves the residuals below 1 keV compared to Fig. 5.
To further investigate this, the ROSAT-PSPC data, and its calibrated spectral information down to 0.1 keV, proved a useful addition to the joint spectral analysis presented here. An additional multiplicative constant was added to account for the cross-calibration uncertainties of the ROSAT-PSPC detectors with XMM-MOS and NuSTAR-FPMA/B. The combined ROSAT-PSPC, XMM-MOS and NuSTAR spectra could not be adequately fit by a 2BB+PL model (p ∼ 0.0006, see Table 2). The excess emission in the 0.1–0.3 keV band added by the ROSAT data was not adequately fitted by the two thermal components and was therefore compensated by a soft PL (|$\Gamma =2.15{^{+ 0.55}_{- 0.20}}$|). This in turn left a large excess of counts in the NuSTAR band, causing the observed increase in the χ2 statistic.
However, adding a third thermal component confirmed what was observed with the XMM-MOS and NuSTAR data. Specifically, the 0.1–0.3 keV emission is well fitted by a blackbody with |${kT_{\rm eff}}=32{^{+ 7}_{- 5}}{\,{\rm eV}}$|. Overall, this leads to an acceptable fit statistic |$\chi ^2_\nu$|/dof (prob.) = 1.02/173 (0.41), and without clear structure in residuals (see Fig. 7). Furthermore, while the amount of absorption was unconstrained (upper limit on |${N_{\rm H}}$|) with the XMM-MOS and NuSTAR data, the inclusion of the ROSAT-PSPC spectrum permitted the measurement of the Galactic absorption, |${N_{\rm H,20}}= 2.4{^{+ 1.3}_{- 1.2}}$|, without ambiguity on the rest of the emission, especially at high energy.
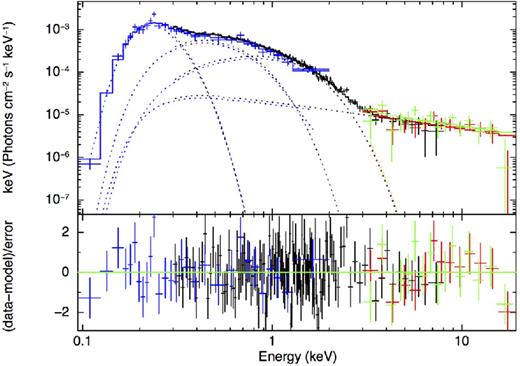
XMM-MOS (black), NuSTAR-FPMA (red), NuSTAR-FPMB (green) and ROSAT-PSPC (blue) unfolded spectra of J0437 fitted with an absorbed triple-blackbody plus PL model. The addition of the ROSAT data permits us to obtain better constraints on the coldest of the three thermal components and on the amount of absorption.
In this spectral analysis, the XMM-pn data were not included, since despite their high S/N, they do not significantly improve the constraints on the thermal components. For example, adding the XMM-pn data to the XMM-MOS and NuSTAR spectra resulted in blackbody temperatures |${kT_{\rm eff}}=117\pm 6{\,{\rm eV}}$| and |${kT_{\rm eff}}=254{^{+ 9}_{- 8}}{\,{\rm eV}}$| when fitting a 2BB+PL model. These values are consistent with the XMM-MOS/NuSTAR spectral fits (see Table 2), but more importantly, the improvements on the statistical uncertainties of the measurements are negligible. Indeed, the timing mode of the XMM-pn data has a limited reliable energy range, and requires an additional cross-correlation coefficient (multiplicative constant) which limits the impact of the additional S/N.
Phase-resolved spectral analysis
Using the phase-folded light curve presented in Section 3, the on-pulse and off-pulse spectra were extracted (see Fig. 1). Because of the limited number of counts in the NuSTAR observations of J0437, the analysis was restricted to just two phase bins. Just as performed for the NuSTAR data alone, a simple PL model was used for the on- and off-pulse spectra, together with a multiplicative constant accounting for cross-calibration uncertainties. For the on-pulse spectra, a PL photon index Γon = 1.6 ± 0.3 was obtained, while the off-pulse photon index was Γoff = 1.5 ± 0.3. Both fits are statistically acceptable (null hypothesis probability of p ∼ 0.2 and p ∼ 0.8, respectively).
The phase-resolved spectral analysis does not reveal a significant change in the PL index, given the count statistics available. Higher S/N data will be necessary to draw any firm conclusions regarding the variation with phase of the high-energy spectral shape of J0437.
DISCUSSION AND CONCLUSIONS
Using the well-measured radio ephemeris of J0437, pulsations were observed with a significance of 3.7σ in a 200 ks NuSTAR observation, despite a spin period small enough to potentially be affected by the NuSTAR clock drift modulated at the satellite orbital period. Under the assumption that the residual clock drift is sinusoidal over an orbit of the satellite, causing a smearing of the pulse profile, we attempted to recover and correct for a sinusoidal clock drift of unknown phase and amplitude. However, no particular pair of phase and amplitude was found to significantly improve the pulse profile. The measured high-energy pulsed fraction of J0437 is 24 ± 6 per cent (2–20 keV). When separated into two energy bands, the pulsations are marginally detected, likely due to the low S/N in each band. The pulse fractions (32 ± 9 per cent in 2–6 keV, and 20 ± 8 per cent in 6–20 keV) show hints of a decrease with energy, although not significantly. However, it is important to keep in mind that the pulsed fractions of MSPs, like J0437, observed with NuSTAR are probably underestimated due to the distortion of the pulse profile by the clock drift. The artificial decrease of the pulse fraction depends on the pulse period and on the magnitude of the clock drift (Fig. 3).
The NuSTAR observation presented here provided the high-energy constraint needed to remove ambiguities in the soft X-ray spectral modelling. The S/N of previously available spectra was too low above |${\sim }3{\,{\rm keV}}$| to fully characterize the high-energy emission. While its presence was confirmed and modelled with a PL in an XMM–Newton observation (Bogdanov 2013), the photon index was poorly constrained which resulted in uncertainties in the modelling of the remainder of the soft X-ray emission. We showed that the NuSTAR observations alone constrained the photon index of the 3–20 keV emission to Γ = 1.60 ± 0.25, firmly excluding PL photon indices of ∼2.5, as sometimes obtained in fits of the XMM–Newton spectra alone (depending on the other spectral components chosen).
With this new high-energy observation, and by comparing the 2BB+PL and 3BB+PL models, we demonstrated that the presence of a third thermal component (|$kT_{\rm BB}=32{^{+ 7}_{- 5}}{\,{\rm eV}}$|) is required by the X-ray emission of J0437. This cold component is thought to be emanate from the entire surface of the NS, while the two hotter thermal components describe the emission from the polar caps of the rotating NS. Such a result is in agreement with the far-UV emission which required an NS surface thermal component, since the UV emission could not be accommodated by the white-dwarf atmosphere emission (Kargaltsev, Pavlov & Romani 2004; Durant et al. 2012). With the 3BB+PL spectral model, we found a PL index of Γ = 1.65 ± 0.24.
NS atmosphere models and their beamed emission patterns offer a more realistic representation of the surface thermal emission of NSs than an isotropically radiating Planck spectrum (e.g. Bogdanov, Rybicki & Grindlay 2007). The three Planckian components were therefore replaced by three realistic NS hydrogen atmosphere models (nsatmos, Heinke et al. 2006). We found an acceptable fit and a PL index Γ = 1.46 ± 0.25, consistent with the 3BB+PL case. However, the coldest nsatmos has a temperature pegged at the lower limit allowed by the model (|$\log (T/{\rm \,K})=5.0$|), preventing us to properly estimate the errors on the surface temperature. The coldest thermal component was replaced by a blackbody component, and we obtained an acceptable fit with a PL index Γ = 1.50 ± 0.25 (see Table 2, for the full set of parameters). Because the high-energy tail of NS atmosphere models has slightly more flux than a Planck spectrum (see for example, Zavlin, Pavlov & Shibanov 1996; Heinke et al. 2006; Haakonsen et al. 2012), the PL index measured is slightly harder than that measured in the 3BB+PL case. However, this change is not significant given the S/N available here.
At |$6{\,{\rm keV}}$|, the hottest blackbody (in the case the 3BB+PL case) is a few orders of magnitude fainter than the PL component (see Fig. 7). However, when nsatmos models are used, the hottest component contributes to ∼0.3 per cent of the flux at |$6{\,{\rm keV}}$| (Fig. 8) since it falls off less steeply than a blackbody component. Therefore, it cannot be excluded that the pulsed emission below |$6{\,{\rm keV}}$| is due, in part, to the thermal emission. However, above |$6{\,{\rm keV}}$|, the pulsed emission is unlikely to originate from the thermal components since its contribution is essentially negligible at 6 keV and above. It is important to keep in mind that the detection significance of the pulsations is marginal when we split the observed photons into low (2–6 keV) and high (6-20 keV) energy bands (see Section 3).
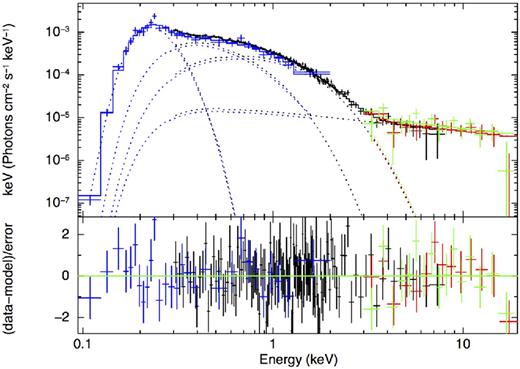
XMM-MOS (black), NuSTAR-FPMA (red), NuSTAR-FPMB (green) and ROSAT-PSPC (blue) unfolded spectra of J0437 fitted with one blackbody, two NS atmosphere nsatmos components and a PL, together with a model for Galactic absorption. Replacing the Planck spectral components of Fig. 7 by nsatmos component does not significantly change the measured PL index, but it increases the contribution of the thermal emission to the flux above |$3{\,{\rm keV}}$|.
Finally, in the phase-resolved spectroscopic analysis of the NuSTAR data, there is no evidence of any significant change in the PL index, most likely due to the low S/N of the spectra obtained when splitting into two phase bins.
When comparing to other non-accreting MSPs,8 the measured PL of J0437 is consistent with that measured for most of them. The MSP PSR J1024−0719 has a photon index Γ = 3.7 ± 0.8 when fitted with a single PL model (Zavlin 2006). However, a model with a hot thermal polar cap plus a PL does not provide a constraint on the PL photon index for that MSP. For the MSP PSR B1937+21, the PL photon index is Γ = 0.9 ± 0.1, and the fit is not significantly improved when adding a thermal component (Ng et al. 2014), providing only an upper limit on the temperature. The MSP PSR J0030+0451 is quite analogous to J0437, and when fitted with two NS atmosphere models plus a PL, the measured photon index is Γ = 2.0 ± 0.2, consistent with that of J0437, given the uncertainties on both measurements. However, if a single thermal component plus PL model, or two blackbodies plus PL model are chosen, the photon index Γ = 3.1 ± 0.1 is not consistent with that of J0437. This indicates that comparing the PL photon indices of these non-accreting MSPs is rather delicate. In the soft X-ray pass band, the available S/N of these sources is generally rather weak, J0437 (the nearest MSP) being the brightest, which leads to poorly constrained spectral parameters. More importantly, the photon index of the PL components depends strongly on the overall spectral model, and it is frequently found for many X-ray faint MSPs that a blackbody, a PL, or the sum of both, fit the soft X-ray data equally well.
The PL photon index that we found for J0437 is consistent with the photon flux detected by Fermi above 0.1 GeV when extending to gamma-ray energies: |$(4.4\pm 0.1)\,{{\times}\, 10^{-8}}{\rm \,photons{\,{\rm cm^{-2}}}{\,{\rm s^{-1}}}}$|. However, this may simply be a coincidence since the gamma-ray emission and the hard X-ray non-thermal emission have different origins. Curvature radiation is responsible for the gamma-ray emission (Cheng, Ho & Ruderman 1986; Romani 1996; Harding et al. 2008; Lyutikov 2013), while the non-thermal X-ray emission may be due to synchrotron radiation from the shock caused by the interaction of the pulsar wind and its companion wind (Arons & Tavani 1993). However, this possibility would be excluded if the likely pulsations of the non-thermal emission above |$>\!6{\,{\rm keV}}$| are confirmed, since synchrotron radiation would not produce pulsed emission. Furthermore, it had been shown that the non-thermal X-ray emission of J0437 is lower than what would be expected from a shock given the binary system orbital properties (Bogdanov, Grindlay & Rybicki 2006b). The proposed alternative interpretation of the non-thermal emission involves electrons and positrons in the pulsar magnetosphere causing the weak Comptonization of the thermal photons (Bogdanov et al. 2006b). This interpretation could explain that the non-thermal emission of J0437 is likely pulsed as observed in this work. However, the existence of such pulsations would depend on the viewing geometry, and on the location from which scattered photons originate. Such information could be extracted from a higher S/N pulse profile at energies above 6 keV where the thermal emission is negligible.
The non-thermal emission characterized in this work confirms what had been observed in a previous work where a PL with Γ = 1.56 matches both the XMM emission |$\lesssim\! 8{\,{\rm keV}}$| and at Fermi energies (fig. 13 of Durant et al. 2012). Furthermore, when extended to UV energies, the PL emission complements the ‘cold’ surface emission to fit the UV emission detected by the Hubble Space Telescope (Durant et al. 2012). The present NuSTAR observation and the measurements of the PL photon index shed light on the broad-band emission of J0437, confirming that the non-thermal emission is likely to extend over many decades of energy. Furthermore, knowledge of the non-thermal emission allowed us to constrain the temperature of the NS cold surface emission as well as the amount of X-ray absorption (described by NH). Therefore, it favours the cut-PL model (with a cut-off at |${\sim } 1.1{\rm \,GeV}$|), rather than a variable PL model (Durant et al. 2012).
Overall, a global understanding of the broad-band emission of J0437, and in particular a clear characterization of its thermal emission, are crucial to extract the mass and radius of the pulsar. J0437 is the key target for observations with NICER, a NASA experiment to be mounted on the International Space Station circa 2017. The modelling of the pulse profiles and of the spectral emission obtained from combining 1 Msec of observations with NICER is expected to produce stringent constraints on the compactness of J0437 (|${M_{\rm NS}}/{R_{\rm NS}}$|). Since the mass of the pulsar is known from radio timing observations, combining the X-ray and radio measurements of MNS and RNS would result in tight constraints in the mass–radius parameter space, and therefore in stringent constraints on the dense matter equation of state (Gendreau et al. 2012). However, such an analysis requires a full understanding of the emission in the NICER passband, i.e. 0.2–10 keV.
It is difficult to estimate quantitatively how this NuSTAR observation will improve the |${M_{\rm NS}}/{R_{\rm NS}}$| measurements that can be derived from currently available XMM data, and from future NICER data. Specifically, it is unclear how the characterization of the non-thermal emission that was performed in this work will affect the modelling of the pulse profile. Nevertheless, in the previous work, the contribution of the non-thermal emission was included as an un-pulsed contribution with a Γ = 1.56 PL spectrum (Bogdanov 2013). While we confirm here that the PL index is consistent with Γ = 1.56, we also demonstrated that the non-thermal emission is probably pulsed, although this requires higher S/N observations to be confirmed with higher certainty. This is particularly important above 6 keV where the hot thermal component is more than two orders of magnitude fainter and therefore does not contribute to the pulsations. Consequently, NuSTAR provides information regarding the likely pulsed behaviour of the non-thermal emission of J0437. While no change in the PL index was detected between the on- and off- pulse parts of the profiles, the varying flux of the non-thermal emission as a function of phase ought to be included in the modelling of the full pulse profile.
Even up to 3 keV (the upper limit of the range available for the currently available XMM-pn data), the PL contributes to the phase-averaged flux (Fig. 8), and therefore contribute to the overall pulsed emission observed in the XMM data. Note that in our best-fitting model with nsatmos thermal components, the PL contribution to the flux becomes larger than that of the hot thermal component at around |${\sim }2.7{\,{\rm keV}}$| (Fig. 8). By neglecting the pulsed emission of the PL, one will attribute more pulsed flux to the thermal components than in reality. As a direct consequence of this, the best-fitting geometry of the model or the measured NS compactness could be biased.
Confirming the existence of the third (coldest) thermal component and measuring the temperature of the surface emission of J0437 is also of great importance to confirm the existence of reheating mechanisms in old NSs. Standard cooling models predict surface temperatures of <104 K after |$10^{9}{\,{\rm yr}}$|. However, evidence of an ∼105 K surface temperature for J0437 despite its characteristic age |$>\!10^{8}{\,{\rm yr}}$| indicates that reheating mechanisms might be at play inside old NSs (for example, rotochemical heating, or frictional heating; see Gonzalez & Reisenegger 2010, for more details). However, this work used a blackbody to fit the coldest thermal component, while a realistic atmosphere model with a range of temperature compatible with T < 105 K should be used. In addition, measurements of the UV fluxes of J0437 (e.g. Durant et al. 2012) can be used to help constrain that coldest thermal component since the Rayleigh–Jeans tail is detected in the UV and Far-UV range (González-Caniulef, Reisenegger & Guillot, in preparation).
In conclusion, future pulse profile and phase resolved spectral modelling of J0437, in particular those of future NICER data, must take into account the likely pulsed non-thermal emission with a photon index of Γ = 1.50 ± 0.25. Ideally, the emission above |${\sim }3{\,{\rm keV}}$| should be divided into more phase bins for a more accurate determination of the non-thermal emission of J0437 as a function of phase. However, this would require higher S/N data, and therefore deeper exposures with NuSTAR.
Acknowledgments
The authors thank the referee, Slavko Bogdanov, for very useful suggestions that significantly improved this paper. This work made use of data from the NuSTAR mission, a project led by the California Institute of Technology, managed by the Jet Propulsion Laboratory, and funded by the National Aeronautics and Space Administration. The data analysis was performed with the NuSTAR Data Analysis Software (nustardas) jointly developed by the ASI Science Data Center (ASDC, Italy) and the California Institute of Technology (USA). SG is a FONDECYT post-doctoral fellow, funded by grant # 3150428. VMK receives support from an NSERC Discovery Grant and Accelerator Supplement, from the Centre de Recherche en Astrophysique du Québec, an R. Howard Webster Foundation Fellowship from the Canadian Institute for Advanced Study, the Canada Research Chairs Program and the Lorne Trottier Chair in Astrophysics and Cosmology. Parts of this research were conducted by the Australian Research Council Centre of Excellence for All-sky Astrophysics (CAASTRO), through project number CE110001020.
See XMM calibration document CAL-SRN-0305 available at http://xmm2.esac.esa.int/docs/documents/CAL-SRN-0305-1-0.ps.gz.
By Anne Archibald, based on Lucas Guillemot's Fermi plugin.
This pulsed fraction estimator is used here for convenient comparison with the work of Bogdanov (2013). Note that there is a possible bias towards higher pulse fraction with this estimator compared to the root-mean-square (RMS) pulsed fraction estimator (An et al. 2015). None the less, for a small number of bins (∼10 bins, as used in the present work), the bias compared to the RMS method appears to be minimal (see fig. 12 of An et al. 2015).
The NuSTAR clock files v050 was used in this analysis.
We performed the same exercise on the NuSTAR data alone (Section 4.1). The PL index was the same, and the PL normalization was 5 per cent larger, but still consistent with that of Table 2.
REFERENCES
APPENDIX A: J0437 EPHEMERIS
We provide in Table A1 of this appendix the parameters of the ephemeris obtained from data collected at the Molonglo Observatory between 2005 March and 2011 February.
Molonglo ephemeris of J0437. 1σ uncertainties on the last digit of each parameters are represented in parentheses.
| Parameter | Value |
|---|---|
| Right ascension α (J2000) | 043 715.896 1749(7) |
| Declination δ (J2000) | −471 509.110 71(1) |
| Proper motion in α (mas yr−1) | 121.428(4) |
| Proper motion in δ (mas yr−1) | −71.473(5) |
| Annual parallax (mas) | 6.28 (11) |
| Pulse period (ms) | 5.757 451 936 712 643(3) |
| Pulse period derivative (10−20) | 5.729 18(1) |
| Orbital period (d) | 5.741 0480(9) |
| Orbital period derivative (10−12) | 3.75(4) |
| Epoch of periastron passage (MJD) | 54 530.1724(3) |
| Projected semimajor axis (s) | 3.366 714 68(5) |
| Orbital eccentricity (10−5) | 1.917 974 290(1) |
| Longitude of periastron (°) | 1.37(2) |
| Periastron advance (° yr−1) | 0.022(4) |
| Longitude of ascension (°) | 207(1) |
| Orbital inclination (°) | 137.55(5) |
| Reference epoch (MJD) | 54 500 |
| MJD Range | 53 431.26–55 619.19 |
