


Abstract
We study the shapes and intrinsic alignments of discs and elliptical galaxies in the MassiveBlack-II (MBII) and Illustris cosmological hydrodynamic simulations, with volumes of (100 h−1 Mpc)3 and (75 h−1 Mpc)3, respectively. We find that simulated disc galaxies are more oblate in shape and more misaligned with the shape of their host dark matter subhalo when compared with ellipticals. The disc major axis is found to be oriented towards the location of nearby elliptical galaxies. We also find that the discs are thinner in MBII and misalignments with dark matter halo orientations are smaller in both discs and ellipticals when compared with Illustris. As a result, the intrinsic alignment correlation functions at fixed mass have a higher amplitude in MBII than in Illustris. Finally, at scales above ∼0.1 h−1 Mpc, the intrinsic alignment two-point correlation functions for disc galaxies in both simulations are consistent with a null detection, unlike those for ellipticals. Despite significant differences in the treatments of hydrodynamics and baryonic physics in the simulations, we find that the wδ + correlation function scales similarly with transverse separation. However, the less massive galaxies show different scale dependence in the ellipticity-direction correlation. This result indicates that, while hydrodynamic simulations are a promising tool to study intrinsic alignments, further study is needed to understand the impact of differences in the implementations of hydrodynamics and baryonic feedback.
1 INTRODUCTION
Weak lensing is a promising cosmological probe that can help in understanding the nature of dark matter, dark energy and modified theories of gravity (Albrecht et al. 2006; Weinberg et al. 2013). Future weak lensing surveys such as the Large Synoptic Survey Telescope1 (LSST Science Collaboration et al. 2009), Euclid2 (Laureijs et al. 2011) and the Wide-Field Infrared Survey Telescope3 (Spergel et al. 2015) should constrain cosmological parameters such as the dark energy equation of state to sub-per cent levels. However, the intrinsic alignment of galaxies, the coherent correlations of the galaxy shapes with each other and with the underlying density field, is a significant astrophysical systematic in weak lensing analysis (Croft & Metzler 2000; Heavens, Refregier & Heymans 2000; Jing 2002; Hirata & Seljak 2004). Ignoring the effects of intrinsic alignments on a weak lensing analysis can bias the estimation of the dark energy equation-of-state parameter. Krause, Eifler & Blazek (2016) find that without marginalizing over intrinsic alignments, this bias in the value of w can be up to ∼80 per cent of its value. Hence, an understanding of intrinsic alignments and their scaling with galaxy mass, luminosity, redshift and morphological type is necessary to develop effective mitigation strategies. Further, studies of intrinsic alignments can also help in understanding the physics of galaxy formation and evolution (Schmidt & Jeong 2012; Chisari & Dvorkin 2013; Schmidt, Chisari & Dvorkin 2015). For reviews of intrinsic alignments, see Troxel & Ishak (2015), Joachimi et al. (2015), Kirk et al. (2015) and Kiessling et al. (2015).
Intrinsic alignments have been studied analytically using the linear alignment model (Hirata & Seljak 2004), extensions that include non-linear contributions (Bridle & King 2007; Blazek, Vlah & Seljak 2015) and the halo model (Schneider & Bridle 2010). N-body simulations have also been used to study IA by stochastically populating haloes with galaxies with a random orientation or by using semi-analytic methods (Heymans et al. 2006; Joachimi et al. 2013). Recently, hydrodynamic simulations of cosmological volumes, such as the MassiveBlack-II (MBII; Khandai et al. 2015), Horizon-AGN (Dubois et al. 2014), EAGLE (Schaye et al. 2015) and Illustris (Genel et al. 2014; Vogelsberger et al. 2014a,b) simulations have emerged as a useful tool to study intrinsic alignments. They enable direct predictions of intrinsic alignments of the stellar component of galaxies using a large statistical sample, including the physics of galaxy formation (Tenneti et al. 2014, 2015; Chisari et al. 2015; Codis et al. 2015; Velliscig et al. 2015a,b). In previous work (Tenneti et al. 2014), we studied the shapes of the stellar component of the galaxies using the MBII cosmological hydrodynamic simulation and compared our results with observational measurements finding good agreement. In a follow-up study (Tenneti et al. 2015), we measured the two-point correlations of the galaxy shapes with the density field and found that the scaling of the correlation function measured in the simulations is consistent with observational results and, on large scales, with predictions of the tidal alignment model.
However, none of these studies have considered morphological divisions of the galaxy sample into discs and ellipticals. There are theoretical and observational motivations for such a split. The galaxies for which intrinsic alignments have been robustly measured in real data (Mandelbaum et al. 2006; Hirata et al. 2007; Okumura, Jing & Li 2009; Joachimi et al. 2011; Heymans et al. 2013; Singh, Mandelbaum & More 2015) are predominantly elliptical galaxies, for which alignments on large scales are well described by the linear alignment model (Blazek, McQuinn & Seljak 2011). Observationally, there has been no significant detection of intrinsic alignment shape correlations for disc galaxies (Hirata et al. 2007; Mandelbaum et al. 2011), except for a hint of a detection for the most luminous blue sample in Hirata et al. (2007) at low significance. Due to the importance of angular momentum in the formation of disc galaxies, their intrinsic alignments are likely described by the quadratic alignment model, for which the shape–density correlation vanishes in the case of a Gaussian density field (Hirata & Seljak 2004). However, in general, due to the non-linear evolution of the density field, we expect a non-zero correlation.
Given the different mechanisms for the alignments of elliptical and disc galaxies, it will be interesting to investigate these differences in a large-volume hydrodynamic simulation. The alignments of disc galaxies have been studied previously using small volume hydrodynamic simulations (e.g. Bailin et al. 2005; Bett et al. 2010; Hahn, Teyssier & Carollo 2010; Deason et al. 2011). The most recent hydrodynamic simulations with cosmological volumes have a resolution high enough to enable dynamical classification of galaxies into discs and ellipticals using a method described in Abadi et al. (2003). Recently, the galaxies in the Illustris simulation (based on a moving mesh code) have been found to have a disc galaxy fraction that compares favourably with observations (Vogelsberger et al. 2014a), so it will be interesting to study the intrinsic alignments of disc galaxies using this simulation. Further, it has been shown that disc galaxies in simulations based on smoothed-particle hydrodynamics (SPH) and moving mesh techniques differ in properties such as disc scale lengths and angular momentum (Torrey et al. 2012). Since MBII is an SPH-based hydrodynamic simulation, we can similarly explore differences in properties such as the disc galaxy fraction, specific angular momentum and alignments. In this paper, we first compare the intrinsic alignments of galaxies in MBII and Illustris for galaxies in a similar stellar mass range. This comparison will show how different implementations of hydrodynamics or baryonic physics, and box size effects, can affect predictions of galaxy intrinsic alignments. We then compare the alignments for galaxy subsamples that have been kinematically classified into discs and ellipticals.
This paper is organized as follows. In Section 2, we describe the details of the MBII and Illustris simulations used in the study. In Section 3, we describe the methods adopted to measure the shapes of galaxies, quantify intrinsic alignments and kinematically classify galaxies. In Section 4, we compare the galaxy shapes in MBII and Illustris and their two-point correlations in a similar stellar mass range. In Section 5, we show the results for galaxy shapes and their intrinsic alignments separately for discs and elliptical galaxies in both simulations. Finally, a summary of our conclusions is given in Section 6.
2 SIMULATIONS
In this study, we use the MBII hydrodynamic simulation and publicly released data from the Illustris simulation (Nelson et al. 2015).
2.1 MBII simulation
MBII is a state-of-the-art high-resolution, large volume, cosmological hydrodynamic simulation of structure formation. This simulation has been performed with p-gadget, which is a hybrid version of the parallel code, gadget2 (Springel, Di Matteo & Hernquist 2005) upgraded to run on Petaflop scale supercomputers. In addition to gravity and SPH, the p-gadget code also includes the physics of multiphase ISM model with star formation (Springel & Hernquist 2003), black hole accretion and feedback (Springel et al. 2005; Di Matteo et al. 2012). Radiative cooling and heating processes are included (as in Katz, Weinberg & Hernquist 1996), as is photoheating due to an imposed ionizing UV background. The black hole accretion and feedback are modelled according to Di Matteo, Springel & Hernquist (2005) based on quasar-mode feedback. Here, a fixed fraction (5 per cent) of the radiative energy release by the accreted gas is assumed to couple thermally to the nearby gas and this is independent of the accretion rate. The details of this simulation can be found in Khandai et al. (2015).
MBII contains Npart = 2 × 17923 dark matter and gas particles in a cubic periodic box of length 100 h−1 Mpc on a side, with a gravitational smoothing length ϵ = 1.85 h−1 kpc in comoving units. A single dark matter particle has a mass mDM = 1.1 × 10⁷ h−1 M⊙ and the initial mass of a gas particle is mgas = 2.2 × 10⁶ h−1 M⊙, with the mass of each star particle being mstar = 1.1 × 10⁶ h−1 M⊙. The cosmological parameters used in the simulation are as follows: amplitude of matter fluctuations σ8 = 0.816, spectral index ηs = 0.96, mass density parameter Ωm = 0.275, cosmological constant density parameter ΩΛ = 0.725, baryon density parameter Ωb = 0.046 and Hubble parameter h = 0.702 as per WMAP7 (Komatsu et al. 2011).
2.2 Illustris simulation
The Illustris simulation is performed with the arepo TreePM-moving-mesh code (Springel 2010) in a box of volume (75 h−1 Mpc)3. The simulation follows 18203 dark matter particles and an approximately equal number of baryonic elements with a gravitational smoothing length of 1.4 comoving kpc for the dark matter particles. The mass of each dark matter particle is 4.41 × 10⁶ h−1 M⊙ and the initial baryonic mass resolution is 8.87 × 10⁵ h−1 M⊙. The galaxy formation physics includes subgrid model for star formation and associated supernova feedback, black hole accretion and feedback. Here, the black hole accretion and feedback are modelled according to quasar-mode feedback at high accretion rates and radio-mode feedback at low accretion rates. In the radio-mode feedback, it is assumed that the accretion periodically produces an AGN jet that inflates hot bubbles in the surrounding gas. When the black hole has increased its mass by a certain fraction, an AGN-driven bubble is created. The accretion rate and current black hole mass determine the duty cycle of bubble injection, energy content and radius of bubbles. This model is different from that of MBII where the radio-mode feedback is absent and the quasar-mode feedback is independent of accretion rate. A detailed description of the models adopted in Illustris can be found in Vogelsberger et al. (2013). The cosmological parameters are as follows: σ8 = 0.809, ηs = 0.963, Ωm = 0.2726, ΩΛ = 0.7274, Ωb = 0.0456 and h = 0.704.
2.3 Galaxy and halo catalogues
In both simulations, halo catalogues are generated using the friends of friends (FoF) halo finder algorithm (Davis et al. 1985). The FoF algorithm identifies haloes on the fly using a linking length of 0.2 times the mean interparticle separation. The subhalo catalogues are generated using the subfind code (Springel et al. 2001) on the halo catalogues. The subhaloes are defined as locally overdense, self-bound particle groups. In this paper, we analyse the shapes of the stellar components in the subhaloes and their two-point correlation functions. Based on convergence tests in Tenneti et al. (2014), we only analyse the measured stellar shapes if there are ≥1000 dark matter and star particles. As a result, we exclude ∼10 per cent (1 per cent) of the galaxies in MBII (Illustris) in the 109–1010 h−1 M⊙ stellar mass bin due to their subhalo masses being low enough that they do not have 1000 dark matter particles. This fraction reduces to <1 per cent in the stellar mass bin from 1010–1011 h−1 M⊙, while no galaxies are discarded for M* > 1011 h− 1 M⊙.
3 METHODS
Here we describe the methods used to measure galaxy shapes, quantify intrinsic alignments and kinematically classify the galaxies into disc and elliptical samples.
3.1 Galaxy shapes
The projected shapes are calculated by projecting the positions of the particles on to the XY plane and modelling the shapes as ellipses.
We note here that without using the iterative scheme, the reduced inertia tensor will lead to shape estimates that are biased to rounder values due to the spherical symmetry imposed by the 1/r2 weighting. This has been discussed in Tenneti et al. (2015); a detailed description of the iterative procedure and further details regarding other definitions of the inertia tensor used to calculate shapes and their impact on intrinsic alignments can also be found there.
3.2 Misalignment angle
3.3 Two-point statistics
The intrinsic alignments of galaxies with the large-scale density field are quantified using the ellipticity-direction (ED) and the projected shape–density (wδ +) correlation functions. The ED correlation quantifies the position angle alignments of galaxies in 3D, while the projected shape correlation function can be used to compare against observational measurements that include the 2D shape of the galaxy.
The matter density field can be represented using either the positions of dark matter particles (in which case the correlation function is denoted by the symbol ωδ) or the positions of subhaloes (in which case it is simply denoted ω). Here, we only use ωδ to eliminate the effect of subhalo bias.
The projected shape correlation functions are computed to directly compare our results from simulations with observations. Here, we follow the notation of Mandelbaum et al. (2006) to define the galaxy-intrinsic shear correlation function, |$\hat{\xi }_{g+}(r_{\rm p},\Pi )$| and the corresponding projected two-point statistic, wδ +. Here, rp is the comoving transverse separation of a pair of galaxies in the XY plane and Π is their separation along the Z direction.
3.4 Bulge-to-disc decomposition
All stars with ϵ > 0.7 are identified as disc stars. We then define the bulge-to-total ratio as BTR = 1 − fϵ > 0.7, where fϵ > 0.7 is the fraction of stars belonging to the disc. In this paper, we classify the galaxies with BTR < 0.7 as disc galaxies and the galaxies with BTR greater than this value as elliptical galaxies. However, we will briefly explore the results of varying this threshold in Section 5.1.
4 GALAXY SHAPES AND ALIGNMENTS IN ILLUSTRIS AND MBII
4.1 Galaxy stellar mass function
Before examining the galaxy shape distributions and alignments in the two simulations, we first present some background about the simulated galaxy samples.
In Fig. 1, we compare the galaxy stellar mass function in MBII and Illustris at z = 0.06. At lower masses, the density of galaxies is higher in MBII, while at higher masses the two simulations are similar. Khandai et al. (2015) compare the galaxy stellar mass function in MBII with observations, noting that MBII overpredicts the mass function at z = 0.06 at both low and high mass. The lower mass overprediction can be resolved by only considering galaxies with a non-zero star formation rate, which suggests a need for a star formation and stellar feedback model with an associated mass-dependent wind (e.g. Oppenheimer & Davé 2008; Okamoto et al. 2010). Vogelsberger et al. (2014a) discuss the stellar mass function of Illustris simulation in greater detail, where they also report a higher galaxy density at the fainter end compared with observations. As shown, both MBII and Illustris contain a reasonably sized galaxy population for the stellar mass range 109.0–12.0 h−1 M⊙. For the rest of this paper, we use this stellar mass range, which is also consistent with our convergence criterion (≥1000 star particles).

Comparison of galaxy stellar mass functions in MBII and Illustris at z = 0.06.
4.2 Shapes and misalignment angles
In this section, we explore the differences in the shapes and orientations of galaxies in MBII and Illustris, focusing on the mass dependence without including a morphological classification. In Fig. 2, we compare the distribution of axis ratios q(b/a) and s(c/a) in Illustris and MBII in two stellar mass bins, 109.0–10.5 h−1 M⊙ and 1010.5–12.0 h−1 M⊙. Both axis ratios (q and s) are larger in Illustris, which means that within the same broad mass range, galaxy shapes are rounder compared to MBII. Further, the shapes are rounder in galaxies of lower mass, consistent with results presented in Tenneti et al. (2014). Table 1 shows the mean axis ratios, 〈q〉 and 〈s〉, within the two stellar mass bins. The mean values of q in Illustris are larger by a factor of ∼12–14 per cent when compared with MBII, while the mean values of s differ by ∼4–11 per cent.
Normalized histograms of axis ratios (left: q, right: s) of the 3D shapes of galaxies in MBII and Illustris in two stellar mass bins: 1010.0 − 11.0 h−1 M⊙ and 1011.0 − 12.0 h−1 M⊙.
Mean axis ratios, 〈q〉 and 〈s〉, for galaxies in Illustris and MBII.
| Illustris | MBII | |||
|---|---|---|---|---|
| M* ( h−1 M⊙) | 〈q〉 | 〈s〉 | 〈q〉 | 〈s〉 |
| 109.0–1010.5 | 0.88 | 0.65 | 0.78 | 0.56 |
| 1010.5–1012.0 | 0.87 | 0.54 | 0.76 | 0.52 |
| Illustris | MBII | |||
|---|---|---|---|---|
| M* ( h−1 M⊙) | 〈q〉 | 〈s〉 | 〈q〉 | 〈s〉 |
| 109.0–1010.5 | 0.88 | 0.65 | 0.78 | 0.56 |
| 1010.5–1012.0 | 0.87 | 0.54 | 0.76 | 0.52 |
We compare the normalized histograms of 3D misalignment angles (equation 4) between the orientations of the galaxy shape and the corresponding dark matter subhalo in Fig. 3. The mass dependence of the misalignment angles is similar in Illustris and MBII, with the galaxies being more misaligned in the lower mass range. However, the galaxy shapes are significantly more misaligned with their host dark matter subhaloes in the Illustris simulation, with the mean misalignment angles differing by ∼50–60 per cent when compared with MBII. The mean misalignment angles in the two stellar mass bins are given in Table 2.
Normalized histograms of the misalignment angles between 3D shapes of galaxies and their host dark matter subhaloes in MBII and Illustris in two stellar mass bins: 109.0–10.5 h−1 M⊙ and 1010.5–12.0 h−1 M⊙.
Mean 3D misalignment angles, 〈θ〉 (deg), between the major axis of galaxies and their host dark matter subhaloes in Illustris and MBII.
| M* ( h−1 M⊙) | Illustris | MBII |
|---|---|---|
| 109.0–1010.5 | 45.04 ± 0| $_{.}^{\circ}$|16 | 31.33 ± 0| $_{.}^{\circ}$|11 |
| 1010.5–1012.0 | 41.51 ± 0| $_{.}^{\circ}$|54 | 26.49 ± 0| $_{.}^{\circ}$|46 |
| M* ( h−1 M⊙) | Illustris | MBII |
|---|---|---|
| 109.0–1010.5 | 45.04 ± 0| $_{.}^{\circ}$|16 | 31.33 ± 0| $_{.}^{\circ}$|11 |
| 1010.5–1012.0 | 41.51 ± 0| $_{.}^{\circ}$|54 | 26.49 ± 0| $_{.}^{\circ}$|46 |
4.3 Two-point statistics
The correlation of galaxy shapes with the density field can be quantified using the two-point statistics, ED and wδ +, defined in Section 3.3. In the top-left panel of Fig. 4, we compare the ED correlation functions in Illustris and MBII in two stellar mass bins, 109.0–10.5 h−1 M⊙ and 1010.5–12.0 h−1 M⊙. Due to the larger misalignment of the stellar shapes in Illustris with their host dark matter subhaloes (shown in Fig. 3), the amplitude of these two-point correlation functions is lower than in MBII for the same stellar mass range. The radial scaling of the ED correlation function is similar for the two simulations in the higher mass bin and increases with mass in MBII. Given that the differences in the mean misalignment angles of Illustris are smaller in between the two mass bins when compared with MBII, the mass dependence of the ED correlation function in Illustris is less significant. In the top-right panel of Fig. 4, we compare the wδ + correlation functions in the same stellar mass bins. The amplitude of wδ + is smaller in Illustris than in MBII for two reasons: the larger misalignment of the stellar shapes with the dark matter subhaloes, and fact that the galaxy shapes are rounder in Illustris. However, the radial scaling and mass dependence is similar to that of MBII. To further understand and quantify the radial scaling of the correlation functions in the two simulations, we plot the ratio of ED and wδ + in Illustris to those of MBII in Fig. 5. Given the similarity of the radial scaling in the highest mass bin for ED and both the mass bins for wδ +, it is possible to fit the ratio of correlation functions in the range 0.1–10 h−1 Mpc to a straight line. In the mass bin, 109.0–10.5 h−1 M⊙, we can see from the figure that the radial scaling of ED is not similar between the two simulations and hence, we do not fit the ratio to a straight line in this mass bin. We find that the ED correlation in Illustris is smaller by a factor of ∼2.4 in the stellar mass bin 1010.5–12.0 h−1 M⊙. Similarly the wδ + correlation function in Illustris is smaller by a factor of ∼2.8 and 3.1 in the lower and higher mass bins, respectively.

Top: ED and projected shape–density (wδ +) correlation functions of the stellar components of galaxies in MBII and Illustris in two stellar mass bins, 109.0–10.5 h−1 M⊙ and 1010.5–12.0 h−1 M⊙. Left: ED; right: wδ +. Bottom: the biases, bωδ and bwδ +, defined as the ratios of the ED and wδ + correlations functions of stellar components to the same correlation function computed using the dark matter subhalo.
![Ratio of ED (left) and projected shape–density [wδ +, (right)] correlation functions of the stellar components of galaxies in MBII and Illustris in two stellar mass bins, 109.0–10.5 h−1 M⊙ and 1010.5–12.0 h−1 M⊙. The horizontal lines represent the best-fitting values obtained after fitting the ratio to a straight line in the range 0.1–10 h−1 Mpc and the line colour indicates the corresponding mass bin.](https://oup.silverchair-cdn.com/oup/backfile/Content_public/Journal/mnras/462/3/10.1093_mnras_stw1823/2/m_stw1823fig5.jpeg?Expires=1750418511&Signature=DEYFMB1DBEO8qUzuhxFEHu1tI7eYaDB04HnDl3JIwG1HOOZXld45UOaSdYKHDW-H5DxDYNZZSEGvW-72Z7o1XYttyL8lFiQ2tHVOK4HhvxrVB6GPAzOuc8y-Ie3AejpzFm60zPslUQHhbiVb8wIISIxw3UvsNQ7cj6ulhBxuZGIw7vH5lZvb4Mey0l2Oe0kLDWFFwhFsG~1qmyU8uZL6mQi4IP8nPQVtYbCDKJiDV6Dqbhy0orjGWmy~KtF4R04i8PGTUlj~JVwwCFvFEPWkJ1MyN1Cgm5DKaLse7SLHHjjo3lYaHFZ3Big9P0IeoIYACR6coNsllIHWQYAT0RjTzQ__&Key-Pair-Id=APKAIE5G5CRDK6RD3PGA)
Ratio of ED (left) and projected shape–density [wδ +, (right)] correlation functions of the stellar components of galaxies in MBII and Illustris in two stellar mass bins, 109.0–10.5 h−1 M⊙ and 1010.5–12.0 h−1 M⊙. The horizontal lines represent the best-fitting values obtained after fitting the ratio to a straight line in the range 0.1–10 h−1 Mpc and the line colour indicates the corresponding mass bin.
In addition to the differences in galaxy shapes and alignments, the effects due to box size for MBII and Illustris should be considered as a possible cause of differences in two-point correlation function amplitude. Since the Illustris simulation has a smaller volume, the correlation function is suppressed due to the absence of large-scale modes (e.g. Bagla & Ray 2005; Power & Knebe 2006) and the dark matter correlation function is smaller in Illustris by as much as ∼20 per cent, with some scale dependence. In order to take this into account, we compute the ratio of the correlation functions of the shapes of the stellar matter with the correlation functions of the shapes of dark matter within the same simulation. This ratio should essentially divide out such box size effects.
In the bottom-left panel of Fig. 4, we compare this ratio for the ED correlation, which we denote bωδ. On small scales, the differences in the amplitude of bωδ in MBII and Illustris are relatively smaller than the differences in the ED correlation itself. However, on large scales, the ED correlation for the shapes of dark matter is similar for MBII and Illustris within the same stellar mass bins, and hence we observe a significantly smaller value of bωδ in Illustris. In the bottom-right panel, we show the bias, bwδ +, which is obtained by normalizing the wδ + for the shapes of stellar component with that of the shapes of dark matter component. There are smaller differences in amplitude when comparing this quantity in Illustris and MBII, especially in the higher stellar mass bin at small scales from ∼10−2 to 1 h−1 Mpc, but there are significant differences in the lower stellar mass bin at all scales. Considering all factors together, we conclude that in addition to box size effects, differences in the distributions of shapes and misalignment angles also lower the amplitude of density–shape correlation functions in Illustris compared to those for comparable samples in MBII.
5 MORPHOLOGICAL CLASSIFICATION IN ILLUSTRIS AND MBII
Here, we present the results of classifying the galaxies in Illustris and MBII into discs and ellipticals using the kinematic bulge-to-disc decomposition. We then compare the shape distributions and two-point intrinsic alignments statistics of discs and elliptical galaxies.
5.1 Fraction of disc galaxies
Using the method described in Section 3.4, we calculated the BTR for each of the simulated galaxies in Illustris and MBII. We note that the threshold adopted to classify galaxies as discs based on the BTR varies across different studies based on simulations. For instance, Vogelsberger et al. (2014a) classify galaxies with BTR < 0.7 as discs while Croft et al. (2009) adopt a threshold of BTR < 0.8. Fig. 6 shows the fraction of galaxies in Illustris and MBII for different thresholds in the bulge-to-total ratio with BTR < 0.7, 0.75 and 0.8.
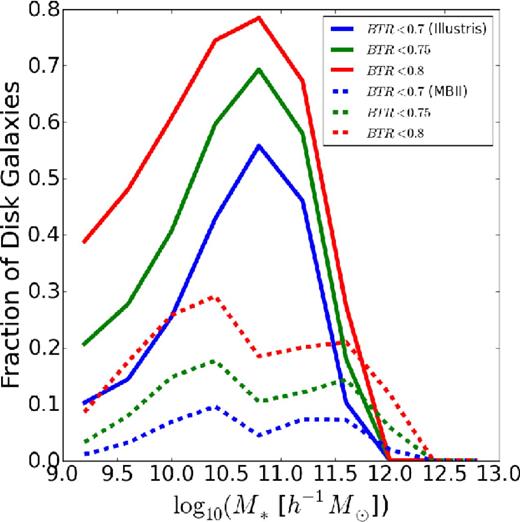
Fraction of galaxies in MBII and Illustris at z = 0.06 for different thresholds of the bulge-to-total ratio: BTR < 0.7, 0.75 and 0.8. Our adopted threshold for the rest of this work is that galaxies with BTR < 0.7 are classified as disc galaxies.
For our adopted threshold of 0.7, the fraction of disc galaxies in Illustris varies from 10–50 per cent in the stellar mass range 109–1012 h−1 M⊙, while it is below 10 per cent for galaxies in MBII. It rises to 20 per cent with a smaller threshold, such as BTR < 0.8. We also note that using a smaller threshold on the BTR can lead to some differences in the distributions of axis ratios and misalignment angles. However, the changes in the two-point statistics are not significant. Hence, in the rest of this paper, we only show results of morphological classification such that galaxies with BTR < 0.7 are classified as disc galaxies and the rest as ellipticals.
To further understand the differences between the properties of discs and elliptical galaxies, we compare their mean specific angular momenta as a function of stellar mass in Fig. 7 . The mean specific angular momenta of discs and elliptical galaxies were found to be consistent with observations in the Illustris simulation (Genel et al. 2015), with discs having a larger specific angular momentum. Here, we observe that the disc galaxies in MBII also have a larger specific angular momentum than ellipticals at lower mass. However, at high stellar mass, the mean specific angular momenta of discs and ellipticals in MBII are very similar. When we change the threshold on BTR to 0.75 or 0.8, the specific angular momentum of disc galaxies decreases ∼10–20 per cent for subhaloes of stellar mass below ∼1010.5 h−1 M⊙ and increases by a similar amount for subhaloes of higher stellar mass.
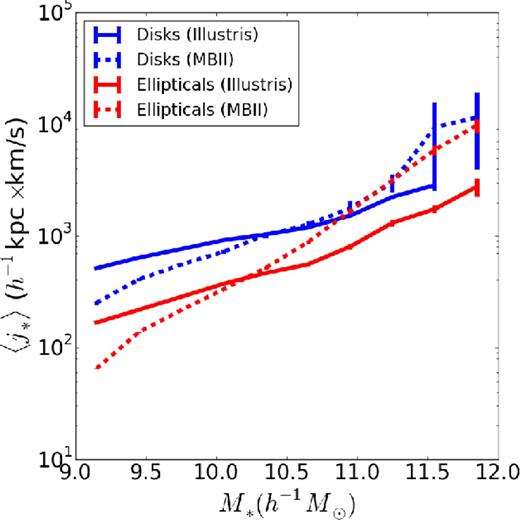
Mean specific angular momentum of discs and elliptical galaxies in MBII and Illustris at z = 0.06.
Comparing the specific angular momentum in MBII and Illustris for fixed galaxy type, we see that it is smaller in MBII at low stellar masses, but higher in MBII at higher stellar mass. It has been shown in Genel et al. (2015) that the radio mode decreases the specific angular momentum by ∼20–50 per cent. Thus, the difference at high stellar mass may be due to the absence of radio mode in the MBII simulation, and also an increase in the number of baryonic particles at higher stellar mass, which can account for the numerical resolution effects which reduce angular momentum in SPH simulations.
We also compared the angle of orientation between the directions of the angular momentum of stellar component with the angular momentum of dark matter component of the subhalo. We found that in both MBII and Illustris, the alignment of the angular momentum of star particles with that of dark matter particles is larger in disc galaxies than ellipticals. This is consistent with the findings of Teklu et al. (2015), who analysed discs and elliptical galaxies in the Magneticum Pathfinder Simulations. Recently, Chisari et al. (2015) analysed the 3D orientations of disc galaxies in the Horizon-AGN simulation with respect to the location of elliptical galaxies at z = 0.5, and found that the orientation of the disc major axis is anticorrelated with the location of ellipticals. We made a similar analysis at z = 0.6 using the disc galaxies in MBII and Illustris with our adopted disc classification. In the left-hand panel of Fig. 8, we plot the ED correlation of the orientation of disc major and minor axis with respect to the location of ellipticals as a function of separation. Comparing with the results of Chisari et al. (2015) as shown on the plot, we observe that unlike the discs in Horizon-AGN, the major axes of disc galaxies in both MBII and Illustris are positively correlated with the location of ellipticals. The minor axes of the disc galaxies are tangentially oriented towards the direction of ellipticals. The direction of the spin or angular momentum of the stellar component of the galaxy is more aligned with the minor axis when compared with the major axes. So, similar to the disc minor axes, the angular momentum of discs is tangentially aligned with respect to ellipticals.
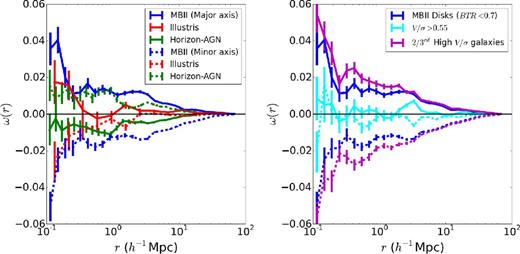
Comparison of the ED correlation of the orientation of disc galaxies with the location of ellipticals in MBII, Illustris and Horizon-AGN simulations (Chisari et al. 2015). In the right-hand panel, the ED correlation in MBII is compared using various definitions of the disc galaxy sample. In both the panels, the solid lines represent the ED correlation of the disc major axes, while the dashed lines represent the correlation of the disc minor axes.
Note that Chisari et al. (2015) used the ratio of mean azimuthal velocity of stars to their velocity dispersion, V/σ and classified all galaxies with V/σ > 0.55 as discs. This threshold is chosen such that 2/3 of their galaxy sample is classified as discs. We verified that our results do not change sign when adopting a different morphological classifies for disc galaxies. In the right-hand panel of Fig. 8, we compare the results in MBII using the galaxies classified as discs using BTR < 0.7 (our adopted selection throughout this work) with two other disc galaxy selection criteria: the galaxies for which V/σ > 0.55, and 2/3 of the sample with the highest V/σ. The results are qualitatively similar with these different definitions, so the difference in sign observed in Horizon-AGN compared with MBII and Illustris is unlikely to arise from differences in morphological classifiers. We conclude that differences in properties of disc galaxies in SPH and Adaptive Mesh Refinement (AMR) simulations and also for different choices of subgrid physics using the same hydrodynamical code should be explored further.
5.2 Shapes and misalignment angles of discs and elliptical galaxies
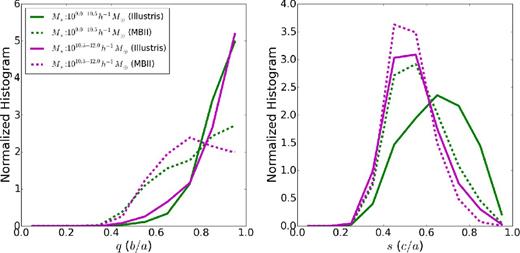
We compare the shapes and misalignment angles of the kinematically classified discs and elliptical galaxies in Illustris and MBII. In Fig. 9, we plot the normalized histograms of the axis ratios, q(b/a) and s(c/a) for galaxies with stellar mass in the range 109–1010.5 h−1 M⊙.
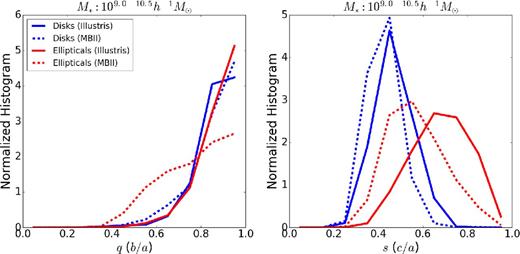
Normalized histogram of the axis ratios (left: q, right: s) of 3D shapes of elliptical and disc galaxies in MBII and Illustris in the stellar mass bin 109–1010.5 h−1 M⊙.
Disc galaxies have larger values of q and smaller values of s than elliptical galaxies in both Illustris and MBII. This reflects the fact that disc galaxies have a more oblate shape than elliptical galaxies. Comparing the axis ratios in Illustris and MBII, we find that elliptical galaxies are rounder in Illustris, consistent with the earlier results when considering mass dependence alone (Section 4.2).
However, the distributions for disc galaxies show that discs in MBII have slightly larger values of q but smaller values of s than in Illustris. This implies that disc galaxies in MBII are thinner (more oblate) compared to those in Illustris. Galaxies in a higher stellar mass bin, 1010.5–1012 h−1 M⊙ (not shown), follow similar trends with respect to axis ratios. The mean axis ratios, 〈q〉 and 〈s〉, for discs and ellipticals in Illustris and MBII for the two stellar mass bins are given in Table 3. Similarly, in the case of projected shapes, the rms ellipticities for disc galaxies in MBII are larger. The rms ellipticities based on a stellar mass threshold are shown in Fig. 10 and compared with observations. Note that when compared to observational measurements, the rms ellipticities are smaller even for disc galaxies in MBII. However, a direct quantitative comparison with observations is difficult due to different methods adopted to measure the observed and simulated galaxy shapes. A detailed discussion on this comparison can be found in Tenneti et al. (2014).
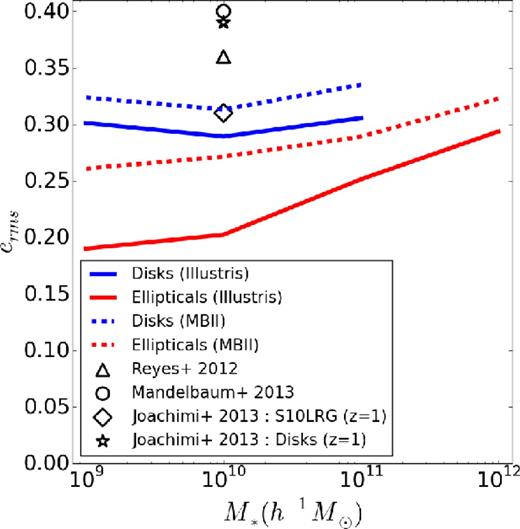
rms ellipticities of the projected shapes of elliptical and disc galaxies in MBII and Illustris based on thresholds in stellar mass.
Mean axis ratios, 〈q〉 and 〈s〉, of discs and elliptical galaxies in Illustris and MBII.
| Illustris | MBII | |||
|---|---|---|---|---|
| M* ( h−1 M⊙) | Discs | Ellipticals | Discs | Ellipticals |
| 〈q〉 | ||||
| 109–1010.5 | 0.87 | 0.88 | 0.86 | 0.77 |
| 1010.5–1012 | 0.90 | 0.84 | 0.91 | 0.75 |
| 〈s〉 | ||||
| 109–1010.5 | 0.47 | 0.68 | 0.42 | 0.57 |
| 1010.5–1012 | 0.47 | 0.61 | 0.43 | 0.53 |
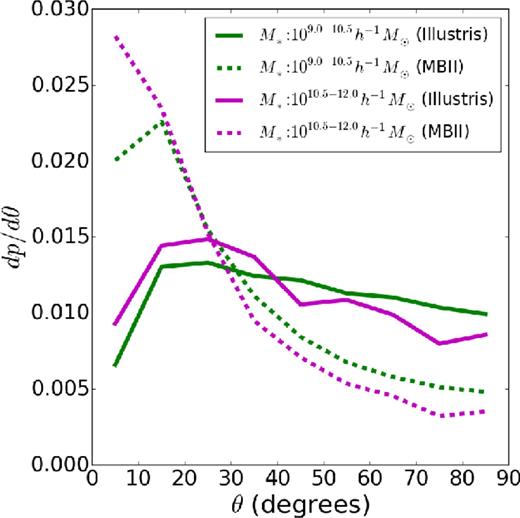
In order to understand the orientation of discs and ellipticals with the shape of their host dark matter subhaloes, we compare the histograms of misalignment angles in Fig. 11. In general, disc galaxies are more misaligned with their host dark matter shapes when compared with elliptical galaxies. The mean misalignment angles are provided in Table 4. Note that discs and ellipticals in the lower mass bin of Illustris, 109–1010.5 h−1 M⊙, have similar histograms of misalignment angles. This may be a mass-dependent effect where misalignments increase as we go to lower masses. If we increase the lower mass threshold of the bin, the histograms are shifted such that discs tend to be more misaligned than ellipticals.
Normalized histogram of the misalignment angles of 3D shapes of elliptical and disc galaxies in MBII and Illustris within two stellar mass bins: 109–10.5 h−1 M⊙ (left) and 1010.5–12 h−1 M⊙ (right).
Mean misalignment angles in 3D, 〈θ〉 (deg), of discs and elliptical galaxies in Illustris and MBII.
| M* ( h−1 M⊙) | Illustris | MBII | ||
|---|---|---|---|---|
| Discs | Ellipticals | Discs | Ellipticals | |
| 109–1010.5 | 44.61 ± 0| $_{.}^{\circ}$|40 | 45.13 ± 0| $_{.}^{\circ}$|18 | 41.42 ± 0| $_{.}^{\circ}$|68 | 31.01 ± 0| $_{.}^{\circ}$|11 |
| 1010.5–1012 | 46.46 ± 0| $_{.}^{\circ}$|74 | 36.68 ± 0| $_{.}^{\circ}$|75 | 36.85 ± 2| $_{.}^{\circ}$|07 | 25.85 ± 0| $_{.}^{\circ}$|47 |
Based on the results shown in this section, we find that the disc and elliptical galaxies in the MBII and Illustris simulations have qualitatively similar shapes and misalignment angle distributions. However, there are differences in the disc fraction and the amplitude of misalignments in the galaxies of the two simulations. This is likely due to the differences in subgrid physics in the two simulations. A detailed study considering the effects of various baryonic feedback implementations in simulations on the galaxy alignments is deferred for future study.
5.3 Two-point intrinsic alignment statistics of discs and elliptical galaxies
Using the measured shapes of discs and elliptical galaxies, we compare the two-point shape correlation functions of disc galaxies with those of ellipticals in both simulations.
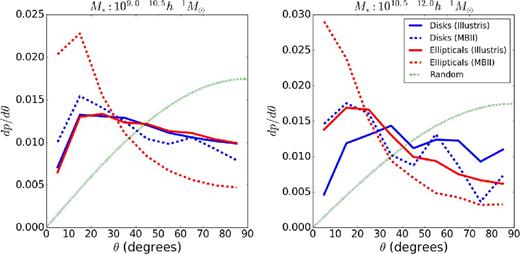
Fig. 12 shows the ED correlation function in two stellar mass bins: 109–1010.5 h−1 M⊙ and 1010.5–1012 h−1 M⊙. As shown, the disc galaxies have a smaller ED correlation function than ellipticals; indeed, the correlation function is consistent with zero for disc galaxies in both simulations and mass bins on scales above ∼100 h−1kpc. Hence, we only show the 1σ upper limits of the signal on these scales, represented by the bottom (tip) of arrows pointing downward in Illustris (↓) and MBII (⇓). The disc versus elliptical difference is due to the larger misalignment of disc galaxy shapes with their host dark matter subhalo shapes. As discussed further below, we find that the ED correlation is similar for the shapes of dark matter subhaloes of discs and ellipticals, while the galaxy misalignment suppresses the correlation. For the same reason, the correlation functions are larger in MBII than in Illustris for all samples.
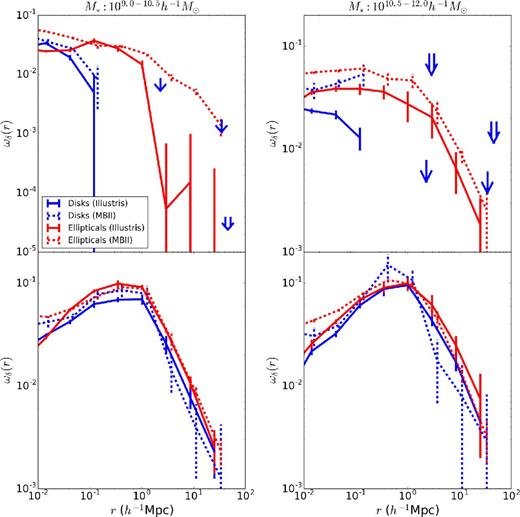
ED correlation functions of the shapes of the stellar component (top panel) and the dark matter component (bottom panel) of elliptical and disc galaxies in MBII and Illustris within two stellar mass bins: 109–1010.5 h−1 M⊙ (left) and 1010.5–1012 h−1 M⊙ (right). In the top panel, we only show the 1σ upper limits of the ED correlation for disc galaxies on scales above 0.1 h−1 Mpc, represented by the bottom (tip) of arrows pointing downward in Illustris (↓) and MBII (⇓). Note the y-axis limits are different in the top-left panel compared to the other panels, which should be taken into account while comparing the figures.
To further understand the differences in the ED correlations of discs and ellipticals, we compare the ED correlations of the dark matter subhaloes of discs and ellipticals in the bottom panels of Fig. 12. In both Illustris and MBII, the ED correlation function of the dark matter subhaloes hosting disc galaxies is significant even on large scales, and has similar radial scaling compared with that of ellipticals. The small differences in amplitude might relate to the slightly different subhalo mass distributions for disc and elliptical galaxies within these mass bins. The strong similarity between the results for subhaloes hosting disc and elliptical galaxies reinforces our conclusion that the suppression in the ED correlation for the stellar components of disc galaxies is largely due to stronger misalignment with the shape of their host dark matter subhalo.
In Fig. 13, we compare the projected shape–density (wδ +) correlation function in the same two stellar mass bins. Similar to the ED correlation, the wδ + for disc galaxies is noisy on scales above 0.1 h−1 Mpc, and only the upper limits of the signal are shown above these scales. However, on smaller scales, the amplitude of wδ + for disc galaxies is larger than that for ellipticals in both simulations, due to the fact that disc galaxies have larger ellipticities than elliptical galaxies.
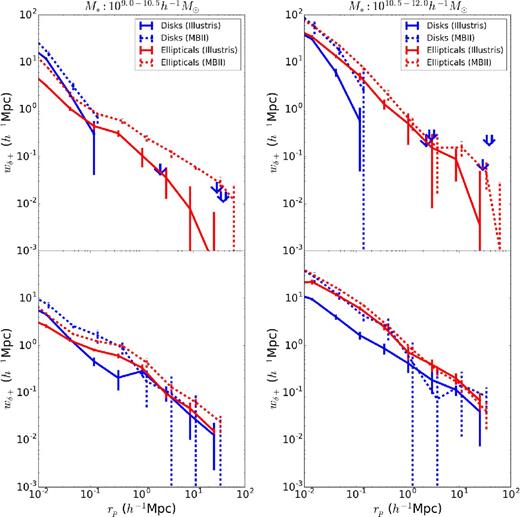
wδ + correlation functions of the shapes of the stellar component (top panel) and the dark matter component (bottom panel) of elliptical and disc galaxies in MBII and Illustris within two stellar mass bins: 109–1010.5 h−1 M⊙ (left) and 1010.5–1012 h−1 M⊙ (right). On scales above 0.1 h−1 Mpc, we only show the 1σ upper limits of the wδ + signal for disc galaxies, represented by the bottom (tip) of arrows pointing downward in Illustris (↓) and MBII (⇓).
These predictions for disc galaxies can be compared against the measurements of Hirata et al. (2007), which has a null detection of wg + for most of their blue galaxy samples, but a weak detection of intrinsic alignments for their most luminous blue galaxy sample, consistent with the amplitude of red galaxy wg + in the same luminosity bin. While the amplitude of wδ + is comparable for discs and ellipticals at small scales around 0.1 h−1 Mpc, we do not detect the signal for discs at scales around 1–10 h−1 Mpc, where the measurements in Hirata et al. (2007) are made. We also note here that Mandelbaum et al. (2011) investigated the intrinsic alignments of blue galaxies from the WiggleZ sample at z ∼ 0.6 and find a null detection for 1–10 h−1 Mpc. However, when considering the stellar mass bin 1011–1012 h−1 M⊙ (not shown), the wδ + for disc galaxies in MBII is higher than for both samples shown in this section, and is comparable in magnitude with the amplitude of the weak signal detected for blue galaxies in Hirata et al. (2007) at scales around ∼1 h−1 Mpc.
6 CONCLUSIONS
In this paper, we studied the shapes and intrinsic alignments of disc and elliptical galaxies in the MBII and Illustris simulations. The galaxy stellar mass function is similar in both the simulations at high-mass range, while at lower stellar masses, MBII has a higher number density of galaxies. We restrict our analysis to stellar masses ranging from 109 to 1012 h−1 M⊙, for which the galaxies have a minimum of 1000 star particles.
We first compared the galaxy shapes and alignments in Illustris and MBII based on stellar mass alone, without considering discs and ellipticals separately. While the two simulations show similar trends in galaxy shapes with stellar mass (rounder at lower stellar mass), the galaxy shape distributions are rounder in Illustris than in MBII at fixed mass. By measuring the orientation of the shape of the stellar component with respect to the major axis of the host dark matter subhalo, we find that both simulations show similar trends with mass, with stronger misalignments at lower mass. However, at fixed mass, galaxies are more misaligned with their host subhalo shapes in the Illustris simulation than in MBII.
Due to the larger misalignment of the galaxy stellar components with the density field, the ED correlation function has a smaller amplitude in Illustris at fixed stellar mass. At around 1 h−1 Mpc, the correlation function is larger in MBII by a factor of ∼1.5–3.5.
Similarly, the amplitude of the projected shape–density correlation function, wδ +, is smaller in Illustris by a factor of ∼1.5–2.0 at transverse separation of 1 h−1 Mpc due to both the larger misalignments and the smaller ellipticities. These differences in the amplitudes of the intrinsic alignment correlation functions are significant even after accounting for the bias in the dark matter correlations due to the smaller volume in Illustris.
We further find that the mass- and scale-dependence of the wδ + two-point statistic is similar in Illustris and MBII, in spite of the different implementations of hydrodynamics and baryonic physics. However, the scale dependence is significantly different in the ED correlation of low-mass galaxies. This can be due to the different implementations of hydrodynamic or differences in baryonic feedback models. We find signs of different physics behind intrinsic alignments of disc galaxies in MBII and Illustris compared to findings from the Horizon-AGN simulation (Chisari et al. 2015), which suggests possible differences in SPH versus AMR simulations that warrant further investigation. Based on our findings, we conclude that hydrodynamic simulations are a promising tool to study intrinsic alignments. For higher mass galaxies, our results suggest that hydrodynamic simulations can be used to generate templates for the scale-dependence of intrinsic alignment two-point correlations for use by upcoming surveys that must remove this effect from weak lensing measurements, provided that the amplitude of the effect is marginalized over (given observational priors). However, further study on understanding the differences in various simulations is needed to confirm the validity of this conclusion at lower mass and to confirm that it applies with greater statistical precision at high mass.
Galaxies in MBII and Illustris are classified into discs and ellipticals by a dynamical bulge–disc decomposition method following the procedure adopted in Scannapieco et al. (2009), resulting in a larger fraction of disc galaxies in Illustris than in MBII at fixed stellar mass. The disc galaxies in both simulations are more oblate than the elliptical galaxies. However, the disc galaxies in MBII are more oblate than those in Illustris.
Comparing the alignments of the disc galaxies with their host dark matter subhaloes, we find that disc galaxies are more misaligned than ellipticals in both MBII and Illustris by ∼20–30 per cent on average. Due to this larger misalignment, the discs have a smaller amplitude of ED correlation when compared with ellipticals (and compared to the ED correlations of their host dark matter subhalo shapes). Indeed, this correlation function is consistent with zero for the disc samples (within our error bars) above ∼100 h−1kpc. However, the disc galaxies also have larger ellipticities, which increases the wδ + correlation on the small scales where it is detected. Thus, the amplitude of wδ + for discs is comparable with that of ellipticals at the same mass for scales below 0.1 h−1 Mpc, while on large scales it is consistent with a null detection. While exploration with larger volume simulations that have more discs and hence lower statistical errors is warranted, our results currently support the commonly made assumption (e.g. Krause et al. 2016) that large-scale intrinsic alignments for early-type galaxies are stronger than those for late-type galaxies. This finding bodes well for future weak lensing surveys that will be dominated by galaxies at z ≳ 0.6, where the disc galaxy fraction is larger than it is at later times.
AT and RM acknowledge the support of NASA ROSES 12-EUCLID12-0004. AT thanks Shy Genel for discussions regarding morphological classification in Illustris. We also thank Elisa Chisari for providing the data to compare with results from Horizon-AGN simulation.
REFERENCES
