-
PDF
- Split View
-
Views
-
Cite
Cite
Claudio Navarro Molina, J. Borissova, M. Catelan, J. Alonso-García, E. Kerins, R. Kurtev, P. W. Lucas, N. Medina, D. Minniti, I. Dékány, Variable stars in the Quintuplet stellar cluster with the VVV survey, Monthly Notices of the Royal Astronomical Society, Volume 462, Issue 2, 21 October 2016, Pages 1180–1191, https://doi.org/10.1093/mnras/stw1613
Close - Share Icon Share
Abstract
The Quintuplet cluster is one of the most massive star clusters in the Milky Way, situated very close to the Galactic Centre. We present a new search for variable stars in the vicinity of the cluster, using the five-year data base of the Vista Variables in the Via Lactea (VVV) ESO Public Survey in the near-infrared. A total of 7586 objects were identified in the zone around 2 arcmin from the cluster centre, using 55 KS-band epochs. 33 stars show KS-band variability, 24 of them being previously undiscovered. Most of the variable stars found are slow/semiregular variables, long-period variables of the Mira type, and OH/IR stars. In addition, a good number of our candidates show variations in a rather short time-scale. We also propose four young stellar object candidates, which could be cluster members.
1 INTRODUCTION
The Galactic Centre (GC) is an exceptional laboratory to test the formation and evolution of stars under extreme conditions. Three massive and young star clusters have been found in this region: Arches, Quintuplet and the central cluster surrounding Sagittarius A*, a supermassive black hole. Each is supposed to contain about 104 stars. Among these, Quintuplet has been known to be rich in massive stars, such as Wolf–Rayet and OB supergiants (Figer, McLean & Morris 1999).
Even though this is a well-studied cluster, not many variability searches have been carried out, and the few available are mostly restricted to bright stars. This could be a consequence of the observational challenges this field poses. The first known variable was the ‘Pistol star’ (Figer et al. 1998), a luminous blue variable (LBV), and one of the brightest stars in the Milky Way; a second LBV was discovered by Geballe, Najarro & Figer (1999). Glass et al. (1999) found several variable candidates brighter than KS = 11, including some large-amplitude asymptotic giant branch variables. Later on, Matsunaga et al. (2009, hereafter MKN09) performed a near-infrared survey of Miras in the GC, which covered the Quintuplet area.
It is clear that a better understanding of the stellar population of this cluster can provide valuable information about the life cycle of stars in the central regions of our Galaxy. The irruption of near-infrared surveys, like the Vista Variables in the Via Lactea ESO Public Survey (VVV; Minniti et al. 2010; Saito et al. 2012), can help us to achieve that goal, due to its multi-epoch and multiband nature. For example, Dékány et al. (2015) recently discovered a young thin stellar disc population across the Galactic bulge, using data from this survey.
In this paper, we analyse KS-band data from the VVV survey around the Quintuplet star cluster, in order to find variable sources that allow us to get more insights about the evolution of stars in the cluster.
1.1 Quintuplet
The Quintuplet cluster (α: 17h46m15s, δ: −28°49′41′; J2000), named after the prominent presence of five bright stars (Nagata et al. 1990; Okuda et al. 1990), is located at a projected distance of about 30 pc from Sgr A*. With an age of 3.0 ± 0.5 Myr (Liermann, Hamann & Oskinova 2012, 2014), and a tidal radius of ≈1 pc (Portegies Zwart et al. 2002), the central part of the cluster presents a flat present-day mass function with a slope of −1.68 (Hußmann et al. 2012), which may be caused by the fast dynamical evolution of the cluster within the strong Galactic tidal field. A similar result has been found for the inner region of Arches (Habibi et al. 2013).
Given that massive clusters in the GC are supposed to dissolve within a few tens of Myr (Portegies Zwart et al. 2002), we expect that these clusters significantly contribute to the isolated massive stars population (Habibi, Stolte & Harfst 2014). Furthermore, Hußmann et al. (2012) determined cluster membership through proper motion analysis. And finally, Stolte et al. (2014) studied the orbital motion of the Quintuplet, and suggested that this cluster and Arches may have a common origin, a situation that we intend to address in a subsequent paper.
2 THE DATA SET
To investigate the cluster area, we used images from the VVV ESO Public Survey (Minniti et al. 2010; Saito et al. 2012). This survey has been carried out with the 4.1 m VISTA telescope at Cerro Paranal, Chile, equipped with the VIRCAM camera, an array of 16 chips, each with a resolution of 2048 × 2048 pixels. VVV covers a total area of 562 deg2, corresponding to the bulge of our Galaxy and a section of the mid-plane. Every single exposure produced is called a pawprint. In order to fill the gaps between the detectors, a pattern of six images with different offsets is required. The combination of all offsets is called a tile. Each tile has a field of 1.6 deg2, meaning that the VVV requires 348 tiles to cover the survey area.
Instead of using the full tile images, we opted to work with the individual stacked pawprints, in order to avoid photometry problems due to a highly variable point spread function (PSF), and mosaicking issues (Alonso-García et al. 2015). For this work we used tile b333, which corresponds to the GC; more specifically, chip 15, which contains the Quintuplet cluster, covering a region of 11.5 arcmin × 11.5 arcmin. From the available epochs, we selected only those with obstatus = ‘Completed’ and QC (quality control) grade = ‘A’, meaning only the best quality images were used. Additionally, epochs with a seeing higher than 1 arcsec (∼3 pixels) were discarded. Since the offset pattern ensures that every region is observed at least twice, we decided to use both sets of images (which we call set A and set B) to compare their photometry (see Section 4.1 for further details). The already mentioned selection criteria reduced the number of epochs to 55 and 56 from sets A and B, respectively, which corresponds to a time interval between 2010 August and 2014 May. Data were reduced, astrometrized and calibrated using the Cambridge Astronomical Survey Unit (CASU) pipeline, version 1.3 (Irwin et al. 2004).
3 PHOTOMETRY
As a first approach, we directly analysed the photometric catalogues from CASU. However, we realized that for our purposes, aperture photometry was not reliable, due to the strong crowding, even in the external zones of the cluster. Thus, we used dophot (Schechter, Mateo & Saha 1993; Alonso-García et al. 2012) to perform PSF photometry of the KS images. Input parameters, like seeing, average sky level, gain and readout noise, were extracted directly from each image header. Details of the observational conditions can be found on the CASU website.1 From the catalogues obtained, only objects with a chi value lower than 3, and a dophot flag of 1 or 7 were kept.2 This selection allows us to keep the best quality objects for each epoch. Additional J and H-band single epochs were reduced in the same way as KS-band images, and allowed us to build a colour–magnitude diagram (CMD) for the cluster region.
3.1 Photometric calibration
dophot catalogues were calibrated by searching for a list of non-variable, isolated stars within the chip field in the aperture photometry catalogues provided by CASU. Only stars with 11 < KS < 15 were selected. With a total of 1280 standard stars, we performed a linear fit and a 5σ clipping in order to get the transformation equations for each epoch. Fig. 1 shows the linear fit for a single epoch. A similar procedure was carried out to calibrate the J and H images. Further details such as the flux-to-magnitude conversion, calibration of zero-points and colour terms, can be found in the ESO website.3
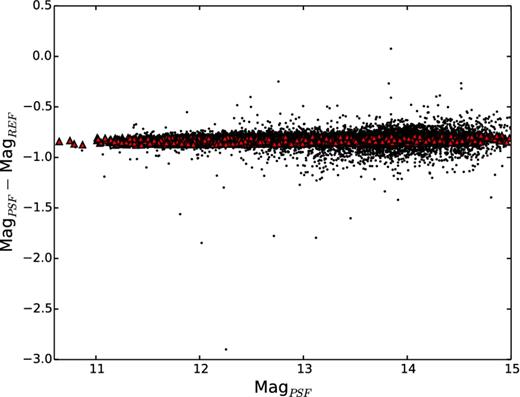
Linear fit performed to obtain the transformation equation for a single epoch. MagPSF are the instrumental magnitudes obtained directly from dophot, while MagREF are the magnitudes of these objects in the CASU catalogues. Small dots correspond to the full sample, while red triangles are the remaining objects after the 5σ clipping.
3.2 Completeness test
In order to derive the photometric completeness, we added artificial stars using the iraf task mkobjects. A total of 600 stars were added to the first epoch image, with KS magnitudes between 11.5 and 16.5, with a uniform luminosity function, meaning that we created 50 stars per each bin of 0.5 mag. Then we checked how many stars we recovered. In addition, we also computed the fraction of stars whose measured magnitude was similar, within a 3σ level, to the original value. This is what we called the accuracy fraction. This procedure was repeated five times with a different spatial distribution, and the same test was carried out for the J band. Results are shown in Fig. 2. Here we can conclude that the photometry is complete and accurate, at the 80 per cent level, for magnitudes up to Ks ≈ 13 and J ≈ 16.5.
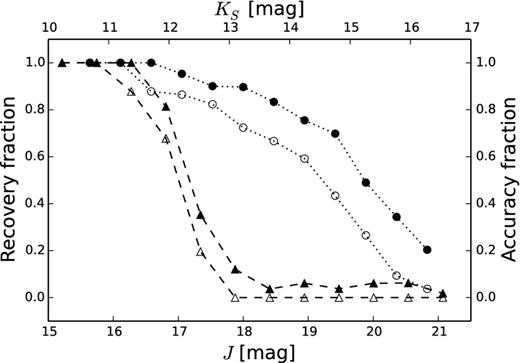
Recovery (full symbols) and accuracy (open symbols) fraction of artificial stars added to the cluster image (see text for details). Circles correspond to the KS-band, while triangles are the results for the J-band. Completeness falls much faster for J band due to the strong reddening.
3.3 DIA
Differential Image Analysis (DIA; Wozniak 2008 and references therein) is a useful technique for variability detection in crowded fields. In this method, a reference image is selected whether as a single epoch from a data set, or as a combination of several images. All other images are transformed to the coordinate system of the also called ‘template’. Then the reference image is convolved by a kernel function, and finally every single epoch of the data set is subtracted from this convolved image (e.g. Alard & Lupton 1998; Alard 2000). Usually the template turns out to be the best seeing image available. However, Huckvale, Kerins & Sale (2014) found that for the particular case of the VVV survey, a better sampled image (i.e. with a poorer seeing) is more suitable as a reference.
DIA was applied to all the epochs available for the same region used with dophot, this is, sets A and B of tile b333, chip 15. Light curves obtained were then analysed using the methods that will be described in the next subsection.
4 RESULTS
4.1 Candidate selection
where ΔMi is the difference between the magnitude on a single epoch, and the expected value, calculated from a linear fit performed to the light curve. σ(Mi) is simply the photometric error, as returned by dophot. This criterion was chosen, instead of the other common variability indexes found in the literature, since we were originally searching for young stellar objects (YSOs) with mostly irregular light curves. Selecting objects with I > 5 allows us to remove variations that are within the photometric errors. This script was performed once for each set available. After keeping light curves with more than 25 epochs, the list of candidates present in both image sets was reduced to 37.
For the second method (Contreras Peña 2015), we calculated the mean amplitude (defined as the difference between the minimum and maximum magnitude) per magnitude bin for our sample. Then we selected targets that were 4σ above the mean (Fig. 3). With this method we found 33 candidates; however, only 15 were found in common between the sets A and B. Of these, 10 candidates were already found using the first criterion.
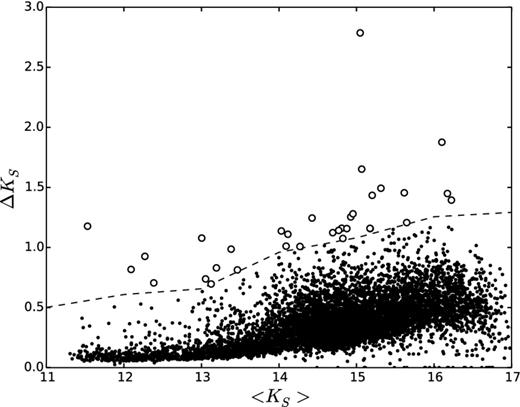
Amplitude versus mean magnitude for all the targets found with dophot. The dashed line corresponds to 4σ above the mean amplitude (see text for details). Selected candidates are represented as open circles.
Since the time difference between two consecutive pawprint observations is less than one minute, meaning a time-scale much shorter than the typical for brightness variations such as we are interested in, we could safely compare the two light curves available per candidate, in order to account for spurious detections due to image artefacts, or problems with the photometry, under the assumption that both curves should be similar, within the photometric uncertainties. After a visual inspection of the light curves, 11 candidates were discarded, mainly due to poor correlation between the pawprints or blending. With this last selection, our final list of candidates found with dophot contained 31 stars.
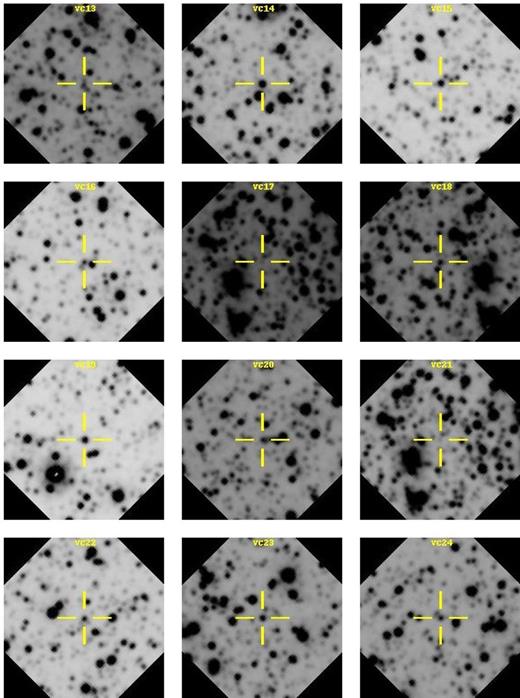
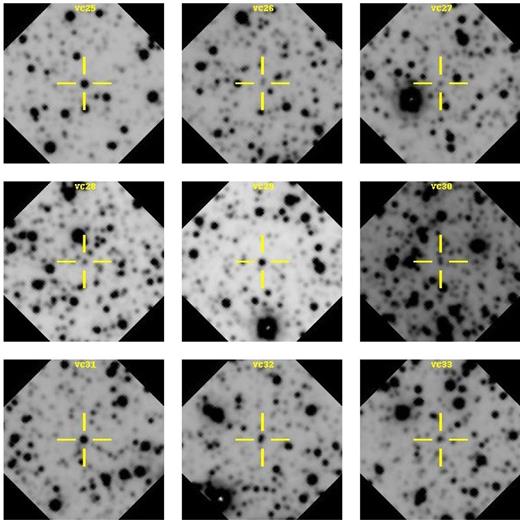
A similar procedure was carried out with the light curves obtained with DIA. We found five objects, however, three of them were already present in the dophot catalogue (VC07, VC17 and VC19). The smaller number of candidates obtained was due to the fact that this version of DIA did not perform optimally in fields with very high levels of crowding, as in the case here. Fig. 4 shows a comparison between the light curves obtained with dophot (triangles) and DIA (open circles) for VC19. Good agreement is generally observed between both techniques (see also Catelan et al. 2013), although for simplicity, we decided to use their dophot light curves for the remaining analysis. With all these selection criteria applied, the final list of candidates was 33. Table 1 contains the main features of these candidates, including their name, coordinates, mean KS magnitude, and ΔKS, plus a single epoch J and H magnitude, and Galactic Legacy Infrared Midplane Survey Extraordinaire (GLIMPSE) [3.6] and [4.5]-band magnitudes, if applicable. Finding charts for all candidates can be found in Appendix. Variables 1 through 31 were found using dophot, while 32 and 33 were obtained with DIA. Fig. 5 contains the light curves for non-periodic candidates.
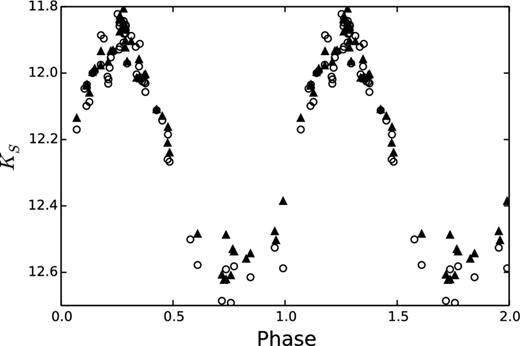
Comparison of light curves obtained with the two techniques used in this paper, DIA (open circles) and dophot (filled triangles), for the variable candidate VC19. A period of 110.9 d was used to construct the phased diagram. Both curves are nearly similar, within typical photometric uncertainties.
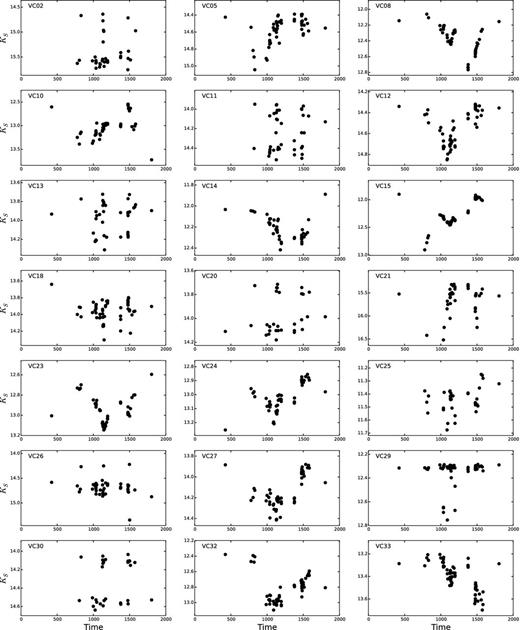
Light curves for non-periodic variable candidates. Time is MJD − 55000 d.
| ID . | RAJ2000 (deg) . | DECJ2000 (deg) . | J . | H . | 〈KS〉 . | [3.6] . | [4.5] . | ΔKS . | P (d) . |
|---|---|---|---|---|---|---|---|---|---|
| VC01 | 266.566 5557 | −28.851 3395 | 17.042 | 14.403 | 0.546 | 560.2 | |||
| VC02 | 266.553 1019 | −28.842 3316 | 17.382 | 15.413 | 1.116 | ||||
| VC03 | 266.554 7296 | −28.836 5616 | 17.701 | 15.282 | 13.182 | 0.86 | 213.3 | ||
| VC04 | 266.548 8075 | −28.833 3713 | 15.994 | 13.522 | 11.861 | 11.127 | 10.361 | 0.498 | 0.942 55 |
| VC05 | 266.538 5634 | −28.822 4738 | 17.469 | 14.572 | 0.655 | ||||
| VC06 | 266.586 6369 | −28.847 3154 | 17.600 | 12.872 | 10.816 | 9.636 | 0.553 | 493.8 | |
| VC07 | 266.539 1027 | −28.821 6129 | 17.510 | 13.927 | 11.576 | 9.482 | 9.171 | 1.193 | 103.1 |
| VC08 | 266.568 0057 | −28.833 1950 | 15.855 | 12.385 | 0.705 | ||||
| VC09 | 266.584 2469 | −28.840 1378 | 17.771 | 13.819 | 11.515 | 10.827 | 0.609 | ||
| VC10 | 266.583 5128 | −28.836 8835 | 15.127 | 12.980 | 11.095 | 10.542 | 1.176 | ||
| VC11 | 266.546 8613 | −28.816 6420 | 16.024 | 14.241 | 0.569 | ||||
| VC12 | 266.572 0312 | −28.823 5543 | 17.220 | 14.548 | 0.532 | ||||
| VC13 | 266.539 2703 | −28.844 3353 | 19.032 | 15.755 | 13.973 | 0.588 | |||
| VC14 | 266.570 1077 | −28.818 9804 | 19.244 | 14.507 | 12.218 | 0.529 | |||
| VC15 | 266.544 4024 | −28.803 8501 | 16.084 | 12.280 | 10.099 | 8.780 | 1.004 | ||
| VC16 | 266.556 5088 | −28.809 7095 | 19.262 | 15.124 | 13.050 | 10.078 | 9.943 | 0.738 | 31.29 |
| VC17 | 266.563 9319 | −28.813 3190 | 15.047 | 7.397 | 6.045 | 2.786 | 567.4 | ||
| VC18 | 266.588 9574 | −28.825 0212 | 16.643 | 13.955 | 12.137 | 11.657 | 0.665 | ||
| VC19 | 266.576 5322 | −28.815 6985 | 15.604 | 12.092 | 10.772 | 9.656 | 0.817 | 110.9 | |
| VC20 | 266.546 8932 | −28.799 8864 | 18.497 | 15.654 | 13.973 | 12.030 | 11.600 | 0.466 | |
| VC21 | 266.588 3325 | −28.821 2281 | 15.647 | 1.207 | |||||
| VC22 | 266.594 5312 | −28.823 1272 | 16.421 | 13.011 | 11.275 | 10.512 | 0.633 | 538.9 | |
| VC23 | 266.561 7898 | −28.804 9052 | 16.928 | 12.954 | 11.724 | 10.554 | 0.55 | ||
| VC24 | 266.591 9313 | −28.819 8884 | 16.641 | 13.02 | 11.594 | 11.021 | 0.398 | ||
| VC25 | 266.589 5737 | −28.811 4513 | 19.066 | 13.930 | 11.446 | 9.664 | 9.001 | 0.427 | |
| VC26 | 266.583 6597 | −28.807 8707 | 19.313 | 16.372 | 14.693 | 1.123 | |||
| VC27 | 266.573 4602 | −28.801 6825 | 16.785 | 14.139 | 0.534 | ||||
| VC28 | 266.586 2002 | −28.808 0830 | 16.869 | 14.226 | 0.642 | 506.9 | |||
| VC29 | 266.576 8727 | −28.8028663 | 16.743 | 14.007 | 12.351 | 11.435 | 11.098 | 0.468 | |
| VC30 | 266.549 8139 | −28.845 7266 | 17.048 | 14.338 | 0.603 | ||||
| VC31 | 266.578 6450 | −28.821 7240 | 15.201 | 12.057 | 10.749 | 10.261 | 0.254 | 525.1 | |
| VC32 | 266.571 9952 | −28.827 6493 | 17.771 | 15.185 | 12.837 | 0.718 | |||
| VC33 | 266.585 9465 | −28.832 3713 | 15.850 | 13.411 | 0.493 |
Some of the variable candidates showed signs of periodicity. In order to estimate the time interval of their variations, we used a generalized Lomb–Scargle periodogram (Scargle 1982), imposing a false-alarm probability cutoff at 1 per cent to help ensure the reliability of the period found. In total, 12 variables had periodicity. Last column of Table 1 displays the periods found, while Fig. 6 shows the corresponding phased light curves.
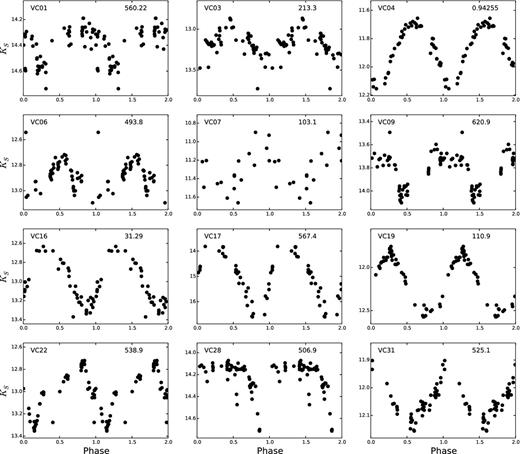
4.2 Colour–magnitude diagram
Objects found within 2 arcmin from the cluster centre were matched with the single epoch photometries in J and H. We noted that only a small fraction of these objects had a J-band measurement, due to the strong reddening present in this field. This was already predicted by the results found in Section 3.2. Hence we decided to utilize the H band to build a reliable CMD. The resulting diagram is shown in Fig. 7. In addition to the CMD, we included a 4 Myr isochrone, comprised by a PARSEC main sequence (MS) (Bressan et al. 2012) and a PISA pre-main sequence (PMS) isochrone, based on the interior model by Tognelli, Prada Moroni & Degl'Inoccenti (2011), for M < 5 M⊙, both transformed into the VISTA photometric system. The isochrones are shifted assuming a distance of 8 kpc (Ghez et al. 2008). A fit of the isochrones to the CMD gives us a reddening value of E(H − KS) = 1.85.
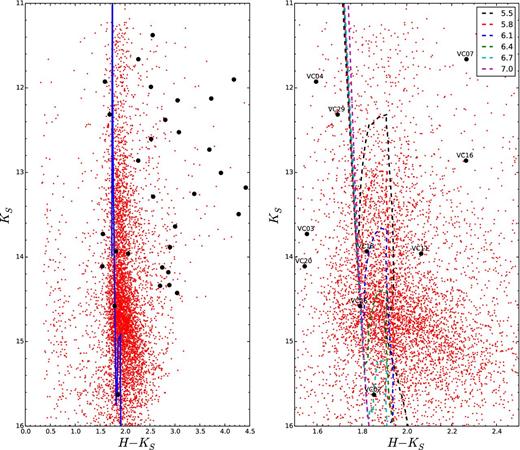
Left-hand panel: CMD for targets within 2 arcmin from Quintuplet centre. The positions of our variable candidates are marked as black circles. A 4 Myr MS isochrone combined with a PMS isochrone is shown as a blue line. Isochrones were shifted assuming a reddening value of E(H − KS) = 1.85. It is important to note that the KS magnitude used for the CMD corresponds to the first epoch, which is where all other single band measurements were carried out. Right-hand panel: PMS tracks overplotted for five different ages, from log (t/yr) = 5.5 to 7.0. labels have been added to the variable candidates in the region to help with their identification. Four candidates lie close to the PMS region, VC02, VC11, VC13 and VC26. All of these might be YSOs, though further research must be carried out to confirm this possibility.
Since we are including a radius twice the size of the cluster, we expect the CMD to be strongly populated with field stars. Moreover, the central region of Quintuplet is heavily contaminated by bright stars, even in the KS band. If we add that stars with KS < 11 will probably be saturated in the VVV images, we can expect that the fraction of cluster stars that are present in our photometric catalogue should not be too large. To prove this, we cross-checked our catalogue with the one found in the proper-motion study by Stolte et al. (2015). Within 1.7 (5 × 0.34) arcsec, we found only 649 matches, of which 108 are likely members, 167 are likely non-members, while the rest remain uncertain. The small number of counterparts is a consequence of the cluster not being fully resolved in the VVV images, while Hubble Space Telescope images used by Stolte et al. (2015) allowed them to resolve the cluster down to its core. When we cross-check with our candidate list, we see that the four variables that are within their covered region, namely VC08, VC12, VC14 and VC32, are present. However, VC32 is likely a non-member, while the other three have an uncertain membership. With this background we conclude that most of our variable candidates, represented as black circles in the CMD, are not cluster members. See Section 5.3 for a more in-depth discussion of the candidates found.
5 DISCUSSION
5.1 Comparison with previous works
As mentioned in Section 1, only a few variability searches have been carried out in Quintuplet. From our sample, nine candidates had been previously discovered. Hence, 24 new variable candidates have been found by this work. The results are summarized in Table 2. The first column contains the name used in this paper. Column 2 includes the number used in the respective catalogue: [MKN09] stands for Matsunaga et al. (2009), and [MFK13] for Matsunaga et al. (2013). Columns 3 and 4 compare periods found by this work and previous papers, respectively, while column 5 delivers the variability type of the candidate.
In Fig. 8, we combined our data with the information available from MKN09 and MFK13. The agreement with the two variables from Matsunaga et al. (2013) is remarkable, with both periods being almost equal. For the Miras of MKN09 we found good agreement, especially for VC19. Additionally, we managed to estimate periods for VC03 and VC31, while MKN09 could not find any. VC03 is worth discussing, since this is the candidate with the most notorious discrepancy with MKN09. We cannot attribute these differences to photometric errors, thus a possible explanation is that the star has undergone changes in the nature of its variability during the past years. As a consequence, we tentatively classify this variable as a slow irregular or semiregular. The other three candidates (VC23, VC25 and VC32) do not show a clear periodicity, even with the combined data, so we also classify them as slow irregular or semiregular variables.
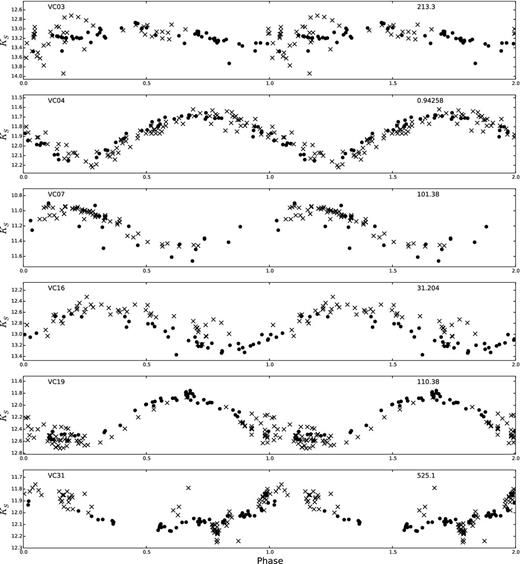
Combination of epochs from VVV (circles) and MKN09, MKF13 (crosses) for six variable candidates. Except by VC03 and VC31, periods were fitted to the combined data, and they are similar to those found individually in Table 2. For those two particular cases, we kept the original period found by this work, since there is no agreement between both data sets.
5.2 GLIMPSE data
Since one of our long-term goals is to detect YSOs, we cross-checked our sample with the magnitudes of GLIMPSE (Benjamin et al. 2003; Churchwell, Babler & Meade 2009), in order to search for infrared excess. The data were obtained from the GLIMPSE Source Catalog (I + II + 3D), directly from the IRSA website.4 The cross-match found magnitudes for 17 of our objects, with a tolerance of 1 arcsec. The resulting colour–colour diagram is shown in Fig. 9. The point in the upper-right corner corresponds to VC17, an extremely red star. This is a peculiar object, with a very large KS amplitude. Unfortunately, it does not appear in our H or J photometry, since at the epoch of these measurements the star was in a faint phase, hence no additional information could be obtained from the CMD. All candidates with a matched GLIMPSE photometry show some degree of infrared excess. Five of these objects have [3.6] − [4.5] > 1, these are VC06, VC15, VC19 and VC23, besides the already mentioned VC17.
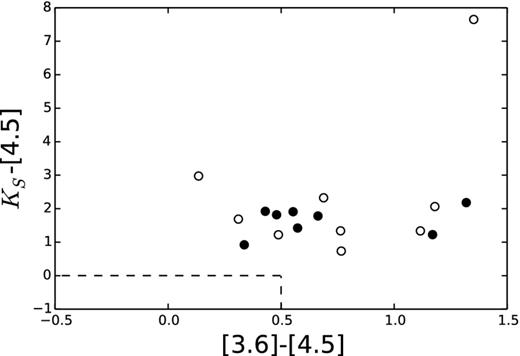
Colour–colour diagram for the variable candidates found within the GLIMPSE data base. Periodic variables are plotted as open circles, while black circles correspond to non-periodic stars. The dashed lines enclose the region of MS stars.
5.3 Analysis of individual candidates
As mentioned in Section 4.2, our variable candidates do not seem to belong to the cluster population. In addition, an analysis of the CMD position and shape of their light curves led us to conclude that the majority of these candidates correspond to long-period variables (LPVs), including Miras and semiregular variables, which are typically oscillating red giants (see e.g. Catelan & Smith 2015). If we take into account the young age of the Quintuplet cluster, we do not expect to find a significant number of red giant members. In addition to the Miras already discovered by MKN09, VC06 and VC17 can be classified as Miras too. For VC01 and VC07, periodicity is not well defined, thus they are classified as semiregular variables.
Other variables like VC05, VC08 and VC12 either have very long periods (over ∼900 d) or are semiregular, meaning they are probably OH/IR stars. A larger time coverage would be required to answer this question. In any case, since these are evolved stars, they are most likely not related to the cluster population.
Given its position on the CMD, VC02 seems a very strong YSO candidate. Located in the PMS branch of the 4 Myr isochrone, its light curve shows some sudden brightness increases, the most important being around ∼1000 d. These episodes are consistent with the bursts in the accretion rate found in PMS stars. If we assume it is a cluster member, the position in the CMD suggests a mass of ∼2 M⊙. Since we lack J band and GLIMPSE photometry for this object, no colour-cut could be performed to classify it. VC13 and VC26 also qualify as YSO candidates, given their positions in the CMD and the shape of the light curves. A similar situation occurs with VC21. Its light curve show strong, irregular bursts that resemble a YSO, and its KS magnitude and position in the field makes us think it is a young Quintuplet member. However, no H or J information is available for that candidate. For all of these objects, spectroscopic follow-up is required to confirm them as YSOs. The case of VC11 is not as clear as for the other candidates discussed. As observed in the right-hand panel of Fig. 7, the object lies too far from the PMS tracks, even from the youngest one. The light curve is classified as that of an irregular variable star.
VC01, VC09, VC22 and VC28 are classified as semiregular variables, since there is a resemblance of periodicity in all of their light curves. The remainder of the non-periodic variables are difficult to classify. Some of them, for example VC15 and VC24, closely resemble classical T-Tauri light curves (see e.g. McGinnis et al. 2015), but are too bright to be YSOs belonging to the cluster. However, they could be PMS field stars.
6 SUMMARY
In this paper, we performed an extensive variability study of the Quintuplet cluster using the five year data base of the VVV ESO Public Survey in the near-infrared.
PSF photometry with dophot has been performed for KS-band images obtained from the VVV survey in the region of the Quintuplet cluster. A total of 7586 objects were identified in the zone around 2 arcmin from the cluster centre. In addition, light curves obtained with DIA were added to our sample.
Two different selection criteria were used to find photometric variation in these objects. After rejecting false positives through visual inspection, and cross-matching objects obtained through dophot and DIA, the final sample was reduced to 31 candidates from dophot and two candidates from DIA.
A single epoch H-band image was used to construct a CMD. An isochrone fitting allowed us to identify three probable PMS cluster members.
A comparison with previous studies shows that nine of our candidates were already found in the literature. Hence, in this research we present 24 new variable stars.
Through analysing the light curve shape, and the period obtained in some cases, we conclude that most of our periodic variable stars are LPVs of the Mira type, and some others OH/IR stars with very long period or slow/semiregular variables. Additional epochs from the final VVV Data Release should help to solve this ambiguity.
VC02, VC13, VC21 and VC26 have light curves and a position in the CMD (with the exception of VC21) that resemble YSOs. The lack of H- or J-band photometry for some of these objects prevents a further analysis without an additional spectroscopic follow-up.
The authors would like to thank the anonymous referee for the helpful comments and suggestions. Support for CNM, JB, JA-G, RK, MC, NM and ID is provided by the Ministry of Economy, Development and Tourism's Millennium Science Initiative, through grant IC120009, awarded to the Millennium Institute of Astrophysics (MAS). CNM is supported by proyecto GEMINI-CONICYT No. 32110004 and ALMA-CONICYT No. 31120015. We gratefully acknowledge additional support by Proyecto Basal PFB-06/2007 and by proyecto FONDECYT Regular #1141141 (MC), and FONDECYT Regular #1130196 (DM). JA-G also acknowledges support from FONDECYT Iniciación 11150916. We finally acknowledge support by CONICYT REDES Project #140042.
Based on observations taken within the ESO VISTA Public Survey VVV, Programme ID 179.B-2002.
A dophot flag of 1 corresponds to the stars with the best photometry; flag 7 means that stars are faint, but photometry is still reliable.
REFERENCES
SUPPORTING INFORMATION
Additional Supporting Information may be found in the online version of this article:
Figure A1.KS-band finding charts for all variable candidates.
Please note: Oxford University Press is not responsible for the content or functionality of any supporting materials supplied by the authors. Any queries (other than missing material) should be directed to the corresponding author for the article.
APPENDIX: FINDING CHARTS
KS-band finding charts for all candidates were obtained from the VSA. VISTA Science Archive, http://horus.roe.ac.uk/vsa/
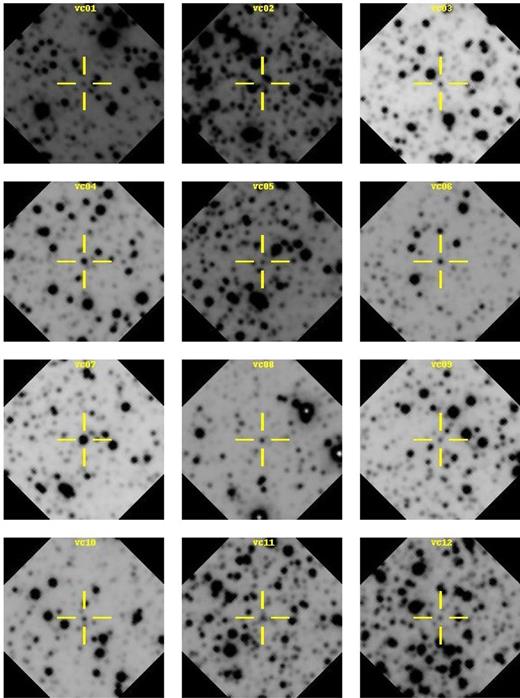
KS-band finding charts for all variable candidates. Each thumbnail is 0.5 arcmin × 0.5 arcmin. Orientation is north up, east left, for all charts.
