


Abstract
We explore the impact of a cosmic ray (CR) background generated by supernova explosions from the first stars on star-forming metal-free gas in a minihalo at z ∼ 25. Starting from cosmological initial conditions, we use the smoothed particle hydrodynamics code gadget-2 to follow gas collapsing under the influence of a CR background up to densities of n = 1012 cm−3, at which point we form sink particles. Using a suite of simulations with two sets of initial conditions and employing a range of CR background models, we follow each simulation for 5000 yr after the first sink forms. CRs both heat and ionize the gas, boosting H2 formation. Additional H2 enhances the cooling efficiency of the gas, allowing it to fulfil the Rees–Ostriker criterion sooner and expediting the collapse, such that each simulation reaches high densities at a different epoch. As it exits the loitering phase, the thermodynamic path of the collapsing gas converges to that seen in the absence of any CR background. By the time the gas approaches sink formation densities, the thermodynamic state of the gas is thus remarkably similar across all simulations. This leads to a robust characteristic mass that is largely independent of the CR background, of order ∼ a few × 10 M⊙ even as the CR background strength varies by five orders of magnitude.
1 INTRODUCTION
Cosmic rays (CRs) have long been known to play an important role in the complex physics and chemistry of the interstellar medium (ISM) in local galaxies (Spitzer & Tomasko 1968; Spitzer & Scott 1969; Glassgold & Langer 1973; Cravens & Dalgarno 1978; Goldsmith & Langer 1978; Mannheim & Schlickeiser 1994; Tielens 2005; recently reviewed by Strong, Moskalenko & Ptuskin 2007; Grenier, Black & Strong 2015). They are an effective source of ionization and heating in various environments, from preheating the primordial intergalactic medium (IGM; Sazonov & Sunyaev 2015), to driving outflows in the diffuse ISM (e.g. Enßlin et al. 2007; Jubelgas et al. 2008; Booth et al. 2013; Hanasz et al. 2013; Salem & Bryan 2014; Salem, Bryan & Hummels 2014), to providing an important (often dominant) source of heating and ionization in deeply embedded gas clouds and protostellar discs (Spitzer 1978; Dalgarno, Yan & Liu 1999; Indriolo, Fields & McCall 2009; Padovani, Galli & Glassgold 2009; Glassgold, Galli & Padovani 2012; Padovani, Hennebelle & Galli 2013; Padovani et al. 2015).
CRs are particularly interesting in the context of Population III (Pop III) star formation, as they provide a continually replenished source of free electrons, enhancing the formation of molecular hydrogen – the only coolant available in primordial gas (Lepp & Shull 1984; Abel et al. 1997; Galli & Palla 1998; Bromm, Coppi & Larson 2002; Glover & Abel 2008). This enhances the ability of the gas to cool, modifying the characteristic density and temperature at which runaway gravitational collapse sets in, and possibly the characteristic mass of the stars thus formed. The characteristic mass of Pop III is critical, as it largely controls the extent to which the first stars influence their environment, determining both their total luminosity and ionizing radiation output (Schaerer 2002), in addition to the details of their eventual demise (Heger et al. 2003; Heger & Woosley 2010; Maeder & Meynet 2012). As such, a thorough understanding of how the very first stars impact subsequent episodes of metal-free star formation – sometimes referred to as Pop III.1 and Pop III.2, respectively (McKee & Tan 2008) – is crucial to developing a comprehensive picture of cosmic evolution.
In the absence of any feedback, pioneering numerical studies suggested that the very first stars were quite massive – on the order of 100 M⊙ (e.g. Bromm, Coppi & Larson 1999; Abel, Bryan & Norman 2002; Yoshida et al. 2003, 2006; Bromm & Larson 2004; O'Shea & Norman 2007). However, more recent simulations, aided by increased resolution, have found that significant fragmentation occurs during the star formation process (Turk, Abel & O'Shea 2009; Stacy, Greif & Bromm 2010; Clark et al. 2011a,b; Greif et al. 2011b, 2012; Stacy & Bromm 2013; Hirano et al. 2014; Hosokawa et al. 2015). While the precise functional form of the Pop III initial mass function (IMF) remains uncertain, the emerging consensus is that these stars were somewhat more massive than stars formed at the present epoch, with a characteristic mass of ∼ a few × 10 M⊙ (Bromm 2013; Greif 2015). Several studies have investigated the impact these stars have on chemical enrichment (Madau, Ferrara & Rees 2001; Mori, Ferrara & Madau 2002; Bromm, Yoshida & Hernquist 2003; Heger et al. 2003; Mackey, Bromm & Hernquist 2003; Umeda & Nomoto 2003; Bromm & Larson 2004; Kitayama & Yoshida 2005; Greif et al. 2007, 2010; Tornatore, Ferrara & Schneider 2007; Wise & Abel 2008; Maio et al. 2011; recently reviewed in Whalen et al. 2008b; Joggerst et al. 2010; Karlsson, Bromm & Bland-Hawthorn 2013) and reionization (Kitayama et al. 2004; Sokasian et al. 2004; Whalen, Abel & Norman 2004; Alvarez, Bromm & Shapiro 2006; Johnson, Greif & Bromm 2007; Robertson et al. 2010), as well as the effects of a Pop III-generated UV background on star formation in neighbouring minihaloes (Shapiro, Iliev & Raga 2004; Iliev, Shapiro & Raga 2005; O'Shea et al. 2005; Susa & Umemura 2006; Susa 2007; Whalen et al. 2008a; Hasegawa, Umemura & Susa 2009; Whalen, Hueckstaedt & McConkie 2010). The impact of high-energy radiation on subsequent Pop III star formation however has been less thoroughly explored.
As Pop III stars form in a predominantly neutral medium, the majority of their ionizing output is absorbed, allowing only radiation less energetic than the Lyman α transition to escape the immediate vicinity of the star-forming halo. While far-ultraviolet radiation in the Lyman–Werner (LW) bands (11.2–13.6 eV) lacks sufficient energy to interact with atomic hydrogen, it can still effectively dissociate molecular hydrogen. Similarly, photons capable of dissociating H− limit the ability of the gas to cool by eliminating the H− channel for producing H2 (Agarwal et al. 2012, 2016). However, studies have found that the expected mean value of such LW radiation is far below the critical flux required to suppress H2 cooling (Dijkstra et al. 2008); moreover, not all LW photons produced escape their host halo to contribute to this background (Schauer et al. 2015). At the high energy end, the neutral hydrogen cross-section for X-rays and cosmic rays is small, allowing them to easily escape their host minihaloes. We recently investigated the impact of a cosmic X-ray background generated by high-mass X-ray binaries on primordial star formation (Hummel et al. 2015); here we focus on the impact of a CR background consisting of particles accelerated in supernova shock waves via the first-order Fermi process (see Section 2).
While the uncertainties involved in estimating the strength of the high-z CR background are quite large, measurements of the 6Li abundance from metal-poor stars in the Galactic halo provide a useful constraint: the observed abundance of 6Li is approximately 1000 times higher than predicted by big bang nucleosynthesis (Asplund et al. 2006), strong evidence for the existence of a CR spallation channel to provide a 6Li bedrock abundance prior to the bulk of star formation (Rollinde, Vangioni & Olive 2005, 2006). Production of this first pervasive CR background by shock-acceleration in Pop III supernovae dovetails nicely with the upper limits this places on the CR energy density at high redshifts (Rollinde et al. 2006).
Early studies of the impact of CRs on primordial star formation focused on the production of ultrahigh-energy CRs (UHECRs) by the decay of ultraheavy X particles (Shchekinov & Vasiliev 2004; Vasiliev & Shchekinov 2006; Ripamonti, Mapelli & Ferrara 2007). With energies above the Greisen–Zatsepin–Kuzmin (GZK) cutoff (Greisen 1966; Zatsepin & Kuz'min 1966), UHECRs interact with the cosmic microwave background (CMB) to produce ionizing photons, which in turn enhance the free electron fraction of the gas. Other work investigated the direct collisional ionization of neutral hydrogen by SN shock-generated CRs, using one-zone models to determine the impact of a CR background on the chemical and thermal evolution of the gas in a minihalo (Jasche, Ciardi & Enßlin 2007; Stacy & Bromm 2007). These studies found that the presence of a CR background enhanced molecular hydrogen formation in the minihalo, cooling the gas and lowering the Jeans mass, and by extension, the characteristic mass of the stars formed. We expand upon these one-zone models, using three-dimensional ab initio cosmological simulations to investigate the impact of a CR background on Pop III stars forming in a minihalo.
This paper is organized as follows. In Section 2 we provide the cosmological context for this study, estimating the expected intensity of the CR background. Our numerical methodology is described in Section 3, while our results are presented in Section 4. Finally, our conclusions are gathered in Section 5. Throughout this paper we adopt a ΛCDM model of hierarchical structure formation, using the following cosmological parameters, consistent with the latest measurements from the Planck Collaboration (Planck Collaboration XIII 2015): ΩΛ = 0.7, Ωm = 0.3, ΩB = 0.04, and H0 = 70 km s−1 Mpc−1.
2 COSMIC RAYS IN THE EARLY UNIVERSE
The value of ϵmin is crucial, as the ionization cross-section of non-relativistic CRs varies roughly as ϵ−1 for ϵ ≳ 105 eV. Higher energy CRs thus travel much farther between interactions and are less able to effectively deposit their energy into the gas, such that the low-energy end of the CR spectrum provides the majority of the ionization and heating. While estimates of the lowest possible energy CR protons could gain in an SN shock wave vary significantly, below 105 eV the velocity of the CR drops below the approximate orbital velocity of electrons in the ground state of atomic hydrogen, and the interaction cross-section diminishes rapidly (Schlickeiser 2002).
We therefore employ ϵmin = 106 eV as the lower bound for the CR background in our simulations. While CRs with energies below 106 eV may account for ∼5–50 per cent of the CR energy budget, they also deposit a substantial fraction of their energy into the IGM (Sazonov & Sunyaev 2015). Consequently, they are unable to efficiently contribute to the build-up of a large-scale CR background. We thus neglect the contribution such CRs make to the ionization and heating of primordial gas. However, this introduces only minor errors, as shown by Stacy & Bromm (2007). Using one-zone models, they found that extending the CR spectrum to as low as ϵmin = 103 eV altered the resulting ionization and heating rates by less than a factor of 2. It should also be noted that the uncertainty in ϵmin is on par with that for the fraction of the SN energy going into CR production, |$f_{\rm \small CR}$|, which is expected to be ∼10–20 per cent (Caprioli & Spitkovsky 2014). Here we assume |$f_{\rm \small CR} = 0.1$|.
The mass fraction of Pop III stars dying as SNe depends strongly on their IMF, and while the complex physical processes at play in gas collapsing from IGM to protostellar densities have so far prevented a definitive answer to this question, the emerging consensus is that the Pop III IMF was somewhat top-heavy with a characteristic mass of ∼ a few × 10 M⊙ (Bromm 2013). Given this, we assume one SN is produced for every 50 M⊙ of stars formed and each SN-producing star dies quickly as a core-collapse explosion with |$E_{\rm \small SN} = 10^{51}\,{\rm erg}$|, 10 per cent of which goes into CR production.
This fiducial estimate for |${u}_{\rm \small CR}(z)$| – henceforth referred to as model u0 – is shown in Fig. 1, where we compare the energy density in CRs to the gas thermal energy density in the IGM, the range of estimates for the IGM magnetic field energy density, and the energy density of the cosmic microwave background. We also mark the most conservative upper limits placed on |${u}_{\rm \small CR}$| by Rollinde et al. (2006), calculated using the observed overabundance of 6Li compared to big bang nucleosynthesis. Given the huge uncertainties inherent in estimating the strength of the high-z CR background, we also consider five additional models with 10, 102, 103, 104, and 105 times the energy density of model u0, as shown in Fig. 1. This allows us to bracket the plausible range of energy densities, from values comparable to the IGM thermal energy density to just below the upper limits from 6Li abundance measurements.
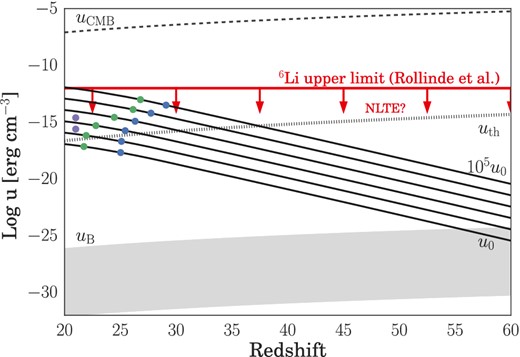
Cosmic ray energy density |${u}_{\rm \small CR}$| as a function of redshift. Our models, from u0 to 105u0 are indicated by solid black lines, while the energy density in the CMB and the thermal energy density in the IGM are denoted by dashed and dotted black lines, respectively. The grey region shows the range of possible values for the magnetic field energy density in the IGM, and the dashed red line marks the most conservative upper limit on the CR energy density from Rollinde et al. (2006), as derived from the 6Li abundance1. Blue points indicate the redshift at which Halo 1 collapses to high densities for a given |${u}_{\rm \small CR}$|; green points, the redshift at which Halo 2 collapses. Finally, purple points denote the energy densities employed by Stacy & Bromm (2007) to study the impact of a CR background using one-zone models calculated at z = 21.
3 NUMERICAL METHODOLOGY
Using the well-tested N-body smoothed particle hydrodynamics (SPH) code gadget-2 (Springel 2005), we perform our simulations using the same chemistry network and sink particle method as described in Hummel et al. (2015); the relevant details are summarized below. In addition to using the same initial conditions as in Hummel et al. (2015) to allow for a comparison of the impact of X-rays versus cosmic rays on the primordial gas, we perform a second suite of simulations using new initial conditions. The minihalo in these simulations collapses at a lower redshift; this allows us to ensure our results are not being influenced by the CMB temperature floor.
3.1 Initial setup
The first set of simulations (henceforth referred to as Halo 1) use the same initial conditions as Hummel et al. (2015) and Stacy et al. (2010), and are initialized at z = 100 in a 140 comoving kpc box with periodic boundary conditions. To accelerate structure formation within the simulation box an artificially enhanced normalization of the power spectrum, σ8 = 1.4, was used, but the simulations are otherwise initialized in accordance with a ΛCDM model of hierarchical structure formation. For a discussion of the validity of this choice, see Stacy et al. (2010). High resolution in these simulations is achieved using a standard hierarchical zoom-in technique, with nested levels of refinement at 40, 30, and 20 kpc (comoving). Using this technique, the highest resolution SPH particles have a mass mSPH = 0.015 M⊙, yielding a minimum mass resolution Mres ≃ 1.5NneighmSPH ≲ 1 M⊙ for the simulation. Here Nneigh = 32 is the number of particles used in the SPH smoothing kernel (Bate & Burkert 1997).
The initial conditions for the second set of simulations (henceforth referred to as Halo 2) are derived from the simulations described in Stacy & Bromm (2013). These simulations were initialized at z = 100 in a 1.4 comoving Mpc box in accordance with the same ΛCDM structure formation model as Halo 1, but with σ8 = 0.9 rather than the artificially enhanced σ8 = 1.4 used in Halo 1. The use of ‘marker sinks’ for regions reaching densities beyond n = 103 cm−3 rather than following the gas to higher densities allows for the efficient identification of the first 10 minihaloes to form within the box; we select the final minihalo to form – i.e. Minihalo 10 from Stacy & Bromm (2013) – for further study. After identifying the location of the final minihalo, the cosmological box is re-initialized at z = 100 using a standard zoom-in technique with two nested levels of refinement used to improve resolution surrounding the selected minihalo. Each ‘parent’ particle within the most refined region is split into 64 ‘child’ particles, with a minimum mass of mgas = 1.85 M⊙ and |$m_{\rm \small DM}=12\,{\rm M}_{{\odot }}$|. These refined simulations are then run until the gas approaches the typical onset of runaway collapse at n = 104 cm−3.
3.1.1 Halo 2 cut-out and refinement
Once the simulation reaches 104 cm−3 all particles beyond 10 comoving kpc from the centre of the collapsing minihalo are removed to conserve computational resources. To achieve a maximum resolution comparable to Halo 1, all particles within the 10 comoving kpc volume are split into two child particles placed randomly within the smoothing kernel of the parent particle. This particle-splitting is repeated twice more; all particles within 8 comoving kpc are replaced by eight child particles; within 6 comoving kpc, each of these child particles is split into an additional 8 for a total of 128 child particles in the most refined region. At each step, the mass of the parent particle is evenly divided among the child particles and the smoothing length is set to |$h N_{\rm new}^{-1/3}$|, where h is the smoothing length of the parent and Nnew is the number of child particles created. All particles inherit the same entropy, velocity, and chemical abundances as their parent, ensuring conservation of mass, internal energy, and momentum.
While our cut-out technique leads to a rarefaction wave propagating inward from the suddenly introduced vacuum boundary condition, the average sound speed at the edge of the most refined region is ∼1 km s−1. As a result the wave only travels ∼0.5 pc over the remaining 400 000 yr of the simulation, a negligible fraction of the ∼350 pc physical box size.
3.2 Chemistry and thermodynamics
We employ the chemistry network described in detail by Greif et al. (2009), which follows the abundance evolution of H, H+, H−, H2, |$\mathrm{H}_2^+$|, He, He+, He++, D, D+, HD and e−. All relevant cooling mechanisms are accounted for, including H and He collisional excitation and ionization, recombination, bremsstrahlung and inverse Compton scattering.
In order to properly model the chemical evolution at high densities, H2 cooling induced by collisions with H and He atoms and other H2 molecules is also included. Three-body reactions involving H2 become important above n ≳ 108 cm−3; we employ the intermediate rate from Palla, Salpeter & Stahler (1983), but see Turk et al. (2011) for a discussion of the uncertainty of these rates. In addition, the efficiency of H2 cooling is reduced above ∼109 cm−3 as the ro-vibrational lines of H2 become optically thick above this density. To account for this we employ the Sobolev approximation together with an escape probability formalism (see Yoshida et al. 2006; Greif et al. 2011b for details).
3.3 Cosmic ray ionization and heating
Here we assume the incident CR background is composed solely of protons, and all interactions occur with hydrogen only. While this neglects the slight difference in average CR energy loss per interaction for hydrogen (36 eV; Bakker & Segrè 1951) as compared to helium (40 eV; Weiss & Bernstein 1956), the resulting error in the employed heating and ionization rates is sufficiently small for our purposes (see Jasche et al. 2007 for a more rigorous treatment).
The resulting heating and ionization rates for both the |${u}_{\rm \small CR}=u_0$| and 105 u0 cases are shown in Fig. 2, along with the expected rates in the absence of attenuation. Also shown are the highest and lowest X-ray heating and ionization rates considered in Hummel et al. (2015). Compared to X-rays, CRs produce significantly less heating per ionization event and penetrate to much higher densities before being attenuated; the X-ray heating and ionization rates fall off much faster as the gas becomes optically thick.
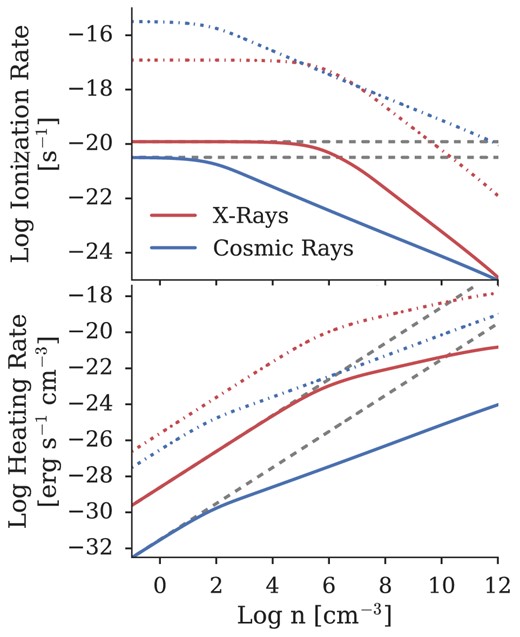
Ionization and heating rates as a function of total gas number density for both a cosmic ray and an X-ray background at z = 25. In both panels, the solid blue lines denote the rate for our fiducial CR background, u0. The solid red lines show the fiducial X-ray rates from Hummel et al. (2015), while the dashed grey lines demonstrate the expected rates in the absence of gas self-shielding. The dash–dotted blue (red) lines mark the highest intensity CR (X-ray) heating and ionization rates investigated. For a given energy density, CRs are more effective at ionizing and heating the gas; vertical placement on this chart is simply a matter of normalization, stemming from the assumptions outlined in Section 2. Note that X-rays cause significantly more heating per ionization event than CRs, but are strongly attenuated at high densities. CRs are significantly more penetrative in comparison.
3.4 Sink particles
4 RESULTS
4.1 Initial collapse
4.1.1 CR-enhanced H2 cooling
The gas in both Halo 1 and Halo 2 invariably collapses to high densities, even as we vary the CR background strength by five orders of magnitude. As seen in Fig. 3, the collapse occurs in accordance with the standard picture of Pop III star formation (e.g. Greif et al. 2012; Stacy & Bromm 2013; Hirano et al. 2014; Hosokawa et al. 2015), albeit slightly modified by the presence of a CR background. In each case, the gas heats adiabatically as it collapses until reaching ∼103 K, at which point H2 cooling is activated. This allows the gas to cool to ∼200 K, whereupon it enters a ‘loitering’ phase (Bromm et al. 2002), increasing in density quasi-hydrostatically until sufficient mass accumulates to trigger the Jeans instability, typically between 104 cm−3 and 106 cm−3. Runaway collapse then proceeds until three-body reactions become important at n ∼ 108 cm−3; this turns the gas fully molecular by n ∼ 1012 cm−3, at which point we insert sink particles.
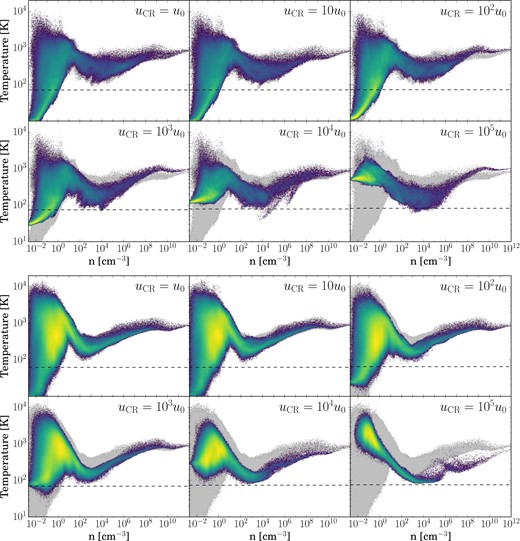
Mass-weighted temperature-density distribution of the gas collapsing into Halo 1 (top) and Halo 2 (bottom), shown just prior to sink formation. Each panel shows the behaviour of gas collapsing under a CR background of a given strength. In each case, the behaviour of the gas in the |${u}_{\rm \small CR}=0$| case is reproduced for comparison (light grey); dashed lines denote the CMB temperature when collapse occurs. Gas at low densities gets progressively hotter and gas in the loitering phase gets progressively cooler with increasing |${u}_{\rm \small CR}$|. Note that the gas invariably proceeds to collapse, and converges towards a similar thermodynamic path as it approaches sink formation densities, regardless of the CR background strength.
As demonstrated in Fig. 4, increasing |${u}_{\rm \small CR}$| both heats the gas and boosts the resulting ionization fraction. This in turn increases the efficiency of H2 formation, enhancing cooling and allowing gas in the loitering phase to reach progressively lower temperatures. In fact, the additional cooling is sufficient to cool the gas all the way to the CMB floor when |${u}_{\rm \small CR}\gtrsim 10^4\,u_0$|. However as the gas exits the loitering phase and proceeds to higher densities, the CR optical depth increases significantly. In concert with the onset of three-body processes this renders CR ionization and heating ineffective at high densities. As a result, the thermal behaviour of the gas increasingly resembles that seen in the |${u}_{\rm \small CR}=0$| case as the collapse proceeds. To wit, by the time we form sink particles at 1012 cm−3 the thermodynamic state of the gas is remarkably similar, even as we vary the CR background strength by five orders of magnitude. This convergence under a wide range of environmental conditions is similar to that seen in the presence of both an X-ray background (Hummel et al. 2015) and DM–baryon streaming (Greif et al. 2011a; Stacy, Bromm & Loeb 2011).
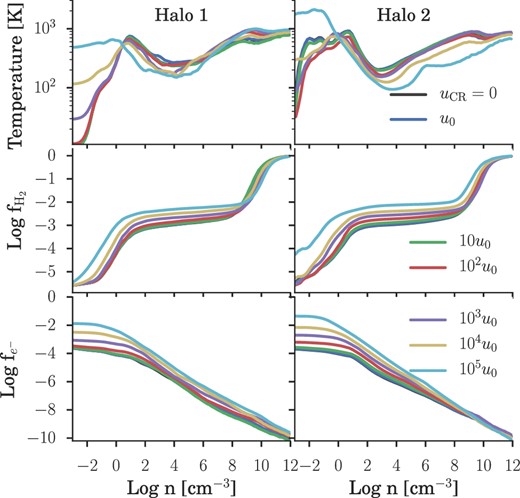
From top to bottom, density-binned average gas temperature, H2 fraction, and free electron fraction for both Halo 1 (left) and Halo 2 (right). As |${u}_{\rm \small CR}$| increases, the additional ionization increases f|$_{e^-}$|, which in turn elevates fH2. Combined with the additional heating provided by the CR background, this allows H2 cooling to activate at slightly lower densities and gas in the loitering phase to reach slightly lower temperatures, as seen in the top panel.
4.1.2 Expedited collapse
Boosting the H2 fraction in the gas lowers the density threshold for efficient cooling, allowing the gas to fulfil the Rees–Ostriker criterion sooner by driving the cooling time |$t_{\rm \small cool}$| below the freefall time |$t_{\rm \small ff}$| (Rees & Ostriker 1977). This is demonstrated in Fig. 4, where we see the density at which the gas begins to cool drop as the CR background strength increases. This necessarily expedites the subsequent phases of the collapse, as seen clearly in Fig. 5, where we show the total gas mass within 1 pc (physical) of the minihalo's centre as a function of redshift. The impact this has on the environment in which the minihalo collapses is seen in Fig. 6 , where we show the final simulation output on various scales for Halo 1 and Halo 2, both in the absence of any CR background (|${u}_{\rm \small CR}=0$|) and with |${u}_{\rm \small CR}=10^5\,u_0$|. Low density filamentary gas is heated and prevented from collapsing, reducing the clumping of the IGM and possibly impacting the early stages of reionization. Gas above a |${u}_{\rm \small CR}$|-dependent density threshold on the other hand experiences enhanced cooling and is thus able to collapse to high densities at an earlier epoch. As a result, the dynamical environment in which the first sink particles form varies significantly depending on the strength of the CR background.
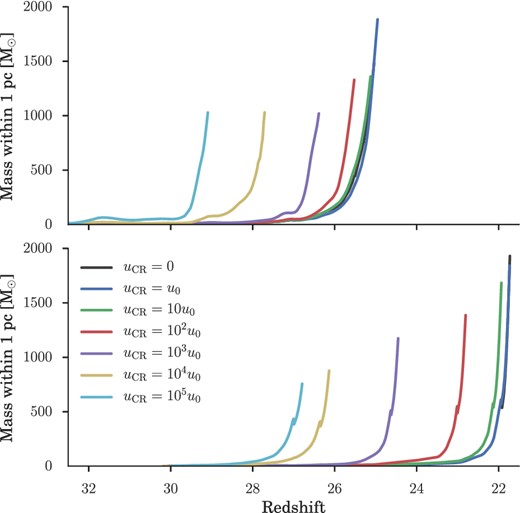
Total gas mass within 1 pc of the highest density point in each simulation over cosmic time. Top: Halo 1; bottom: Halo 2. As |${u}_{\rm \small CR}$| increases, the additional heating and ionization allows the gas to fulfil the Rees–Ostriker criterion (tcool ≲ tff) sooner, expediting collapse to high densities. The sooner runaway collapse sets in, the less time gas has to accumulate in the centre of the minihalo, resulting in a lower total mass within 1 pc at simulation's end. The discontinuity seen in the growth of Halo 2 is a numerical artefact arising from the cut-out and refinement process.
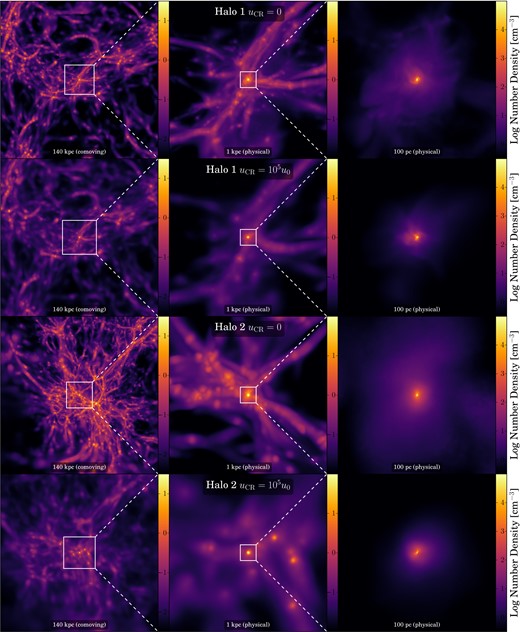
Simulation structure for both Halo 1 (top) and Halo 2 (bottom) as seen in the final output, 5000 yr after the first sink forms. Shown is a density projection of the minihalo environment on progressively smaller scales for both the |${u}_{\rm \small CR}=0$| and |${u}_{\rm \small CR}=10^5\,u_0$| simulations, as labelled. White boxes indicate the region depicted on the next smaller scale. From left to right: filamentary structure of the cosmic web near the minihalo formation site; minihalo formation at the intersection of several filaments; morphology within the ∼100 pc virial radius of the minihalo. The density scale for each level is shown just to the right – note that the scaling changes from panel to panel. Note how the gas in the |${u}_{\rm \small CR}=10^5\,u_0$| simulations appears smoothed out compared to the |${u}_{\rm \small CR}=0$| simulations. Not only do CRs heat and smooth the filamentary gas, the expedited collapse induced by CR ionization leaves less time for low-density structure to form, since the collapse is shifted to an earlier epoch. As a result, the dynamical environment in which the sink particles form varies significantly between simulations.
4.2 Star formation
4.2.1 Protostellar fragmentation and growth
Fig. 7 shows the growth over time of all sink particles formed in our simulations, from formation of the first sink particle to simulation's end 5000 yr later when radiative feedback can no longer be ignored. The first sink particle forms when the gas in the centre of the minihalo reaches densities of 1012 cm−3, and develops an accretion disc within a few hundred years. In all but three cases, this disc quickly fragments, forming a binary or small multiple within 500 yr. Sinks that survive longer than a few hundred years without undergoing a merger quickly accrete the surrounding gas, growing to ∼a few solar masses within 500 yr and typically reaching between 10 and 40 M⊙ by simulation's end.

Growth of individual sink particles in each simulation over time, with the first sink forming at t = 0. Lines end where one sink is accreted by another. The Halo 1 simulations are shown in the left-hand panel and the Halo 2 simulations in the right-hand panel. The growth of the sinks in the corresponding |${u}_{\rm \small CR}=0$| is shown in grey in the background of each panel for comparison. There are no apparent trends with increasing |${u}_{\rm \small CR}$| – neither in typical sink mass nor in the number of fragments formed.
As is evident from Fig. 7, there is no clear trend with |${u}_{\rm \small CR}$| in either protostellar growth or accretion rate, nor is there any trend in the total sink mass. For example, both the 10 u0 Halo 1 simulation and 105 u0 Halo 2 simulation form only a single sink while the 103 u0 Halo 2 simulation steadily forms a total of 14 sink particles over the 5000 yr period. This can be primarily attributed to the wide variety of dynamical environments in which the sink particles form – demonstrated in Fig. 8, where we show the accretion disc structure of each simulation 5000 yr after the first sink formed. This variation is a direct consequence of the expedited collapse discussed in Section 4.1.2. As seen in Fig. 6, changing the epoch at which the initial collapse occurs results in significant variation of the gravitational potential well; the collapse history of the gas and the dynamical environment in which the sinks form varies accordingly. Given the lack of any apparent trends with increasing |${u}_{\rm \small CR}$|, this suggests the final stages of the collapse are influenced more by small-scale turbulence than the strength of the CR background. While CRs may indeed alter the susceptibility of the disc to fragmentation, any such behaviour is masked by variations in the collapse history between simulations.
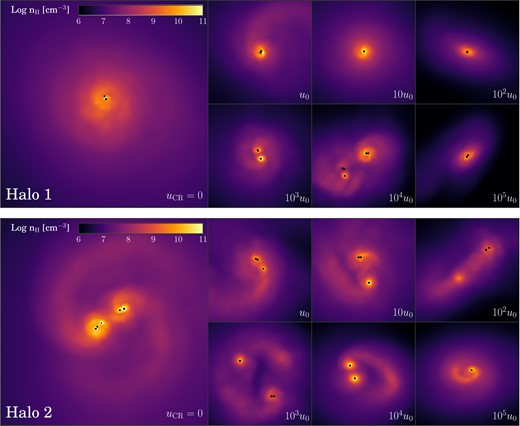
Density projection of the central 20 000 au of each simulation 5000 yr after the formation of the first sink particle. Upper panel: Halo 1; lower panel: Halo 2. Each accretion disc is shown face-on; sink particle positions are identified by black dots whose size scales logarithmically with the mass of the sink. In each panel the accretion disc formed in the absence of any CR background is shown on the left; the corresponding |${u}_{\rm \small CR}$|-modified discs are shown to the right. Note the broad variation in both disc structure and spatial extent.
4.2.2 Characteristic mass
While the final stages of the collapse appear to be somewhat chaotic, with protostellar fragmentation driven primarily by small-scale turbulence rather than the CR background, the typical mass of the sinks formed remains quite stable across all simulations at 10–40 M⊙. This is very much in line with the results of previous simulations performed in absence of any radiative feedback (Bromm 2013). As noted in Section 4.1.1, the thermodynamic behaviour of the gas displays a remarkable similarity as it approaches sink formation densities, regardless of |${u}_{\rm \small CR}$|. This suggests that the influence of the CR background is restricted to lower densities, with little to no effect on the protostellar cores from which the first stars ultimately form.
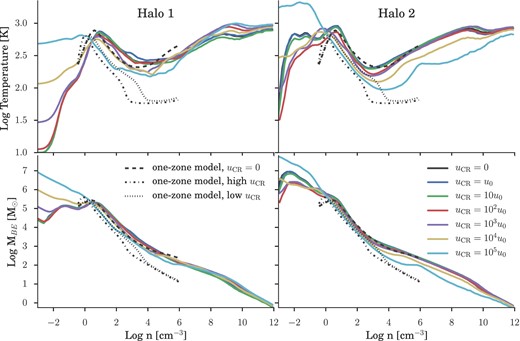
Density-binned average temperature (top) and Bonnor–Ebert mass (bottom) for Halo 1 (left) and Halo 2 (right) for all CR background strengths, as labelled. Overlaid on each panel are the one-zone calculations of Stacy & Bromm (2007), which only tracked the gas evolution up to densities of 106 cm−3, insufficient to observe the |${u}_{\rm \small CR}$|-independent convergence in the thermodynamic state of the gas as it proceeds to runaway collapse.
Also shown in Fig. 9 are the one-zone calculations from Stacy & Bromm (2007). Investigating the impact of a CR background on Pop III star formation in a z = 21 minihalo using the CR background strengths shown in Fig. 1, their models suggested that a sufficiently strong background might decrease the fragmentation mass scale by an order of magnitude as a result of the cooler temperatures experienced during the loitering phase. While we observe similar behaviour from gas in the loitering phase, once the gas proceeds to runaway collapse its thermodynamic state quickly converges with that of the |${u}_{\rm \small CR}=0$| case, such that the fragmentation mass scale remains unaltered. Unfortunately the models of Stacy & Bromm (2007) only followed the gas evolution up to densities of 106 cm−3, insufficient to observe this convergent behaviour.
5 SUMMARY AND CONCLUSIONS
We have performed two suites of cosmological simulations employing a range of CR backgrounds spanning five orders of magnitude in energy density. We follow the thermodynamic evolution of the gas as it collapses into a minihalo from IGM densities up to n = 1012 cm−3, at which point three-body processes have turned the gas fully molecular. This allows us to capture the combined impact of CR heating and ionization on Pop III stars forming in the minihalo via its influence on H2 and HD cooling. Once the gas reaches n = 1012 cm−3, we form sink particles and follow the subsequent evolution of the system for 5000 yr, after which point radiative feedback from the forming protostars can no longer be ignored, and our simulations are terminated.
While it also serves to heat the gas, the primary impact of the CR background is to increase the number of free electrons in the collapsing gas, catalysing the formation of additional molecular hydrogen, which in turn enhances the H2 cooling efficiency. This decreases the cooling time, allowing the gas to fulfil the Rees–Ostriker criterion sooner and expediting minihalo collapse. Each simulation therefore collapses to high density at a different epoch, and the resulting variation in experienced gravitational potential causes the collapse history – and thus the accretion disc structure – to differ greatly between simulations.
Our first suite of simulations (Halo 1) used the same initial conditions as our prior investigation of a cosmic X-ray background (Hummel et al. 2015), allowing for a direct comparison of the results. CRs are much less efficient than X-rays at heating the gas, such that the collapse suppression observed for a sufficiently strong X-ray background does not occur here. While expedited collapse is observed in the presence of an X-ray background as well, the effect is somewhat more pronounced here owing to the more efficient nature of CR ionization, as there is less associated heating to partially counteract the enhanced cooling.
Our second suite of simulations focused on a minihalo collapsing at z ≃ 21.5 in the |${u}_{\rm \small CR}=0$| case in order to allow a more direct comparison to the results of Stacy & Bromm (2007), and control for the influence of the CMB temperature floor on our results. While we find similar evidence for a lower gas temperature in the loitering phase, extending our study beyond the n = 106 cm−3 limit of Stacy & Bromm (2007) revealed that the thermodynamic path of the collapsing gas – and thus, the fragmentation mass scale – begins to converge with that of the |${u}_{\rm \small CR}=0$| case for n ≳ 106 cm−3. This convergence is observed in all simulations for both Halo 1 and Halo 2, with the thermodynamic state of the gas becoming nearly independent of |${u}_{\rm \small CR}$| by the time we form sink particles at n = 1012 cm−3. The remarkable similarity in the thermodynamic state of the gas just prior to sink formation suggests the presence of a CR background has little impact on the characteristic mass of the stars formed. Indeed, the typical mass of the sink particles formed is quite robust, remaining stable across all simulations at 10–40 M⊙, very much in line with the expected results in the absence of external radiative feedback. In fact, this robust behaviour is observed under a variety of environmental conditions, including X-ray irradiation (Hummel et al. 2015) and DM–baryon streaming (Greif et al. 2011a; Stacy et al. 2011).
While the neutral impact of the CR background on the thermodynamic state of primordial gas at high densities results in a robust characteristic mass that does not vary with |${u}_{\rm \small CR}$|, there is a possibility that the enhanced cooling resulting from CR ionization may decrease the velocity dispersion of the infalling gas (Clark et al. 2011b). This would decrease fragmentation in the centre of the minihalo, possibly increasing the mass of the stars formed. While we see no evidence to support this, any such systematic effect could be easily masked by the variations in collapse history between simulations. Likewise, the fact that each simulation collapses to high densities at a different epoch in a different gravitational potential well limits our ability to draw detailed conclusions regarding the impact of the CR background on fragmentation in the protostellar accretion disc.
Finally, while the characteristic mass – and thus, ionizing output – of Pop III stars appears to be unaffected by the presence of a CR background, CRs still heat the low-density gas in the IGM, reducing its clumping factor. This may have implications for reionization and the 21-cm signal (Furlanetto, Peng Oh & Briggs 2006; Sazonov & Sunyaev 2015).
The authors thank Judy Cohen for helpful comments and acknowledge the Texas Advanced Computing Center (TACC) at The University of Texas at Austin for providing HPC resources under XSEDE allocation TG-AST120024. This study was supported in part by NSF grant AST-1413501. AS gratefully acknowledges support through NSF grant AST-1211729 and by NASA grant NNX13AB84G. This research has made use of NASA's Astrophysics Data System and Astropy, a community-developed core python package for Astronomy (Robitaille et al. 2013). All analysis presented here made use of gadfly, a python library for analysing gadget simulation data using pandas (Hummel 2016).
REFERENCES
