


Abstract
We consider a model for the low-luminosity gamma-ray burst GRB 060218 that plausibly accounts for multiwavelength observations to day 20. The model components are: (1) a long-lived (tj ∼ 3000 s) central engine and accompanying low-luminosity (Lj ∼ 1047 erg s−1), mildly relativistic (γ ∼ 10) jet; (2) a low-mass (∼4 × 10⁻³ M⊙) envelope surrounding the progenitor star; and (3) a modest amount of dust (AV ∼ 0.1 mag) in the circumstellar or interstellar environment. Blackbody emission from the transparency radius in a low-power jet outflow can fit the prompt thermal X-ray emission, and the non-thermal X-rays and gamma-rays may be produced via Compton scattering of thermal photons from hot leptons in the jet interior or the external shocks. The later mildly relativistic phase of this outflow can produce the radio emission via synchrotron radiation from the forward shock. Meanwhile, interaction of the associated SN 2006aj with a circumstellar envelope extending to ∼1013 cm can explain the early optical emission. The X-ray afterglow can be interpreted as a light echo of the prompt emission from dust at ∼30 pc. Our model is a plausible alternative to that of Nakar, who recently proposed shock breakout of a jet smothered by an extended envelope as the source of prompt emission. Both our results and Nakar's suggest that bursts such as GRB 060218 may originate from unusual progenitors with extended circumstellar envelopes, and that a jet is necessary to decouple the prompt emission from the supernova.
1 INTRODUCTION
Low-luminosity gamma-ray bursts (LLGRBs) are a subclass of long-duration gamma-ray bursts (GRB) that, although rarely detected and not yet well understood, have the potential to shed light on more commonly observed cosmological bursts. Though the uncertainty is large, estimated volumetric rates indicate that LLGRBs occur some 10–100 times more often than typical GRBs (Soderberg et al. 2006), making them a compelling population for further study. In addition, LLGRBs take place nearby, so the associated supernovae (SNe) can be detected easily and studied in detail, placing constraints on energetics and circumstellar environment and giving clues about the SN-GRB connection. Phenomena like central engine activity, jet-star and jet-wind interactions, and the transition from beamed to spherical outflow can be probed more thoroughly than is possible at high redshift, and any insight into the radiation mechanisms of LLGRBs can inform our understanding of the GRB population at large.
Among known LLGRB sources, the remarkably similar sources GRB 060218/SN 2006aj (Campana et al. 2006; Mazzali et al. 2006a; Pian et al. 2006; Soderberg et al. 2006; Kaneko et al. 2007) and GRB 100316D/SN 2010bh (Chornock et al. 2010; Cano et al. 2011; Fan et al. 2011; Starling et al. 2011; Margutti et al. 2013) stand out as unique due to their long time-scale, smooth single-peaked light curve, anomalously soft and bright X-ray afterglow, and the presence of significant thermal X-ray and optical components at early times (Campana et al. 2006; Kaneko et al. 2007; Starling et al. 2011; Margutti et al. 2013). Several important and compelling questions concerning these two bursts remain open. In a narrow sense, the atypical prompt emission, the origin of the X-ray blackbody component, and the unusual X-ray afterglow are hard to explain in terms of standard GRB theory. In a broader sense, we do not know whether the progenitor system is the same as for typical GRBs: do these ultralong LLGRBs represent the low-luminosity end of a continuum of collapsar explosions, or a different stellar endpoint altogether? The answer to this question has important implications for high-mass stellar evolution, the connection between SNe and GRBs, and the low-energy limits of GRB physics, especially considering that events similar to GRB 060218 and GRB 100316D are likely more common than cosmological GRBs. The peculiar nature of these bursts, the wealth of timely observations in many wavebands (especially for GRB 060218), and the lack of a consensus picture for their behaviour make these particular LLGRBs prime targets for theory.
Accordingly, a wide variety of models have been proposed to explain the many facets of GRB 060218. Campana et al. (2006) and Waxman, Mészáros & Campana (2007) originally modelled the prompt X-ray emission as shock breakout from a circumstellar shell at ∼1012 cm. The breakout duration in this case, assuming spherical symmetry, is only a few hundred seconds; however, Waxman et al. (2007) suggested asphericity as a means to lengthen the burst time-scale. On the other hand, Ghisellini, Ghirlanda & Tavecchio (2007b) argued against the shock breakout interpretation, showing that fine tuning is required to bring about a large change in breakout time-scale through asymmetrical effects. Ghisellini, Ghirlanda & Tavecchio (2007a) presented an alternative synchrotron self-absorption model for the prompt emission, but the high brightness temperature and small emitting area in their model are at odds with radio observations, which suggest only mildly relativistic speeds (Soderberg et al. 2006). Dai, Zhang & Liang (2006) found that Compton scattering of soft input photons off relativistic external shocks driven by an inner outflow could roughly reproduce the observed prompt light curve. In the same vein, Wang et al. (2007) showed that a Fermi acceleration mechanism could upscatter breakout thermal photons, creating a high-energy power-law tail to the thermal distribution. However, it is unlikely that thermal equilibrium is obtained in a relativistic breakout, and photon energies are limited by Compton losses (Katz, Budnik & Waxman 2010; Nakar & Sari 2010, 2012). Li (2007) and Chevalier & Fransson (2008) investigated the prompt UV/optical emission, and demonstrated that shock breakout could reproduce the optical flux, given a large breakout radius of 5 × 1013 cm. (This large radius was initially viewed as a problem; see, however, the discussion in Section 3 below.) Björnsson (2008) also put forth a model for the prompt UV, based on optically thick cyclotron emission. Nakar & Piro (2014) showed that an early UV/optical peak could be attributed to cooling emission from an extended low-mass circumstellar envelope shock-heated by the passage of fast SN ejecta. They did not discuss the case of SN 2006aj, although it appears in their fig. 1 as an example of extended envelope interaction.
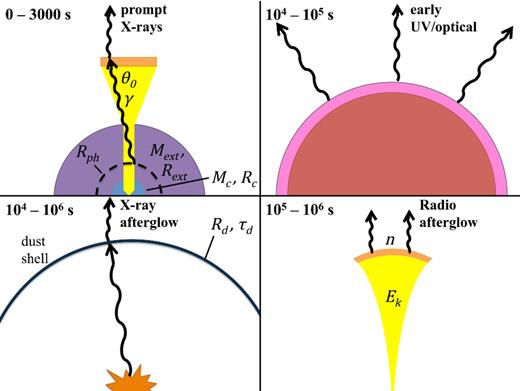
The origin of different components of the prompt and afterglow emission in our model. The figure is not to scale. The progenitor has a core-envelope structure. Mc ∼ 2 M⊙ is confined to a core of Rc ∼ 1011 cm (blue), while a mass Mext ≪ Mc is contained mostly near the edge of an extended envelope with Rext ≫ Rc (purple). Upper left: a long-lived, dissipative jet tunnels through the progenitor system. Upon breakout, it emits blackbody radiation from radius Rph. Some thermal photons IC scatter from external shocks (orange) or the jet interior (yellow) to create the Band-like non-thermal component. The jet obtains terminal opening angle θ0 and Lorentz factor Γ0 after breakout. Upper right: fast SN ejecta shock the envelope, heating it. The slower bulk of SN ejecta (red) then lift the hot envelope (pink), which emits in the optical and UV as it expands and cools. Lower left: the prompt X-rays undergo scattering in a dusty region with inner radius Rd ∼ tens of pc and X-ray scattering optical depth τd. The resulting light echo outshines the synchrotron afterglow, giving rise to a characteristic soft spectrum. Lower right: external shock synchrotron emission from the mildly relativistic phase of the jet generates the radio afterglow.
Another possibility for the prompt emission is that GRB 060218 is an ordinary GRB jet viewed off-axis. However, a solely geometrical effect should result in a frequency-independent, or achromatic, break in the light curve, whereas the break in GRB 060218 is chromatic in nature (Amati 2006). Mandal & Eichler (2010) considered a scenario for GRB 060218 in which primary radiation scatters off material radiatively accelerated slightly off-axis from the line of sight; this acceleration can explain the chromatic behaviour of the afterglow. However, as their model still required an unusually soft, long-duration, and low-luminosity primary photon source, it did not give insight into the fundamental factor distinguishing LLGRBs from most bursts.
Soderberg et al. (2006) and Fan, Piran & Xu (2006) tackled the X-ray and radio afterglow. In each case, the radio could be explained by a synchrotron self-absorption in a wide (θ ≳ 1), mildly relativistic (Γ ∼ 2–3) outflow, but the high X-ray afterglow flux could not be accounted for in a simple external shock synchrotron model. Soderberg et al. (2006) attributed this X-ray excess to a forming magnetar, while Fan et al. (2006) preferred late-time fallback accretion on to a central compact object. Toma et al. (2007) suggested that the radio afterglow was better explained by the late non-relativistic phase of an initially collimated jet outflow. They inferred a jet luminosity 1045 erg s−1, an initial jet Lorentz factor Γ ∼ 5, and an initial jet opening angle θ ∼ 0.3, and showed that a hot low-luminosity jet could successfully penetrate a Wolf– Rayet (WR) star and expand upon breakout to achieve these initial conditions. Based on the smooth light curve and long engine duration, they posited a neutron star-powered rather than black hole-powered central engine. Barniol Duran et al. (2015) calculated the synchrotron afterglow light curves from a relativistic shock breakout, and while their model could fit the radio emission of GRB 060218, it predicted too low a flux and too shallow a temporal decay for the X-ray afterglow. Margutti et al. (2015) analysed the X-ray afterglows of 12 nearby GRBs and established that GRB 060218 and GRB 100316D belong to a distinct subgroup marked by long duration, soft-photon index, and high absorption. They proposed the possibility that these afterglows are in fact dust echoes from shells ∼tens of parsecs across that form at the interface between the progenitor's stellar wind and the interstellar medium (ISM).
Until recently, most existing models have focused on explaining a particular aspect of this burst (e.g. the prompt non-thermal emission, the radio afterglow, or the optical emission), while leaving the other components to speculation. Nakar (2015) recently suggested a model that attempts to unify the prompt X-rays, early optical peak, and radio emission. In his picture, the prompt X-ray and optical emission arise from the interaction of a typical GRB jet with a low-mass envelope surrounding the progenitor star. The short-lived jet is able to tunnel through the progenitor star, but is choked in the envelope, powering a quasi-spherical, mildly relativistic explosion akin to a low-mass SN. The prompt X-rays are produced by the shock breaking out of the optically thick envelope (as described in Nakar & Sari 2012), and optical radiation is emitted as the envelope expands and cools (as in Nakar & Piro 2014). Interaction of the breakout ejecta with circumstellar material (CSM) generates the radio via synchrotron radiation (as in Barniol Duran et al. 2015). Nakar's model does not, however, attempt to explain the unusual X-ray afterglow or the presence of thermal X-rays at early times.
In this paper, we present a plausible alternative to Nakar's model for this peculiar burst, building on previous jet models. In Section 2, we give an overview of observations of GRB 060218, and discuss the key features that must be reproduced by any model. In Section 3, we address some problems with a straightforward shock breakout view for the prompt emission, and provide motivation for adopting a long-lived jet instead. In Section 4, we describe how each component of the observed radiation is generated in our engine-driven model for GRB 060218, and check that our picture is self-consistent. Advantages, drawbacks, and predictions of our model, ramifications for GRB classification, and future prospects are discussed in Section 5, before we conclude in Section 6.
2 OVERVIEW OF OBSERVATIONS
The X-ray evolution of GRB 060218 and GRB 100316D can be divided into a prompt phase, an exponential or steep power-law decline, and an afterglow phase. Remarkably, these two objects share many observational features, perhaps suggesting that they have similar origins. In both objects, we see:
prompt non-thermal X-rays and gamma-rays with a Band-like spectrum, but with lower luminosity, lower peak energy, and longer time-scale as compared to cosmological GRBs.
Thermal X-rays with roughly constant temperature ∼0.1 keV over the first ∼1000 s.
Strong thermal UV/optical emission on a time-scale of hours to days.
A radio afterglow lasting tens of days and implying mildly relativistic outflow.
An X-ray afterglow that is brighter and softer than expected in standard synchrotron models.
Any unified model for these bursts must account for each of these components. Here, we summarize multiwavelength observations during the prompt and afterglow phases of GRB 060218 and GRB 100316D.
Prompt X-rays/gamma-rays. The non-thermal spectrum of GRB 060218 from t = 200 to 3000 s is well fitted by a Band function (Band et al. 1993) with low-energy photon index Γ1 = −1.0 and high-energy photon index Γ2 = −2.5, implying Fν ∝ ν0 at low energies and Fν ∝ ν−1.5 at high energies. Γ1 and Γ2 remain roughly constant over the evolution (Toma et al. 2007). Kaneko et al. (2007) found a somewhat different low-energy index, Γ1 = −1.4, when fitting the spectrum with a cut-off power law instead of a Band function. These values are typical for long GRBs (Ghirlanda et al. 2007). The peak energy Ep of the best-fitting Band function decreases as Ep ∝ t−1.6 from t = 600 s until the end of the prompt phase. At 700 s, Ep = 10 keV (Toma et al. 2007). Despite its low luminosity, GRB 060218 obeys the Amati correlation between Ep and luminosity (Amati 2006). In addition to the non-thermal Band function, a significant soft quasi-thermal component is present in the prompt spectrum (Campana et al. 2006; Kaneko et al. 2007; Friis & Watson 2013). Campana et al. (2006) found that the blackbody temperature remains nearly constant at 0.17 keV throughout the prompt phase (Campana et al. 2006). A later analysis by Kaneko et al. (2007) determined a slightly lower temperature, 0.14 keV, for times after several hundred seconds (see their fig. 7). Throughout the prompt phase, the implied blackbody radius of the thermal X-rays increases slowly as t0.3, with a value of ∼1012 cm at t = 2000 s (Campana et al. 2006).
The prompt XRT (0.3–10 keV) light curve of GRB 060218 can be decomposed into contributions from the thermal and non-thermal parts; the non-thermal component dominates until approximately 3000 s (Campana et al. 2006, see also fig. 1 in Ghisellini et al. 2007b). The total (non-thermal + thermal) isotropic-equivalent luminosity in the XRT band grows as LXRT ∝ t0.6 for the first 1000 s, when it reaches a peak luminosity ∼3 × 1046 erg s−1, then declines as roughly t−1 until ∼3000 s, fading exponentially or as a steep power law after that (Campana et al. 2006). The thermal component initially comprises about ∼1/6 of the total XRT band luminosity, and its light curve evolves similarly: at first it increases as a power law, rising steadily as Lth ∝ t0.66 (Liang et al. 2006) until it peaks at 1 × 1046 erg s−1 at t = 3000 s (Campana et al. 2006). At that time, the thermal and non-thermal luminosities are about equal, but during the steep decline phase (3000–7000 s), the thermal component comes to dominate the luminosity, indicating that the non-thermal part must decline more steeply (Campana et al. 2006). The light curve in the BAT band (15–150 keV) is initially very similar to the XRT light curve, increasing as about t0.8 with roughly the same luminosity. Though its maximum luminosity (∼3 × 1046 erg s−1) is similar to the peak XRT flux, the BAT flux peaks earlier, at t = 400 s. Furthermore, it decays faster after the peak, falling off as LBAT ∝ t−2 from 400–3000 s (Campana et al. 2006; Toma et al. 2007).
Evidence for a blackbody spectral component has also been claimed for GRB 100316D, with a similar constant temperature kT = 0.14 keV (Starling et al. 2011). However, the presence of this thermal component has been called into question based on a large change in its statistical significance with the latest XRT calibration software (Margutti et al. 2013). The non-thermal spectrum of this burst is similar to that of GRB 060218: its peak energy has about the same magnitude and declines in a similar fashion, and its low-energy photon index is also nearly the same over the first ∼1000 s (Starling et al. 2011, see their fig. 4).
Compared to GRB 060218, GRB 100316D is more luminous in the XRT band, with LXRT ∼ 1048 erg s−1. In this case, the XRT light curve has nearly constant luminosity (∝ t−0.13) for the first 800 s (Starling et al. 2011) (For this burst, there are no X-ray data available from 800–30 000 s.). If the light curve is broken into blackbody and Band function components, the non-thermal flux strongly dominates over the thermal contribution, with LXRT/Lth ∼ 30.
Optical photometry. From the first detection of GRB 060218 at a few hundred seconds, the UV/optical emission slowly rises to a peak, first in the UV at 31 ks, and then in the optical at 39 ks (Campana et al. 2006). The light curves dipped to a minimum at around ∼200 ks, after which a second peak occurred around 800 ks, which can be attributed to the emergence of light from the supernova SN 2006aj. Like other GRB-SNe, 2006aj is a broad-lined Type Ic (Pian et al. 2006), but its kinetic energy Ek ≈ 2 × 1051 erg is an order of magnitude smaller than usual (Mazzali et al. 2006a).
GRB 100316D was not detected with UVOT (Starling et al. 2011). Its associated supernova, SN 2010bh, peaked at ∼10 d (Cano et al. 2011). While detailed optical data is not available for the earliest times, SN 2010bh does show an excess in the B band at t = 0.5 d (Cano et al. 2011), which is at least consistent with an early optical peak.
X-ray/radio afterglow. Once the prompt emission of GRB 060218 has faded, another component becomes visible in the XRT band at 10 000 s. This afterglow has luminosity Lag = 3 × 1043 erg s−1 when it first appears, and fades in proportion to t−1.2 until at least t = 106 s. While this power-law decay is typical for GRBs, the time-averaged X-ray spectral index (β in Fν ∝ νβ) is unusually steep, βX = −2.2 (Campana et al. 2006; Soderberg et al. 2006). The measured spectral index at late times (0.5–10 d) is βX = −4.5 (Margutti et al. 2015), suggesting that the spectrum softens over time.
Radio observations of GRB 060218 beginning around ∼1 d indicate a power-law decay in the radio light curve with spectral flux Fν ∝ t−0.85 (Soderberg et al. 2006), not so different from the X-ray temporal decay and typical for GRBs. At 5 d, the spectrum peaked at the self-absorption frequency νa ≈ 3 GHz (Soderberg et al. 2006). The radio to X-ray spectral index is unusually flat, βRX = −0.5 (Soderberg et al. 2006). No jet break is apparent in the radio data (Soderberg et al. 2006), and self-absorption arguments indicate mildly relativistic motion (see Section 4.5).
The X-ray afterglow light curve of GRB 100316D can also be described by a simple power-law decay: Lag ∝ t−0.87 from t = 0.4–10 d, with X-ray luminosity ∼1043 erg s−1 at t = 0.4 d. Like GRB 060218, its X-ray spectrum is also very soft, with βX = −2.5 over the period 0.5–10 d (Margutti et al. 2015). Because of the gap in coverage, it is unclear precisely when the prompt phase ends and the afterglow phase begins.
GRB 100316D was detected at 5.4 GHz from 11 to 70 d, with a peak at that frequency at t ≈ 30 d (Margutti et al. 2013). This peak comes much later than that of GRB 060218, where the 5 GHz peak occurred at 2–3 d (Soderberg et al. 2006). The late-time radio to X-ray spectral index is βRX < −0.4, comparable to GRB 060218 (Margutti et al. 2013). No jet break is detected out to 66 d, and the estimated Lorentz factor is again mildly relativistic, Γ ∼ 1.5–2 on day 1 (Margutti et al. 2013).
3 SHOCK BREAKOUT OR CENTRAL ENGINE?
The majority of models for the prompt X-rays of GRB 060218 fall into two categories: shock breakout (e.g. Campana et al. 2006; Waxman et al. 2007; Nakar & Sari 2012; Nakar 2015) or inverse Compton (IC) scattering of blackbody radiation by external shocks (e.g. Dai et al. 2006; Wang et al. 2007). The latter type requires seed thermal photons for IC upscattering; while Dai et al. (2006) and Wang et al. (2007) assumed these photons were produced by a shock breakout event, other thermal sources such as a dissipative jet are also possible. Here, we point out some difficulties with a shock breakout interpretation of the prompt X-ray emission, and suggest some reasons to consider a long-lived central engine scenario instead.
Early models for GRB 060218 (Campana et al. 2006; Waxman et al. 2007) considered the case where matter and radiation are in thermal equilibrium behind the shock, and the thermal X-rays and thermal UV/optical emission arise from shell interaction and shock breakout, respectively. However, for sufficiently fast shocks the radiation immediately downstream of the shock is out of thermal equilibrium, so the breakout temperature can be higher than when equilibrium is assumed (Katz et al. 2010; Nakar & Sari 2010). In this scenario, the prompt emission peaks in X-rays and the prompt spectrum is a broken power law with Fν ∝ ν0 at low energies and Fν ∝ ν−1.74 at high energies (Nakar & Sari 2012). This is similar to the Band function spectrum observed in GRB 060218, motivating consideration of the case where the non-thermal X-rays originate from a relativistic shock breakout while the thermal UV/optical component comes from a later equilibrium phase of the breakout, as described in Nakar & Sari (2012). This interpretation still has possible problems. For one, because the breakout radius implied by this model (∼5 × 1013 cm) is large, the origin of a separate thermal X-ray component with photospheric radius ∼1012 cm is unclear in this picture. In addition, the evolution of the prompt peak energy differs from the expectation for a relativistic shock breakout as in Nakar & Sari (2012). In GRB 060218, the peak energy falls off as t−1.6, while in the relativistic shock breakout model it declines more slowly as t−(0.5 − 1). Consequently, while the peak energy inferred from relativistic breakout, ∼40 keV, is consistent with observations at early times (less than a few hundred seconds), the Nakar & Sari (2012) model overestimates Ep for most of the prompt phase. Another problem is that the optical blackbody emission is observed from the earliest time in GRB 060218, and it rises smoothly in all UVOT bands until peak. In the non-equilibrium shock breakout scenario, thermal optical emission would not be expected until later times, when equilibrium has been attained. A final issue with the shock breakout picture of Nakar & Sari (2012) is that it involved a stellar mass explosion. Since only a small fraction of the energy goes into relativistic material in a standard SN explosion, the energy required for the breakout to be relativistic was extreme, ESN ≳ 1053 erg. This high energy is inconsistent with the unremarkable energy of the observed SN, 2 × 1051 erg.
One can also consider the case where the prompt optical emission is attributed to shock breakout, but the prompt X-rays have a different origin. The large initial radius in this case is incompatible with a bare WR star, and initially seemed to rule out a WR progenitor (Li 2007; Chevalier & Fransson 2008). However, this calculation assumed that much of the stellar mass was located close to the breakout radius. An extended optically thick region containing a relatively small amount of mass could circumvent this difficulty. Such an envelope might be created by pre-explosion mass-loss or a binary interaction. There is mounting evidence for the existence of such dense stellar environments around other transients such as SN Type IIn (Fransson et al. 2014, and references therein), SN Type IIb (Nakar & Piro 2014), SN Type Ibn (e.g. Matheson et al. 2000; Pastorello et al. 2008; Gorbikov et al. 2014), and SN Type Ia-CSM (Silverman et al. 2013; Fox et al. 2015).
The model of Nakar (2015) builds on the relativistic shock breakout model of Nakar & Sari (2012), while solving several of its problems. Nakar (2015) introduces a low-mass, optically thick envelope around a compact progenitor. In his model, the explosion powering the breakout is driven not by the SN, but by a jet that tunnels out of the progenitor star and is choked in the envelope, powering a quasi-spherical explosion. Having a large optically thick region preserves the long shock breakout time-scale, but in this case most of the mass is concentrated in a compact core. Since the envelope mass is much smaller than the star's mass, the energy required for a relativistic breakout is reduced as compared to the model of Nakar & Sari (2012). This picture also provides a natural explanation for the optical blackbody component via cooling emission from the shocked envelope. Moreover, as the breakout in this case is aspherical and only mildly relativistic, and occurs from the edge of an envelope with unknown density structure, the results of Nakar & Sari (2012, which assumed spherical, relativistic flow and a specific density structure) are not fully adequate for describing GRB 060218. Proper treatment of these differences may help to resolve issues with the evolution of Ep. However, it remains unclear whether Nakar's model can account for the simultaneous observation of optical and X-ray emission at early times, and the problem with interpreting the small blackbody radius of the thermal X-ray component persists.
Given the possible difficulties with shock breakout, a different source for the prompt X-ray radiation should be considered. Bromberg, Nakar & Piran (2011a) have shown that a central engine origin for certain LLGRBs is unlikely as their duration (T90) is short compared to the breakout time. However, due to their relatively long T90, engine-driven models are not ruled out for GRB 060218 and GRB 100316D. Furthermore, as discussed in Section 2, the prompt X-ray/gamma-ray emission of GRB 060218 shares much in common with typical GRBs. As these similarities would be a peculiar coincidence in the shock breakout view, a collapsar jet origin for GRB 060218 is worth investigating. Motivated by this, we consider the case where the early optical emission is powered by interaction of the SN ejecta with a circumstellar envelope, but the prompt X-rays originate from a long-lived jet.
4 A COMPREHENSIVE MODEL FOR GRB 060218
A schematic of our model is presented in Fig. 1. The essential physical ingredients are a long-lived jet, an extended low-mass circumstellar envelope, and a modest amount of dust at tens of parsecs, which are responsible for the prompt X-rays/radio afterglow, early optical, and X-ray afterglow, respectively. Below we consider the origin of each observed component in detail, and show that a reasonable match to observations can be obtained for appropriate choices of the progenitor, jet, and CSM properties.
4.1 Prompt thermal emission
The thermal X-ray component is a puzzling aspect of GRB 060218, and it is not unique in this regard. A recent review by Pe'er (2015) lists a number of typical GRBs for which a Band + blackbody model improves the spectral fit, which has been claimed as evidence for thermal emission. Burgess et al. (2014) have also found evidence for thermal radiation in several other bursts. In fact, Axelsson & Borgonovo (2015) have recently suggested that most bursts must contain a broadened thermal component, because in the majority of observed bursts, the full width half-maximum of the spectral peak is narrower than is physically possible for synchrotron radiation. Although prompt thermal radiation is observationally indicated, the physical origin of this emission is yet unclear. One possible source of thermal X-rays is a jet-blown cocoon, although the flat early light curve of GRB 060218 and GRB 100316D is hard to explain in this case (Pe'er, Mészáros & Rees 2006; Starling et al. 2012; see also Ramirez-Ruiz, Celotti & Rees 2002). Another possibility is that the blackbody emission is produced at the transparency radius in a dissipative jet outflow, as discussed in the context of GRB 060218 by Ghisellini et al. (2007a,b). Here, we consider the latter scenario.
In the above calculation, we have assumed for simplicity that the jet outflow is directed into an uncollimated cone. However, as we show in Section 4.6, the jet may be collimated within the envelope, and become uncollimated only after breaking out. The decollimation time-scale can be estimated as the time for the jet's cocoon to expand and become dynamically unimportant after breakout, which is ∼Rext/cs ∼ 31/2Rext/c ∼ 500 s, where cs is the sound speed. This is short compared to the duration of prompt emission; therefore, outside of the envelope, the assumption of an uncollimated outflow is reasonable for most of the prompt phase. However, it appears that the photosphere is within the envelope. The decollimation time-scale there might be longer because it will take the jet some time to excavate the walls of the narrow hole left by its passage. Collimation has the joint effect of decreasing the outflow's opening angle (due to the confining effect of the cocoon) and decreasing its Lorentz factor (due to more of the total jet energy going into internal versus kinetic energy). Both of these effects lead to a smaller Mj and Lj, for the same observed thermal luminosity and temperature. Thus, by ignoring collimation we potentially overestimate these quantities; our derived mass-loss rate and kinetic luminosity should really be viewed as upper limits.
4.2 Extinction and absorption
The optical/UV extinction and the X-ray absorption to GRB 060218 are crucial for the interpretation of observations of the event, as well as giving information on gas and dust along the line of sight. The early optical/UV emission is strongly weighted to the ultraviolet, which is especially sensitive to absorption. The amount of Galactic absorption is not controversial; extinction maps of the Galaxy yield E(B − V) = 0.14 mag, while the Galactic Na i D lines indicate E(B − V) = 0.13 mag (Guenther et al. 2006; Sollerman et al. 2006). The reddening has been estimated from the narrow Na i D lines in the host galaxy as being E(B − V) = 0.042 mag, or AV = 0.13 ± 0.01 mag (Guenther et al. 2006). As noted by Sollerman et al. (2006), a larger reddening is possible if there is ionization in the host galaxy. However, the properties of the host galaxy derived from fitting the spectral energy distribution (SED) and the observed Balmer line decrement point to a low extinction so Sollerman et al. (2006) advocate the low value obtained from the Na i D line. Our model for the late-time X-rays (see Section 4.4) also suggests a similar low extinction.
A higher host galaxy reddening, E(B − V) = 0.2 mag, was advocated by Campana et al. (2006) and Waxman et al. (2007) because the early (<1 d) emission could be fitted by a Rayleigh–Jeans spectrum, consistent with high temperature emission. This suggestion allowed a shock breakout model for both the thermal X-ray emission and the early optical emission. This value of the reddening was also used by Nakar (2015), who noted that the implied blackbody temperature is >50 000 K. Nakar (2015) advocates the large reddening based on the slow colour evolution leading up to the peak, which is expected in the Rayleigh–Jeans limit. However, his model could in principle accommodate a smaller extinction, if the model is consistent with a constant temperature leading to the peak.
In view of the lack of direct evidence for the larger values of extinction in the host, we take the small value that is directly indicated. Thöne et al. (2011) had derived some of the observed parameters for GRB 060218 based on Galactic extinction only. As expected, the spectrum is then not well approximated by a Rayleigh–Jeans spectrum and a temperature in the range 30 000–35 000 K is deduced over the first half day. A blackbody fit gives the radius at the time of peak luminosity, 1014 cm, which yields a luminosity of 5 × 1043 erg s−1. This can be compared to the luminosity >3 × 1044 erg s−1 found by Nakar (2015) in his larger extinction model.
The X-ray absorption column density has been obtained by fitting the observed spectrum to a model with a power-law continuum, a blackbody thermal component and interstellar absorption; Kaneko et al. (2007) obtain an absorbing hydrogen column density of NH = 6 × 1021 cm−2 over 10 spectra covering the time of peak luminosity. Margutti et al. (2015) infer the same absorption column from fitting an absorbed power law to the afterglow spectra. There is no evidence for evolution of NH. Using a standard conversion of NH to AV for the Galaxy, NH = 2 × 10²¹AV cm−2 (e.g. Güver & Özel 2009), the corresponding value of AV is 3. There is a significant difference between the extinction determined from the Na i line and that from the X-ray absorption.
One way to reconcile the difference is to have the dust be evaporated in the X-ray absorbing region. Waxman & Draine (2000) have discussed evaporation of dust by the radiation from a GRB; optical/UV photons with energies 1–7 eV are responsible for the evaporation. A normal burst with an optical/UV luminosity of Lopt = 1 × 1049 erg s−1 can evaporate dust out to a radius of Rd ≃ 10 pc (Waxman & Draine 2000). Since |$R_{\rm d} \propto L_{\rm opt}^{1/2}$| and the peak luminosity of GRB 060218 was about 1 × 1043 erg s−1, we have Rd ≈ 0.01 pc and the absorbing gas is likely to be circumstellar in origin.
4.3 UV/optical emission
Here, we investigate the possibility that the optical emission is from shocked gas, but the X-ray emission is not. We take an SN energy of 2 × 1051 erg and a core mass of 2 M⊙, as determined from modelling the SN emission (Mazzali et al. 2006b). The optical emission has a time-scale of ∼1 d, which is characteristic of SNe thought to show the shock breakout phenomenon (see fig. 10 in Modjaz et al. 2009), but the emission is brighter than that observed in more normal SNe. As discussed in Section 3, there is increasing evidence that massive stars can undergo dense mass-loss before an SN. We thus consider the possibility that an extended, low-mass circumstellar medium is responsible for the high luminosity.
Nakar & Piro (2014) have discussed how the shock breakout process is affected by the mass of an extended envelope. When most of the stellar mass is at the radius of the surrounding envelope, a standard shock breakout, as in Chevalier & Fransson (2008), is expected. This case applies to SN 1987A (Chevalier 1992). However, when the envelope mass is much less than the core mass, the early emission is determined by the emission from the envelope that is heated by the expansion of the outer part of the core. One of the distinguishing features of the non-standard case is that the red luminosity can drop with time, which is not the case for standard shock breakout. Nakar & Piro (2014) note in their fig. 1 that the early emission from GRB 060218 shows a drop in the V emission that implies the non-standard, low-mass envelope case. Another difference is that in the standard case, the initially rising light curves turn over because the blackbody peak passes through the wavelength range of interest as the emission region cools (e.g. Chevalier & Fransson 2008), while in the non-standard case the turnover is due to all the radiative energy in the envelope being radiated and the temperature remains steady (Nakar & Piro 2014). The set of Swift–UVOT light curves in fact show approximately constant colours (and thus temperatures) through the luminosity peak at ∼3.5 × 10⁴ s (fig. 2 of Campana et al. 2006). The UVOT observations of GRB 060218 give the best set of observations of an SN during this early non-standard phase.
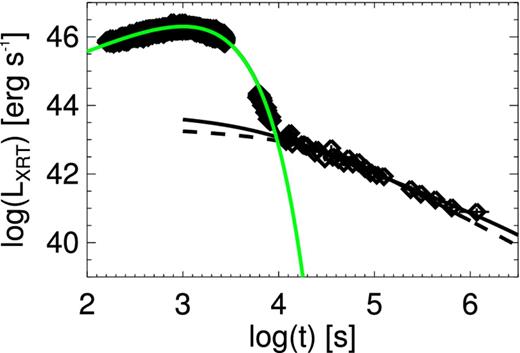
Prompt and afterglow light curves for the dust echo model. The prompt data points are fit with a simple exponentially cut-off power law, shown by the green line. The solid and dashed black lines indicate the contribution from dust scattering at Rd. The model parameters are, respectively, τ keV ≈ 0.009, Rd ≈ 6.3 pc, and q = 4.76 (solid line), and τ keV ≈ 0.007, Rd ≈ 28 pc, and q = 4.00 (dashed line). Both echo models have a+ = 0.25 μm, a− = 0.005 μm, and s = 2.
Nakar (2015) has recently discussed the early emission from GRB 060218 in terms of interaction with a low-mass envelope. The mass of the envelope was estimated at 0.01 M⊙ based on the time-scale of the optical peak and an estimate of the shell velocity. However, the expansion of the envelope was attributed to an explosion driven by the deposition of energy from an internal jet. In this case, the event is essentially a very low mass SN. In our model, the expansion is driven by the outer, high-velocity gas of the SN explosion, as in the non-standard expansion case of Nakar & Piro (2014). The input parameters are an SN explosion energy ESN = 2 × 1051 erg and core mass Mc = 2 M⊙ (Mazzali et al. 2006a), a peak luminosity of Lp = 5 × 1043 erg s−1 (Campana et al. 2006; Thöne et al. 2011), and a time of peak of tp = 3.5 × 10⁴ s (Campana et al. 2006). Since SN 2006aj was of Type Ic (no helium or hydrogen lines), we assumed an opacity κ = 0.2 cm2 g−1, appropriate for an ionized heavy element gas. These parameters can then be used to find the properties of the low-mass extended envelope (subscript ext): Mext ≈ 4 × 10⁻³ M⊙, shell velocity vext ≈ 3 × 109 cm s−1, and energy Eext ≈ 3 × 1049 erg. These results come from the dynamics of the outer SN layers sweeping up and out the low-mass envelope around the star, and the time of the peak luminosity (Nakar & Piro 2014). The value of Rext ≈ 9 × 1012 cm is proportional to luminosity, because of adiabatic expansion. The radius is related to the luminosity and thus the assumed absorption. These results are not sensitive to the density distribution in the extended envelope provided that most of the envelope mass is near Rext. The mass in the envelope derived here is sufficient that the shock wave breaks out in the envelope, as assumed in the model. At the time of maximum luminosity, the radius of the shell is Rp ≈ vexttp = 1 × 1014 cm. As noted by Nakar & Piro (2014), the minimum luminosity between the two peaks of the light curve can give an upper limit to the initial radius of the core. In the case of GRB 060218, the drop in the luminosity between the peaks is shallow so that only a weak limit on the core radius can be set, Rc ≲ 2 × 1012 cm.
These considerations show that the overall properties of the early optical/UV emission from GRB 060218 can be accounted for by a model in which there is shock breakout in a low-mass, extended envelope. The model makes further predictions that can be tested in the case of GRB 060218. Approximating the observed temperature at the peak as the effective temperature leads to Tobs ≈ 3.5 × 10⁴ K, which is consistent with the observed temperature of GRB 060218 at an age of 0.085–0.5 d (SI fig. 17 of Thöne et al. 2011). The high temperature justifies the neglect of recombination in the model. Nakar & Piro (2014) note that the optical depth of Mext becomes unity at t ≈ tp(c/vext)1/2, which is day 1.3 for GRB 060218; the photospheric velocity at this time gives an estimate for vext. The earliest spectrum of Pian et al. (2006) is on day 2.89, when they estimate a photospheric velocity of 26 000 km s−1. The photospheric velocity is higher at earlier times, so there is rough agreement of the model with observations.
While the model reproduces the basic observational features, it is not clear whether it can reproduce the full evolution of the optical light curve and spectrum. This problem is non-trivial and hinges on details of the cooling envelope model, e.g. the mass–velocity distribution of ejecta, that are not yet well understood; we do not discuss this issue further.
4.4 X-ray afterglow
After a steep drop, the X-ray emission from GRB 060218 enters an apparent afterglow phase at an age of 0.1–10 d. During this time, the flux spectrum is approximately a power law and the evolution is a power law in time: |$F_\nu \propto \nu ^{\beta _{\rm X}} t^{-1.1}$| (Soderberg et al. 2006). Continuous spectral softening is observed, with βX decreasing from −2.2 at 0.1 d to ∼− 4.5 at ∼3 d. The time evolution is typical of a GRB afterglow, but the spectrum is unusually steep and the indices do not obey the standard ‘closure’ relations for GRB afterglows (Fan et al. 2006). In view of this, other proposals have been made for this emission, e.g. late power from a central magnetar. Fan et al. (2006) considered a wide, accretion-powered outflow as the afterglow source, but the expected light curve in that case is Fν ∝ t−5/3, which seems too steep to explain the observations.
In standard GRB afterglow emission, there is one population of relativistic particles that gives rise to the emission, from radio to X-ray wavelengths. However, in GRB 060218, it is difficult to join the radio spectrum with the X-rays (see fig. 1 in Soderberg et al. 2006); a flattening of the spectrum above radio frequencies would be necessary, as well as a sharp steepening at X-ray energies. In fact, some young SN remnants such as RCW 86 show such spectra (Vink et al. 2006). The steepening would require some loss process for the high-energy particles; however, Soderberg et al. (2006) find that synchrotron losses set in at a relatively low energy, so the observed spectrum cannot be reproduced. In addition, the X-ray evolution does not show a jet break, as might be expected if the afterglow is produced in the external shocks of a collimated outflow. Barniol Duran et al. (2015) examined a shock breakout afterglow model for the late radio and X-ray emission. They were able to model the radio emission quite adequately, but the predicted X-ray emission was considerably below that observed, decayed too slowly in time, and had the incorrect spectral index. They concluded that the X-ray emission had some other source.
An alternative model for the emission was suggested by Shao, Dai & Mirabal (2008), that it is a dust echo of emission close to maximum light. The light-curve shape expected for an X-ray echo is a plateau followed by evolution to a t−2 time dependence. The observed light curve for GRB 060218 is between these cases, which specifies the distance of the scattering dust in front of the source, ∼50 pc (Shao et al. 2008). Shao et al. (2008) applied the echo model widely to GRB light curves. However, Shen et al. (2009) noted two problems with this model for typical bursts. First, the required value of AV is typically ∼10, substantially larger than that deduced by other means. Secondly, the evolution is generally accompanied by a strong softening of the spectrum that is not observed.
The case of GRB 060218 is different from the standard cases; it had a long initial burst and a large ratio of early flux to late flux. These properties are more favourable for echo emission. The early flux was Fpr ≈ 1 × 10⁻⁸ erg cm−2 s−1 lasting for tpr ∼ 2000 s, while the late flux of Flate ≈ 1 × 10⁻¹¹ erg cm−2 s−1 lasted for tlate ∼ 20 000 s. If the late emission is produced as an echo, the optical depth of the dust region is τ0 = Flatetlate/Fprtpr = 0.01 (Shen et al. 2009). The corresponding value of AV is 0.01–0.1 (Shen et al. 2009). This value of AV is roughly consistent with that determined from the Na i D line, giving support to the echo interpretation.
To better understand the spectral softening and determine the dust properties, we numerically investigated the expected dust echo emission from a dust shell at radius Rd. We used the theory of Shao et al. (2008), with some modifications to specify to GRB 060218. While Shao et al. (2008) assumed a flat prompt spectrum in the range 0.3–10 keV as is typical for cosmological GRBs, we instead used an empirical model including a blackbody as described in Section 4.1 and a Band function with flux and peak energy evolving according to Toma et al. (2007). In particular, the inclusion of the thermal component – which dominates at low energies – results in a steeper echo spectrum than predicted by Shao et al. (2008).
The parameters of the model are the dust radius Rd, the scattering optical depth at 1 keV τkeV, the minimum and maximum grain sizes a− and a+, and the power-law indices s and q that set how the scattering optical depth per unit grain size scales with energy and grain radius, i.e. τa ∝ τ keVE−sa4 − q with 2 < s < 3 and 3 < q < 4 typically. The echo flux is integrated over the range 0.3–10 keV, appropriate for the Swift XRT band. The parameter a− ≈ 0.005 μm is based on observations of Galactic dust grains (Mathis, Rumpl & Nordsieck 1977). The prompt photons are approximated as being injected instantaneously at t = 0.
We find a reasonably good fit to the light curve with a reduced chi-squared of 1.6 when τ keV ≈ 0.007, Rd ≈ 28 pc, a+ = 0.25 μm, s = 2 and q = 4.0, as shown by the dashed black line in Fig. 2. The same model can satisfactorily reproduce the spectral evolution at late times, as depicted in Fig. 3. The optical depth is well determined and robust to changes in the other parameters. There is a strong degeneracy between Rd and a+ because the afterglow flux depends only on the combination |$R_{\rm d} a_+^{-2}$|; however, a+ = 0.25 μm is roughly consistent with Galactic observations (Mathis et al. 1977; Predehl & Schmitt 1995). Varying s does not greatly affect the light curve, but s ≈ 2 is preferred to match the spectral index at late times.
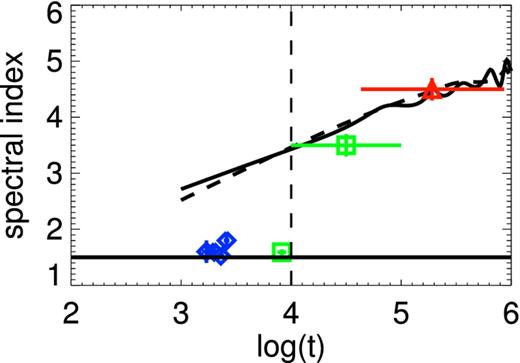
Spectral evolution in GRB 060218. The blue, green, and red points are taken from table 1 in Toma et al. (2007), fig. 1 in Ghisellini et al. (2007a), and Margutti et al. (2015), respectively. The lower solid black line indicates the typical high-energy spectral index of the Band function, Fν ∝ ν−1.5. The upper solid and dashed black lines shows the two-point XRT flux spectral index, log (F(10 keV)/F(0.3 keV))/log (10/0.3), as a function of time for the same pair of models as in Fig. 2. The time when the echo flux first exceeds the prompt flux in our model is shown by the vertical dashed line.
Increasing q while appropriately decreasing Rd results in a light curve with the same initial flux, but a slower late decline. Therefore, a somewhat improved fit can be obtained if values of q > 4 are considered. Taking the same value as above for a+, we find the best overall fit with a reduced chi-squared of 1.0 when τ keV ≈ 0.009, Rd ≈ 6.3 pc, s = 2 and q = 4.76. Figs 2 and 3 show that the light curve and spectral evolution in this higher-q model do not differ greatly from the lower-q model discussed above; as expected, the main difference is a better fit to the few data points at the latest times. Despite the improved fit, we prefer the lower-q model, as q = 4 is more consistent with typical dust measurements and previous dust echo afterglow models. An important takeaway is that, depending on the unknown dust properties a+ and q, Rd can vary by an order of magnitude or more without significantly affecting the light curve. We stress that without a good handle on the characteristics of the circumburst dust, the true value of Rd remains highly uncertain.
The scattering depth τsca at energy 0.8 keV ≲ E ≲ 10 keV can be converted to an optical extinction via the relation τsca/AV ≈ 0.15(E/1 keV)−1.8 (Draine & Bond 2004). For τsca = 0.007 at 1 keV, AV ≈ 0.05, roughly in line with Na i D line observations and the simple estimate above (We note that it is not necessary for these values to coincide: as the typical scattering angle is αsca ∼ 0| $_{.}^{\circ}$|1–1°, the line of sight to the afterglow and the prompt source are separated by ∼αscaRd ∼ 0.1–1 pc. It is possible that the ISM properties could vary on this scale.). We conclude that a moderate amount of dust located between a few parsecs and several tens of parsecs from the progenitor can plausibly explain the anomalous X-ray afterglow.
Due to the gap in observations from 1000 to 30 000 s, the late X-ray light curve in GRB 100316D is difficult to model in detail. None the less, some simple estimates can be made. The prompt X-ray emission has luminosity Lpr ∼ 3 × 1046 erg s−1 and time-scale tpr ∼ 1000 s (Margutti et al. 2013). The X-ray afterglow has luminosity Llate ∼ 2 × 1043 erg s−1 at tlate ∼ 3 × 10⁴ s and decays as t−0.87 (Margutti et al. 2013), so Llatetlate gives a reasonable estimate of the reradiated energy. The above lead to a similar estimate for the optical depth as for GRB 060218, τd ∼ 0.02, or AV ∼ 0.2. One interesting difference between the two bursts is that the spectral index of the late afterglow, βX = −2.5, is harder in GRB 100316D than in GRB 060218 where βX = −4.5 [Notably, GRB 060218 is the only burst with such a steep afterglow spectrum; GRB 100316D is more typical, as other soft-afterglow bursts such as GRB 090417B and GRB 130925A also show βX ∼ −2.5 (Margutti et al. 2015).]. In the echo interpretation, this discrepancy can be explained partially by a difference in the prompt spectrum. Due to the presence of a strong thermal component at low energies, the time-averaged prompt 0.3–10 keV spectrum of GRB 060218 is steeper than in GRB 100316D, where the thermal component is weak and the spectrum is essentially flat at low energies. However, this effect alone is not sufficient, as it only produces a change in spectral index of ∼ 1. Rd and a+ also have a strong effect on βX because they change time-scale for spectral steepening, as does the energy dependence of the scattering cross-section. A larger Rd, smaller a+, or lower value of s (compared to our values for GRB 060218) may be necessary to obtain the correct βX in GRB 100316D. However, due to a lack of data regarding the time dependence of βX and an insufficient light curve, we cannot say which of these effects is the relevant one.
Margutti et al. (2015) have recently argued that four bursts, including GRB 060218 and GRB 100316D, belong to a distinct subclass of transient taking place in a complicated CSM. They base their claim on the unlikelihood of three unrelated properties – high absorption column, soft afterglow spectrum, and long duration – occurring together by chance. They invoke a wind-swept dusty shell to account for the high X-ray absorption and steep afterglow spectrum (through an echo of the prompt emission), and propose shock breakout in a complex local CSM to explain the long duration of prompt emission, preferring this interpretation to one in which the central engine duration is intrinsically long. Our findings support their suggestion that the very soft spectrum of GRB 060218 arises from a dust echo, but as the amount of dust in our model is not particularly high, an especially dense shell is not necessary; the dust could exist in an ISM of typical density and chemistry. We stress that the absorption column implied by dust extinction in our model is not consistent with the X-ray absorption column inferred from the prompt emission, as the latter is larger by a factor of ∼30. For this reason, dust scattering and X-ray absorption are unlikely to be occurring in the same place in GRB 060218. Rather, the X-ray absorption is likely happening at small radii where dust has been evaporated. Also, while our results do indicate a dense envelope around the progenitor star, we also differ from the Margutti et al. (2015) picture by adopting an intrinsically long-lived central engine.
Our results can be compared to two other objects for which dust echo models have been proposed, GRB 130925A (Evans et al. 2014; Zhao & Shao 2014) and GRB 090417B (Holland et al. 2010). The optical extinction inferred from modelling the afterglow as a dust echo is AV = 7.7 mag in GRB 130925A, (Evans et al. 2014), and in GRB 090417B it is AV ≳ 12 mag (Holland et al. 2010). In each case, the amount of dust required to fit the X-ray afterglow via an echo is consistent with the absorbing hydrogen column needed to fit the X-ray spectrum (Holland et al. 2010; Evans et al. 2014). In GRB 090417B, the high extinction can also explain the lack of an optical detection (Holland et al. 2010). In contrast to GRB 060218 and GRB 100316D, GRB 130925A and GRB 090417B appear to have taken place in an unusually dusty environment, with the dust accounting for both the X-ray scattering afterglow and the large NH.
Interestingly, these bursts also differ in their prompt emission. GRB 130925A appears typical of the ultralong class of objects described by Levan et al. (2014), which also includes GRB 101225A, GRB 111209A, and GRB 121027A. Compared to GRB 060218 and GRB 100316D, these ultralong bursts are more luminous and longer lived, and they show variability in their light curves on short time-scales, reminiscent of typical GRBs (Levan et al. 2014). The light curve of GRB 090417B is qualitatively similar to GRB 130925A, and it likewise has a longer time-scale, higher luminosity, and more variability compared to GRB 060218 (Holland et al. 2010). Thus, while Margutti et al. (2015) have made a strong case that GRB 060218, GRB 100316D, GRB 130925A, and GRB 090417B constitute a population distinct from cosmological LGRBs, upon closer inspection GRB 130925A and GRB 090417B differ strikingly from GRB 060218 and GRB 100316D. It seems, then, that three discrete subclasses are needed to explain their observations: (1) smooth light curve, very low luminosity ultralong bursts like GRB 060218/GRB 100316D, with echo-like afterglows implying a modest amount of dust; (2) spiky light curve, somewhat low-luminosity ultralong bursts like GRB 130925A/GRB 090417B, with echo-like afterglows implying a large amount of dust; and (3) spiky-light-curve bursts with typical time-scale and luminosity, and synchrotron afterglows.
The underlying reason why the afterglow is dominated by dust-scattered prompt emission in some cases, and synchrotron emission from external shocks in others, is unclear. One possibility is that kinetic energy is efficiently converted to radiation during the prompt phase, resulting in a lower kinetic energy during the afterglow phase as discussed by Evans et al. (2014) in the context of GRB 130925A. A second possibility is that the external shocks do not effectively couple energy to post-shock electrons and/or magnetic fields. We return to this question at the end of Section 4.7.
4.5 Radio afterglow
An essential feature of the radio afterglow in GRB 060218 is that it shows no evidence for a jet break, but instead decays as a shallow power law in time, with Fν ∝ t−0.85 at 22.5 GHz (Soderberg et al. 2006). This behaviour runs contrary to analytical models of GRB radio afterglows (e.g. Rhoads 1999; Sari, Piran & Halpern 1999) which predict that, after a relatively flat decay during the Blandford–McKee phase, the on-axis light curve should break steeply to t−p after a critical time tj. Here, p is the power-law index of accelerated post-shock electrons, i.e. N(E) ∝ E−p, which typically takes on values 2 < p < 3. The steepening is due to a combination of two effects that reduce the observed flux: when the jet decelerates to Γ ∼ θ0, the jet edge comes into view, and also the jet begins to expand laterally. The same general behaviour of the radio light curve is also seen in numerical simulations (Zhang & MacFadyen 2009; van Eerten & MacFadyen 2013). The steep decay lasts until a time ts, which is the time-scale for the flow to become quasi-spherical if sideways expansion is fast, i.e. if the increase in radius during sideways expansion is negligible (Livio & Waxman 2000). While detailed simulations have demonstrated that the transition to spherical outflow is much more gradual and that the flow remains collimated and transrelativistic at ts (Zhang & MacFadyen 2009; van Eerten & MacFadyen 2012), numerical light curves none the less confirm that analytical estimates of the radio flux that assume sphericity and non-relativistic flow remain approximately valid for on-axis observers at t > ts (Wygoda, Waxman & Frail 2011; van Eerten & MacFadyen 2012). After ts, the light curve gradually flattens as the flow tends towards the Sedov–Taylor solution, eventually becoming fully non-relativistic on a time-scale tNR. Therefore, the smooth and relatively flat light curve of GRB 060218 over the period 2–20 d suggests one of two possibilities: either we observed the relativistic phase of an initially wide outflow that took tj ≳ 20 d to enter the steep decay phase, or we observed the late phase of an outflow that became transrelativistic in ts ≲ 2 d and that may have been beamed originally.
In either scenario, a light curve as shallow as t−0.85 is not easily produced in the standard synchrotron afterglow model. One issue is that such a shallow decay suggests that the circumstellar density profile and post-shock electron spectrum are both flatter than usual. Throughout the period of radio observations, the characteristic frequency νm, the synchrotron self-absorption frequency νa, and the cooling frequency νc are related by νm < νa < νc (Soderberg et al. 2006). As the 22.5 GHz band lies between νa and νc, the expected light-curve slope in the relativistic case is t3(1 − p)/4 for a constant density circumstellar medium, and t(1 − 3p)/4 for a wind-like medium (Fan et al. 2006; Leventis et al. 2012). In the non-relativistic limit, the slopes are t3(7 − 5p)/10 (constant density) and t(5 − 7p)/6 (wind; Leventis et al. 2012). In order to fit the observed slope t−0.85, we require a constant density medium and p = 2.1 (relativistic) or p = 2.0 (non-relativistic). However, Panaitescu & Kumar (2002) found that the afterglows of several typical GRBs were best explained with a constant density model, and a low p-value was indicated for a number of bursts in their sample. Hence, GRB 060218 does not seem so unusual in this regard.
A second point of tension with the shallow light curve is the observed Lorentz factor. Soderberg et al. (2006) inferred a mildly relativistic bulk Lorentz factor Γ ≃ 2.4 from an equipartition analysis. However, they based their analysis on the treatment of Kulkarni et al. (1998), which did not include the effects of relativistic expansion. A more accurate calculation that takes relativistic and geometrical effects into account was carried out by Barniol Duran, Nakar & Piran (2013). From fig. 2 in Soderberg et al. (2006), we estimate that, at day 5, the spectral flux at peak was Fp ∼ 0.3 mJy and the peak frequency was νp = νa ∼ 3 GHz. Applying equation 5 in Barniol Duran et al. (2013), we obtain a bulk Lorentz factor Γ ≈ 0.8. On the other hand, using their equation 19 for the equipartition radius RN in the non-relativistic limit, we find β ∼ RN/ct ≈ 1.3. These results indicate that the outflow is in the mildly relativistic (βΓ ∼ 1) limit, where neither the Blandford–McKee solution (which applies when Γ ≫ 2) nor the Sedov–Taylor solution (which applies when β ≪ 1) is strictly valid. As discussed above, one expects a relatively shallow light-curve slope in these limits, but during the transrelativistic transitional regime the slope tends to be steeper. In spite of these caveats, we press on and compare the relativistic and non-relativistic limits of the standard synchrotron model.
The possibility of a wide, relativistic outflow was first considered by Soderberg et al. (2006). Their spherical relativistic blast wave model predicts an ejecta kinetic energy Ek ∼ 2 × 1048 erg and a circumburst density n ∼ 100 cm−3, assuming fractions ϵe ∼ 0.1 and ϵB ∼ 0.1 of the post-shock energy going into relativistic electrons and magnetic fields, respectively. In order to postpone the jet break, they presumed the initial outflow to be wide, with θ0 ≳ 1.4 (Soderberg et al. 2006). Yet, as Toma et al. (2007) pointed out, given the isotropic-equivalent gamma-ray energy 6 × 1049 erg, the parameter set of Soderberg et al. (2006) predicts an unreasonably high gamma-ray efficiency, ηγ ≈ 98 per cent. Fan et al. (2006) refined this analysis and showed that parameters Ek ∼ 1050 erg, n ∼ 100 cm−3, ϵe ∼ 10−2, and ϵB ∼ 10−3 also fit the data while keeping the gamma-ray efficiency within reason, but the origin of the spherical (or very wide) relativistic outflow is still unclear. One possibility is that the some fraction of the SN ejecta is accelerated to relativistic speeds. However, Tan, Matzner & McKee (2001) have found that, even for a large SN energy ∼1052 erg, only a fraction ∼10−4 goes into relativistic ejecta. It therefore seems implausible that ∼5 per cent of the SN energy 2 × 1051erg could be coupled to relativistic material in GRB 060218. A choked jet in a low-mass envelope, as discussed by Nakar (2015), provides an alternative way to put significant energy into a quasi-spherical, relativistic flow.
Given the difficulties with the relativistic scenario, Toma et al. (2007) considered the possibility that the radio emission comes from the late spherical phase of an originally collimated outflow instead. With the same assumption of ϵe = ϵB = 0.1, Toma et al. (2007) infer the same kinetic energy and circumstellar density as Soderberg et al. (2006). The advantage of their view is that it eliminates the efficiency problem, as the isotropic-equivalent kinetic energy during the early beamed phase is larger by a factor |$2/\theta _0^2$|.
Barniol Duran et al. (2015) also looked at a mildly relativistic synchrotron model in the context of SN shock breakout. In this case, the light-curve decays more slowly since energy is continuously injected as the outer layers of the SN ejecta catch up to the shocked region. As a result, the radio light curve is better fit by a wind profile than a constant density in the breakout case (Barniol Duran et al. 2015). Their study adopts a fixed ϵe = 0.2, and a fixed energy and Lorentz factor for the fast shell dominating breakout emission, Ef = 2 × 1050 erg and γf = 1.3, which are derived from the relativistic breakout model of Nakar & Sari (2012). They then vary ϵB and the wind density parameter A*, concluding that ϵB = 1.5 × 10⁻⁴ and A* = 10 give the best fit. Due to degeneracy, however, other parameter sets with different energy and ϵe may fit the radio light curves as well.
Unfortunately, such degeneracies involving the unknown quantities ϵe and ϵB are an unavoidable limitation when deriving Ek and n in the standard synchrotron model. The available observations give only the specific flux Fν, the self-absorption frequency νa, and an upper limit on the cooling frequency νc, which is not sufficient to uniquely determine the four model parameters. In practice, this is typically addressed by fixing two of the parameters to obtain the other two. (For example, Soderberg et al. 2006 choose ϵe and ϵB; Barniol Duran et al. 2015 fix ϵe and Ek.) We take a different approach. In this section and Section 4.6, we consider a number of constraints from dynamics, time-scales, and direct radio, optical, and X-ray observations, assuming that the emission is from the late phase of an initially collimated jet. We apply these conditions to constrain the available (Ek, n, ϵe, ϵB, θ0, γ) parameter space. We then consider whether any reasonable parameter set is consistent with a jet that could produce the observed thermal X-rays through dissipation at early times, as described in Section 4.1.
We begin with the constraints inferred directly from radio observations. We have νa ∼ 4 × 10⁹ Hz at 5 d, Fν(22.5 GHz) ∼ 0.25 mJy at 3 d, and νc ≲ 5 × 10¹⁵ Hz so that the synchrotron flux remains below the observed X-ray afterglow flux throughout observations (Soderberg et al. 2006). Lower limits on Ek and n can be deduced by assuming ϵe < 1/3 and ϵB < 1/3. For a relativistic blast wave with p = 2.1, we have |$\epsilon _{{\rm B},-2}^{0.34} \epsilon _{{\rm e},-1}^{0.36} C_{\rm p}^{0.36} E_{{\rm k},51}^{0.34} n^{0.33} \sim 0.44$|, |$\epsilon _{{\rm B},-2}^{0.78} \epsilon _{{\rm e},-1}^{1.1} C_{\rm p}^{1.1} E_{{\rm k},51}^{1.28} n^{0.5} \sim 0.0032$|, and |$\epsilon _{{\rm B},-2}^{-1.5} E_{{\rm k},51}^{-0.5} n^{-1} \lesssim 0.43$| (Fan et al. 2006), where Cp = 13(p − 2)/3(p − 1) ≈ 0.39. In this case, we find Ek ≳ 7 × 1047 erg and n ≳ 3 cm−3. Similarly, in the non-relativistic limit Toma et al. (2007) derived |$\epsilon _{{\rm B},-2}^{1/3} \epsilon _{{\rm e},-1}^{1/3} E_{{\rm k},51}^{1/3} n^{1/3} \sim 1$|, |$\epsilon _{{\rm B},-2}^{3/4} \epsilon _{{\rm e},-1} E_{{\rm k},51}^{1.3} n^{0.45} \sim 0.003$|, and |$\epsilon _{{\rm B},-2}^{3/2} E_{{\rm k},51}^{3/5} n^{0.9} \gtrsim 0.4$|. This leads to the constraints Ek ≳ 1 × 1047 erg and n ≳ 60 cm−3.
The minimum synchrotron energy Emin provides a further constraint on burst energetics. In general, calculating Emin requires integrating the specific synchrotron luminosity Lν over a range of frequencies νmin–νmax. However, when p ≃ 2.5, the dependence of Emin on νmin, νmax, and p is weak (Longair 2011). In that case, if Lν is measured at frequency ν, one can obtain a rough estimate of Emin by setting ν = νmin: with quantities given in cgs units, |$E_{{\rm min}} \simeq 8.0 \times 10^{13} (1+\eta )^{4/7} V^{3/7} \nu ^{2/7} L_\nu ^{4/7}$| erg (Longair 2011), where η is the ratio of proton energy to electron energy, which is not known. Soderberg et al. (2006) estimated that the size of the radio-emitting region is R = 3 × 1016 cm at t = 5 d, so the emitting volume at that time can be approximated by |$V \sim \frac{4}{3} \pi R^3 \sim 1.1 \times 10^{50}$| cm3. At the same time, the flux density at ν = 4.86 GHz was Sν = 300 μJy, implying a specific luminosity Lν = 7.5 × 1027 erg s−1 Hz−1 given the distance D = 145 Mpc. With these parameters, we find Emin ∼ 1.2 × 1047(1 + η)4/7 erg. Compared to the above estimate, this puts a stricter lower limit on the energy when η is large.
A further condition comes from time-scale considerations, since the steep t−p part of the light curve should fall outside of the observational period. For an on-axis observer, a numerically calibrated expression for the jet break time in the observer frame is |$t_{\rm j} = 3.5 E_{{\rm iso},53}^{1/3} n^{-1/3} (\theta _0/0.2)^{8/3}$| d (van Eerten, Zhang & MacFadyen 2010). In the relativistic case, we need tj ≳ 20 d, so |$E_{k,51}^{1/3} n^{-1/3} (\theta _0/0.2)^2 \gtrsim 5.7$|. On the other hand, the time ts that roughly marks the end of the steep light-curve phase is |$t_{\rm s} \simeq 365 E_{{\rm iso},53}^{1/3} n^{-1/3} (\theta _0/0.2)^{2/3}$| d (Livio & Waxman 2000). Since ts ≲ 2 is needed for the non-relativistic model, we have |$E_{k,51}^{1/3} n^{-1/3} \lesssim 0.0055$|. Note that |$t_{\rm j} \sim (\theta _0^2/4)t_{\rm s}$|.
For typical burst energies and CSM densities, the relativistic scenario requires a very wide opening angle to make tj sufficiently large. For example, the parameters of Soderberg et al. (2006) require θ0 ≳ 80°. An equally large θ0 is inferred for GRB 100316D. In that object, the radio afterglow has a similar slow temporal decay, but the time-scale of the Fν peak at 8.5 GHz was ∼10 times longer, occurring at 30 d (Margutti et al. 2013) as compared to 3 d in GRB 060218 (Soderberg et al. 2006), and the radio luminosity is about 10 times higher at 20 d (Margutti et al. 2013). Assuming the same microphysics, this implies about the same burst energy, but a circumstellar density that is higher by a factor of 100–1000 (Margutti et al. 2013), even for a quasi-spherical outflow. It seems unusual that the progenitors of these similar bursts have such different circumstellar environments. In addition, the higher density leads to a smallertj than in GRB 060218, while radio observations show a flat light curve over the period 20–70 d (Margutti et al. 2013) implying tj ≳ 70 d, larger than GRB 060218. This problem is alleviated by considering a wind-like medium as in Margutti et al. (2013), but in that case the expected light curve is ∝ t−3/2 for p = 2, which seems too steep to fit observations unless one adopts p < 2.
One can consider the non-relativistic case instead, but due to the weak dependence on Ek and n, the condition on ts is also hard to satisfy unless the burst energy is extremely low or the CSM is extremely dense. In addition, because the flow is still highly aspherical at t ∼ ts, the model light-curve slope will be too steep if t ≳ ts only holds marginally, even if the flux is approximately correct. The slope does not settle to the limiting Sedov–Taylor value until the outflow sphericizes, which according to numerical simulations does not occur until |${\sim } 5 t_{{\rm NR}} \simeq 4700 E_{{\rm k},51}^{1/3} n^{-1/3} (\theta _0/0.2)^{-2/3} {\rm \,d} \gg t_{\rm s}$| (Zhang & MacFadyen 2009; van Eerten & MacFadyen 2012).
The conditions ϵe < 1/3, ϵB < 1/3, Ek > Emin, νc < 5 × 10¹⁵ Hz, and the constraint on tj (or ts) can be conveniently expressed in the ϵe–ϵB plane. The result is shown in Fig. 4 (we do not plot the line Ek = Emin as it is largely irrelevant as long as η ∼ 1.). The first two panels show the standard, constant CSM density case, for a relativistic flow with p = 2.1 and a non-relativistic flow with p = 2.0, respectively. In the relativistic case, if the jet is very wide (θ0 ≃ 1.4), the tj-condition can be marginally satisfied (tj ≳ 10 d) for ϵB ≳ ϵe as depicted in the top panel. However, because tj is sensitive to θ0, the available parameter space rapidly shrinks when θ0 is reduced: the green region disappears from the plot when θ0 ≲ 1.0, and the yellow region when θ0 ≲ 0.7. Thus, the relativistic scenario disfavours a tightly collimated outflow for any sensible combination of ϵe and ϵB. In the non-relativistic case, shown in the middle panel, we see that the constraints ts < 2 d and νc < 5 × 10¹⁵ Hz cannot be jointly satisfied for any choice of parameters. At best, the ts-condition can be met marginally (ts ≲ 4 d) if 10− 3 ≲ ϵB/ϵe ≲ 10− 1 [Here, we also show the condition t(β = 1) < 2 d, which was used by Toma et al. 2007. However, as discussed above and in Wygoda et al. 2011, the radio flux still deviates considerably from the Sedov–Taylor prediction at this time because the outflow is semirelativistic.]. The situation changes if some additional mass is swept up by the jet before the first radio observation, in which case the condition Ek < Mswc2 replaces the upper limit on ts. This scenario is shown in the bottom panel, assuming Msw = 10−5 M⊙ (corresponding to an isotropic mass 10−3 M⊙ for θ0 = 0.2). Compared to the standard cases, this case accommodates a larger set of possible parameters. The effect of increasing (decreasing) Msw is to increase (decrease) the size of the green region by moving the critical line Ek = Mswc2 towards the lower left (upper right).
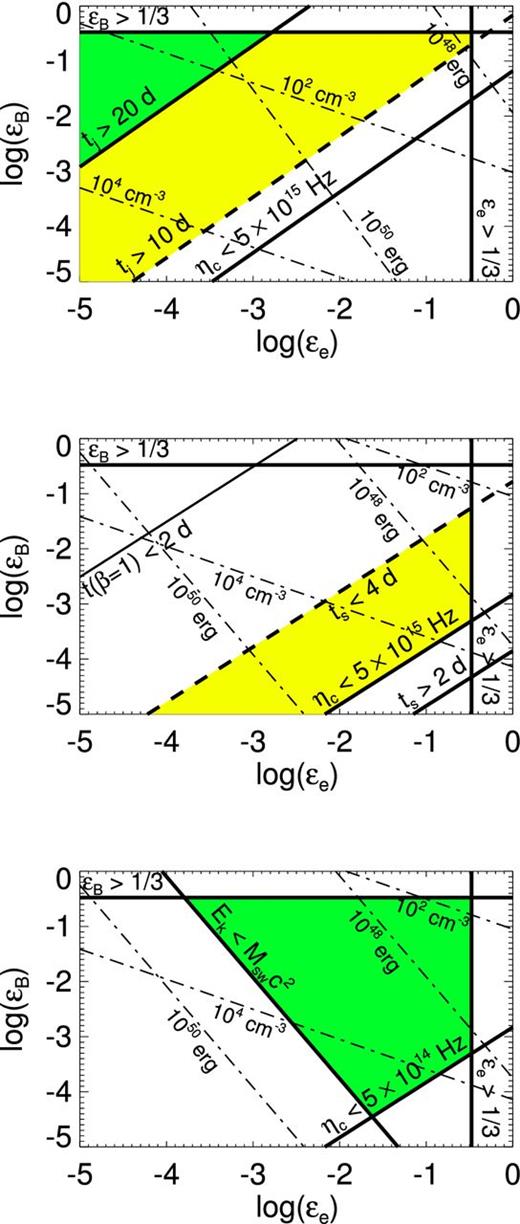
Constraints described in Section 4.5, depicted in the ϵe–ϵB plane. In each plot, thin dash–dotted lines of constant Ek (1048 and 1050 erg) and n (102 and 104 cm−3) are drawn. The conditions ϵB = 1/3, ϵe = 1/3, and νc = 5 × 10¹⁵ Hz are shown as heavy solid lines, as labelled in the diagram. Regions where all conditions are met are shaded in green, while yellow regions indicate that the conditions are met if the time-scale constraints are relaxed by a factor of 2. Top: the relativistic case with p = 2.1. The condition tj = 20 d is shown, assuming a wide jet (θ0 ≃ 1.4). Middle: the non-relativistic case with p = 2.0, assuming the same density for all r > Rext, with the conditions ts = 2 d, ts = 4 d, and t(β ≃ 1) = 2 d. Note that ts ≲ 2 d and νc < 5 × 10¹⁵ Hz cannot be jointly satisfied. Bottom: the non-relativistic case, assuming some additional mass Msw = 10−5 M⊙ is swept up prior to 2 d. See the text for discussion.
4.6 Jet propagation
We now examine the evolution of the jet as it drills the star and breaks out into the surrounding medium. For our picture so far to be plausible, several conditions must be met. First, the initial kinetic energy of the outflow Eiso must exceed the prompt isotropic radiated energy Eγ, iso = 6 × 1049 erg, i.e. the radiative efficiency ηγ = Eγ, iso/Eiso < 1. Using equation (5), this implies γ ≳ 2. Note that |$E_{\rm iso} = E_{\gamma _{{\rm iso}}} + E_{k,{\rm iso}}$|, where |$E_{k,{\rm iso}} = (2/\theta _0^2) E_{\rm k}$|. Secondly, the total breakout time from the stellar core and extended envelope, tb = tb,* + tb, ext, should be shorter than the duration of prompt X-rays tL. Thirdly, the interaction with the extended envelope should be dominated by the SN, and not by the jet or cocoon. In other words, the jet/cocoon system should not sweep up or destroy the envelope before the SN has a chance to interact with it. Finally, we expect that the energy in relativistic ejecta will be less than the SN energy: Ej < ESN.
In what follows, we scale the collimation-corrected jet luminosity Lj to 1046 erg s−1, corresponding to a jet energy Ej ∼ LjtL ∼ 3 × 1049 erg. We assume a constant jet luminosity for simplicity (A time-varying luminosity does not affect our general conclusions, as long as the average value of Lj remains the same.).
To ensure that the interaction with the envelope is dominated by the SN ejecta, the SN energy should exceed the energy of the jet-blown cocoon, so that the former overtakes the latter. The energy deposited into the cocoon up to breakout is Ec ∼ Lj(tb − Rb/c) (Lazzati, Morsony & López-Cámara 2015), where Rb is the breakout radius. There are two dynamically distinct cocoons that can potentially disturb the stellar envelope. First, while the jet is within the stellar core, material entering the jet head escapes sideways to form a cocoon of shocked stellar matter. When the jet breaks out of the stellar core and enters the surrounding envelope, this ‘stellar cocoon’ also breaks out and begins to sweep the envelope as it expands outwards. Then, as the jet continues to propagate through the envelope, it blows a second cocoon containing shocked envelope material. This ‘envelope cocoon’ expands laterally as the jet propagates, and then breaks out into the circumstellar medium once the jet reaches the envelope's edge. Here, we show that these cocoons have a negligible effect on the envelope dynamics compared to the SN, because the stellar cocoon is too slow and the envelope cocoon is too narrow.
As discussed above, the jet stays collimated in the envelope, but the jet head may become relativistic. In this limit, the lateral speed of the cocoon is |$\beta _{\rm c} \sim \tilde{L}^{1/2} \theta _0$| (Bromberg et al. 2011b), and since βh ≈ 1, θc ∼ βc. For a collimated jet, |$\tilde{L} \lesssim \theta _0^{-4/3}$| (Bromberg et al. 2011b), so we have θc ≲ θ1/3 < 1. As the pressure of the envelope cocoon rapidly drops after it breaks out from the envelope's edge and expands freely into the low-density circumstellar medium, little sideways expansion through the envelope is expected after breakout. Thus, as long as θ0 is small, the passage of the jet and envelope cocoon leaves the envelope relatively intact, and the SN-envelope interaction is quasi-spherical. Note that it is not strictly necessary for the jet to be collimated by the envelope in our model. In principle the jet may be uncollimated, with |$\tilde{L}$| somewhat larger than |$\theta _0^{-4/3}$|, as long as θc remains small, but in practice this regime is not attained in GRB 060218.
Ideally, the jet head should break out of the stellar core before the SN shock. This guarantees that the jet will reach the edge of the envelope before the SN, so the jet will be seen first. Comparing the SN breakout time tSN ∼ R*(2ESN/MSN)− 1/2 to the breakout time in equation (8), one finds |$t_{{\rm b},*}/t_{{\rm SN}} \sim 0.6 L_{{\rm j},46}^{-1/3} R_{{\rm c},11}^{-1/3} (\frac{M_{\rm c}}{2\,\,\mathrm{M}_{\odot }})^{-1/6} (\frac{E_{{\rm SN}}}{2 \times 10^{51} {\rm \,erg\,s}^{-1}})^{1/2} (\theta _0/0.2)^{4/3}$|. This condition is satisfied for |$L_{{\rm j},46} \gtrsim 0.2 (\frac{M_{\rm c}}{2\,\,\mathrm{M}_{\odot }})^{-1/2} (\frac{E_{{\rm SN}}}{2 \times 10^{51} {\rm \,erg\,s}^{-1}})^{3/2} (\theta _0/0.2)^4$|, which is only sometimes met for the parameters considered here. However, even if the SN shock reaches the edge of the star first, the jet breaks out soon after. This is because, after the SN crosses the core, the core density drops as ρc ∝ (vSNt)−3, and as βh depends inversely on ρc, the jet soon accelerates to cβh > vSN. Thus, it may be possible for this constraint to be violated, and we do not rule out models for which vSN > cβh initially.
We can get a grasp on the allowed region of γ–θ0 parameter space by using equations (3) and (5) to convert the conditions ηγ < 1, Ej < ESN, Ej ≳ Emin, |$\gamma \gtrsim \theta _0^{-1}$|, tb ≲ tL, vc,* < vext, and cβh < vSN to relations between γ and θ0. We show the result in Fig. 5. We see that the available parameter space is bound chiefly by Ej < ESN from above, |$\gamma \gtrsim \theta _0^{-1}$| from the left, θ0 ≲ π/2 from the right, and ηγ ≲ 1 from below. The other important conditions are always satisfied when these four constraints are met. Note that the conditions related to the jet and cocoon do not necessarily apply when θ0 is large, because in that limit the explosion is quasi-spherical instead of jet-like, but the conditions on the overall burst energetics are still relevant. The possible values of Ej, γ, and θ0 lie in the range 7 ≲ Ej, 48 ≲ 2 × 10³, 2 ≲ γ ≲ 25, and 0.04 ≲ θ0 ≲ π/2.
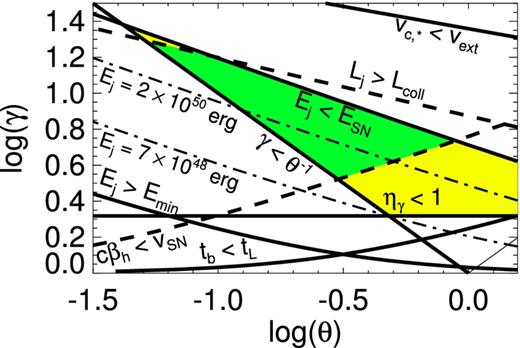
Constraints described in Section 4.6, depicted in the θ–γ plane. The conditions Ej > Emin, Ej > ESN, ηγ < 1, γ ≳ θ− 1, tb < tL, and vc,* < vext are drawn as heavy solid lines. Two other constraints that may be marginally violated (Lj < Lcoll and cβh > vSN) are shown as dashed lines. The regions of parameter space that satisfy all the constraints, and only the strict constraints, are painted green and yellow, respectively. Curves of constant jet energy are shown as thin, dash–dotted lines. See the text for discussion.
Three general classes of solution can satisfy all of the necessary conditions.
Low kinetic energy, narrow beam, low Lorentz factor. For low jet energies, e.g. Ej ≃ 7 × 1048 erg s−1, the jet is confined to a narrow range around θ0 ≃ 0.5 and γ ≃ 2.1. The isotropic jet energy in this case is Eiso ≃ 6 × 1049 erg s−1, and the radiative efficiency is ηγ ≃ 0.5, implying a mildly hot jet. The kinetic energy during the afterglow phase is Ek ≃ 3 × 1048, which gives − 2.5 ≲ log ϵe ≲ −0.8, − 3.6 ≲ log ϵB ≲ −0.5, and 2.5 ≲ log n ≲ 3.9 using the bottom panel of Fig. 4. This solution is similar to that of Toma et al. (2007), who also inferred a mildly hot jet.
High kinetic energy, narrow beam, high Lorentz factor. For higher kinetic energies, the model is less restrictive: for example, Ej = 2 × 1050 erg gives 0.1 ≲ θ0 ≲ 1.5, allowing for either narrow or wide jets. In the narrow jet case of θ0 ≃ 0.1, we have Eiso ≃ 4 × 1052 erg s−1 and γ ≃ 10. The radiative efficiency in this case is low, ηγ ≃ 2 × 10⁻³, and therefore Ek ≈ Ej. In order to accommodate the higher energy, this model requires lower than standard values for ϵe and/or ϵB: − 5.3 ≲ log ϵe ≲ −2.6 and − 5.4 ≲ log ϵB ≲ −0.5. For this reason, this scenario has not been considered previously. The CSM density in this case is 3.5 ≲ log n ≲ 5.7.
High kinetic energy, wide beam, high Lorentz factor. A high jet energy directed into a wide (θ0 → π/2) outflow is also allowed. In this case Ej ≈ Eiso. For Ej ≃ 2 × 1050 erg, we find γ ≃ 2.6 and ηγ ≃ 0.3. Using the top panel of Fig. 4, we find − 3.9 ≲ log ϵe ≲ −2.7, − 3.1 ≲ log ϵB ≲ −0.5, and 1.7 ≲ log n ≲ 3.0. This model is similar to the model proposed by Fan et al. (2006), and also consistent with the picture in Nakar (2015), since in that case there is reason to expect a quasi-spherical explosion.
Our picture favours models with a narrow jet, because a wide jet would considerably disrupt the circumstellar envelope, which is problematic for our optical model discussed in Section 4.3. However, we do not have a strong reason to prefer a high jet energy versus a low energy one; each option offers some advantage. The low-energy case uses typical values for ϵe and ϵB, and more readily transitions to a non-relativistic outflow without the need for an extreme CSM density. On the other hand, the high-energy case is compatible with a wider variety of jets with various θ0 and γ, and requires a less efficient dissipation mechanism since ηγ ≪ 1.
4.7 Prompt non-thermal emission
Because GRB 060218 adheres to several well-known GRB correlations, it is worth considering whether this object has the same emission mechanism as standard GRBs. In this section, we attempt to glean as much as possible about the emission mechanism in GRB 060218, assuming that the source of the non-thermal X-rays is a mildly relativistic jet. To do so, we first lay out a simple empirical description for the prompt emission that preserves the essential features of the observed spectrum and light curve. We then consider a number of jet scenarios for the prompt emission.
4.7.1 A simple empirical description of GRB 060218
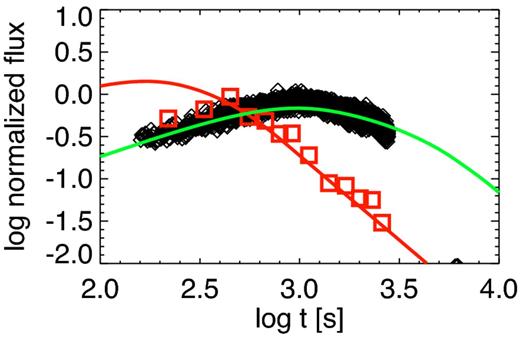
Light curves obtained using a Band spectrum with time-varying parameters Ep ∝ t−1.6 and F0 ∝ t1.0, and constant spectral indices β1 = −0.13 and β2 = −1.9. Model light curves in the 0.3–10 keV band (green) and the 15–150 keV band (red) are compared with XRT data from Campana et al. (2006, black diamonds) and BAT data from Toma et al. (2007, red squares). Both light curves are fitted well after 400 s, although the 15–150 keV flux is too high at early times.
4.7.2 Towards an IC model
The presence of a thermal component in the XRT band with a time-scale and luminosity comparable to the non-thermal component motivates consideration of an IC mechanism for the prompt emission. Before investigating physical situations that might lead to strong IC upscattering, we first discuss some features generic to IC models for GRB 060218. For now, we assume only that some hot electrons are present in the burst environment, but place no condition on the location of these electrons or the mechanism of their acceleration.
First, if the primary photon source is approximately monochromatic (as is the case for the observed constant-temperature thermal component), then the quickly decaying peak energy implies that the scattering electrons are rapidly decelerating in the comoving frame. If the source frequency is ν0 ∼ kBT0 in the observer frame, and the electrons dominating the radiation have comoving Lorentz factor γp, then the IC component will peak at |$E_{\rm p} \sim \gamma _{\rm p}^2 k T_0$|. This implies γp ∝ t−0.8, since Ep ∝ t−1.6 (Toma et al. 2007) and T0 is approximately constant (Campana et al. 2006). Suppose the electrons are accelerated to characteristic Lorentz factor γm, and can cool to Lorentz factor γc in time t. If cooling is slow (i.e. γm > γc), then γp ∼ γm. On the other hand, if cooling is rapid (γc > γm), then γp ∼ γc when p < 3, or γp ∼ γm when p > 3, because the νFν spectrum goes as ν(3 − p)/2 between |$\nu _{\rm m} \equiv \gamma _{\rm m}^2 k T_0$| and |$\nu _{\rm c} \equiv \gamma _{\rm c}^2 k T_0$| (Sari, Piran & Narayan 1998). Ep evolves from ∼40 keV at first detection to ∼1 keV at 2000 s (Kaneko et al. 2007), and kBT0 ≃ 0.17 keV for most times, implying that γp varies from ∼15 to 2 throughout the prompt phase.
Secondly, the scattering medium is at most moderately optically thick, i.e. the electron scattering optical depth is τe ≲ 1. This follows from the observation of distinct thermal and non-thermal components, since when τe ≫ 1, essentially all of the photons undergo multiple scatterings, resulting in a single non-thermal peak. A rough estimate of τe can be made by comparing the number of thermal and non-thermal photons. The thermal component, with peak luminosity Lth ∼ 1 × 1046 erg s−1 and time-scale tth ∼ 3000 s, carries Nth ∼ Lthtth/kT0 ∼ 1 × 1059 photons. The non-thermal component has Lnt ∼ 3 × 1046 erg s−1 at peak, duration tnt ∼ 1000 s, and peak energy Ep ∼ 1 keV near maximum light, and therefore contains Nnt ∼ 2 × 1058 photons. This implies ∼1/6 of thermal photons are scattered by electrons with γe ≃ γp, i.e. τe ∼ 0.2. Note that Nth ∝ Ltht ∝ t1.8 according to our model for thermal emission in Section 4.1, while Nnt ∝ F0t ∝ t2 according to the Band function model described earlier in this section. Hence τe ∝ t0.2 is approximately constant in time in the simplest description.
Thirdly, the non-thermal luminosity exceeds the thermal luminosity throughout most of the evolution. This implies that the Compton parameter |$y \sim \tau _{\rm e} \langle \gamma _{\rm e}^2 \rangle \gtrsim 1$|. |$\langle \gamma _{\rm e}^2 \rangle$| represents the average gain per scattering. Because τe ≲ 1, we require |$\langle \gamma _{\rm e}^2\rangle \gtrsim \tau _{\rm e}^{-1} \gtrsim 1$| to get y ≳ 1, suggesting at least mildly relativistic electrons. Since the total non-thermal luminosity is |$L_{{\rm nt}} \sim \tau _{\rm e} \langle \gamma _{\rm e}^2 \rangle L_{\rm th}$|, we can write y ∼ Lnt/Lth. Near maximum light, when the non-thermal component peaks in the XRT band, we can estimate y directly: at 1000 s we have Lnt/Lth ∼ y ∼ 6, and at 3000 s we have Lnt ≈ Lth and y ∼ 1. In our simple Band function description, y ∝ EpF0/Lth ∝ t−1.4, consistent with the values above.
Finally, the prompt spectrum holds information about the distribution of scattering electrons. For electrons distributed as a power law in energy with index p, the spectral slope above νc and νm is given by Fν ∝ ν−p/2. The high-energy spectrum in GRB 060218 has typical index β2 ≈ −1.5, but β2 varies from −3 to −1, implying p is in the range 2–6 with typical value p ≈ 3. While most GRBs have p-values closer to 2, p = 3 is not outside of the observed spread in p-values (Panaitescu & Kumar 2002).
In summary, any IC model for GRB 060218 should be in the limit of moderately small scattering optical depth but appreciable energy gain, so that the thermal component carries most of the photons (i.e. Nnt/Nth ∼ τe ≲ 1), but the non-thermal component carries most of the energy (i.e. Ent/Eth ∼ y ≳ 1). τe most likely varies slowly in time, while y and γp decrease rapidly. We now look at how well three different IC models satisfy these criteria.
4.7.3 The photospheric model
In the past several years, prompt thermal X-rays have been inferred from spectral fits in a number of GRBs, prompting the investigation of Comptonized photospheric models for the primary radiation (for a recent review, see Pe'er 2015, and references therein). In this picture, some of the bulk kinetic energy is dissipated into leptons within the jet, perhaps by internal shocks or magnetic effects. Depending on the optical depth at which the dissipation occurs, different emergent spectra are possible. Numerical simulations by Chhotray & Lazzati (2015) have shown that, for leptons initially distributed as a power law N(E) ∝ E−p (as typically assumed for shock heating), the observed spectrum takes the form of a thermal component with a high-energy power-law tail for relatively low dissipation optical depth τdiss ∼ 0.01–0.1. This type of spectrum is qualitatively similar to the observed spectrum of GRB 060218. If the dissipation optical depth is decreasing with time, then one expects the peak energy to continuously decrease and the non-thermal component to become relatively weaker until only the thermal component remains. This, too, is qualitatively consistent with GRB 060218, where the non-thermal component gradually fades, leaving a blackbody-dominated spectrum by ∼7000 s.
However, the photospheric view is not without its problems. For one, it is unclear how quickly Ep decays. In cosmological GRBs, the peak of the non-thermal component and the temperature of the thermal component are observed to be correlated, i.e. |$E_{\rm p} \propto T_0^{\alpha _T}$| with αT typically 1–2, and T0 typically evolves with time (Burgess et al. 2014). GRB 060218 does not obey this correlation, nor does it show evidence for an evolving temperature. Nevertheless, the photospheric model provides a reasonable framework to interpret the early spectrum in GRB 060218, and is deserving of further attention. More work is needed to understand subphotospheric emission, particularly in the low luminosity and small Lorentz factor limit, and in the case where a dense envelope surrounds the progenitor star, but detailed photospheric modelling is beyond the scope of the current paper.
4.7.4 IC emission from external shocks in a long-lived jet
A long-lived central engine not only serves as a possible source of strong photospheric emission, but also influences ejecta dynamics by driving shocks into the surrounding medium. Here, we investigate IC scattering of prompt thermal photons from relativistic electrons in an engine-sustained reverse shock (RS) as a source for the observed prompt non-thermal emission.
First, we argue against the FS as the predominant IC emission site, because in this case obtaining a rapid decline of both the peak energy and the high-energy light curve is difficult. Let the density of CSM as a function of radius be ρ ∝ r−α. A steep Ep decline implies a rapid deceleration, which in turn suggests a flat CSM density profile so that the FS sweeps up mass more quickly. Yet, the optical depth through the shocked region τ ∼ κρr ∝ r1 − α actually increases with time when α < 1. Compounding this with the rising thermal luminosity Lth ∝ tk, the peak spectral luminosity (Lν, max ∝ Lthτ ∝ tkr1 − α in the optically thin case) rises sharply with time in a flat density distribution. Since the BAT band lies above the peak energy, the luminosity there scales as |$L_{{\rm BAT}} \propto L_{\nu ,{\rm max}} \nu _{\rm c}^{1/2} \nu _{\rm m}^{(p-1)/2}$| (Sari et al. 1998). Whether the peak is due to νc or νm, the rising Lν, max makes it difficult to ever obtain a BAT flux that declines faster than the peak energy in the case where the FS dominates emission.
This problem is alleviated by considering the RS as the emission site instead. An immediate question is how to attain a declining peak energy at the RS, since generally this shock would go to higher Lorentz factor (in the fluid frame) as the flow is decelerated. As it turns out, a long-lived central engine can help in this regard. In the limit where the engine deposits mass into the RS more quickly than the FS sweeps mass from the CSM, the dynamics differ markedly from the typical GRB case. To illustrate this, consider ejecta with mass Mej and Lorentz factor γej interacting with a cold CSM. Previous authors (e.g. Sari & Piran 1995) have shown that the outflow undergoes a dynamical transition when the mass swept by the FS, Msw, becomes equal to ∼Mej/γej. When Msw ≪ Mej/γej the shocked shell at the ejecta-CSM interface coasts with a constant Lorentz factor γsh ≈ γej, and when Msw ≫ Mej/γej, γsh evolves with time. In the typical GRB case, where there is no continued mass or energy input from the central engine, Mej is constant while Msw grows over time; the system begins in the coasting state, and the shell starts to decelerate once Msw becomes sufficiently large. However, for continuous mass ejection, |$M_{\rm ej} \propto \int \dot{M}_{\rm j}\, {\rm d}t$| also increases with time. The dynamics will be altered if Mej grows faster than Msw, which is possible for a steep CSM density gradient. In that limit Msw > Mej/γej initially, and the shell accelerates, eventually reaching a terminal Lorentz factor γsh ≈ γej once Msw ≪ Mej/γej. In this scenario, the RS decelerates steadily in the contact discontinuity frame. Therefore, Ep ∝ νm falls off quickly if the emission comes from a rapid-cooling RS. In a steep density gradient, τ ∝ r1 − α also decreases with time, making it possible for LBAT to decline faster than Ep if the emission comes from the RS.
We solved numerically the system of equations (19)–(24) to determine the dynamical variables. For reference, we also present analytical solutions of these equations in the limit γ ≫ 1 in Appendix A. Once γ2, |$\bar{\gamma }_3$| (or |$\bar{\beta }_3$|), and R are known, the spectral parameters νm, νc, and Lν, max for the forward- and reverse-shocked regions can be determined using the standard theory, as outlined in Appendix B, where we give analytical expressions for the maximum spectral power Lν, max and break frequencies νc and νm. In calculating the spectrum, we approximate the thermal photons as monochromatic with frequency ∼3kT0. We take the blackbody temperature to be 0.14 keV as in Kaneko et al. (2007), as we find this gives a better fit than the higher value inferred by Campana et al. (2006). The non-thermal spectrum is taken to have a power-law form with breaks at νm and νc, and the BAT and XRT light curves are determined by integrating the spectrum over 15–150 and 0.3–10 keV, respectively. Our best-fitting models have p > 3, so in all cases discussed here Ep ≃ hνm. The free parameters of our models are α, p, A*, γ, and the fractions of post-shock energy ϵe2 and ϵe3 going into relativistic electrons in the FS and RS, respectively. We fix k, L0, and ξ to the values inferred from the observed thermal component, as in Section 4.1.
We calculated LBAT, LXRT, and Ep over a range of parameter space. In order to match the observed slope of Ep and LBAT, we fixed α to 2.7; for other values of α, the fit for these observables is typically worse, although the fit to LXRT is sometimes improved. We varied p from 3.0 to 4.0 in steps of 0.1, log A* from 2.0 to 5.0 in steps of 0.0125, γe from 6.0 to 12.0 in steps of 0.025, and log ϵe3 from −3.5 to −1.5 in steps of 0.025. In no case were we able to fit the spectrum reasonably with FS emission, so rather than vary ϵe2, we fit the light curves with the sum of thermal emission and non-thermal RS emission, and then calculate an upper limit on ϵe2 by assuming the FS contributes less than 30 per cent of the flux in XRT and BAT. In addition, we place an upper limit on ϵB by demanding that the comoving energy density (urad) of thermal radiation at the RS be higher than the comoving energy density in magnetic fields (uB). For each model, we calculated the reduced chi-squared χ2 via a joint fit to the observed XRT luminosity from Campana et al. (2006) and the BAT luminosity and peak energy measured by Toma et al. (2007). We do not include the XRT data after 4000 s in the fit.
In some cases – particularly when A* is rather large – the optical depth of the shocked regions exceeds unity. Our model, which assumes single scattering, is not valid in that case. Thus, we discard models with high optical depth, keeping only models that become optically thin prior to 300 s. After that cut is applied, our best-fitting model has p = 3.8, A* = 4900, γ = 10.8, and ϵe3 = 6.0 × 10⁻³. This model is shown in Fig. 7. We find that the FS does not contribute substantially to the emission when ϵe2 ≲ 0.05ϵe3. urad/uB > 1 at all times in this model if ϵB < 2 × 10⁻⁵. If we relax the condition to urad/uB > 1 only after 300 s, then ϵB ≲ 10− 4. While the low upper limit on ϵB is somewhat troubling, we note that other authors (e.g. Fan et al. 2006; Barniol Duran et al. 2015) have also found a low value of ϵB compared to ϵe in GRB 060218.
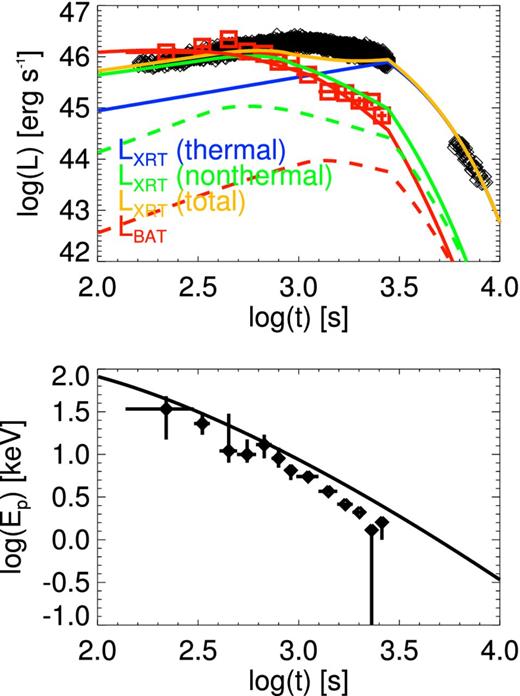
Top: XRT (0.3–10 keV) and BAT (15–150 keV) light curves for our RS IC model. When fixing k = 0.66, ξ = 1, L0, 46 = 1, and α = 2.7, the best-fitting parameters are ϵe3 = 6.0 × 10⁻³, γ = 10.8, A* = 4900, and p = 3.8 The thermal, non-thermal, and total XRT luminosities are shown in blue, green, and orange, respectively, while the BAT luminosity is drawn in red. Dashed curves show the contribution of the FS to the BAT (red) and XRT (green) light curves, assuming ϵe2/ϵe3 = 0.05. The black diamonds are XRT data from Campana et al. (2006), and the red squares are BAT data from Toma et al. (2007). Bottom: the peak energy in our model, as compared to data from Toma et al. (2007).
While this model can plausibly fit the light curves, it cannot explain the low-frequency spectral shape: for νc < ν < νm, we have Fν ∝ ν−1/2, steeper than the observed spectrum Fν ∝ ν−0.1. However, we note that Toma et al. (2007) found a different spectral shape at low energies, Fν ∝ ν−0.4, when using a cut-off power law to fit the data instead of a Band function, so the observed β1 seems to depend in part on the assumed spectral model. We also find a high value of p ≃ 3.8 that, while roughly consistent with the observed value of Toma et al. (2007), is large compared to the value in typical GRBs (Panaitescu & Kumar 2002). An additional issue with our model is that it slightly underpredicts the XRT flux near peak by up to a factor of 2, and slightly overestimates the peak energy. Furthermore, our model is only one-dimensional, and it does not take into any effect of collimation or sideways expansion of the jet.
Despite these issues and the crudeness of the model, the RS IC interpretation does a reasonable job of capturing the basic behaviour of the light curves, and it has some attractive features. Notably, of all the models we consider, this model is the only one that provides a natural explanation for the steep decline of Ep and LBAT. Additionally, this type of emission is expected when a long-lived, dissipative jet is present, and should therefore contribute to the emission on some level (although, IC emission from the RS only dominates the contribution from external shocks under certain circumstances, as described above). However, if other lepton populations (e.g. those excited by internal shocks or other dissipation in the jet interior) also strongly contribute to the emission, the external shock emission may not be observed.
Having an independent estimate for the outflow Lorentz factor allows us to break the degeneracy of our radio model discussed in Sections 4.5 and 4.6, by calculating Eiso directly. Assuming tL corresponds to the turn-off time of the engine, we find Miso ≃ 5 × 10⁻³ M⊙ and Eiso ≃ 9 × 1052 erg via equations (4) and (5). Thus, the high energy, high Lorentz factor radio model is preferred. The low upper limits on ϵB and ϵe in this section are consistent with the ranges inferred from the radio (see discussion at the end of Section 4.6). The jet is cold and radiates inefficiently, with ηγ ≃ 7 × 10⁻⁴. Applying θ0 ≳ γ− 1, we find that the true jet energy is Ej ≳ 4 × 1050 erg. These results have interesting implications when compared to standard GRBs. Eiso and Ej fall within the range typical for cosmological bursts (Piran 2004), suggesting that the total kinetic energy released in GRB 060218 is not unusual, although it is released over a longer time. The main factor that distinguishes GRB 060218 from the bulk of observed GRBs is therefore its radiative efficiency: whereas most bursts have Eγ, iso ≈ Eiso (Piran 2004), our model for GRB 060218 predicts Eγ, iso ≪ Eiso. This fact is closely linked to the low values we deduced for the ϵ parameters, which may perhaps be related to the lower bulk Lorentz factor or the long engine lifetime. For now, this is only speculation, but the possibility that standard GRBs are a corner case where the radiative efficiency is high (due, perhaps, to a higher Lorentz factor or a more abrupt deposition of kinetic energy), while most collapsar events go unobserved because of a much lower radiative efficiency, is intriguing.
In addition, we can deduce some properties of the CSM near the progenitor from the inferred value of A*. If it extends in to Rext, the wind is optically thick to electron scattering, with total optical depth |$\tau _{\rm w} = \int _{R_{\rm ext}}^{\infty } \rho _1 \kappa\, {\rm d}r \approx 30$|. However, because of the steep density gradient, the high optical depth is due mostly to material very close to Rext. In fact, the shock radius in our model is R ≈ 5 × 1013 cm at the time of first observation; our model does not constrain the wind density at radii less than this. The optical depth of the wind is small compared to the envelope optical depth, so the addition of such a wind does not affect the optical model discussed in Section 4.3. This wind cannot be the origin of the high value of NH, however, as the absorbing column through the wind changes as the shock propagates outwards, while the observed NH is constant.
The extent of the wind is not known, but the equipartition radius RN = 1.3 × 1016 cm at day 5 gives an upper limit, since as discussed in Section 4.5 the radio observations imply a constant density CSM. The total mass of the wind is therefore |$M_{\rm w} < \int _{R_{\rm ext}}^{R_{\rm N}} 4 \pi r^2 \rho _1 {\rm d}r \simeq 4 \times 10^{-3} \,\mathrm{M}_{\odot }$|. This is comparable to the isotropic mass of the jet, so it is possible that the jet undergoes some deceleration while sweeping the outer layers of the envelope. In addition, even though the terminal Lorentz factor is γ2 ≈ γ = 10.8 in our model, the transition to the coasting state is quite gradual: we find γ2 only reaches ≈5 by the end of the prompt phase at tL. It therefore seems plausible that the jet could decelerate to βγ ∼ 1 by day 5, as implied by radio observations. We stress, however, that there is still some tension in producing the flat radio light curve with a mildly relativistic outflow.
After the source of thermal photons fades away, the emission from external shocks will be dominated by synchrotron radiation. Since the overall SED appears incompatible with a single synchrotron spectrum, this component should not overwhelm the optical emission and dust echo afterglow emission observed at the same time. Since the jet begins to decelerate shortly after tL in our model, the synchrotron emission peaks near tL. At that time, we find that the critical synchrotron frequencies are νm ≃ 6 × 10⁻⁹ Hz and νc ≃ 4 × 10¹² Hz; both are far below the optical band. We calculate a peak synchrotron νFν flux of 5 × 10⁻¹⁵ erg cm−2 s−1 2 × 10⁻¹⁷ erg cm−2 s−1, respectively, at 5 × 10¹⁴ Hz and 1 keV. This is far below the observed νFν, which is ∼10−11 erg cm−2 s−1 in both the X-ray and optical bands (Toma et al. 2007). The main reason synchrotron emission from the jet is so weak compared to cooling envelope emission and dust scattering of the prompt light is the low values of ϵe and ϵB. This answers the question posed at the end of Section 4.4, suggesting that the primary reason a dust echo is observed in GRB 060218 is because of low values of the microphysical parameters.
4.7.5 Other models for jet emission
Here, we briefly consider some other possibilities for the prompt emission, but each is problematic. Thus, we prefer an IC interpretation for the prompt emission in GRB 060218.
Synchrotron emission from external and/or internal shocks is also expected for relativistic jets. The standard FS synchrotron model, with constant external density and no continuous energy injection (i.e. α = 0 and k = −2), gives Ep ∝ νm ∝ t−3/2 and F(E ≫ Ep) ∝ t(2 − 3p)/4 in the rapid cooling limit (Sari et al. 1998). When p ≃ 3, this gives a time behaviour similar to the observed one. However, the peak energy in this case is much too low to explain observations, even for unphysically high explosion energies.
Internal shock models, in which ejecta shocked by the collision of successive engine-launched shells radiate via synchrotron, remain a prominent model for the prompt radiation in cosmological GRBs (Piran 2004). This picture provides a natural interpretation of the high degree of variability in GRB light curves, as the many shell collisions give rise to multiple peaks. GRB 060218, with its smooth, single-peaked light curve, may therefore be hard to explain in an internal shock context, unless an additional mechanism acts to smooth out the light curve. It is unclear, as well, how the presence of an extended envelope could affect the internal shock signature.
In some cases, steep decays in the prompt GRB light curve have been attributed to a kinematical effect, wherein the observer continues to see emission from high-latitude parts of the curved emission region after the prompt emission process ends. This phenomenon, known as the curvature effect, leads to fainter and softer emission over time because of relativistic beaming. Toma et al. (2007) already investigated curvature effects for GRB 060218, and showed that the simultaneous steep decay of the peak energy and high-energy light curve is inconsistent with this interpretation.
Finally, we compare the expected shock breakout signal in our model with the observed prompt emission. The shock breakout has two components: one associated with the breakout of the jet from the envelope, and one with the breakout of the SN shock. The breakout signal can be characterized by an breakout mass Mbr and velocity vbr (or Lorentz factor γbr), and the envelope radius Rext and opacity κext. The breakout occurs at an optical depth |$\tau _{{\rm br}} \sim c/v_{{\rm br}} \sim \kappa _{{\rm ext}} M_{{\rm br}}/R_{\rm ext}^2$|. Assuming order-unity radiative efficiency, the breakout luminosity can be estimated as Lbr ∼ Ebr/tbr, where Ebr and tbr are, respectively, the breakout energy and time-scale. In the relativistic (jet) breakout case, we have Ebr ∼ γbrMbrc2, |$t_{\rm br} \sim R_{\rm ext}/2\gamma _{\rm br}^2c$|, and τbr ∼ c/vbr ∼ 1 so that |$M_{\rm br} \sim R_{\rm ext}^2/\kappa _{\rm ext}$|. The resulting luminosity is |$L_{\rm br} \sim 2c^3 R_{\rm ext}\gamma _{\rm br}^3/\kappa _{\rm ext},$| or Lbr ∼ 3 × 1045 erg s|$^{-1}\, R_{{\rm ext},13} \kappa _{{\rm ext},0.2}^{-1} \gamma _{\rm br}^3$|, where Rext has been scaled to 1013 cm and κext to 0.2 cm2 g−1. If γbr is large, it is possible that the jet breakout signal could be brighter than the observed luminosity, which is ∼1046 erg s−1 at early times; however, this signal would also be short (∼1–10 s) and could have easily been missed in GRB 060218. The interaction of the cocoon with circumstellar gas may also produce a transient; however, because the cocoon's energy and velocity post-breakout are small compared to the energy and velocity of the fast SN ejecta (see discussion in Section 4.6), any signal from circumstellar interaction should be dominated by the SN.
In the non-relativistic case appropriate for SN shock breakout, we have instead |$E_{\rm br} \sim M_{\rm br} v_{\rm br}^2/2$|, tbr ∼ Rext/c, and τbr ∼ c/vbr so that |$M_{\rm br} \sim R_{\rm ext}^2 c/\kappa _{\rm ext} v_{\rm br}$|. The luminosity in this case is Lbr ∼ c2vbrRext/2κext, or Lbr ∼ 7 × 1044 erg s|$^{-1}\, R_{{\rm ext},13} \kappa _{{\rm ext},0.2}^{-1} \beta _{\rm br}$|, with βbr = vbr/c. Even if βbr ≈ 1, the SN breakout luminosity in our model is modest compared to the observed X-ray signal.
5 DISCUSSION
We have presented a model for the peculiar GRB 060218 in which the prompt X-ray emission arises from a low-power jet and the early optical emission is powered by fast SN ejecta interacting with a low-mass circumstellar envelope. Our picture has some features in common with the recent model of Nakar (2015), where the prompt X-ray and optical emission is produced by a choked jet interacting with a circumstellar envelope. In both cases, a jet is needed to decouple the mildly relativistic outflow from the SN, and an extended envelope of similar mass (∼0.01 M⊙) and radius (∼100 R⊙) is inferred. Both models provide a reasonable explanation for the radio afterglow flux, although Nakar's model has an advantage in explaining the shallow slope of the light curve. Neither model can account for the X-ray afterglow through external shock synchrotron radiation alone. There are several key differences between the models, however. We differ on the jet properties (we suggest a low-power, long-duration jet, whereas Nakar uses a more typical GRB jet), the origin of the prompt X-rays (we prefer a dissipative jet and some Compton scattering process, whereas Nakar posits shock breakout), and the power source for the cooling envelope emission seen in the optical band (we suggest that it is driven by the underlying SN, whereas Nakar proposes a smothered jet explosion). A detailed discussion of the strengths and weaknesses of each model is therefore warranted.
An advantage of Nakar's model is that the luminosity and time-scale of the jet take on typical GRB values. In addition, shock interaction naturally produces a smooth, single peaked light curve in X-rays, as observed (Nakar & Sari 2012). This model also helps to explain the lack of a jet break in the radio, since the jet outflow becomes quasi-spherical before leaving the envelope. A wind-like CSM profile is also inferred for afterglows powered by shock breakout (Barniol Duran et al. 2015), which is expected for a WR star progenitor. On the other hand, the high value (∼50 keV) and slow decay (∝ t−(0.5–1)) of the prompt peak energy that one expects in the relativistic shock breakout scenario of Nakar & Sari (2012) seem hard to reconcile with direct measurements of the peak energy that show it declines steeply as t−1.6 and with a value of ∼ a few keV throughout most of the prompt phase (Toma et al. 2007). (However, as discussed in Section 3, mildly relativistic effects and deviation from spherical symmetry may rectify this issue.) The fact that the prompt optical and X-ray emission are observed simultaneously, and that they each evolve smoothly from the earliest observation, also seems hard to interpret in a shock interaction model where the observed radiation evolves from a non-equilibrium state towards thermal equilibrium. A better understanding of the expected X-ray signal from mildly relativistic shocks in low-mass envelopes is needed to determine whether these problems can be resolved. The origin of the prompt thermal X-ray component is also unclear in the choked jet model, since the inferred photospheric radius is considerably smaller than the envelope radius.
Our low-luminosity jet model comes with its own merits and drawbacks. A jet origin for the prompt X-rays and γ-rays places GRB 060218 at the low-luminosity, long-duration end of a continuum of GRB processes. In this unified picture, similarities to cosmological bursts (such as satisfying the Amati and lag-luminosity correlations) are perhaps not surprising, although as in typical GRBs the physical origin of these correlations is not well understood. None the less, these coincidences are not easily accounted for in the shock interaction view. Furthermore, the presence of a thermal component is expected for a dissipative jet, and having a separate origin for the prompt X-ray and optical emission removes problems with the X-ray to optical evolution. However, the low-power jet interpretation inherits one usual problem with jet models, namely that the prompt emission mechanism in relativistic jets is still not well understood. Also, since a low-luminosity jet stays collimated while it drills through the circumstellar envelope, our model requires the jet to become non-relativistic in the CSM, which may be difficult unless some additional mass close to the star helps to decelerate the jet. While we infer a wind-like CSM at small radii where the prompt X-rays are emitted, we find that a uniform circumburst density is needed beyond 1016 cm where the radio is emitted. This is contrary to usual expectations for a WR progenitor. Finally, we require a unusually long-lived, low-power central engine, the origin of which is unclear.
This last point deserves more discussion. A shortcoming of our model, as with many engine driven models, is the need to prescribe unknown properties of the central engine. A simple parametrization glosses over many of the finer details of compact object formation and jet launching, the physics of which are not yet fully understood. In particular, producing a long-duration, low-luminosity engine from a nascent black hole presents problems: Aloy, Janka & Müller (2005) have shown in their black hole simulations that a minimum jet luminosity of ∼1049ergs−1 is needed to overcome the ram pressure of accreting material, and black hole-driven engines tend to operate on time-scales much shorter than ∼103 s. However, the SN might clear away infalling material, thus allowing a lower luminosity jet to propagate. It is unclear whether the formation of a neutron star (or magnetar) could drive the type of mildly relativistic outflow we require, but the longer time-scales involved are more consistent with the long-lasting prompt emission observed (for further discussion; see Toma et al. 2007). Magnetar-powered scenarios are particularly intriguing in light of the recent result of Greiner et al. (2015), who claim the detection of magnetar-driven superluminous SN associated with the ultralong GRB 111209A. Here, we only aim to show that a low-luminosity outflow, if present, can explain many features of the prompt thermal and non-thermal emission. Note that several other bursts, such as GRB 130925A (Evans et al. 2014) and the ultralong bursts discussed by Levan et al. (2014), may also require long-lived central engines, so this problem is not unique to GRB 060218.
The lack of variability in the light curves of GRB 060218 and GRB 100316D merits further investigation, as well. If the typical GRB variability originates from relativistic turbulence, then the smooth light curves observed in some LLGRBs could be ascribed to the lack of highly relativistic material (Narayan & Kumar 2009). Even in the absence of relativistic effects, a light jet lifting heavier external material would give rise to Rayleigh–Taylor instabilities that may induce light-curve fluctuations. This could be circumvented by, e.g. a Poynting-flux dominated jet, but a matter-dominated jet is required to produce the prompt non-thermal X-rays through IC processes. The smooth light curve also constrains the degree of clumpiness which can be present in the CSM. Detailed numerical simulations will be needed to characterize the amount of variability expected from a mildly relativistic jet as it penetrates the star and envelope, breaks out from the envelope's edge, and sweeps the surrounding CSM.
We note that, because our model involves an on-axis jet, we cannot appeal to geometric effects to increase the rate of 060218-like events. However, our model does imply a unique, non-standard progenitor different from the usual high-mass WR stars thought to give rise to most cosmological LGRBs. Thus, our explanation for the high rate of LLGRBs is simply that LLGRB progenitors are intrinsically 10–100 times more common. Assuming that the presence of a long-lived, low-luminosity jet is also somehow tied to the progenitor structure, such jets might also be more common than ultrarelativistic, short-lived ones, but we are biased against observing them due to their low power. In the model of Nakar (2015), the progenitor is again different from the standard one, but the prompt emission is roughly isotropic as well, so that the higher event rate is due to some combination of geometric and intrinsic effects.
An essential constraint on our model is that the beaming-corrected rate of GRB 060218-like events should not exceed the rate of broad-lined Type Ibc SNe. Guetta & Della Valle (2007) estimate an SN Ibc rate of 2 × 10⁴ Gpc−3 yr−1, with the rate of broad-lined events being ∼7 per cent of this, or ∼103 Gpc−3 yr−1. The rate of events like GRB 060218, |$230^{+490}_{-190}$| Gpc−3 yr−1 (Soderberg et al. 2006), is still uncertain, but could be as low as 40 Gpc−3 yr−1. The rate estimate of Soderberg et al. (2006) included 1998bw (which likely has a different origin), and only took into account one year of Swift observations. These factors could combine to lower the rate by perhaps a factor of a few, but this reduction in rate is offset somewhat by including the similar burst GRB 100316D. Our theory, which includes a wide jet with beaming factor fb ∼ 10–100, is marginally compatible with the lower end of the range of rates given in Soderberg et al. (2006). If subsequent observations determine a higher event rate (indicating that GRB 060218-like events are nearly isotropic), it would pose a severe problem to our model.
It may be possible to construct a ‘hybrid’ model that retains some of the best features of both our model and Nakar's. This speculative model is depicted in Fig. 8. Suppose that the central engine switches off while the jet is traversing the envelope (as in Nakar's model), but let the envelope mass be smaller (as in our model) so that the outflow decelerates significantly and expands sideways somewhat, but does not have time to sphericize before breaking out. The explosion then breaks out aspherically, with shock breakout emission expected from near the poles. If dissipation continues to occur after the cessation of engine activity, a thermal X-ray component might also be observable once the ejecta clear out. After breakout, the ejecta expand into the low-density CSM, eventually producing the radio synchrotron emission as electrons are accelerated by the external shocks. Since the outflow expands preferentially into the CSM post-breakout, a quasi-toroidal envelope remnant is left behind, which is shocked by the fast SN ejecta and then emits the prompt optical emission as it cools. The X-ray afterglow is produced by dust scattering, as in Section 4.4. As with our model, this scenario gives a possible explanation for the thermal emission, and since the optical and X-ray are decoupled there are no concerns with the X-ray to optical spectral evolution. Yet, as with Nakar's model, this case generates a smooth prompt X-ray light curve via shock breakout, and more easily explains the radio because the initial outflow is wider than a jet. However, the expected signal from an aspherical shock breakout in the relativistic limit has not been calculated in detail, which is an important caveat.
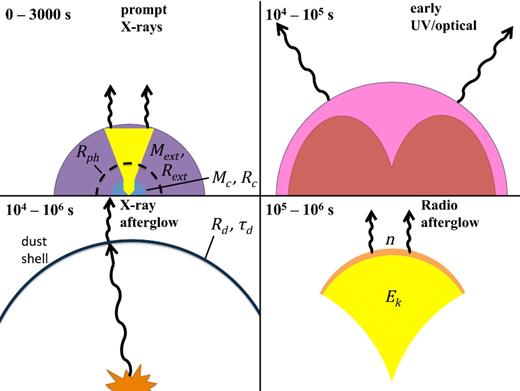
A hybrid model for the prompt emission. Upper left: a jet is launched with short time-scale compared to the envelope breakout time, as in Nakar (2015). However, the jet does not have time to become quasi-spherical before breaking out; it undergoes significant deceleration, and possibly a small degree of lateral spreading, but the explosion breaks out primarily in the forward direction, leaving the envelope mostly intact. Thermal emission could be observed, e.g. from the walls of the jet cavity, once material clears out along the line of sight. Upper right: as in our model, the fast SN ejecta heat the remaining envelope, which cools through optical radiation. Lower left: the X-ray afterglow is produced from dust scattering, as described in Section 4.4. Lower right: the radio afterglow comes from a non-relativistic, quasi-spherical blast wave. Because the ejecta are already decelerated to βγ ∼ 1 by the envelope, a spherical flow is more readily achieved than in our jet breakout model.
Moving past the prompt emission, we have also shown that a dust echo model gives a reasonable fit to the X-ray afterglow light curve and spectral index evolution. The dust echo model used only an empirical fit to the prompt light curve and spectrum, and therefore is insensitive to the mechanism of prompt emission. Moreover, the scattering angle from the dust grains, θd ≈ (2ct/Rd)1/2 ∼ 1°(Rd/30 pc)− 1/2(t/10 d)1/2, is small, so the echo emission depends only on the prompt radiation roughly along the observer's line of sight. Thus, the dust echo interpretation applies equally well whether the prompt emission originates from a low-luminosity jet or from shocked gas. If the reason for the small radiated energy in bursts like GRB 060218 is small values of ϵe and ϵB, as our model suggests, then dust echo type afterglows should commonly accompany this class of bursts, because the synchrotron emission from external shocks will be weak. So far, this is borne out by observations, as the afterglow GRB 100316D is also consistent with a dust echo. Why the synchrotron efficiency is poor, and whether this is related somehow to the long burst duration, remains to be worked out.
If our picture for GRB 060218 is correct, one would expect to observe broad-lined Type Ic SNe with accompanying mildly relativistic radio afterglows, but without a prompt X-ray component, when viewing GRB 060218-like events off-axis. The global rate of such events would be some 10–100 times greater than the on-axis rate, assuming wide opening angles in the range of ∼10°–30°. Such events might be uncovered by radio follow-up of Type Ic SNe. Future survey projects such as the Large Synoptic Survey Telescope should detect more Type Ic SNe with a double-peaked signature of cooling envelope emission, expanding the number of potential interesting targets for radio follow-up.
Whether or not the long prompt emission is tied to the presence of a circumstellar envelope is an interesting open question. Clearly, this is so for the model of Nakar (2015). For our model, though, the prompt X-ray and optical emission have different origins, so it may be possible to observe an X-ray signal akin to that of GRB 060218 with no prompt optical counterpart (On the other hand, if the envelope plays a crucial role in jet dissipation, it may still be needed.). The high-T90, high-variability light curves of ultralong GRBs do seem to suggest the possibility of intrinsically long-lasting jet emission. Interestingly, several ultralong bursts (e.g. GRB 101225A, GRB 111209A, and GRB 121027A) also show an early optical peak that may be consistent with shock cooling (Levan et al. 2014). In other ultralong GRBs (e.g. GRB 130925A and GRB 090417B), no optical light was detected, but the presence of early optical emission cannot be ruled out due to the high extinction to those events (Holland et al. 2010; Evans et al. 2014). Overall, prompt optical emission is observed more often than not in very long bursts, hinting at one of two possibilities: either the engine duration is long because a circumstellar envelope is present, or a circumstellar envelope is present because the progenitors of long-duration engines also tend to have circumstellar envelopes. We note that, because the jet presumably breaks out successfully in ultralong GRBs, any optical emission due to extended envelope interaction in ultralong bursts must be powered by the SN, and not by a choked jet. This topic is of considerable theoretical interest going forward.
Regardless of whether objects like GRB 060218 are powered by a jet or a shocked envelope, circumstellar interaction clearly has a role to play in explaining these unusual LLGRBs. Both our model and the Nakar (2015) model can be taken as further indirect evidence for the existence of a dense environment immediately surrounding the progenitor star, indicative of strong pre-explosion mass-loss or binary evolution. The mechanism driving this mass-loss is unclear, but possibilities include late unstable nuclear burning (Smith & Arnett 2014), gravity wave-driven mass-loss (Quataert & Shiode 2012), or common envelope evolution (Thöne et al. 2011; Chevalier 2012). Alternately, the circumstellar envelope could arise from a stripped binary scenario as in Type IIb SNe. We emphasize that the progenitor's pre-explosion history is a crucial factor in determining the observed radiation's characteristics, and that this theme applies broadly to many transients including Type Ia-CSM, Type IIn, and Type IIb SNe. Understanding the late phases of intermediate- to high-mass stellar evolution will play a critical role as our ability to detect transient phenomena continues to evolve.
6 CONCLUSIONS
We have presented a comprehensive model for the unique LLGRB GRB 060218 that provides reasonable explanations for each of its features. The model includes a peculiar engine-driven jet with a low-luminosity (Liso ∼ 3 × 1049ergs−1) and a long-duration (tj ∼ 3000 s) properties that we suggest are related to a non-standard progenitor. We have shown that, if the jet dissipates some modest fraction of its kinetic energy into thermal radiation, Comptonization of seed thermal photons by hot electrons can explain features of the prompt spectrum, light curve, and peak energy evolution. We investigated different emission sites for the IC process, and found that scattering from electrons in the reverse-shocked gas can roughly account for the prompt X-ray light curve and peak energy decay, if the fraction of energy put into magnetic fields and into electrons in the forward-shocked gas is small. Scattering from a non-thermal electron population within a dissipative jet outflow also remains a possibility for the prompt emission. Scattering from FS electrons can be ruled out, as the light curves and peak energy cannot be reproduced in this case. We also argued against a synchrotron origin for the prompt emission.
We analysed constraints on the jet properties from the prompt thermal emission, the radio afterglow, and dynamical considerations. There exists a region of parameter space that can fit both the radio afterglow and the prompt thermal emission without violating other constraints, although there is considerable degeneracy that prevents precise determination of the parameters. The early thermal emission and the late-time radio afterglow can be explained either by a cold jet with relatively high energy and Lorentz factor and relatively little post-shock energy in electrons and magnetic fields, or by a hot jet with lower energy and Lorentz factor and standard choices for ϵe and ϵB. Our IC model for the prompt emission breaks this degeneracy, strongly preferring the former scenario. We derived the jet parameters Ek ≃ 4 × 1050 erg, γ ≃ 11, and θ0 ≃ 0.1, and find that the immediate circumstellar environment has a density profile of ρ1 ∝ r−2.7 and wind parameter A* ≃ 4900. The inferred microphysical parameters of the RS are ϵe3 ≃ 6 × 10⁻³ and p = 3.8. Combining the radio and prompt X-ray models, we constrained the magnetic parameter to 10− 5.5 ≲ ϵB ≲ 10− 4 and the electron energy fraction in the FS to 10− 5.5 ≲ ϵe2 ≲ 10− 3.5. Radio observations constrain the density at r > 1016 cm to be constant, with n ∼ 103.5–105.5 cm−3 depending on the values of ϵe2 and ϵB. However, there is some concern that the outflow will not have time to sphericize prior to the radio observations, which makes the shallow radio light curve difficult to interpret. Our results suggest that GRB 060218 may be an engine-driven event that has the same kinetic energy coupled to relativistic ejecta as in typical GRBs, but radiates very inefficiently in comparison. This result has interesting implications considering the high volumetric rate of LLGRBs.
We have shown as well that the early peak in optical/UV can be powered by interaction of the fast outer SN layers with a low-mass extended envelope surrounding the progenitor star. With the SN parameters inferred for SN 2006aj, and the luminosity and blackbody radius implied by the measured host extinction, we derive the envelope parameters Mext ≈ 4 × 10⁻³ M⊙ and Rext ≈ 9 × 1012 cm. SN 2006aj is perhaps the best case so far of a double-peaked light curve characterized by cooling envelope emission, as described by Nakar & Piro (2014).
We also tested the idea that the unusual X-ray afterglow in GRB 060218 is a dust echo of the prompt emission, as suggested by Margutti et al. (2015) to explain the extremely soft afterglow spectrum. Using the available prompt emission data as an input, we modelled the expected dust echo emission from a shell of dust at Rd, with scattering optical depth τd at 1 keV. Assuming dust grains distributed uniformly in size from a minimum radius a− = 0.005 μm to a maximum radius a+ = 0.25 μm, we found that τd = 0.007 and Rd ≃ 28 pc gave a good fit to the afterglow light curve and the spectral index evolution (However, we stressed that there is considerable uncertainty in Rd, as it is sensitive to certain poorly constrained dust properties.). Because the echo emission does not depend on the prompt emission mechanism, this result is robust, making GRB 060218 quite a convincing case for a dust echo. The echo model implies only a modest amount of dust consistent with the dust content of the ISM. That the dust echo dominates over the usual synchrotron afterglow can be explained in this case by a low value of ϵe and ϵB, consistent with our radio estimates and prompt X-ray modelling. We compared our results for GRB 060218 to the other bursts with soft afterglow spectra identified by Margutti et al. (2015), and found that two distinct classes of echo-dominated afterglows are indicated: one requiring a typical amount of dust (like GRB 060218), and one requiring an unusually high amount of dust (like GRB 130925A).
We conclude by noting that our understanding of the class of low-luminosity, ultralong GRBs with smooth light curves is severely hindered by the small sample size – presently, GRB 060218 and GRB 100316D are the only constituent members of this class. In addition, because GRB 100316D lacks a detection of prompt optical emission or clear-cut evidence for prompt thermal emission, we are unable to draw any firm conclusions about it in our model. More observations of this unique class of objects is needed to settle questions about the prompt emission mechanism and the transition from beamed to spherical outflow, and to better constrain the properties of the progenitor, envelope, jet, and CSM. With the rates estimated by Soderberg et al. (2006), Swift should turn up a new burst in this class every several years or so. In the meantime, advancing our theoretical understanding of shock-envelope interaction, the emission mechanism in relativistic jets, and the propagation of jets in complex circumstellar environments can furnish testable predictions for the next observed event.
We thank R. Barniol-Duran and B. Morsony for helpful discussions, and E. Nakar for valuable comments on the manuscript. This research was supported in part by NASA Grant NNX12AF90G.
REFERENCES
APPENDIX A: SHOCK DYNAMICS OF A RELATIVISTIC OUTFLOW INTERACTING WITH A POWER-LAW CSM
Three dynamical limits are possible, depending on the relative value of f and γ (Sari & Piran 1995).
- The coasting regime (f ≫ γ2). The FS coasts with an approximately constant Lorentz factor, and the RS is Newtonian with |$\bar{\beta }_3 \ll 1$|:The shocked regions are thin; the FS's size is ∼R/γ2, and the RS is even thinner by a factor |$\bar{\beta _3}$|, so that Rrs ≈ R ≈ Rfs is a good approximation.(A3)\begin{eqnarray} &&{\gamma _2 \approx \gamma}\nonumber \\ &&{\bar{\beta }_3 \approx \left( \frac{8\gamma ^2}{7f}\right)^{1/2}}\nonumber \\ &&{R = \frac{\beta _2 ct}{1-\beta _2} \approx 2 \gamma ^2 ct}\nonumber \\ &&{t_{{\rm emit}} = \frac{\beta -\beta _2}{\beta (1-\beta _2)} t \approx 2 \bar{\beta }_3 t.} \end{eqnarray}
- The decelerating (or accelerating) regime (γ−2 ≪ f ≪ γ2). The FS and the RS are both relativistic:Accelerating or decelerating cases are possible, depending on the evolution of f. As in the coasting case, the shocked regions are thin compared to their radius, so that Rrs ≈ R ≈ Rfs applies.(A4)\begin{eqnarray} &&{\gamma _2 \approx \left(\frac{f \gamma ^2}{4}\right)^{1/4}}\nonumber \\ &&{\bar{\gamma }_3 \approx \left(\frac{\gamma ^2}{4f}\right)^{1/4}}\nonumber \\ &&{ R \approx 2 \gamma _2^2 ct}\nonumber \\ &&{ t_{{\rm emit}} \approx t.} \end{eqnarray}
The non-relativistic regime (f ≪ γ−2). A third solution is also possible in which the FS becomes non-relativistic and Rrs ≪ Rfs. As the requisite high CSM density and low engine Lorentz factor are unlikely to be encountered in GRB 060218, we do not discuss this scenario further.
APPENDIX B: IC RADIATION FROM A RELATIVISTIC OUTFLOW INTERACTING WITH A POWER-LAW CSM
The FS and RS, if at least mildly relativistic, will produce relativistic electrons and strong magnetic fields that give rise to non-thermal emission. We adopt the standard theory, wherein fractions ϵe and ϵB of the total post-shock energy density go into relativistic electrons and magnetic fields, respectively. The post-shock electron energies are assumed to be distributed as a power law, |$N_{\gamma _{\rm e}} \propto (\gamma _{\rm e}-1)^{-p}$|, above some minimum Lorentz factor γm. We have γm2 = 610ϵe2gp(γ2 − 1) and |$\gamma _{{\rm m}3} = 610 \epsilon _{{\rm e}3} g_{\rm p} (\bar{\gamma }_3-1)$| for regions 2 and 3, respectively (e.g. Sari et al. 1998). gp = 3(p − 2)/(p − 1) scales the results to p = 2.5.
Let P(γe) be the power radiated by a relativistic electron, and ν(γe) be the frequency of that radiation. We have |$P(\gamma _{\rm e}) = (4/3) \sigma _{\rm T} c \gamma _{\rm e}^2 \gamma _2^2 u_{{\rm rad}}$|,where σT is the Thomson cross-section and |$u_{{\rm rad}} = L_{\rm th}/(4 \pi R^2 \gamma _2^2 c)$| is the photon energy density in the comoving frame. An electron with γe emits at frequency |$\nu (\gamma _{\rm e}) = \gamma _2 \gamma _{\rm e}^2 \nu _{{\rm rad}}$|, where νrad ∼ kBT0/hγ2 is the frequency of a typical thermal photon in the shock frame (Rybicki & Lightman 1979). Electrons above the critical Lorentz factor γc = (3mec)/(4σTγ2uradt) can cool in time t (Sari et al. 1998; Dai et al. 2006). γc is the same for regions 2 and 3 because the energy density and bulk Lorentz factor are equal across the contact discontinuity. In the single scattering limit, the maximum spectral power emitted by an ensemble of Ne electrons will be Lν, max ≈ NeP(γe)/ν(γe) (Sari et al. 1998; Dai et al. 2006). Ignoring the self-absorption frequency νa, which falls well below the X-ray band, the spectrum will have two breaks, at νc = ν(γc) and νm = ν(γm), and two possible shapes depending on whether νm < νc (slow cooling) or νc < νm (fast cooling). The form of Lν in either case is given by equations 7 and 8 in Sari et al. (1998).
If the above expressions give γm2 < 1, γm2 ≈ 1 should be used. However, in that case, only a fraction Nrel/N2 ≈ [610ϵe2gp(γ2 − 1)]p − 1 of the electrons are relativistic with γe − 1 ≥ 1. We make the approximation that non-relativistic electrons do not contribute significantly to the emission at ν > kT0. Then the spectrum above νm2, where |$L_\nu \propto L_{\nu ,{\rm max}2} \nu _{{\rm m}2}^{(p-1)/2} \propto N_{{\rm rel}} \gamma _{{\rm m}2}^{p-1}$|, is unchanged whether γm2 > 1 or γm2 ≈ 1. The same applies for γm3.
Temporal evolution of the spectral parameters. Each parameter in the leftmost column evolves as a power law in time, with the power-law index in the coasting and accelerating regimes given in the centre and right columns, respectively.
| Quantity | Coasting (f > γ2) | Accelerating (f < γ2) |
|---|---|---|
| νm2 | 0 | |$\frac{s-\ell }{\ell +2}$| |
| νm3 | |$\frac{-4(s-\ell )}{s+2}$| | |$\frac{-(s-\ell )}{\ell +2}$| |
| νc | −2(k − 1) | |$-2(k-1) + \frac{5(s-\ell )}{\ell +2}$| |
| Lν, max2 | (k − 1) + ℓ | |$(k-1)+s -\frac{3(s-\ell )}{\ell +2}$| |
| Lν, max3 | |$(k-1) + \ell + \frac{s-\ell }{s+2}$| | |$(k-1)+s-\frac{2(s-\ell )}{\ell +2}$| |
We stress that this model is not self-consistent unless IC is more important than synchrotron, and the emission is dominated by the RS. Here, we check whether each of these conditions is satisfied. With γ and A* as above, we calculate Liso, 48 ≈ 26, f ≈ 0.36, γ2 ≈ 1.9, |$\bar{\gamma }_3 \approx 1.7$|, R ≈ 6.5 × 1013 cm, and ρ1(R) ≈ 4.7 × 10⁻¹³ g cm−3 at 300 s. The comoving energy density of thermal photons at the shock radius is |$u_{{\rm rad}} = L_{\rm th}/4\pi R^2 \gamma _2^2 c = 3.5 \times 10^{5}$| erg cm−3, while the energy density in magnetic fields is |$u_{\rm B} = 4 \gamma _2^2 \rho _1 c^2 \epsilon _{\rm B} = 6.1 \times 10^9 \epsilon _{\rm B}$| erg cm−3 (Sari et al. 1998). Synchrotron is not too important if uB/urad ≲ 1, implying ϵB ≲ 6 × 10− 5, similar to the numerically inferred value.
We have assumed νc < ν < νm3, so that the RS luminosity is |$L_{{\rm RS}} = L_{\nu ,{\rm max}3} \nu _{\rm c}^{1/2} \nu ^{-1/2}$|. Whether the FS or RS dominates the emission depends on the value of νm2. If νm2 > ν, then |$L_{{\rm RS}}/L_{{\rm FS}} = (L_{\nu ,{\rm max}3} \nu _{\rm c}^{1/2} \nu ^{-1/2})/(L_{\nu ,{\rm max}2} \nu _{\rm c}^{1/2} \nu ^{-1/2}) = L_{\nu ,{\rm max}3}/L_{\nu ,{\rm max}2} \sim N_3/N_2 \sim f^{1/2}$|. This cannot be the case, since f < 1 at 300 s in our model. Instead, we require νm2 < ν, so that |$L_{{\rm FS}} = L_{\nu ,{\rm max}2} \nu _{\rm c}^{1/2} \nu _{{\rm m}2}^{(p-1)/2} \nu ^{-p/2}$|, and LRS/LFS ∼ f1/2(ν/νm2)(p − 1)/2. Substituting hνm2 ≃ [610gpϵe2(γ2 − 1)]2kT0, we obtain LRS/LFS ≳ 1 when ϵe2 ≲ 9 × 10− 4(hν/kT0)1/2. This is qualitatively similar to the numerical result in that it also suggests ϵe2 < ϵe3, although the numerical model produced a tighter upper limit on ϵe2.
