


Abstract
We examine the H i-based star formation efficiency (|${\rm SFE}_{{\rm H\,\small {I}}}$|), the ratio of star formation rate to the atomic hydrogen (H i) mass, in the context of a constant stability star-forming disc model. Our observations of H i-selected galaxies show |${\rm SFE}_{{\rm H\,\small {I}}}$| to be fairly constant (log |${\rm SFE}_{{\rm H\,\small {I}}}=-9.65$| yr−1 with a dispersion of 0.3 dex) across ∼5 orders of magnitude in stellar masses. We present a model to account for this result, whose main principle is that the gas within galaxies forms a uniform stability disc and that stars form within the molecular gas in this disc. We test two versions of the model differing in the prescription that determines the molecular gas fraction, based on either the hydrostatic pressure or the stellar surface density of the disc. For high-mass galaxies such as the Milky Way, we find that either prescription predicts |${\rm SFE}_{{\rm H\,\small {I}}}$| similar to the observations. However, the hydrostatic pressure prescription is a more accurate |${\rm SFE}_{{\rm H\,\small {I}}}$| predictor for low-mass galaxies. Our model is the first model that links the uniform |${\rm SFE}_{{\rm H\,\small {I}}}$| observed in galaxies at low redshifts to star-forming discs with constant marginal stability. While the rotational amplitude Vmax is the primary driver of disc structure in our model, we find that the specific angular momentum of the galaxy may play a role in explaining a weak correlation between |${\rm SFE}_{{\rm H\,\small {I}}}$| and effective surface brightness of the disc.
1 INTRODUCTION
While star formation is largely understood to be a process local to within individual galaxies, the strong correlation between the observed integrated star formation rates (SFR) and total stellar masses (M*) at both low and high redshifts has led astronomers to assume that this is due to a fundamental universal star formation efficiency (SFE), defined as the SFR normalized by the gas mass (e.g. Brinchmann et al. 2004; Salim et al. 2007; Schiminovich et al. 2010; Karim et al. 2011; Whitaker et al. 2012; Sobral et al. 2014; Hunt et al. 2015; Popping et al. 2015).
Sub-kiloparsec scale studies of nearby galaxies have found the SFE to be constant when the SFE is measured in terms of the molecular H2 gas mass (e.g. Leroy et al. 2008). While this is true for the H2-normalized SFEH2, a similar study by Bigiel et al. (2008) found the relationship between the total gas density (sum of both molecular and atomic gas) and the SFR density to show large variation within and between different spiral galaxies. Bigiel et al. (2008) attribute this variation to the variation of the H2/H i ratio (Rmol) as a function of local environmental factors. Recent observations of massive galaxies (stellar mass, M* > 1010 M⊙) indicate a near-constant integrated H i-based SFE (|${\rm SFE}_{{\rm H\,\small {I}}}$|) averaging 10−9.5 yr−1(Schiminovich et al. 2010; Hunt et al. 2015). Similarly, Huang et al. (2012) found a weakly positive correlation between the |${\rm SFE}_{{\rm H\,\small {I}}}$| and the stellar mass of galaxies for an H i-selected sample of galaxies (which typically consists of galaxies less massive than 1010 M⊙). This is rather surprising since the H2/H i varies strongly within galaxies and from galaxy to galaxy (Tacconi & Young 1986; Wong & Blitz 2002; Blitz & Rosolowsky 2006; Bigiel et al. 2008; Leroy et al. 2008). Why is the observed global |${\rm SFE}_{{\rm H\,\small {I}}}$| so uniform across all star-forming galaxies?
In this paper, we construct a model of a galactic disc with a uniform disc stability (Toomre 1964; Zheng et al. 2013) and compare the predicted |${\rm SFE}_{{\rm H\,\small {I}}}$| to those observed in nearby galaxies from the Survey for Ionization in Neutral Gas Galaxies (SINGG; Meurer et al. 2006) and the Survey of Ultraviolet emission in Neutral Gas Galaxies (SUNGG; Wong 2007). We find that the observed uniformity in global |${\rm SFE}_{{\rm H\,\small {I}}}$| across 5 mag of stellar masses can be reproduced by our constant-Q disc model. This is the third paper in a series in which we develop the uniform disc stability model to first account for the gas distribution beyond the optical disc (Meurer, Zheng & de Blok 2013), and then the gas and star formation distribution within the optical disc (Zheng et al. 2013). Here we model an integrated property, |${\rm SFE}_{{\rm H\,\small {I}}}$|, that connects the inner and outer disc and use a much larger comparison sample than our previous studies.
Section 2 describes the methods used to construct our stable galactic disc models. Section 3 presents the sample of nearby star-forming galaxies used as a comparison to our model star-forming discs. Section 4 discusses the results of our models and compares the model results to those measured from observations of nearby star-forming galaxies. We present our conclusions in Section 5.
2 MODELLING THE SFE WITH CONSTANT-Q DISCS
Here we explore whether the observed behaviour of |${\rm SFE}_{{\rm H\,\small {I}}}$| can be explained by a model based on the hypothesis that galaxy discs evolve towards a state of constant disc stability parameter Q (Toomre 1964). Recently, Meurer et al. (2013) showed that hypothesis can explain how H i traces dark matter in the outer parts of galaxies (the so-called ‘Bosma relation'; Bosma 1981) by using a single-fluid Q model. On the other hand, Zheng et al. (2013) showed that by assuming a two-fluid (stars and gas) version of the stability parameter |${Q_{\rm {sg}}}$| is constant and adopting reasonable assumptions about the star formation law (SFL) we can account for the distribution of the different gas phases and the star formation in nearby galaxies. Both Meurer et al. (2013) and Zheng et al. (2013) dealt with the radial properties of small representative samples of disc galaxies. Here we adapt these models and apply them to a much larger sample of galaxies in order to understand integrated properties, in particular the SFE, along the full range of star-forming galaxies.
2.1 Model overview
In this paper, we use a modified version of the constant two-fluid Qsg model (Zheng et al. 2013) and compare these model results to a different low-redshift sample of galaxies which samples a larger range and variety of star-forming galaxies. Following the results of Zheng et al. (2013), we assume that the gas and stars are both in cold discs, and adopt a constant Qsg = 1.6 and fix the gas velocity dispersion (σg) at 11 km s−1, following the results of the THINGS survey where the gas velocity dispersion is derived from the second-order H i moment maps (Leroy et al. 2008; Zheng et al. 2013). We adopt a universal rotation curve (URC; Persic, Salucci & Stel 1996; Battaner & Florido 2000) to specify the galaxy dynamics and adopt observationally based scaling relations to specify the stellar mass distribution. We are then in a position to calculate the cold gas distribution, and after separating the gas into molecular and atomic phases, we then calculate the SFR distribution. Here, we consider only the most successful two prescriptions from Zheng et al. (2013) for apportioning the gas into the atomic and molecular phases.
To be more specific, each model galaxy is parametrized as a function of the rotation curve amplitude, Vmax. As such, we describe the properties of our model galaxies as one-dimensional radial profiles. The stellar mass distribution in our models is determined via two empirically observed relationships from our sample, namely the Tully–Fisher relationship (TFR) and the relationship between the stellar surface brightness and Vmax. We then solve for the gas distribution (Σg) using the two-fluid Q approximation described by Wang & Silk (1994). From the resulting Σg, we apportion the gas into its molecular and atomic components using two different prescriptions for the molecular-to-atomic gas ratio (Rmol) via (1) the stellar surface density and (2) the hydrostatic pressure. Subsequently, we estimate the SFR from the molecular gas content by assuming a largely linear relationship between H2 and the SFR. Fig. 1 shows a flow diagram that summarizes how our model determines the |${\rm SFE}_{{\rm H\,\small {I}}}$| from our model. More details of our model are given in Section 2.2.
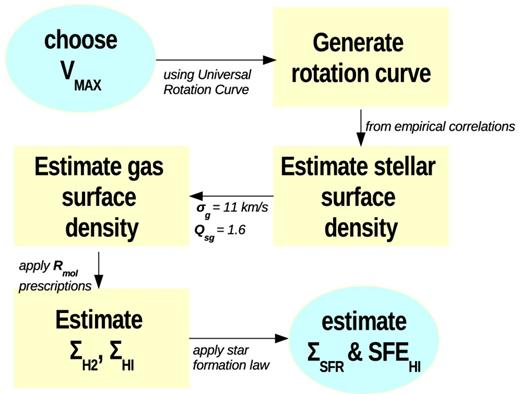
Flow diagram summarizing our method for determining |${\rm SFE}_{{\rm H\,\small {I}}}$| in our model.
In summary, our model is essentially a prescription for how to distribute the gas phases and star formation within galaxies. The essential principle of the model is that galaxy discs evolve to have a uniform stability parameter. In order to calculate the model, the rotation curve of the galaxy and distribution of existing stars are required. There are many important details that this model does not address, such as the mechanism by which the stability parameter is maintained. Presumably, it involves feedback between the energy input from supernovae and stellar winds from recent star formation. Recent models by Lehnert et al. (2013) argue that star formation-driven turbulence drives the observed velocity dispersions and that the disc instability is a result of such turbulence. However, how the gas reservoir responds to maintain Q and the exact value of Q that results are not explicitly addressed. Similarly, we use known scaling relations to determine the stellar distribution. But we do not address the underlying physics of these relations. In Section 5.1, we show that the model results remain within the scatter of the observations when adjusting the relevant free parameters of the model within known constraints.
2.2 Model details
We model the |${\rm SFE}_{{\rm H\,\small {I}}}$| relation as a one-dimensional sequence as a function of rotation curve amplitude Vmax. This is used as the driving parameter since it typically is used as shorthand for the halo mass in a standard (Λ) cold dark matter cosmology (e.g. Navarro, Frenk & White 1997). We specify the rotation curve shape Vc(R) using the URC algorithm of Persic et al. (1996), as implemented by Battaner & Florido (2000). This family of rotation curves is based on long-slit observations of disc galaxies which range in vmax from 60 to 280 km s−1 (Mathewson, Ford & Buchhorn 1992). The stellar distribution in each galaxy is assumed to be a pure exponential disc (e.g. Freeman 1970); the total stellar luminosity for given Vmax is given by the TFR (Fisher & Tully 1981; Meyer et al. 2008) while the central surface brightness and thus scalelength are given by the surface brightness–Vmax relationship, which is a variant of the well-known surface brightness–luminosity relationship (e.g. Disney & Phillipps 1985; Kauffmann et al. 2003). These two relationships are defined in the R band using SINGG data, and so are well calibrated to our sample. We note that our model does not take into consideration the contribution from a bulge component. Further discussion on the implications of our ‘bulgeless' model can be found in Section 5.
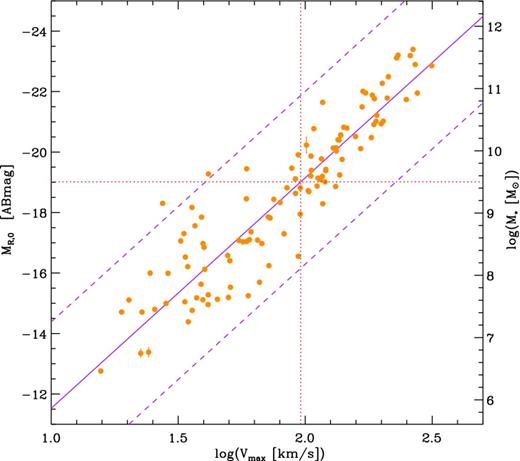
The TFR for SINGG galaxies in the R band, showing the dust-corrected absolute R-band magnitude MR, 0 derived from the SINGG images versus the rotation velocity amplitude Vmax derived from H i line widths from the HIPASS survey. Selection criteria for inclusion in this plot and references to the corrections employed are given in the text. An ordinary least-squares fit to the data, with iterative clipping of outliers, is shown as the solid line. The dashed lines show the ±3σR clipping limit to the fit, where σR is the dispersion about the fit. The right axis converts MR, 0 to stellar mass using equation (4). The horizontal dotted line shows the stellar mass below which Simons et al. (2015) find that the TFR breaks down. The vertical dotted line marks where this intercepts our adopted TFR.
This paper is not focused on the TFR; the measurements are not ‘tuned' to provide the tightest most accurate relationship. Nevertheless, the TFR we find is of reasonable quality and reaches well into the dwarf galaxy regime. Several modern studies have shown a break in the TFR for low-mass galaxies. McGaugh et al. (2000) and McGaugh (2005) note that the TFR changes slope and has larger scatter for stellar mass |$M_\star \lesssim 10^9\, {\mathrm{M}_{\odot }}$|. They find a tighter more continuous relationship between the baryonic mass (stellar plus gas mass) and the rotational amplitude which they coined the baryonic TFR. Recently, Simons et al. (2015) and Cortese et al. (2014) found that for |$M_\star \lesssim 10^{9.5}\, {\mathrm{M}_{\odot }}$| there are more extreme outliers to the TFR than at higher masses, and that using the kinematic quantity S0.5 which combines contributions from rotation and turbulence restores a tighter relationship. We find an increased scatter about our TFR for dwarf galaxies. For |${V_{\rm {max}}}\le 96\, {\rm km\, s^{-1}}$| [corresponding to MR > −19.02 ABmag, and |$M_\star < 10^{9.5}\, {\mathrm{M}_{\odot }}$| following equations (4) and (5)], the residuals have a dispersion of 1.25 mag, while the dispersion for the points with |${V_{\rm {max}}}> 96\, {\rm km\, s^{-1}}$| is 0.72 mag (no clipping was done). There is no perceptible change in slope in the TFR for dwarfs within the scatter of our measurements. Meyer et al. (2008) attribute the increased scatter in the TFR of HIPASS galaxies (our parent sample) to the difficulty of estimating the inclination of dwarfs. We likely avoid the extreme outliers found by Simons et al. (2015) because we are using an H i-selected sample, pruned of strongly interacting galaxies, with kinematics based on H i line widths. Like their S0.5 parameter, these widths are determined by contributions from rotation and turbulence; additionally they sample the dynamics to larger radii where the rotation curve is flatter than the ionized gas tracers used by Simons et al. (2015) and Cortese et al. (2014). We conclude that our adopted TFR is adequate for our purposes.
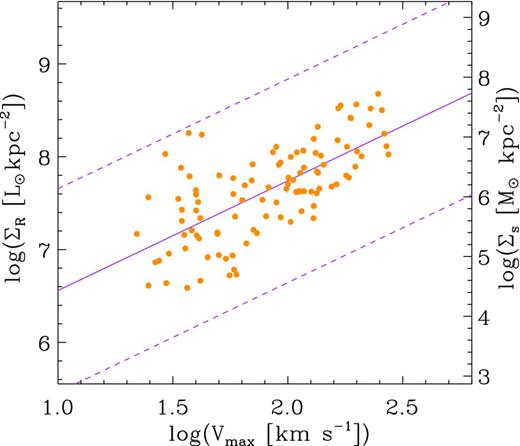
The observed relationship between R-band effective surface brightness ΣR and rotation velocity amplitude for SINGG galaxies. An ordinary least-squares fit to the data is shown as the solid line. The dashed lines are offset by |$\pm 2\sigma _\Sigma$| from the fit, where |$\sigma _\Sigma$| is the dispersion about the fit. The right axis shows the approximate stellar mass density, Σs.
As noted in Meurer et al. (2013), a constant-Q disc dominated by gas in the outskirts of galaxies where the rotation curve is flat should have Σg(R) ∝ R−1. The corresponding integrated gas content is not finite unless the distribution is truncated. Here we truncate the discs at the radius where the orbital time torb = 2πR/Vc(R) = 1 Gyr, following the work of Meurer et al. (2014) on the relationship between Vc and maximum radius in galaxies including the SINGG and SUNGG sample.

2.3 Model demonstration
To illustrate the behaviour of our constant-Q disc models, we show in panels (a) and (b) of Fig. 5 the H i and H2 gas densities (|$\Sigma _{\rm {{\rm H\,\small {I}}}}$|, ΣH2) of our models for a low- and a high-mass galaxy. The left-hand panels (a and c) of Fig. 5 represent the models for a low-mass disc galaxy with a maximum circular velocity (vmax) of 60 km s−1. The right-hand panels (b and d) show a Milky Way analogue galaxy having Vmax =220 km s−1, close to the highest Vmax in our model sequence. The models for the stellar mass density and hydrostatic pressure prescriptions for Rmol (Section 2.1) are shown with green and blue lines, respectively.
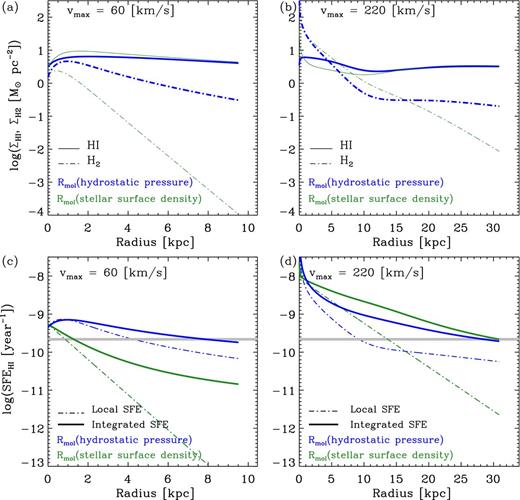
Panels (a) and (b) show the gas surface mass density as a function of radius for two constant-Q disc models: (a) a dwarf galaxy with a maximum circular velocity of 60 km s−1and (b) a massive disc galaxy with a maximum circular velocity of 220 km s−1. The atomic H i gas density (|$\Sigma _{\rm {{\rm H\,\small {I}}}}$|) is represented by the solid lines and the molecular H2 gas density (ΣH2) is represented by the dot–dashed lines. The models using the molecular gas ratio (Rmol) estimated via the stellar mass surface density are shown in green, and those using Rmol estimated via hydrostatic pressure arguments are shown in blue. Panels (c) and (d) show the local |${\rm SFE}_{{\rm H\,\small {I}}}$| (dot–dashed lines) and integrated |${\rm SFE}_{{\rm H\,\small {I}}}$| within the specified radius (solid lines) for our models. To guide the eye, we show the mean |${\rm SFE}_{{\rm H\,\small {I}}}$| (log (|${\rm SFE}_{{\rm H\,\small {I}}}$|) = −9.65) found from our sample as a thick grey horizontal line.
In general, it appears that the stellar surface density Rmol prescription is unable to convert the H i to H2 at large radii where the stellar surface densities are low. This is especially obvious in the case of the low-mass disc galaxy and at large disc radii for both low- and high-mass disc galaxies. These results of star formation at low gas densities are consistent with the observations of galaxies with extended UV discs (Thilker et al. 2007) where star formation in the outer low-density regions is more common than expected, based upon our understanding of star formation within the established stellar disc.
The bottom row panels of Fig. 5 [panels (c) and (d)] show the resulting |${\rm SFE}_{{\rm H\,\small {I}}}$| at a given radius (local) and the global |${\rm SFE}_{{\rm H\,\small {I}}}$| interior to a radius (integrated) for our models of the low- and high-mass disc galaxies. Our modelled local |${\rm SFE}_{{\rm H\,\small {I}}}$| radial profiles are consistent with recent observations of nearby galaxies whereby the radial profiles of SFE flatten in the outer parts of galaxies at much lower values than those in the optical discs (e.g. Yim & van der Hulst 2015). At large radii, the integrated |${\rm SFE}_{{\rm H\,\small {I}}}$| for both low- and high-mass disc models using the hydrostatic disc pressure molecular gas fraction prescription are very close to the mean |${\rm SFE}_{{\rm H\,\small {I}}}$| found in our sample [as shown by the grey line in panels (c) and (d)]. While both Rmol prescriptions result in very similar integrated |${\rm SFE}_{{\rm H\,\small {I}}}$| for the model of the high-mass disc galaxy, this is not the case for the model of the low-mass disc where the stellar surface density prescription underpredicts the observed integrated |${\rm SFE}_{{\rm H\,\small {I}}}$|.
Previous studies of SFR (and SFE) with stellar surface densities are likely to be biased towards galaxies and portions of galaxies with high molecular gas and stellar densities (e.g. Leroy et al. 2008; Wong et al. 2013) due to optical/UV and molecular gas observational limits. As such, only a narrow range of stellar surface densities (which trace the hydrostatic disc pressure) is studied.
3 SAMPLE AND OBSERVATIONS
We obtain our sample of nearby star-forming galaxies from the SINGG (Meurer et al. 2006) and the SUNGG surveys (Wong 2007; Wong & Meurer, in preparation) – two surveys which imaged an H i-selected sample of galaxies from the HIPASS survey (Koribalski et al. 2004; Meyer et al. 2004; Zwaan et al. 2004; Wong et al. 2006) in the optical and the ultraviolet wavelengths. The size of the sample used in this paper is a factor of 7 greater than that used in Meurer et al. (2013) and Zheng et al. (2013) and spans a larger range of star-forming galaxies in size and brightness (see Fig. 6). The optical R-band and Hα imaging for SINGG were primarily obtained from the 1.5 m telescope at the Cerro Tololo Inter-American Observatory in Chile, while the Galaxy Evolution Explorer (GALEX) satellite telescope is used to obtain the far- and near-ultraviolet (FUV and NUV) for SUNGG at 1524 and 2273 Å, respectively.
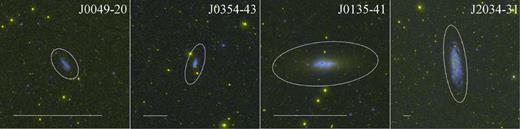
Four galaxies representing the variety in size and stellar surface brightness of the star-forming galaxies from the SUNGG survey. GALEX three-colour 15 arcmin by 15 arcmin postage stamps of the SUNGG UV observations where the FUV and NUV are represented by the blue and yellow, respectively. The RGB colour scaling of these images is shown by Gil de Paz et al. (2007) where blue, green and red represents the FUV, linear combination of FUV and NUV emission, and NUV emission (as per Gil de Paz et al. 2007), respectively. The scale bar represents 10 kpc.
The sample overlap between SINGG and SUNGG consists of 306 nearby galaxies. We adopt as our sample the subset of those where (a) the 15 arcmin HIPASS beam contains only one associated star-forming galaxy, and (b) the optical major-to-minor axial ratio is a/b > 1.6. Multiple and face-on galaxies are thus excluded so that vmax can be more accurately estimated from the H i line width.
Table 1 lists the properties of the 84 galaxies used in this paper. The distances are from Meurer et al. (2006) and mostly calculated from their recessional velocities (following Mould et al. 2000). They range from 3.3 to 112 Mpc with a median of 13 Mpc. Fig. 7 presents the H i and stellar mass distributions for our H i-selected sample of star-forming galaxies. Distinct from optically selected samples of star-forming galaxies, we do not propagate a bias against star-forming galaxies with low stellar masses and/or low stellar surface brightnesses. We note that approximately half of our sample have stellar masses below 109 M⊙, where there is an increased scatter in both the TFR and the Vmax and ΣR relationship described in Section 2.2.
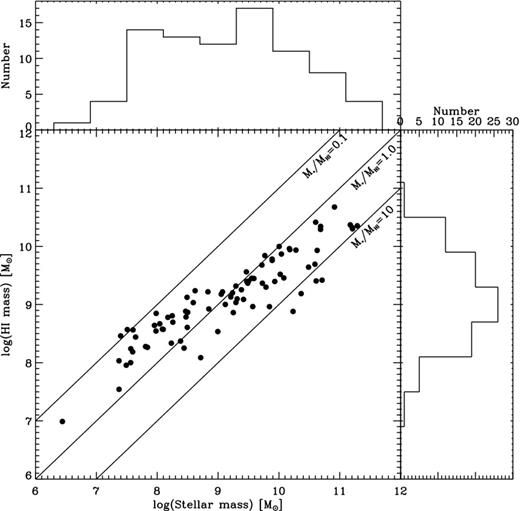
The H i and stellar mass distributions of our sample. The solid lines are lines of constant stellar-to-H i mass fractions ranging from 0.1 to 10.
Properties of our sample. Column 1: the HIPASS identification of the galaxy. Column 2: distances in megaparsecs. Column 3: circular velocity in km s−1. Column 4: dust-corrected optical R-band absolute magnitude. Column 5: effective R-band surface brightness density in L⊙ kpc−2. Column 6: log of H i-normalized SFE.
| HIPASS galaxy | Distance | vmax | MR | log ΣR | log(|${\rm SFE}_{{\rm H\,\small {I}}}$|) |
|---|---|---|---|---|---|
| J0008−59 | 112.1 | 216.0 | − 22.5 | 7.73 | − 10.10 |
| J0014−23 | 7.0 | 106.0 | − 19.2 | 7.33 | − 9.96 |
| J0039−14a | 20.6 | 45.0 | − 19.3 | 8.11 | − 9.53 |
| J0043−22 | 4.9 | 24.0 | − 14.7 | 6.89 | − 9.72 |
| J0047−09 | 19.1 | 74.0 | − 17.8 | 7.13 | − 10.06 |
| J0047−25 | 3.9 | 209.0 | − 21.8 | 8.02 | − 9.28 |
| J0049−20 | 3.3 | 21.0 | − 12.8 | 6.72 | − 9.94 |
| J0052−31 | 22.9 | 173.0 | − 22.0 | 8.31 | − 10.17 |
| J0135−41 | 4.1 | 40.0 | − 17.6 | 7.71 | − 9.57 |
| J0145−43 | 4.4 | 38.0 | − 16.2 | 6.96 | − 9.06 |
| J0256−54 | 7.1 | 63.0 | − 17.4 | 6.65 | − 10.44 |
| J0307−31 | 66.9 | 189.0 | − 21.8 | 7.54 | − 10.13 |
| J0309−41 | 12.9 | 77.0 | − 18.4 | 7.08 | − 9.72 |
| J0310−33 | 15.3 | 61.0 | − 17.0 | 6.86 | − 10.08 |
| J0317−37 | 13.5 | 27.0 | − 14.7 | 7.53 | − 9.87 |
| J0320−52 | 7.0 | 43.0 | − 17.0 | 7.52 | − 9.53 |
| J0328−08 | 17.4 | 129.0 | − 20.1 | 7.47 | − 10.05 |
| J0331−51 | 14.3 | 133.0 | − 20.0 | 8.04 | − 9.15 |
| J0333−50 | 8.1 | 66.0 | − 17.1 | 7.46 | − 9.80 |
| J0344−44 | 15.9 | 202.0 | − 21.0 | 7.86 | − 10.02 |
| J0345−35 | 10.8 | 39.0 | − 14.8 | 6.55 | − 10.32 |
| J0349−48 | 13.1 | 133.0 | − 18.9 | 7.22 | − 9.90 |
| J0354−43 | 12.3 | 53.0 | − 15.2 | 7.13 | − 9.47 |
| J0355−40 | 10.5 | 44.0 | − 15.0 | 7.30 | − 9.95 |
| J0355−42 | 11.2 | 120.0 | − 19.0 | 7.95 | − 9.62 |
| J0404−54 | 15.9 | 186.0 | − 20.9 | 8.05 | − 9.23 |
| J0406−21 | 12.8 | 90.0 | − 19.5 | 7.92 | − 9.70 |
| J0411−35 | 11.4 | 43.0 | − 15.6 | 7.37 | − 9.89 |
| J0421−21 | 12.4 | 96.0 | − 18.8 | 7.24 | − 9.81 |
| J0429−27 | 13.0 | 44.0 | − 16.9 | 7.44 | − 9.08 |
| J0451−33 | 16.2 | 104.0 | − 18.7 | 7.60 | − 9.58 |
| J0459−26 | 10.0 | 118.0 | − 19.2 | 7.51 | − 9.81 |
| J0505−37 | 16.7 | 169.0 | − 22.0 | 8.28 | − 8.96 |
| J0506−27 | 17.8 | 43.0 | − 17.8 | 7.55 | − 9.96 |
| J0506−31 | 10.9 | 40.0 | − 18.2 | 8.16 | − 9.31 |
| J0510−36 | 14.1 | 86.0 | − 18.8 | 7.56 | − 9.72 |
| J0515−41 | 14.5 | 84.0 | − 17.3 | 7.28 | − 10.30 |
| J0516−37 | 18.7 | 140.0 | − 19.8 | 7.51 | − 10.05 |
| J0533−36 | 18.4 | 116.0 | − 19.8 | 7.68 | − 9.65 |
| J1002−06 | 9.7 | 64.0 | − 15.9 | 6.84 | − 10.05 |
| J1017−03 | 19.4 | 105.0 | − 18.7 | 7.67 | − 9.70 |
| J1046+01 | 12.2 | 118.0 | − 18.3 | 7.31 | − 9.89 |
| J1051−19 | 31.0 | 133.0 | − 20.1 | 7.31 | − 9.94 |
| J1105−00 | 8.6 | 248.0 | − 21.7 | 8.45 | − 9.34 |
| J1107−17 | 11.9 | 68.0 | − 15.7 | 7.64 | − 9.70 |
| J1110+01 | 11.4 | 41.0 | − 15.2 | 7.16 | − 10.10 |
| J1127−04 | 10.6 | 43.0 | − 15.1 | 7.11 | − 9.86 |
| J1153−28 | 24.4 | 137.0 | − 20.4 | 7.44 | − 9.82 |
| J1205−14 | 20.4 | 138.0 | − 20.6 | 7.65 | − 9.67 |
| J1217+00 | 8.9 | 32.0 | − 15.0 | 6.60 | − 9.98 |
| J1231−08 | 11.1 | 121.0 | − 19.4 | 7.75 | − 9.26 |
| J1232+00b | 10.6 | 154.0 | − 20.4 | 7.30 | − 9.78 |
| J1232−07 | 10.5 | 137.0 | − 19.2 | 7.72 | − 9.66 |
| J1235−07 | 10.4 | 95.0 | − 16.6 | 7.38 | − 10.01 |
| J1253−12 | 8.6 | 44.0 | − 16.1 | 7.07 | − 9.92 |
| J1255+00 | 15.3 | 116.0 | − 19.1 | 7.51 | − 9.47 |
| J1303−17b | 7.7 | 56.0 | − 17.1 | 6.83 | − 10.16 |
| J1304−10 | 47.4 | 266.0 | − 23.4 | 7.91 | − 9.51 |
| J1329−17 | 22.1 | 257.0 | − 21.8 | 7.60 | − 9.67 |
| J1423+01 | 22.5 | 121.0 | − 19.4 | 7.50 | − 9.62 |
| J1447−17 | 33.5 | 109.0 | − 20.8 | 7.57 | − 9.65 |
| J1500+01 | 22.5 | 191.0 | − 21.2 | 8.21 | − 9.12 |
| J1558−10 | 14.8 | 53.0 | − 16.4 | 7.74 | − 10.24 |
| J2009−61 | 11.2 | 62.0 | − 17.1 | 7.28 | − 10.04 |
| J2034−31 | 41.9 | 259.0 | − 23.2 | 8.18 | − 9.45 |
| J2044−68 | 45.4 | 230.0 | − 23.1 | 8.02 | − 9.58 |
| J2052−69 | 7.5 | 92.0 | − 18.6 | 7.40 | − 9.72 |
| J2127−60 | 24.9 | 146.0 | − 20.8 | 7.73 | − 9.69 |
| J2129−52 | 12.3 | 81.0 | − 18.3 | 7.44 | − 9.85 |
| J2135−63 | 45.2 | 233.0 | − 23.2 | 8.19 | − 9.32 |
| J2136−54 | 12.0 | 102.0 | − 20.2 | 7.50 | − 9.40 |
| J2214−66 | 24.8 | 184.0 | − 20.5 | 7.63 | − 10.39 |
| J2217−42 | 32.1 | 29.0 | − 16.0 | 6.81 | − 10.26 |
| J2220−46 | 13.2 | 106.0 | − 19.9 | 7.15 | − 10.04 |
| J2234−04 | 14.1 | 53.0 | − 16.6 | 7.12 | − 10.12 |
| J2235−26 | 21.1 | 167.0 | − 21.5 | 7.96 | − 9.53 |
| J2239−04 | 13.2 | 33.0 | − 16.0 | 6.90 | − 9.86 |
| J2254−26 | 12.3 | 74.0 | − 16.2 | 7.86 | − 10.04 |
| J2257−42 | 13.4 | 59.0 | − 17.0 | 6.65 | − 10.13 |
| J2302−40 | 15.3 | 95.0 | − 19.9 | 7.77 | − 9.52 |
| J2326−37 | 10.0 | 37.0 | − 16.5 | 7.37 | − 9.77 |
| J2337−47 | 40.8 | 277.0 | − 22.0 | 7.78 | − 10.30 |
| J2349−37 | 9.2 | 45.0 | − 15.3 | 6.62 | − 10.18 |
| J2352−52 | 7.7 | 24.0 | − 15.1 | 7.13 | − 9.88 |
The optical and UV magnitudes and luminosities have been corrected for both Galactic and internal dust extinction. We have used the internal FUV attenuation correction method derived by Salim et al. (2007) for a sample of low-redshift galaxies. The internal dust absorption correction for the optical observations is calculated empirically, based on the R-band luminosity (Helmboldt et al. 2004; Meurer et al. 2006).
3.1 The effect of the internal dust corrections on the |${\rm SFE}_{{\rm H\,{\small {I}}}}$|
Although the FUV emission is a well-established tracer of recent star formation, the FUV emission is highly susceptible to dust extinction and may artificially influence the observed range of |${\rm SFE}_{{\rm H\,\small {I}}}$|. Fig. 8 compares the |${\rm SFE}_{{\rm H\,\small {I}}}$| as a function of circular velocity with and without internal dust extinction in panels (a) and (b), respectively. The standard deviations of the scatter in |${\rm SFE}_{{\rm H\,\small {I}}}$| in panels (a) and (b) are very similar with log values of 0.28 and 0.29, respectively.
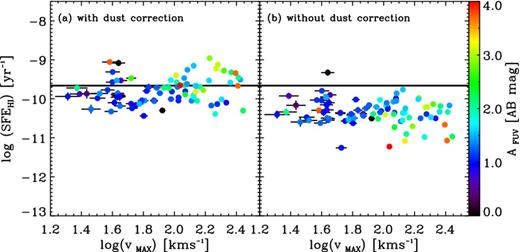
Effect of internal dust extinction on the measured |${\rm SFE}_{{\rm H\,\small {I}}}$| in our sample. Panel (a) shows the integrated |${\rm SFE}_{{\rm H\,\small {I}}}$| with internal dust correction as a function of vmax and panel (b) shows the integrated |${\rm SFE}_{{\rm H\,\small {I}}}$| without dust correction as a function of vmax. The horizontal line marks the mean |${\rm SFE}_{{\rm H\,\small {I}}}$| of our sample. The data points are coloured according to the internal dust correction as shown on the colour bar on the right of the figure.
The omission of the dust extinction correction (as seen in Fig. 8b) results in |${\rm SFE}_{{\rm H\,\small {I}}}$| which are on average 3.8 times lower than the average dust-corrected |${\rm SFE}_{{\rm H\,\small {I}}}$| for our sample. This implies that on average, only ∼26 per cent of the FUV emission escapes from the galaxies. While it is clear that the application of internal dust corrections has renormalized the |${\rm SFE}_{{\rm H\,\small {I}}}$|, the constancy and scatter of the |$SFE_{{\rm H\,\small {I}}}$| are not significantly reduced by these dust corrections. In Fig. 8, the colour of each data point shows the internal FUV dust correction AFUV. AFUV correlates with Vmax; we also find a weak correlation of AFUV with |${\rm SFE}_{{\rm H\,\small {I}}}$|. These are both expected – galaxies with more mass and more star formation tend to be dustier.
4 SFE IN NEARBY GALAXIES
Fig. 8(a) presents the SFE of our sample galaxies as a function of the circular velocity (Vmax). Our sample have a mean and median log |$({\rm SFE}_{{\rm H\,\small {I}}})$| of −9.65 and −9.81, respectively, as well as a standard deviation of 0.28 dex. In comparison, the stellar mass-selected GASS survey finds a constant |${\rm SFE}_{{\rm H\,\small {I}}}$| of 10−9.5 yr−1 (Schiminovich et al. 2010), while the average log |$({\rm SFE}_{{\rm H\,\small {I}}})$| from ALFALFA is log |$({\rm SFE}_{{\rm H\,\small {I}}})=-9.95$| (Huang et al. 2012).
4.1 Comparison with stable disc models
In Fig. 9, we compare the observed global |${\rm SFE}_{{\rm H\,\small {I}}}$| for our sample of nearby star-forming galaxies to those predicted by our stable disc models (as described in Section 2). The predicted |${\rm SFE}_{{\rm H\,\small {I}}}$| from our stable disc models are in good agreement with those found for our sample of nearby star-forming galaxies. This is especially the case for our model which uses the hydrostatic pressure prescription for Rmol (equation 10). We find a mean log (|${\rm SFE}_{{\rm H\,\small {I}}}$|) = −9.71 and a standard deviation of 0.02 dex for our stable disc model which uses the PhRmol prescription. This mean |${\rm SFE}_{{\rm H\,\small {I}}}$| is evaluated individually for each modelled galaxy with Vmax between 60 and 280 km s−1 in increments of 0.4 km s−1. While both Rmol prescriptions yield similar global |${\rm SFE}_{{\rm H\,\small {I}}}$| for galaxies similar in mass to the Milky Way [see Figs 5(d) and 9], the stellar mass density prescription (equation 9) for Rmol predicts that the |${\rm SFE}_{{\rm H\,\small {I}}}$| should correlate strongly with Vmax, which is not observed.
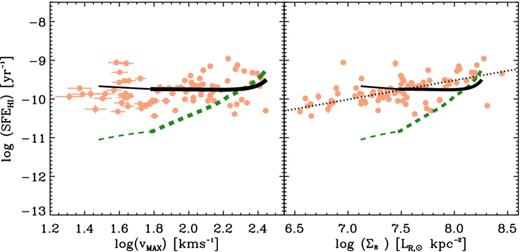
The |${\rm SFE}_{{\rm H\,\small {I}}}$| as a function of circular velocity (vmax) and the effective R-band surface brightness (ΣR). The solid black line represents our model where Rmol is dictated by the hydrostatic pressure (Ph) and the dashed green line represents our model where the Rmol depends on the stellar surface density (Σ⋆). We note that the rotation curves used in our models are calibrated to observations only for Vmax covering the range of 60–280 km s−1. The thinner line extensions to lower Vmax are extrapolations of our disc models' predictions for galaxies with Vmax between 30 and 60 km s−1.
If we extend our models to above our current limit of Vmax = 280 km s−1, we find sharply rising rotation curves, presumably from a strong bulge, resulting in large gas densities required to maintain a constant Q and thus high star formation intensity (i.e. starburst). Consequently, a sharply rising |${\rm SFE}_{\rm {{\rm H\,\small {I}}}}$| with Vmax would result for our models for Vmax > 280 km s−1. This suggests that either a stable disc cannot be maintained in the central regions of high-mass galaxies (Zheng et al. 2013) or that high-mass galaxies have already exhausted their central gas repositories through previous starburst activity. We note that for a Vmax ≤ 280 km s−1 limit, the resulting |${\rm SFE}_{\rm {{\rm H\,\small {I}}}}$| differs very little from our standard model sequence if we replace our adopted SFL with the linear molecular SFL of Zheng et al. (2013). This is because the required gas densities are typically barely high enough to invoke the ‘starburst' component of our adopted SFL, and then only in the central regions of models at the highest Vmax values. The ‘starburst' component becomes more relevant for our low angular momentum model (discussed later in this section) and our models of z = 2 galaxies (see Section 5.3).
Within our sample, we do not have any galaxies with Vmax > 280 km s−1; they are rare in the Local Universe. As noted in Section 2.1, such galaxies are beyond the range of properties used to calibrate the URC; hence, it is not clear that such an extrapolation produces a realistic rotation curve. Our sample selection excludes galaxies with star-forming companions which may further decrease the probability of our sample including galaxies with high Vmax. In addition, higher mass systems in the Local Universe are redder and forming less stars (e.g. Kauffmann et al. 2003) and hence, not expected to possess large reservoirs of H i.
While the rotation curve model used is not calibrated for galaxies with Vmax < 60 km s−1, the extrapolation of our model (which uses the PhRmol prescription) to lower Vmax continues to be in good agreement with our observations (see Fig. 9). This suggests that the URC model adequately accounts for the true rotation curves of dwarf galaxies.
Our sample of nearby star-forming galaxies show a positive correlation between |${\rm SFE}_{{\rm H\,\small {I}}}$| and the R-band surface brightness, ΣR. A robust linear fit results in a positive slope of 0.50 and an rms scatter about this fit of 0.23 dex and a Pearson R-correlation coefficient of 0.55. Relative to our stable disc models, this correlation has a slope which is less steep than the disc model which uses the Σ⋆Rmol prescription (slope of 1.94). While the disc model which uses the PhRmol prescription predicts a better fit to the data, the predicted slope is −0.03.
4.2 Variations in the intrinsic surface brightness distribution
The positive correlation between ΣR and |${\rm SFE}_{{\rm H\,\small {I}}}$| suggests that a second parameter is at play. Since the primary parameter of our model is Vmax, a proxy for total mass, an obvious choice for the second parameter is the spin or angular momentum of the disc. For a given Vmax, a low angular momentum disc will appear more concentrated and hence has a higher surface brightness relative to a high angular momentum disc. The rotation curve will reach the same Vmax but has a steeper rise in the centre. In the context of our model, this results in an increased central SFR, but relatively little change in the H i content, and hence a higher |${\rm SFE}_{{\rm H\,\small {I}}}$| for a given Vmax. Fig. 2 shows that the Vmax–surface brightness correlation has a scatter of 0.3 dex in ΣR. This is equivalent to a scatter of 0.15 dex in scalelength, or a factor of 1.4 for pure exponential discs at fixed luminosity.
To test the effects of angular momentum on our models, we expanded and contracted the scalelength of the disc surface mass distribution, the rotation curve, and the truncation radius while keeping the luminosity and Vmax fixed in our models. Fig. 10 shows another version of Fig. 9 where the Ph prescription for Rmol is plotted in lines of three different thicknesses and colours to represent three variations in our model's surface brightness distribution. The default surface brightness distribution used in this paper (represented by the black line in Fig. 9) is also represented by the black solid line of intermediate thickness in Fig. 10. The green and blue solid lines in Fig. 10 represent ±1σ variations in the surface brightness distributions versus Vmax relationship. We note that the scatter in the Rmax versus Vmax relationship from which we derive the constant orbital time is ≈0.16 dex. Therefore, the scatters in both relationships are consistent with being driven by the scatter in the scale size. In addition, we show in Fig. 10 that the differences are not significant between the models that use the SFL described in Section 2.2 (solid lines) or the linear molecular SFLs (dashed lines) as per Zheng et al. (2013).
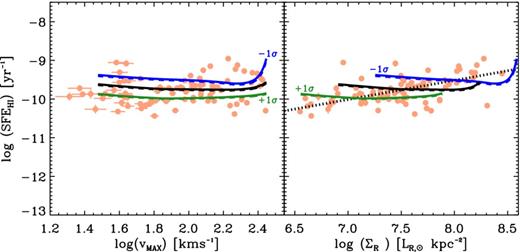
The data in these two panels are the same as in Fig. 8. Here, the solid lines represent our model where Rmol is dictated by the hydrostatic pressure (Ph) and the dotted line marks the positive correlation between stellar surface brightness and |${\rm SFE}_{{\rm H\,\small {I}}}$|. The middle solid line (black) corresponds to our default model as shown in Fig. 9. The top and bottom solid lines correspond to the −1σ and +1σ variation in the linear scalelengths at fixed stellar luminosities and Vmax, respectively. The dashed lines represent the model with a simple linear molecular SFL as per Zheng et al. (2013).
As can be seen in the right-hand panel of Fig. 10, by varying the scalelength by 0.15 dex and using our Ph prescription for Rmol, we produce model lines that are shifted diagonally in the |${\rm SFE}_{{\rm H\,\small {I}}}$| versus ΣR plane and encompass the envelope of observed data points.3 Therefore, we posit that the observed correlation between the stellar surface density and |${\rm SFE}_{{\rm H\,\small {I}}}$| is due to an intrinsic variation in the underlying scalelength and hence disc angular momentum of the galaxies.
5 DISCUSSION
5.1 Varying the initial assumptions of our model
We examine the robustness of the assumptions and empirical correlations used in our models by investigating the resulting effects when each of these assumptions is varied. We show in this subsection that our results remain unchanged and are robust against the uncertainties that exist within the assumptions made and empirical correlations used in our model. Our variation of our initial assumptions within known constraints results in models which are still consistent within the scatter of our observations. We specifically examine the effects of varying three key parameters of our models, namely (a) the value of the assumed constant Qsg; (b) the gas velocity dispersion, σg; and (c) the zero-point in the TFR. Table 2 lists the observed mean |${\rm SFE}_{{\rm H\,\small {I}}}$| of our sample, the mean |${\rm SFE}_{{\rm H\,\small {I}}}$| of our default model, and the mean |${\rm SFE}_{{\rm H\,\small {I}}}$| of the model sequence when each of these parameters is adjusted.
Comparison of the observed mean |${\rm SFE}_{{\rm H\,\small {I}}}$| with the mean values of the various models tested in Section 5.1.
| Sample | log (mean |${\rm SFE}_{{\rm H\,\small {I}}}$|) (yr−1) |
|---|---|
| Observations | −9.65 (±0.28) |
| Default model | −9.71 |
| Qsg = 1.3 | −9.47 |
| Qsg = 1.9 | −9.83 |
| σg = 8 km s−1 | −9.89 |
| σg = 20 km s−1 | −9.58 |
| 1σ brighter TFR | −9.65 |
| 1σ fainter TFR | −9.58 |
| Sample | log (mean |${\rm SFE}_{{\rm H\,\small {I}}}$|) (yr−1) |
|---|---|
| Observations | −9.65 (±0.28) |
| Default model | −9.71 |
| Qsg = 1.3 | −9.47 |
| Qsg = 1.9 | −9.83 |
| σg = 8 km s−1 | −9.89 |
| σg = 20 km s−1 | −9.58 |
| 1σ brighter TFR | −9.65 |
| 1σ fainter TFR | −9.58 |
Recent studies such as Zheng et al. (2013) have measured the radial profiles of the Toomre Qsg in samples of nearby galaxies and have determined that the Qsg values within the discs of galaxies are constant with an average Qsg of 1.6. However, the standard deviation of the derived Qsg for the Zheng et al. (2013) sample is 0.3 excluding the two largest outliers in their sample. Both outliers in the Zheng et al. (2013) sample have Qsg > 2.0 and consist of a dwarf galaxy and a very massive galaxy with Vmax of 50 and 300 km s−1, beyond the range of the Vmax used in the family of rotation curves adopted in this paper.
Fig. 11(a) illustrates the effect of varying the assumed constant Qsg in our models by ±1σ. Increasing to Qsg = 1.9 results in a lower gas content. The molecular phase and therefore the SFR is more suppressed than the atomic phase resulting in a lower |${\rm SFE}_{{\rm H\,\small {I}}}$|. The converse is true if we decrease the stability parameter to Qsg = 1.3.
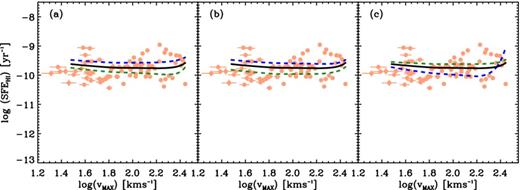
The data in these two panels are the same as in Fig. 8. Here, the black solid lines in all three panels represent the default model where Rmol is dictated by the hydrostatic pressure (Ph) as in Fig. 9. Panel (a) shows alternative models which assume constant Qsg = 1.3 (blue dashed line) and constant Qsg = 1.9 (green dashed line). Panel (b) shows alternative models which assume σg = 14 km s−1 (blue dashed line) and σg = 8 km s−1 (green dashed line). Panel (c) shows alternative models which adopt TFR which differ by the 1σ scatter in Fig. 2. The models which adopt a TFR that is 1σ brighter and 1σ fainter are represented by the blue dashed line and the green dashed line, respectively.
Our adopted constant gas velocity dispersion of 11 km s−1 is based upon the mean dispersion measurements from the THINGS H i second-order moment maps (Leroy et al. 2008; Tamburro et al. 2009; Zheng et al. 2013). The 1σ scatter of these measurements is 3 km s−1. We show in Fig. 11(b) that a model which assumes a larger gas velocity dispersion results in a higher |${\rm SFE}_{{\rm H\,\small {I}}}$| than one which assumes a lower gas velocity dispersion. This is because increasing the velocity dispersion allows more gas to be packed into a disc to get the same Qsg, and a larger fraction ends up molecular and thus star forming. The uniformity of the resulting |${\rm SFE}_{{\rm H\,\small {I}}}$| as a function of Vmax is preserved regardless of the assumed velocity dispersion.
Fig. 11(c) shows the model results for when we vary the assumed TFR by 1σ of the observed scatter in Fig. 2. The model which adopts the TFR that is 1σ brighter (blue dashed line) shows a general suppression in |${\rm SFE}_{{\rm H\,\small {I}}}$| because the brighter TFR results in higher stellar masses relative to the mean fitted relationship used. Our constant-Qsg model subsequently balances out the increase in stellar component with a decrease in the gas component. The effect on |${\rm SFE}_{{\rm H\,\small {I}}}$| depends on which phase of the interstellar medium (ISM) is most affected. For Vmax≲ 220 km s−1, |${\rm SFE}_{{\rm H\,\small {I}}}$| is less than the default model because the molecular phase is more suppressed than the atomic phase of the ISM. The situation reverses at larger Vmax, with the H i phase more suppressed, resulting in an increased |${\rm SFE}_{{\rm H\,\small {I}}}$|. Models which adopt a fainter TFR result in greater gas content at all radii, and an overall higher molecular fraction, subsequently yielding greater |${\rm SFE}_{{\rm H\,\small {I}}}$| than that of our default model at all Vmax.
5.2 Physical insights from our model
We see that our marginally stable disc model does a good job of accounting for the uniform |${\rm SFE}_{{\rm H\,\small {I}}}$| of disc galaxies. In some sense, the fact that we can account for the entire sequence of disc galaxies should not be surprising since it relates other known properties of the family of star-forming galaxies such as the TFR, the surface brightness–luminosity relationship, an SFL calibrated on disc galaxies, and the Persic et al. (1996) URC. The marginal stability of galaxy discs has also been known for some time (e.g. Kennicutt 1989; Leroy et al. 2008; Meurer et al. 2013). However, this is the first time it has been invoked as the primary physical basis for understanding the sequence of star-forming galaxies.
We find that the Ph prescription for Rmol works best for explaining the uniform |${\rm SFE}_{{\rm H\,\small {I}}}$|. Previously, Leroy et al. (2008) found that an empirical scaling of Rmol with stellar mass density Σ⋆ worked marginally better than the more physically based Ph prescription. However, that study was limited to the optically bright part of galaxies and did not include the outer discs where H i becomes an important contributor to the disc mass density, and where weak star formation can often be seen, especially in the UV (Gil de Paz et al. 2007; Thilker et al. 2007). Even where the star formation intensity in such an extended gaseous disc is weak compared to the central star formation, the contribution to the total SFR can be significant. A case in point is the blue compact dwarf galaxy NGC 2915, where the outer disc star formation intensity is ∼0.5 per cent of that in the centre of this galaxy and yet comprises ∼11 per cent of the total SFR (Werk et al. 2010; Bruzzese et al. 2015).
Our assumed stellar mass distribution is a pure exponential disc, i.e. without a bulge. The results indicate that this model is adequate. It is probable that the H i selection of our sample ensures that we do not have many bulge-dominated or early-type galaxies. The sample used to define our rotation curve model was selected to have Hubble types Sb to Sd, thus avoiding the more bulge-dominated Sa types (Mathewson et al. 1992). In the context of our models, there are two other reasons why bulge-dominated galaxies are unlikely to contribute greatly to the URC. First, the high central densities of bulge-dominated discs require very high Σg to produce Q = 1.6. Consequently, the star formation in this regime will be at the starburst portion of our adopted SFL, resulting in a short gas consumption time-scale, hence making these galaxies rare. Secondly, those galaxies that do manage to accrete enough gas into their centres to match our model would need to have done so quickly, i.e. through an interaction or merger. This should lead to large-scale velocity field asymmetries, and galaxies with asymmetric velocity profiles were excluded from the subsample of galaxies used by Persic & Salucci (1995) and Persic et al. (1996) to compile the URC.
The model presented here is an elaboration of our previous work on the implications of discs maintaining constant stability. In Meurer et al. (2013), we showed that the gas-dominated outer discs with a constant Q in potentials with a flat rotation curve can match the observed radial |$\Sigma _{\rm {\rm H\,\small {I}}}$| distributions and gas-to-total mass ratio. In Zheng et al. (2013), we showed that by assuming a constant Qsg, we could crudely reproduce radial profiles of H i, H2, and ΣSFR out to the traditional optical extents of galaxies given their rotation curves and stellar mass profiles. Since star formation is more centrally concentrated than H i, here we are required to consider the full radial properties of galaxies.
We note that our models have some similarities to the semi-analytic models of Lagos et al. (2011). They also used a hydrostatic pressure relationship to apportion the ISM in galaxies into molecular and atomic phases and a molecular SFL to determine the SFR. One key difference is that they assume that Σg has an exponential radial profile. They allow the disc mass and scalelength to evolve to accommodate the build-up of gas content and angular momentum through accretion. They are then able to reproduce a large variety of properties of disc galaxies. However, |${\rm SFE}_{{\rm H\,\small {I}}}$| is not one of the properties that they studied. Their models are more maturely developed than ours which address neither the source of the gas nor their evolution. The strength of our model is the physical basis for the structure of the disc. Hence, it should be straightforward to adapt our model for evolutionary effects.
5.3 Application to distant newly formed galaxies
As early as redshift z ∼ 2, disc-dominated systems seem to be well established, albeit with higher velocity dispersions relative to galaxies in the Local Universe. Recent studies of star-forming galaxies at z ∼ 2 have found that while the morphologies appear clumpier than low-z counterparts and with higher velocity dispersions, a significant fraction of galaxies are disc dominated and can be described by a relatively constant Q (Genzel et al. 2008, 2014; Cresci et al. 2009; Förster Schreiber et al. 2009). Following the results of Förster Schreiber et al. (2009), we find an average σg = 60 km s−1, a median Hα half-light radius of 4.6 kpc, a median SFR = 135 M⊙ yr−1, a median effective star formation intensity (SFR per unit projected area within the half-light radius) of |$0.74\, {\mathrm{M}_{\odot }}\, {\rm kpc^{-2}\, yr^{-1}}$|, a median Vmax = 235 km s−1, and a median dynamical mass of 1.4 × 10¹¹ M⊙. How do these properties compare to what we would expect for young massive disc galaxies?
To this end, we consider the properties of a Milky Way analogue, having |${V_{\rm {max}}}= 220$| km s−1, at the early stages of its formation. Our adopted model for this Vmax for a galaxy in the Local Universe, presented in Section 2.3, has a total baryon mass, taken to be the sum of the stellar and gas disc mass, |$M_{\rm baryon} = 8.3\times 10^{10}\, {\mathrm{M}_{\odot }}$|, of which 18 per cent is gas. The total gas mass is thus |$1.5\times 10^{10}\, {\mathrm{M}_{\odot }}$| where the atomic component accounts for 84 per cent of the total gas. For our young galaxy model, we place this entire baryon mass in a pure gas disc having Q = 1.6 and σg = 60 km s−1. We adopt the same rotation curve model as before, and now use the familiar single-fluid Qg model to determine the Σg distribution. As before, we use the hydrostatic pressure prescription to apportion the gas into the atomic and molecular phases and the molecular SFL (Section 2.1) to derive the resultant radial star formation distribution. The radial profiles are truncated when the enclosed gas mass equals the above Mbaryon (see Fig. 12). We find that the gas in this high-z model would be predominantly molecular, while 10 per cent is atomic (|$M_{\rm {\rm H\,\small {I}}}= 8.0\times 10^9\, {\mathrm{M}_{\odot }}$|) – much less than that found for the low-z model.
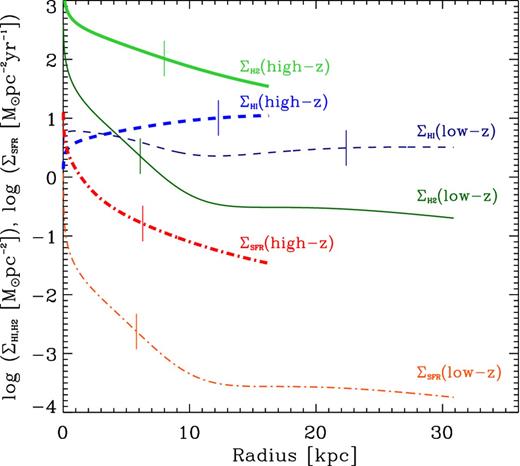
A comparison of the gas density and star formation intensity radial profiles of our Milky Way analogue models (Vmax = 220 km s−1) at low and high redshifts. The H i and H2 densities are represented by the dashed and solid lines, respectively, while the star formation intensity is represented by the dot–dashed line. The thick and thin versions of each line style represent the high- and low-redshift models. The effective radius for each profile is marked by a thin vertical solid line.
From these radial profiles, we derive an integrated SFR of 94 M⊙ yr−1, a star formation half-light radius to be 6.3 kpc, and an effective star formation intensity of |$0.38\, {\mathrm{M}_{\odot }}\, {\rm kpc^{-2}\, yr^{-1}}$|. Our modelled integrated SFR is very close to the median observed SFR of disc-dominated galaxies at z ∼ 2, while the effective star formation intensity is within the observed range of these galaxies (e.g. Förster Schreiber et al. 2009; Johnston et al. 2015). On the other hand, the size of the modelled galaxy is slightly larger than observed. Table 3 summarizes the main properties found for our models.
Comparison of model properties for a Milky Way-like disc galaxy (Vmax = 220 km s−1) at low and high redshifts.
| Property | z = 0 | z = 2 |
|---|---|---|
| H i effective radius | 22.4 kpc | 12.3 kpc |
| H2 effective radius | 6.1 kpc | 8.0 kpc |
| SFR effective radius | 5.8 kpc | 6.3 kpc |
| SFR | 1.8 M⊙ yr−1 | 94 M⊙ yr−1 |
| Total gas depletion time, t | 6.3 Gyr | 0.84 Gyr |
| log |${\rm SFE}_{{\rm H\,\small {I}}}$| | −9.72 yr−1 | −7.91 yr−1 |
| |$\Sigma _{\rm {SFR(R_e)}}$| | 0.008 M⊙ kpc−2 yr−1 | 0.377 M⊙ kpc−2 yr−1 |
We note that if only half of the galaxy had assembled at these high redshifts (i.e. the outer 50 per cent of the gas mass and the resultant star formation were removed), then the galaxy model would extend out to 8.9 kpc, have an SFR of 60 M⊙ yr−1, an SFR effective radius of 4.1 kpc, and an effective star formation intensity of |$0.56\, {\mathrm{M}_{\odot }}\, {\rm kpc^{-2}\, yr^{-1}}$|. In this case, all quantities are within the range observed for the z ∼ 2 disc galaxies. Therefore, our model proto-Milky Way would have star-forming properties more similar to what is observed in high-redshift young disc galaxies, if half to all of its baryons are assembled in a disc having Q ∼ 1.6.
6 CONCLUSIONS
The sequence of star-forming galaxies defined by our sample spans five orders of magnitude in stellar mass and is unimodal. We find that the constant |${\rm SFE}_{{\rm H\,\small {I}}}$| along this sequence can be effectively described by galaxy discs with a constant marginal stability. The primary parameter giving the structure of a galaxy in this model is the rotational amplitude Vmax, a proxy for the total galaxy mass. Combined with previously known scaling relations (such as the TFR and the surface brightness–Vmax relationship), we derive the distribution of the stars and dark matter. The gas disc structure, the relative distribution of the gas phases and subsequently the star formation is a consequence of this framework. While the internal structure of galaxies varies greatly along the sequence, the integrated |${\rm SFE}_{\rm {{\rm H\,\small {I}}}}$| of galaxies is constant at the truncation radii of discs.
A weak correlation between the |${\rm SFE}_{\rm {{\rm H\,\small {I}}}}$| and ΣR indicates that angular momentum is a second parameter affecting the distribution of the ISM and stars. Low specific angular momentum galaxies have shorter scalelengths and a more compact mass distribution. In the context of our models, this results in higher mass density gaseous discs and consequently, higher surface brightnesses. Similarly, lower specific angular momentum galaxies have less dense discs and less intense star formation. Our conclusions are similar to those of Popping et al. (2015) who found the overall SFE (SFR normalized by total gas) of galaxies to be primarily governed by the absolute amount of cold gas, with a secondary dependence upon the disc scalelengths.
Previous studies (e.g. Leroy et al. 2008; Wong et al. 2013) have emphasized the observed correlation between Rmol (and ΣH2) with Σ* – suggesting that the local supply of molecular gas is regulated by the stellar disc of the galaxy. However, the observed correlations linking Σ* to ΣSFR are not unexpected (e.g. Dopita & Ryder 1994; Ryder & Dopita 1994) because the hydrostatic pressure and the stellar surface density are strongly correlated within the optical discs of massive galaxies (e.g. Blitz & Rosolowsky 2006; Leroy et al. 2008). The fact that the observations are well modelled with the hydrostatic pressure model suggests that it provides a better overall prescription for setting the H2/H i ratio and hence, the |${\rm SFE}_{{\rm H\,\small {I}}}$|. This is especially the case for dwarf galaxies where the gaseous disc (as opposed to the stellar disc) is more relevant for setting the hydrostatic pressure.
In this paper, we have also shown that our simple constant-Q model is able to reproduce the observed star formation properties of a proto-Milky Way at higher redshifts when the Universe was at its peak star formation period. Since our model is static and only deals with the disc component, we have not been able to address the effects from evolution or other common galactic structures such as bulges and bars. However, the success of our model at reproducing the observed star formation properties of low- and high-redshift galaxies suggests that star formation in galaxies is largely due to the formation and stabilization of their discs.
Support for the work presented here was also obtained through a NASA GALEX Guest Investigator grant, GALEX GI04-0105-0009, and GALEX archival grant NNX09AF85G. Early work on the data presented here was also supported by NASA LTSA grant NAG5-13083 to GRM. We thank the anonymous referee for their support of this paper and for improving the manuscript. This research has made use of the NASA/IPAC Extragalactic Database (NED), which is operated by the Jet Propulsion Laboratory, California Institute of Technology, under contract with the National Aeronautics and Space Administration.
All magnitudes are expressed in the ABmag system in this work.
The NED is operated by the Jet Propulsion Laboratory, California Institute of Technology, under contract with the National Aeronautics and Space Administration.
We also examined the effects of varying scalelength on the Σ* prescription for Rmol. As in the fiducial model, none of the Σ* prescription models fit the data points, so we do not show the results here so as not to clutter the figures.
REFERENCES
