


Abstract
The Major Atmospheric Gamma-ray Imaging Cherenkov (MAGIC) telescopes observed the BL Lac object H1722+119 (redshift unknown) for six consecutive nights between 2013 May 17 and 22, for a total of 12.5 h. The observations were triggered by high activity in the optical band measured by the KVA (Kungliga Vetenskapsakademien) telescope. The source was for the first time detected in the very high energy (VHE, E > 100 GeV) γ-ray band with a statistical significance of 5.9σ. The integral flux above 150 GeV is estimated to be (2.0 ± 0.5) per cent of the Crab nebula flux. We used contemporaneous high energy (HE, 100 MeV < E < 100 GeV) γ-ray observations from Fermi-Large Area Telescope to estimate the redshift of the source. Within the framework of the current extragalactic background light models, we estimate the redshift to be z = 0.34 ± 0.15. Additionally, we used contemporaneous X-ray to radio data collected by the instruments on board the Swift satellite, the KVA, and the Owens Valley Radio Observatory telescope to study multifrequency characteristics of the source. We found no significant temporal variability of the flux in the HE and VHE bands. The flux in the optical and radio wavebands, on the other hand, did vary with different patterns. The spectral energy distribution of H1722+119 shows surprising behaviour in the ∼3 × 10¹⁴–1018 Hz frequency range. It can be modelled using an inhomogeneous helical jet synchrotron self-Compton model.
1 INTRODUCTION
Active galactic nuclei (AGN) are the most luminous persistent sources of electromagnetic radiation in the Universe. They are compact regions in the centres of galaxies formed around supermassive black holes that actively accrete matter. Approximately 10 per cent of AGN eject matter through relativistic jets (Dunlop et al. 2003). AGN whose jets are oriented close to the line of sight to the Earth are referred to as blazars. Jets are sources of electromagnetic radiation of all wavelengths from radio to γ-rays. They can extend to Mpc distances from the nucleus and can be brighter than the rest of the galaxy. The spectral energy distribution (SED) of blazars is characterized by two broad peaks: a ‘low-energy’ peak in the optical to X-ray band and a ‘high-energy’ peak in the X-ray to γ-ray band. Their emission is characterized by the strong and variable linear polarization in the optical and radio bands, and high variability in flux across the entire electromagnetic spectrum. Blazars can be divided into two classes according to the characteristics of their emission: flat spectrum radio quasars (FSRQs) and BL Lacertae objects (BL Lacs). FSRQs are known to have prominent broad and narrow optical emission lines, in addition to strong optical and X-ray continuum emission. A quite common feature is the so-called blue bump in the optical-UV band associated with the emission from the accretion disc. BL Lacs, on the other hand exhibit very weak optical emission lines if any at all. The low-energy peak in SED of FSRQs is believed to be a combination of synchrotron radiation of electrons in the jet and thermal emission from the broad-line region (BLR), dust torus and accretion disc, while usually in the case of BL Lacs, all the emission is attributed to synchrotron emission. According to leptonic scenarios, the second peak is a result of inverse Compton (IC) scattering of lower energy photons (so-called seed photons) on relativistic electrons within the jet, while hadronic scenarios assume protons in the jet are accelerated even to energies ≳ 1019 eV and significantly contribute to the emission either through proton–synchrotron emission in relatively strong magnetic fields, or photo–pion production (Böttcher et al. 2013). Ghisellini et al. (2010) showed that the broad-band spectral energy distributions (SEDs) of γ-ray blazars can be, on average, well described by a simple one-zone leptonic model including synchrotron and IC emission components, with the addition of possible external contributions from e.g. the accretion disc or host galaxy emission.
H1722+119 was first observed in the 1970s as a part of the Uhuru X-ray sky survey and the HEAO 1 Large Area Sky Survey. The resulting X-ray source catalogues [Forman et al. (1978); source name: 4U1722+11, and Wood et al. (1984); source name: 1H1720+117] only identify it as an X-ray source. Almost 20 years later, Griffiths et al. (1989) and Brissenden et al. (1990) independently, classified it as a BL Lac object. Furthermore, H1722+119 was classified as an intermediate-energy-peaked BL Lac with the low-energy peak at νs = 6.3 × 10¹⁵ Hz (Nieppola, Tornikoski & Valtaoja 2006). Brissenden et al. (1990) measured a very high level of linear polarization in the optical band, reaching 17.6 ± 1.0 per cent in the B band. H1722+119 has been observed in the radio band by the OVRO (Owens Valley Radio Observatory) since 2007 (Richards et al. 2011).1 H1722+119 is included in the third Fermi-LAT (Large Area Telescope) catalogue (3FGL; Acero et al. 2015) as a counterpart of the γ-ray source 3FGL J1725.0+1152, with photon index Γ = 1.89 ± 0.05 and 0.1–100 GeV flux of (2.7 ± 0.3) × 10−8 ph cm−2 s−1. Interesting studies, in which radio and high energy (HE, 100 MeV < E < 100 GeV) γ-ray properties of blazars and their correlations are discussed, were presented in Lister et al. (2011) and Linford et al. (2012). Both works used the LAT on board the Fermi Gamma-ray Space Telescope for HE γ-ray and the Very Long Baseline Array for radio observations. Linford et al. (2012) (source name: F17250+1151) describe H1722+119 as a compact source with a short jet. Infrared (IR) observations of H1722+119 were performed as part of the Two Micron All-Sky Survey (2MASS; Mao 2011). H1722+119 was listed as a candidate TeV blazar in Costamante & Ghisellini (2002) based on its X-ray and radio properties. Observations in the very high energy (VHE, E > 100 GeV) γ-ray band were first reported in Aleksić et al. (2011, source name: RX J1725.0+1152). The MAGIC (Major Atmospheric Gamma-ray Imaging Cherenkov) telescope observed H1722+119 between 2005 and 2009 together with 20 other BL Lac candidates. H1722+119 was selected for this campaign based on its X-ray properties from Donato et al. (2001). The stacked sample of observed blazars showed a signal above 100 GeV with a significance of 4.9σ, but the analysis of H1722+119 data alone resulted in 1.4σ after 32 h of observation, with an upper limit (UL) of flux above 140 GeV of 1.3 × 10⁻¹¹ ph cm−2 s−1.
Although Brissenden et al. (1990) reported a featureless optical spectrum, Griffiths et al. (1989) estimated the redshift of the host galaxy based on an absorption feature to be z = 0.018. However, this result was not confirmed by other optical observations (e.g. Falomo et al. 1993; Véron-Cetty & Véron 1993; Falomo, Scarpa & Bersanelli 1994). Sbarufatti et al. (2006) observed H1722+119 with the ESO Very Large Telescope and detected no intrinsic features in the optical spectra. They derived a lower limit (LL) of z > 0.17. Landoni et al. (2014) used the spectrograph X-Shooter at the European Southern Observatory Very Large Telescope to set an LL on the redshift at 0.35. They detected no intrinsic or intervening spectral lines, ascribing this to extreme optical beaming, setting the ratio of beamed to thermal emission at ≥400. Farina et al. (2013, private communication) observed H1722+119 with the NOTCam of the Nordic Optical Telescope in the H band in 2013 and were unable to detect the host galaxy. Applying the imaging redshift technique proposed by Sbarufatti, Treves & Falomo (2005), they set an LL on redshift at 0.4.
In this paper, we report the first detection of VHE γ-ray emission from H1722+119, by the MAGIC telescopes (Cortina 2013), and study the multifrequency characteristics of H1722+119 in that period. Emission from blazars is quite variable in time, and optical high states are often used to trigger MAGIC observations. H1722+119 joins quite a long list of blazars, whose VHE γ-ray signal was detected following an optical high state (see e.g. Albert et al. 2006, 2007b, 2008b; Anderhub et al. 2009; Aleksić et al. 2012b,c, 2014, 2015). In Section 2, we present the instruments used in this work and their respective results. Section 3 is reserved for study of multifrequency characteristics. We summarize our findings in Section 4. Throughout the paper, we assume standard Λcold dark matter cosmology (Komatsu et al. 2011).
2 OBSERVATIONS AND DATA ANALYSIS
2.1 MAGIC
The MAGIC telescopes are located at the Observatorio del Roque de los Muchachos in the Canary Island of La Palma, Spain (28°45′ north, 18°54′ west), at 2200 m above sea level. Two 17 m diameter Imaging Atmospheric Cherenkov Telescopes are optimised for observations of γ-rays of energies above 50 GeV. A detailed overview of the MAGIC experiment and the telescope performance is given in Aleksić et al. (2016a,b).
The results reported here are based on the observations performed during six nights between 2013 May 17 and 22, triggered by the high optical state detected by the KVA (Kungliga Vetenskapsakademien telescope, see Section 2.4). Between the first (2005–2009) and the second (2013) observation campaign, the MAGIC system underwent a series of major upgrades (see Cortina et al. 2005; Albert et al. 2008a; Goebel et al. 2008; Aleksić et al. 2012a; Sitarek et al. 2013; Aleksić et al. 2016a,b). The current instrument is roughly twice as sensitive in the 100–200 GeV energy range compared to the single MAGIC I telescope in operation in 2009 (Aleksić et al. 2016b).
MAGIC usually observes sources in the so-called wobble mode (Fomin et al. 1994; Aleksić et al. 2016b). H1722+119 was observed in four false-source positions for a total of 12.5 h during 2013. After quality selection based on the stability of the event rates, the effective time amounted to 12.0 h. Observations were performed at zenith angles between 16° and 37°.
The data were analysed within the mars (MAGIC Analysis and Reconstruction Software) analysis framework (Lombardi et al. 2011; Zanin et al. 2013). The VHE γ-ray signal is estimated using the distribution of the squared angular distance (θ2) between the reconstructed and nominal (ON-source) source positions in the camera coordinates for each event. Background is estimated in the same manner with respect to the OFF-source position. Usually three OFF-source positions are chosen at the same distance from the camera centre as the ON-source position and rotated by 90° each. Non is the number of events originating within the source region (θ2 < 0.0125 deg2), and Noff the normalized number of all events from the same region around OFF-source positions. An excess of 337.5 events above 60 GeV with respect to the background was detected, yielding a signal significance of 5.9σ using equation 17 of Li & Ma (1983). The θ2 distribution is shown in Fig. 1. The light curve of the integral VHE γ-ray flux above 150 GeV is shown in Fig. 2. There is no evidence of flux variability on a night-by-night basis. A fit with a constant flux of (6.3 ± 1.6) × 10−12 ph cm−2 s−1 resulted in χ2/NDF = 3.5/5, where NDF stands for number of degrees of freedom. This is equivalent to (2.0 ± 0.5) per cent of the Crab nebula VHE γ-ray flux. The measured flux is consistent with the UL set by the MAGIC observations of H1722+119 from the previous campaign (Aleksić et al. 2011).
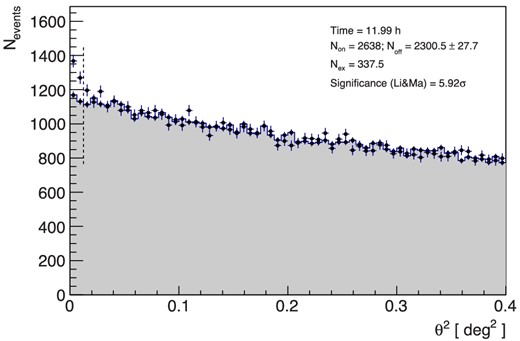
θ2 distribution of signal (black points) and background (grey area) events. Non is the number of all events with θ2 < 0.0125 deg2 (vertical dashed line) with respect to the source position in the camera, and Noff the normalized number of all events from the same region around OFF-source position.
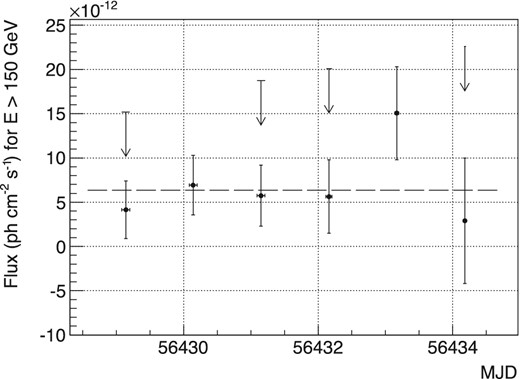
MAGIC nightly light curve for energies above 150 GeV. Horizontal error bars represent the duration of each observation. Vertical arrows represent ULs for points whose relative error of the excess is >0.5. The horizontal dashed line is a constant flux fit with parameters stated in the text.
The differential energy spectrum was reconstructed using the Forward Unfolding algorithm presented in Albert et al. (2007a). It can be described by a simple power-law function dN/dE = f0(E/E0)−Γ with normalization f0 = (4.3 ± 0.9stat ± 0.9syst) × 10− 11 ph cm− 2 s− 1 TeV− 1 and a photon index Γ = 3.3 ± 0.3stat ± 0.2syst, at normalization energy E0 = 200 GeV. The fit resulted in (χ2/NDF = 3.6/8). The systematic uncertainty of the photon index was estimated to be ±0.2, using equation 3 of Aleksić et al. (2016b). We estimate the error on the f0 to be 20 per cent, which does not include the energy scale uncertainty estimated to be 17 per cent.
2.2 Fermi-LAT
The Fermi-LAT is a pair-conversion telescope operating from 20 MeV to >300 GeV. Details about the Fermi-LAT are given in Atwood et al. (2009). The LAT data reported in this paper were collected from 2013 January 1 (MJD 56293) to December 31 (MJD 56657). During this time, the Fermi observatory operated almost entirely in survey mode. The analysis was performed with the sciencetools software package version v9r32p5. Only Pass 7 reprocessed events belonging to the ‘Source’ class were used. The time intervals when the rocking angle of the LAT was greater than 52° were rejected. In addition, a cut on the zenith angle (<100°) was applied to reduce contamination from the Earth limb γ rays, which are produced by cosmic rays interacting with the upper atmosphere. The spectral analysis was performed with the instrument response function P7REP_SOURCE_V15 using an unbinned maximum-likelihood method implemented in the tool gtlike in the 0.1–100 GeV energy range. Isotropic (iso_source_v05.txt) and Galactic diffuse emission (gll_iem_v05_rev1.fit) components were used to model the background.2 The normalizations of both components were allowed to vary freely during the spectral fitting.
We analysed a region of interest of 10° radius centred at the location of H1722+119. We evaluated the significance of the γ-ray signal from the source by means of the maximum-likelihood test statistic TS = 2 (logL1 − logL0), where L is the likelihood of the data given the model with (L1) or without (L0) a point source at the position of H1722+119 (e.g. Mattox et al. 1996). The source model used in gtlike includes all sources from the 3FGL catalogue that fall within 15° of the source. A first maximum-likelihood analysis was performed to remove from the model the sources having TS < 10 and/or the predicted number of counts based on the fitted model Npred < 3. A second maximum-likelihood analysis was performed on the updated source model. In the fitting procedure, the normalization factors and the photon indices of the sources lying within 10° of H1722+119 were left as free parameters. For the sources located between 10° and 15° from our target, we kept the normalization and the photon index fixed to the values from the 3FGL catalogue.
All uncertainties in measured HE γ-ray flux reported throughout this paper are statistical only. The systematic uncertainty in the flux is dominated by the systematic uncertainty in the effective area (Ackermann et al. 2012), which amounts to 5–10 per cent in the 0.1–100 GeV energy range, and therefore smaller than the typical statistical uncertainties for this analysis.3
Integrating over the period 2013 January 1–December 31 in the 0.1–100 GeV energy range, using a power-law model as in the 3FGL catalogue, the fit yielded a TS = 335, with an average flux of (4.1 ± 0.7) ×10−8 ph cm−2 s−1, and a photon index of Γ = 1.99 ± 0.08 at the decorrelation energy E0 = 3063 MeV. During the same period, the fit with a log-parabola model, dN/dE ∝ |$(E/E_{0})^{-\alpha -\beta \, \log (E/E_0)}$|, in the 0.1–100 GeV energy range results in TS = 355, with a spectral slope α = 1.99 ± 0.08, and a curvature parameter β = 0.01 ± 0.01, indicating no significant curvature of the γ-ray spectrum. The LAT light curve and the photon index evolution with 2-month time bins is shown in Fig. 3. The 2-month bin width is a trade-off between the significance of the source (TS > 25 in each time bin) and the shortest time-scale to be probed. For each time bin, the spectral parameters for H1722+119 and for all the sources within 10° from the target were left free to vary. No significant increase of the γ-ray activity was observed by LAT in 2013 May and June – the time bin contemporaneous to the MAGIC observations. Both the flux and the photon index are well fitted by a constant with the following parameters: flux: p0 = (3.43 ± 0.56) × 10−8 ph cm−2 s−1 and χ2/NDF = 3.87/5, photon index: Γ = 1.96 ± 0.07 and χ2/NDF = 1.68/5. Leaving the photon index free to vary during 2013 May, we obtained TS = 37, with an average flux of (8.5±3.3) × 10−9 ph cm−2 s−1, and a photon index of Γ = 1.4 ± 0.3. The hint of hardening of the LAT spectrum may be an indication of the shift of the IC peak to higher energies during the MAGIC detection. By considering only the period May 13–26, including the MAGIC observation period, the maximum-likelihood analysis results in a TS = 15, with a flux of (0.9 ± 0.4) × 10−8 ph cm−2 s−1 (assuming Γ = 1.4). By means of the gtsrcprob tool, we estimated that the highest energy photon emitted from H1722+119 (with probability >90 per cent of being associated with the source) was observed on 2013 April 28 (MJD 54610), with an energy of 65.7 GeV. Another photon with an energy 51.6 GeV was observed on 2013 December 31 (MJD 56657).
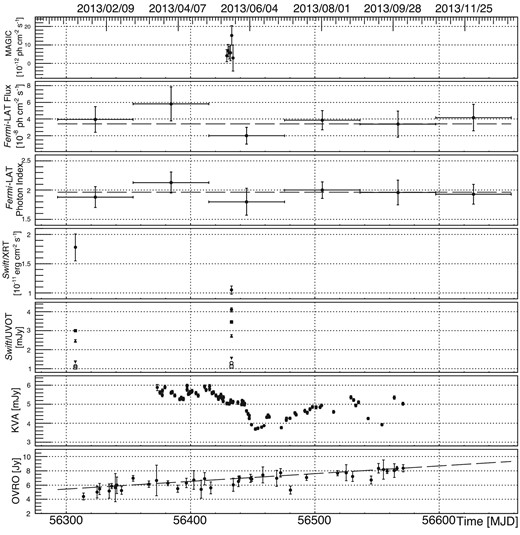
Multifrequency light curve during 2013. MAGIC nightly light curve is the same as in Fig. 2. ULs were omitted for clarity. The HE γ-ray light curve and the evolution of the spectral index, as measured by Fermi-LAT, are shown in 2-month time bins, while one night time-scale is used in light curves in other energy bands. Horizontal dashed lines in both panels represent the fit with a constant. The Swift/UVOT filters are represented with the following markers: v – full circle, b – full square, u – upward triangle, w1 – downward triangle, m2 – empty circle, and w2 – empty square. The dashed line in the OVRO panel represents a linear function fit. All the fit parameters are given in the text. The data were collected (from top to bottom) by MAGIC (E > 150 GeV), Fermi-LAT (0.1 GeV < E < 100 GeV), Swift/XRT, Swift/UVOT, KVA (R band) and OVRO (15 GHz).
2.3 Swift
The Swift satellite (Gehrels et al. 2004) performed three observations of H1722+119 on 2008 May 31, 2013 January 15 and May 20. The observations were carried out with all three on board instruments: the X-ray Telescope (XRT; Burrows et al. 2005, 0.2–10.0 keV), the Ultraviolet/Optical Telescope (UVOT; Roming et al. 2005, 170–600 nm) and the Burst Alert Telescope (BAT; Barthelmy et al. 2005, 15–150 keV). The hard X-ray flux of this source is below the sensitivity of the BAT instrument for the short exposure of these observations (see Table 1), therefore the data from this instrument are not included in this work. Moreover, the source is not present in the Swift/BAT 70-month hard X-ray catalogue (Baumgartner et al. 2013).
The XRT data were processed with standard procedures (xrtpipeline v0.12.8), filtering, and screening criteria using the heasoft package (v6.14). The data were collected in photon counting (PC) mode on 2008 May 31 and 2013 January 15, and windowed timing (WT) mode on 2013 May 20. The source count rate in PC mode was low (<0.5 counts s−1); thus pile-up correction was not required. Source events were extracted from a circular region with a radius of 20 pixels (1 pixel = 2.36 arcsec), while background events were extracted from a circular region with a radius of 50 pixels in PC mode and 20 pixels in WT mode away from the source region and from other bright sources. Ancillary response files were generated with xrtmkarf, and account for different extraction regions, vignetting and point spread function corrections. We used the spectral redistribution matrices in the calibration data base maintained by heasarc. We fitted the spectrum with an absorbed power law using the photoelectric absorption model tbabs (Wilms, Allen & McCray 2000), with a neutral hydrogen column density fixed to its Galactic value (NH = 8.88 × 1020 cm−2; Kalberla et al. 2005). We noted that the X-ray flux of the source observed in 2013, i.e. (1–2)× 10−11 erg cm−2 s−1 (Fig. 3), is a factor between 3 and 5 higher than the flux in 2008 May 31, (3.6 ± 0.7) × 10−12 erg cm−2 s−1, with no significant spectral change (Table 1). For the observation in 2013 May 20, with the higher statistics, we fit the spectrum also with a log-parabola model, obtaining a spectral slope α = 2.2 ± 0.1, a curvature parameter of β = 0.54|$^{+0.34}_{-0.31}$|, and a |$\chi ^{2}_{\rm \,red}/{\rm NDF} = 1.124/63$|. The F-test shows an improvement of the fit with respect to the simple power law (|$\chi ^{2}_{\rm \,red}/{\rm NDF} = 1.245/64$|) with a probability of 99.9 per cent.
Log and fitting results of Swift/XRT observations of H1722+119 using a power-law model with NH fixed to Galactic absorption.
| Observation | Net exposure time | Photon index | Flux 2–10 keV | |$\chi ^2_{\rm \,red}$| (NDF) |
|---|---|---|---|---|
| date (MJD) | (s) | (Γ) | ( ×10−12 erg cm−2 s−1) | |
| 2008-05-31 (54617) | 1733 | 2.13 ± 0.22 | 3.6 ± 0.7 | 1.257 (11) |
| 2013-01-15 (56307) | 812 | 2.28 ± 0.15 | 17.8 ± 2.3 | 0.9040 (17) |
| 2013-05-20 (56432) | 1983 | 2.31 ± 0.08 | 10.5 ± 0.7 | 1.245 (64) |
UVOT data in the v, b, u, w1, m2, and w2 filters were reduced with the heasoft package v6.16 executing the aperture-photometry task uvotsource. We extracted the source counts from an aperture of 5 arcsec centred on the source, and the background counts from a circle with 10 arcsec radius in a nearby source-free region. Magnitudes were converted into dereddened flux densities by adopting the extinction value E(B−V) = 0.1497 from Schlafly & Finkbeiner (2011), the mean Galactic extinction curve in Fitzpatrick (1999) and the magnitude-flux calibrations by Bessell & Brett (1988). The UVOT flux densities collected in 2013 are reported in Fig. 3. The flux densities observed in 2008 May 31 are a factor of 2 lower with respect to the 2013 observations.
Checking the source SED (Fig. 5), we noticed that a monotonic connection between optical-UV and X-ray spectrum was not possible, which motivated us to analyse possible sources of errors affecting the data. An aperture correction procedure was executed for the 2013 May 20 UVOT images in all filters, estimating from field stars the correction to magnitudes extracted with full-width at half-maximum (FWHM) radius circular apertures to obtain the counts within the standard apertures (5 arcsec radii). A first photometry of the object with apertures of 2.5 arcsec (the FWHM for all filters) was executed. Then 6–8 non-saturated field stars were selected and photometry was performed for each of them using FWHM radii and standard apertures, and non-contaminated background annular regions of radii 26 to 33 arcsec. The weighted mean among all magnitude differences obtained with the two different apertures was calculated and finally subtracted from the object magnitude at FWHM apertures. Results are however compatible with the standard procedure, with a low flux in the w1 filter. Another check was required because the source colour, b − v ∼ 0.7, is out of the range to which the average count rate to flux ratios (CFR) estimated by Breeveld et al. (2011) are applicable. Therefore, we explored UVOT calibration issues following the procedure described in Raiteri et al. (2010). We fit the source spectrum with a power law and convolved it with the filter effective areas and appropriate physical quantities to derive source-dependent effective wavelengths (EW) and CFR. However, the results obtained are very similar to those given by Breeveld et al., the largest variations being an increase of the EW by 2 and 3 per cent in the w1 and w2 band, respectively, and of the CFR by 4 per cent in w1. More significant differences were found when comparing the convolved Galactic extinction values with those obtained by simply evaluating them at the filter EW. We obtained a 7 per cent decrease of the extinction in the w2 and m2 bands, and an 8 per cent increase in the w1 band. The optical part of the SED remained essentially unchanged after the re-calibration procedure. The results after the re-calibration procedure are shown in Fig. 5.
2.4 KVA
The KVA telescope is located at the Observatorio del Roque de los Muchachos, La Palma (Canary Islands, Spain), and is operated by the Tuorla Observatory, Finland.4 The telescope consists of a 0.6-m f/15 Cassegrain devoted to polarimetry, and a 0.35-m f/11 Schmidt–Cassegrain auxiliary telescope for multicolour photometry. The telescope has been successfully operated remotely since the fall of 2003. The KVA is used for optical support observations for MAGIC by making R-band photometric observations, typically one measurement per night per source.
H1722+119 has been regularly monitored by the KVA since 2005. At the beginning of May 2013, after an extended optical high state, the source reached an R-band magnitude of 14.65 (flux of 5.96 ± 0.09 mJy), which constituted a historical maximum for this source at that time.5 The high-emission state triggered observations by MAGIC, but the MAGIC observations started during the decreasing part of the optical flaring activity. The KVA observed nightly light curve for 2013 is shown in Fig. 3. The flux varied significantly, the ratio between the highest and lowest flux being 1.6, but we saw no regularity in this variation.
The data were reduced by the Tuorla Observatory Team as described in Nilsson et al. (in preparation). The data were corrected for Galactic extinction using the total absorption Aλ = 0.374 mag from Schlafly & Finkbeiner (2011).
2.5 OVRO
The 40-m radio telescope at the OVRO observes at the 15 GHz band. In late 2007, it started regular monitoring of a sample of blazars in order to support the goals of the Fermi-LAT telescope (Richards et al. 2011). This monitoring programme includes about 1800 known or potential γ-ray-loud blazars, including all candidate γ-ray blazar survey (Healey et al. 2008) sources above declination −20°. The sources in this programme are observed in total intensity twice per week with a 4 mJy (minimum) and 3 per cent (typical) uncertainty on the flux density. Observations are performed with a dual-beam (each 2.5 arcmin FWHM) Dicke-switched system using cold sky in the off-source beam as the reference. Additionally, the source is switched between beams to reduce atmospheric variations. The absolute flux density scale is calibrated using observations of 3C 286, adopting the flux density (3.44 Jy) from Baars et al. (1977). This results in about a 5 per cent absolute scale uncertainty, which is not reflected in the plotted errors in Fig. 3.
The OVRO nightly light curve for 2013 is shown in Fig. 3. Although there is some indication of a short time variability, we fitted the whole sample with a linear function (F[Jy] = p0 + p1 × (t − 56300)[MJD]) to point out the general trend of increasing flux. The fit parameters are p0 = (5.2 ± 0.2) × 10−2 Jy, p1 = (1.07 ± 0.10) × 10−4 Jy day−1 and χ2/NDF = 39.68/36. We also considered the possibility of a constant flux, but that assumption was discarded with χ2/NDF = 146.9/37 (p = 5 × 10⁻¹⁵).
3 RESULTS
3.1 Redshift and the intrinsic VHE γ-ray spectrum
VHE γ-rays can be absorbed by the extragalactic background light (EBL), through photon–photon interactions, resulting in e+e− pair-production. The flux attenuation is directly dependent on the redshift of the source and energy of γ-rays. A redshift-estimation method described in Prandini et al. (2010) uses this fact. It relies on the assumption that both HE and VHE γ-rays are created by the same physical processes and in the same region, and that the intrinsic spectrum in the VHE range cannot be harder than the spectrum in the HE range. The method uses only the spectral slope of the HE range data. The VHE γ-ray spectrum was de-absorbed using the EBL model from Franceschini, Rodighiero & Vaccari (2008). Because spectral points obtained by the MAGIC telescopes at energies below 100 GeV are usually affected by larger systematic uncertainties, they are not used for the fit of the VHE spectrum. The reconstructed redshift is obtained by applying a simple empirical formula to the value estimated from de-absorption. Applying this method to the MAGIC and contemporaneous (2013 May, MJD 56413–56442) Fermi-LAT data, we obtained the reconstructed redshift of H1722+119 to be z = 0.34 ± 0.15stat ± 0.05meth, the error marked as meth being a result of the method as described in Prandini et al. (2010). The UL on the redshift was set to 1.06 for the 95 per cent confidence level. Applying the log likelihood ratio test to set the UL, as described in e.g. Mazin & Goebel (2007), we obtained a value of 0.95. When de-absorbed for redshift values greater than 0.95, the spectrum shape becomes parabolic in a log (dN/dE) versus log E representation, with apparent minimum at ≈200 GeV. Our reconstructed redshift value is in agreement with the latest Landoni et al. (2014) and Farina et al. (2013, private communication) results. We used our result combined with the LL from Farina et al. (z > 0.4) to de-absorb the VHE γ-ray flux. For z = 0.4, and using the EBL model from Franceschini et al. (2008), we found the parameters of the intrinsic (EBL-deabsorbed) VHE spectrum to be f0 = (9.6 ± 2.2) × 10− 11 ph cm− 2 s− 1 TeV− 1, Γ = 2.3 ± 0.4, χ2/NDF = 3.1/8.
3.2 Multifrequency light curve
As already mentioned in Section 2.4, MAGIC observations were triggered by an extended optical high state, which was the historical R-band maximum at that time. The VHE γ-ray flux (Fig. 2) is compatible with a constant flux and the previously established UL based on combined data taken over several years. None the less, we cannot reach a firm conclusion on whether the source was flaring in the VHE γ-rays during MAGIC observations or not. Observations performed during six consecutive nights were not sufficient to study a longer term variability. However, we compared the HE γ-ray light curve for the entire year to the optical light curve over period 2013 March 22 to October 05, and the radio light curve over period 2013 January 21 to October 05. The Fermi-LAT data were divided into 2-month time bins with the photon index left free to vary (Fig. 3), while each point in the KVA and OVRO light curves represents a single measurement. Comparison of fluxes for the entire period of collected data revealed that the OVRO data show an obvious trend of increasing flux on a time-scale of one year (dashed line in the bottom panel of Fig. 3), while the HE γ-ray flux was consistent with being constant, and the optical flux varied with no apparent regularity. Therefore, we cannot claim any connection between emissions in different energy bands.
3.3 SED modelling
The SED for 2013 May is shown in Fig. 5. Only data contemporaneous to MAGIC observations have been considered for modelling the SED for 2013. On 2013 May 22 (MJD 56434), one observation was performed by the OVRO at 15 GHz. The Swift data collected on 2013 May 20 (MJD 56432) were considered, and the R-band observation by the KVA from the same night was used to obtain a spectral point at 4.56 × 10¹⁴ Hz. The Fermi-LAT spectrum was calculated in the period 2013 May 1–June 30. The MAGIC spectral points were obtained with Schmelling's method as described in Albert et al. (2007a). Based on the arguments discussed in Section 3.1, we adopted a value for redshift of 0.4, and EBL model from Franceschini et al. (2008) to get the intrinsic VHE part of the spectrum. We also show the Swift data collected on 2008 May 31 (MJD 54617), in order to compare the source SED during the two different brightness states. Archival data from the 2MASS All-Sky Catalogue of Point Sources (Skrutskie et al. 2006) and AllWISE (Wide-field Infrared Survey Explorer) Data Release (Ochsenbein, Bauer & Marcout 2000) are included to show the overall behaviour in the IR-optical band, however these were not considered for modelling. We also show the near-IR and optical spectral points from Landoni et al. (2014), which were also not used for modelling.
The source SED shows surprising behaviour in the frequency range ∼3 × 10¹⁴–1018 Hz. Indeed, the de-absorbed (as described in Section 2.3) optical–UV spectrum appears curved, with a peak in the b band and a steep slope in the UV. H1722+119 is a bona fide BL Lac type of source. None of the observations used in this work, nor information found in the literature revealed anything about the nature of the black hole environment, nor the host galaxy. There is no evidence of emission at any frequency from the accretion disc, dust torus or BLR. In fact, Landoni et al. (2014) detected no intrinsic or intervening spectral lines, and set the ratio of beamed to thermal emission to be ≥400.
Therefore, we do not expect the presence of thermal emission from an accretion disc and the host galaxy that can justify the shape of the optical-UV spectrum. Moreover, this shape prevents a monotonic connection with the X-ray spectrum, as would be expected if both the optical-UV and X-ray emissions were produced by a synchrotron process in the same jet region. The connection between the UV and X-ray spectrum in both states requires an inflection point that is hard to reproduce with simple, one-zone models. This instead can easily be obtained in the framework of a curved jet. Indeed, curved/helical geometries have often been observed in blazar jets (see e.g. Villata & Raiteri 1999, and references therein). A helical-jet morphology can arise as the result of perturbations induced by orbital motion in a binary black hole system or precession of the black hole spin axis (Villata & Raiteri 1999, and references therein; Rieger 2004). 3D magnetohydrodynamic (MHD) simulations by Nakamura, Uchida & Hirose (2001), Moll, Spruit & Obergaulinger (2008) and Mignone et al. (2010) show how kink instabilities lead to a wiggled, in particular helical, jet structure. MHD equilibrium of helical jets was investigated by Villata & Ferrari (1995).
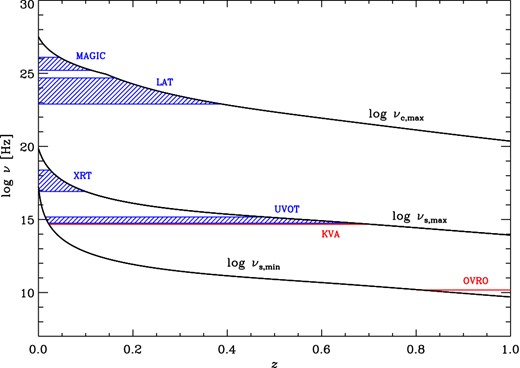
The trend of the observed frequencies as a function of the distance along the helical jet axis z (whose unit length can be estimated to be about 0.1 pc, see the text). The location of the regions that contribute to the emission observed by the various instruments is highlighted. The plot refers to the high-emission state shown in Fig. 5.
The helical jet model is intended to be a geometrical, dimensionless, model used to describe blazar variability and should not be interpreted as a physical model. However, absolute dimensions can be derived by comparison with the Very Long Baseline Array (VLBA) images. In our model, the 15 GHz radio emission comes from the outer 20 per cent of the jet (see Fig. 4). This is assumed to be the jet region where the bulk of the observed 15 GHz radiation comes from. The results of the MOJAVE programme6 show that the size of the emitting core is ≲0.1 pc. Therefore, the unit length in our model would correspond to a dimension of the order of one-tenth of a parsec.
The helical jet model can produce reasonable fits to the source SEDs (see Fig. 5), although the model applied to 2008 data is only constrained by the synchrotron emission, because there are no contemporaneous data in other energy bands. The noticeable thing is that both fits were obtained with the same choice of model parameters (see Table 2), with the exception of the angle ϕ, which changes from 25° to 31° when going from the high to the low state. This underlines how variations of a few degrees in the viewing angle alone may account for the observed flux changes.
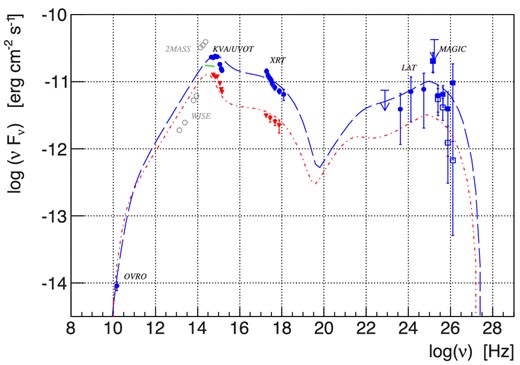
The H1722+119 SED. Blue dots represents data contemporaneous to MAGIC observations. The MAGIC measured data are shown by empty blue squares, while full blue squares indicate the de-absorbed points using the EBL model from Franceschini et al. (2008). Fermi-LAT data are shown by dots, while arrows represent Fermi-LAT ULs. The Swift data indicated by blue dots, were taken on 2013 May 20 (MJD 56432). The KVA R-band point represented by a blue dot was taken on the same night. The OVRO measurement represented by a blue dot was taken on 2013 May 22 (MJD 56434). Red triangles show the Swift data from 2008 May 31 (MJD 54617). The green solid line in the 1014–1015 Hz range indicates data from Landoni et al. (2014), but they were not considered for the fit. Archival data from 2MASS and WISE are shown by empty grey circles, and were not considered for the fit. The blue long-dashed line indicates fits of the helical jet model to the 2013 data, while the fit to the 2008 data is indicated by the red dash–dotted line. Both models represent the intrinsic VHE emission. Only blue and red points were considered for modelling.
Main parameters of the helical model to fit the SEDs of H1722+119. The only difference between the high and low state is the angle ϕ, which changes from 25° to 31°.
| ζ | 30° |
| a | 40° |
| ψ | 25° |
| ϕ | 25°, 31° |
| α0 | 0.5 |
| Γb | 10 |
| |$\log \,\nu ^\prime _{\rm s,min}(0)$| | 16.7 |
| |$\log \,\nu ^\prime _{\rm s,max}(0)$| | 19.3 |
| cmin, max | 3.3 |
| log lmin | −2.3 |
| log lmax | −1.8 |
| log γmax(0) | 4.8 |
| cγ | 1.5 |
| log lγ | −1 |
| cs1, c1 | 3 |
| cs2, c2 | 2.3 |
| log ls, c | −1 |
| log Ks | −19.25 |
| log Kc | −24.55 |
4 SUMMARY AND CONCLUSIONS
MAGIC detected VHE γ-radiation from BL Lac H1722+119 after observations were triggered by a high flux in R band measured by the KVA. The MAGIC observations were performed during six consecutive nights and show no flux variability. No significant increase of the activity was observed at HE by Fermi-LAT in 2013 May neither on short time-scales nor compared to the average 2013 flux. An indication of spectral hardening at HE in 2013 May might explain a VHE γ-ray flux high enough to be detected by the MAGIC telescopes. Changes in flux were significant in optical and radio data. However, on a time-scale of a year, the radio flux seems to increase, while there was no significant variability of the HE flux. Therefore, we cannot claim that the two components originate from the same physical region. While the radio flux was highest towards the end of the year, the highest optical flux was observed in April, followed by a quite sudden drop, which did not occur in radio data.
The SED shows an interesting feature in the optical-UV band. A break between the optical-UV parts of the spectrum is clearly visible. It also prevents a smooth connection between optical, UV and X-ray bands. We proposed the helical jet model from Villata & Raiteri (1999) to explain the observed emission. We found that the difference between the two states can be attributed to a change of a few degrees in the jet orientation.
Further multifrequency observations will be crucial to investigate in detail this new VHE emitting blazar and its emission mechanisms.
We are grateful to Marco Landoni for help with adopting data from Landoni et al. (2014).
We would like to thank the Instituto de Astrofísica de Canarias for the excellent working conditions at the Observatorio del Roque de los Muchachos in La Palma. The financial support of the German BMBF and MPG, the Italian INFN and INAF, the Swiss National Fund SNF, the ERDF under the Spanish MINECO (FPA2012-39502), and the Japanese JSPS and MEXT is gratefully acknowledged. This work was also supported by the Centro de Excelencia Severo Ochoa SEV-2012-0234, CPAN CSD2007-00042, and MultiDark CSD2009-00064 projects of the Spanish Consolider-Ingenio 2010 programme, by grant 268740 of the Academy of Finland, by the Croatian Science Foundation (HrZZ) Project 09/176 and the University of Rijeka Project 13.12.1.3.02, by the DFG Collaborative Research Centers SFB823/C4 and SFB876/C3, and by the Polish MNiSzW grant 745/N-HESS-MAGIC/2010/0.
The Fermi-LAT Collaboration acknowledges generous ongoing support from a number of agencies and institutes that have supported both the development and the operation of the LAT as well as scientific data analysis. These include the National Aeronautics and Space Administration and the Department of Energy in the United States, the Commissariat à l'Energie Atomique and the Centre National de la Recherche Scientifique / Institut National de Physique Nucléaire et de Physique des Particules in France, the Agenzia Spaziale Italiana and the Istituto Nazionale di Fisica Nucleare in Italy, the Ministry of Education, Culture, Sports, Science and Technology (MEXT), High Energy Accelerator Research Organization (KEK) and Japan Aerospace Exploration Agency (JAXA) in Japan, and the K. A. Wallenberg Foundation, the Swedish Research Council and the Swedish National Space Board in Sweden.
Additional support for science analysis during the operations phase from the following agencies is also gratefully acknowledged: the Istituto Nazionale di Astrofisica in Italy and the Centre National d’Études Spatiales in France.
The OVRO 40-m monitoring programme is supported in part by NASA grants NNX08AW31G and NNX11A043G, and NSF grants AST-0808050 and AST-1109911.
Antonio Stamerra acknowledges financial support in the frame of the INAF Senior Scientist programme of ASDC and by the Italian Ministry for Research and Scuola Normale Superiore.
Elisa Prandini gratefully acknowledges the financial support of the Marie Heim-Vogtlin grant of the Swiss National Science Foundation.
The highest flux of 7.65 ± 0.11 mJy was measured in 2014 June, and the lowest in 2008 April (2.18 ± 0.05 mJy).
REFERENCES
