


Abstract
We announce the discovery of the Crater 2 dwarf galaxy, identified in imaging data of the VLT Survey Telescope ATLAS survey. Given its half-light radius of ∼1100 pc, Crater 2 is the fourth largest satellite of the Milky Way, surpassed only by the Large Magellanic Cloud, Small Magellanic Cloud and the Sgr dwarf. With a total luminosity of MV ≈ −8, this galaxy is also one of the lowest surface brightness dwarfs. Falling under the nominal detection boundary of 30 mag arcsec−2, it compares in nebulosity to the recently discovered Tuc 2 and Tuc IV and UMa II. Crater 2 is located ∼120 kpc from the Sun and appears to be aligned in 3D with the enigmatic globular cluster Crater, the pair of ultrafaint dwarfs Leo IV and Leo V and the classical dwarf Leo II. We argue that such arrangement is probably not accidental and, in fact, can be viewed as the evidence for the accretion of the Crater-Leo group.
1 INTRODUCTION
The size and the luminosity of a dwarf galaxy satellite today are stipulated by the star formation efficiency at birth and the amount of host harassment it endures during the rest of its life. Therefore, local dwarfs can only be used to scrutinize the high-redshift structure formation in the low-mass regime if the effects of the host influence can be singled out. In principle, such inference should be possible if the satellite's orbital history is known. In practice, unfortunately, this is easier said than done, both due to the challenging nature of the proper motion measurement, as well as the unexplored effects of dynamical friction and orbital fanning. It might, however, be possible to decode the satellite's orbital history if it was accreted as part of a group, thus linking its observed properties to the environment at the origin.
Simulations suggest that half of all satellites at z = 0 were in groups before falling into Milky Way (MW)-like hosts (Wetzel, Deason & Garrison-Kimmel 2015). Therefore, in any realistic Galactic assembly history, it is unlikely that the current satellite distribution will look isotropic. Indeed, the apparent spatial anisotropy of the Galactic satellite population has been pointed out on a number of occasions (see e.g. Lynden-Bell 1976; Kroupa, Theis & Boily 2005; Pawlowski, Pflamm-Altenburg & Kroupa 2012), as well as its alignment with the Magellanic Clouds orbit (see e.g. Lynden-Bell & Lynden-Bell 1995). As Deason et al. (2015) point out, the spatial extent of an accreted group depends on its mass and the time of its infall into the MW, with the least massive (and hence the coldest) and the latest events standing out the most. In this picture, the discovery last year of a large number of faint satellites near the Magellanic Clouds (see Bechtol et al. 2015; Drlica-Wagner et al. 2015; Koposov et al. 2015) is naturally explained with a relatively recent accretion of a massive Magellanic system.
However, it remains unclear the hypothesis of a recent Magellanic accretion can explain both the satellites in the immediate vicinity of the Magellanic Clouds, such as those picked out by the Dark Energy Survey (DES), as well as satellites like Draco and Ursa Minor which are hundreds of degrees, and kpc, away (see e.g. Nichols et al. 2011; Sales et al. 2011). One possibility is that the group was a lax association initially and fell in earlier, losing some of its outer parts to the MW tides before the Large Magellanic Cloud-Small Magellanic Cloud (LMC-SMC) and its entourage were eventually captured (see also Yozin & Bekki 2015; Jethwa et al. 2016). It is curious, none the less, that given the stipulated ubiquity of group environments, apart from the obvious LMC-SMC connection and their likely bond with many of the DES dwarfs, very few other satellite associations are known in the MW. For example, it is quite possible that, being the third most massive satellite galaxy, the Sgr dSph (Ibata, Gilmore & Irwin 1994; Niederste-Ostholt et al. 2010) could have had smaller dwarf companions, but only one possible candidate was found in its propinquity (Laevens et al. 2015). Another plausible satellite pair are two of the Leos, IV and V (Belokurov et al. 2007, 2008). What makes their connection conceivable is the combination of their proximity on the sky, i.e.<3° and small differences in their line-of-sight distances and velocities, <20 kpc and <40 km s−1, respectively. Such closeness is striking given that the outer halo of the MW is mostly empty, with only ∼20 per cent of all currently known dwarfs inside a 400 kpc radius located beyond 150 kpc from the Galactic Centre.
For most accretion event architectures, the satellites that fell into the Galaxy together would share the orbital motion and hence should be found near a great circle (see Lynden-Bell & Lynden-Bell 1995). Interestingly, a peculiar globular cluster (GC), Crater (Belokurov et al. 2014; Laevens et al. 2014) lies very close to the great circle passing through Leo IV and Leo V (Belokurov et al. 2014). Crater holds the record for the most distant MW cluster, at 145 kpc. It is also surprisingly young with an age of 7.5 Gyr, and possesses a horizontal branch (HB) that is atypically red and short for its metallicity of [Fe/H] = −1.65 (Weisz et al. 2015). Finally, Crater is one of the largest GCs in the Galaxy. When compared to the rest of the Galactic GCs, Crater peels off as an obvious outlier. Weisz et al. (2015) conjecture that Crater could possibly originate in the SMC, even though it would not have been the most representative cluster in its former host. The fact that the Crater-Leo IV/V great circle with the pole at (α, δ) = (83| $_{.}^{\circ}$|1, 5| $_{.}^{\circ}$|3) (Belokurov et al. 2014) passes only few degrees away from the Magellanic Stream (α, δ) = (84| $_{.}^{\circ}$|3, 17| $_{.}^{\circ}$|8) (Nidever, Majewski & Burton 2008) lends further support to a possible Magellanic origin hypothesis.
In this paper, we present the discovery of a new dwarf galaxy in the constellation of Crater detected using the most recent VLT Survey Telescope (VST) ATLAS data. Crater 2 appears to be one of the lowest surface brightness MW dwarfs, as well as one of the largest. Moreover, there exists a great circle passing through Crater 2, Crater, Leo IV, Leo V and Leo II with a standard deviation of only 0| $_{.}^{\circ}$|5. This paper is organized as follows. Section 2 introduces the VST ATLAS survey and gives the details of the discovery of the satellite. Section 3 describes the in-depth stellar populations and structural properties modelling of the system. Finally, Section 4 puts the discovery into context and assesses the plausibility of the Crater-Leo group's existence.
2 DISCOVERY OF CRATER 2
2.1 VST ATLAS
ATLAS (Shanks et al. 2015) is one of the three public ESO surveys currently being carried out by the a 2.6 m VST at the Paranal observatory. The VST is equipped with the 16 k × 16 k pixels CCD camera OmegaCAM, which provides 1° field of view with a resolution of 0.21 arcsec pixel−1. ATLAS aims to survey 4500 square degrees of the Southern celestial hemisphere in five photometric bands, ugriz, with depths comparable to the Sloan Digital Sky Survey (SDSS). The median limiting magnitudes, corresponding to the 5σ source detection limits, are approximately 21.99, 23.14, 22.67, 21.99, 20.87 for each of the ugriz, respectively. Image reduction and initial catalogue generation are performed by the Cambridge Astronomical Survey Unit (CASU; see Koposov et al. 2014, for details). The band-merging and selection of primary sources were performed as separate steps using a local SQL data base. To improve the uniformity of the photometric calibration of the survey, on top of the nightly zero-points measured relative to AAVSO Photometric All-Sky Survey (APASS) survey, we also applied an additional global calibration step (a.k.a. uber-calibration; Padmanabhan et al. 2008). In this work, we use the photometric catalogues provided by CASU, which include the entirety of the ATLAS data taken up to 2015 September covering ∼4500 square degrees in at least one band, and with ∼3500 square degrees having both g- and r-band observations. In the analysis that follows, we correct ATLAS photometry for the effects of Galactic extinction using the Schlegel et al. (1998) maps and the extinction coefficients from Yuan, Liu & Xiang (2013).
2.2 Discovery
We trawled through the ATLAS data using a version of the systematic overdensity detection algorithm (see e.g. Koposov et al. 2008, 2015). Briefly, the satellite detection algorithm starts by filtering stars using an isochrone mask for a given age, metallicity and distance. The local density of the thus selected stars is then measured and compared to the density level on much larger scales, i.e. the Galactic background/foreground. In practice, the overdensity estimate is performed by convolving the masked stellar number count distribution with a ‘Mexican hat’ kernel: a difference between a narrow inner kernel (for the local density estimation) and a wide outer kernel (to gauge the background density). In our implementation, both kernels are two-dimensional Gaussians and the significance of the detection at each pixel is calculated by comparing the result of the convolution with the expected variance.
Properties of Crater 2.
| Property | Value | Unit |
|---|---|---|
| α(J2000) | 177.310 ± 0.03 | deg |
| δ(J2000) | −18.413 ± 0.03 | deg |
| m − M | 20.35 ± 0.02 | mag |
| D⊙ | 117.5 ± 1.1 | kpc |
| rh | 31.2 ± 2.5 | arcmin |
| rh | 1066 ± 84 | pc |
| MV | −8.2 ± 0.1 | mag |
| 1−b/a | <0.1 (95 per cent) | |
| Age | 10 ± 1 | Gyr |
| [Fe/H] | −1.7 ± 0.1 | dex |
| <μ >(r<rh) | 30.6 ± 0.2 | |$\rm {mag}\,\rm {arcsec}^{-2}$| |
We applied the above method to the ATLAS data using a grid of inner kernel sizes (from 1 to 10 arcmin) and isochrone masks to create a list of stellar overdensity candidates across a range of stellar and structural parameters. Our isochrone masks are based on the most recent PARSEC evolutionary models (Bressan et al. 2012), which are convolved with the appropriate ATLAS photometric error. We have probed 15 < m − M < 23 in distance modulus (DM), from 9.5 to 10.1 in logarithm of age, and −2 < [Fe/H] < −1 in metallicity. Once the known overdensities (previously detected Galactic satellites, Local Volume galaxies etc.) are culled, in the detections list, a large object in the constellation of Crater stands out at the highest significance of 10.7 σ. As shown in Fig. 1, Crater 2 reveals itself rather unambiguously in both stellar spatial distribution – even before any isochrone filtering is applied – and the colour–magnitude diagram (CMD). The left-hand panel of the figure shows Crater 2 as an extended overdensity at the edge of the ATLAS footprint on top of a noticeably non-uniform background. The figure's right-hand panel shows the CMD of all stars within ∼30 arcmin of the centre of the detection (see Section 3.2 for details of the measurement of Crater 2 position, distance and size), where a prominent red horizontal branch (RHB) as well as an obvious red giant branch (RGB) can be seen. The well-defined RHB is a decent distance indicator: Crater 2 is ∼120 kpc away from the Sun. Note that curiously, Crater 2's CMD is remarkably similar to that of Sextans (see fig. 3 of Irwin et al. 1990).
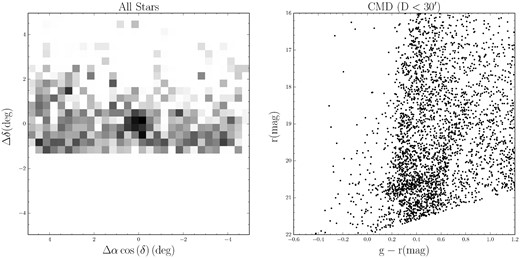
Crater 2 as seen in the ATLAS data. The left-hand panel shows the density map on the sky of all the stars in a 10° × 10° area around the centre of the detection. The overdensity, which is easily visible at the centre, is at the border of the ATLAS footprint embedded in a non-uniform background. In the right-hand panel, we show the CMD of all the stars within 31 arcmin (the half-light radius) of the centre of the detection. Even with the strong background gradient, a prominent RGB and RHB stand out.
Fig. 2 shows the density distribution of stars selected using a mask based on a PARSEC isochrone with [Fe/H] = −1.7, age 10 Gyr offset to m − M = 20.35 (see Section 3.1 for details on the selection of the isochrone parameters, and the right-hand panel of Fig. 3). The mask's width is defined by the ATLAS photometric error above the minimum width of 0.1 mag. The CMD selection enhances the stellar overdensity associated with Crater 2 as revealed in the left-hand panel of Fig. 2. According to the middle and right-hand panels of the figure, no obvious galaxy overdensity or strong extinction variation can be seen overlapping with the new satellite's location. Crater 2's angular diameter of ∼1° corresponds to ∼2 kpc at the distance of 120 kpc, which places it firmly in the class of dwarf galaxies.
![Density maps of the region around Crater 2. The left-hand panel shows the distribution of stars filtered by an isochrone mask with [Fe/H] = −1.7, age of 10 Gyr and m − M = 20.35, which shows a significant enhancement of the overdensity when compared to Fig. 1. The middle panel shows the density map of objects morphologically classified as galaxies in the same area, and the right-hand panel shows the extinction map from Schlegel, Finkbeiner & Davis (1998). It is reassuring to see that there is neither an overdensity in galaxies nor strong extinction variation associated with Crater 2.](https://oup.silverchair-cdn.com/oup/backfile/Content_public/Journal/mnras/459/3/10.1093_mnras_stw733/2/m_stw733fig2.jpeg?Expires=1750408341&Signature=g2zUtqEFcCDXljMh0vwfK-CXeG3mGt7iw39CwBMKsOutdxtrDoeIzUJHXw4hNrM7Z2hHKzEu2n3ujFpkMsqcysewD18Vd1yytzNi2rLlNw5OZ4VGPv0hQhHMwxJc-5NGlrnHsK63ez4MXpQH7zEsdkjrSRsCL3dInc3-ItLki-i4u0ejVR0jLKjscggYr4cuGTlgnd5Wy--cUJ3kDkecpSpr6ANLS8yxZZ1pCmMTY7Z~2weaqxbYw8o-nLHNMZdtyYLyQ4Zj9hjKTvHbceB3KFww4iX-NGKgQKyLgDfbOwMrSPnQG4tyewbHk0W5HrWBD~HHNo9EnOS53nNrMLa7NQ__&Key-Pair-Id=APKAIE5G5CRDK6RD3PGA)
Density maps of the region around Crater 2. The left-hand panel shows the distribution of stars filtered by an isochrone mask with [Fe/H] = −1.7, age of 10 Gyr and m − M = 20.35, which shows a significant enhancement of the overdensity when compared to Fig. 1. The middle panel shows the density map of objects morphologically classified as galaxies in the same area, and the right-hand panel shows the extinction map from Schlegel, Finkbeiner & Davis (1998). It is reassuring to see that there is neither an overdensity in galaxies nor strong extinction variation associated with Crater 2.
![CMD. The left-hand panel shows the comparison Hess CMD constructed using stars between 3° and 5° away from Crater 2. The middle panel shows the Hess difference between the stars within 31 arcmin of the centre and the comparison displayed in the left-hand panel. The RGB and the HB of Crater 2 are now unmistakable. The right-hand panel shows a contrast enhanced version of the middle panel and highlights the possible existence of a BHB. The red line correspond to a PARSEC isochrone with [Fe/H] = −1.7, age 10 Gyr and m − M = 20.35. The associated mask is shown with the red dashed line. For comparison, isochrones with [Fe/H] = −1.4 and −2 are also overlaid in green and orange colour, respectively. The blue lines show the M92's BHB ridge-line shifted to the DM of m − M = 20.35.](https://oup.silverchair-cdn.com/oup/backfile/Content_public/Journal/mnras/459/3/10.1093_mnras_stw733/2/m_stw733fig3.jpeg?Expires=1750408341&Signature=HVnvZTE2M~MpAQKBVCzU-FmTZdytcEQ9UpSPg90XD5O0udtHrQEInjSJeBv0wdlQ9CH8Xix5TmlA9RreMjVi4BWAJ5pVay8sGVPpBFmJt1SEpn6MlWa6vlt6Sik8Cip31ML4jPCVRYH38b~8H~OhCPi9K-nweYko73UL3~~CmbsWInfNO1HW9Kt-j4FcY7ZC~sLF1ndrWfVauihQofqlASrgkW7oL1KkcBOw2GeNQPp-VfhZwX0GdZNTdKk389iw-3K~rm361QMtKBSgBqPquOteh24uV5OFy3vIKawx2WPig-sBI4ie8CW~9tv1l6oMKnhAnXtVuqm--CPvS2L~BQ__&Key-Pair-Id=APKAIE5G5CRDK6RD3PGA)
CMD. The left-hand panel shows the comparison Hess CMD constructed using stars between 3° and 5° away from Crater 2. The middle panel shows the Hess difference between the stars within 31 arcmin of the centre and the comparison displayed in the left-hand panel. The RGB and the HB of Crater 2 are now unmistakable. The right-hand panel shows a contrast enhanced version of the middle panel and highlights the possible existence of a BHB. The red line correspond to a PARSEC isochrone with [Fe/H] = −1.7, age 10 Gyr and m − M = 20.35. The associated mask is shown with the red dashed line. For comparison, isochrones with [Fe/H] = −1.4 and −2 are also overlaid in green and orange colour, respectively. The blue lines show the M92's BHB ridge-line shifted to the DM of m − M = 20.35.
Due to the substantial size of Crater 2, and hence the large aperture required to create the CMD, the details of the satellite's stellar population distribution are buried in the Galactic background/foreground. As a simple but efficient way of decontaminating the CMD, Fig. 3 (middle panel) presents the Hess difference diagram of the stars within 31 arcmin of the centre of Crater 2, in which both the RGB and HB are now evident. For comparison, on left-hand panel we also show the Hess diagram of the background, which is constructed with the stars that lie between 3° and 5° away from Crater 2. The right-hand panel of the figure gives an alternative, highly contrasted version of the Hess difference which highlights hints of a faint blue horizontal branch (BHB). Also shown is the best-fitting isochrone with its associated mask in red solid line and red dashed line, respectively. For comparison, models with higher and lower metallicity are given. Additionally, the M92 BHB ridge-line shifted to the fiducial DM of m − M = 20.35 and the BHB mask are displayed in blue.
3 PROPERTIES OF CRATER 2
3.1 Stellar populations
For stars within 31 arcmin of the centre of Crater 2, the likelihood is sampled using the affine invariant ensemble sampler emcee (Goodman & Weare 2010; Foreman-Mackey et al. 2013) with flat priors on all three isochrone parameters. Given the strong RGB and RHB of Crater 2, all three are well constrained: [Fe/H] = −1.7 ± 0.1; age = 10 ± 1 Gyr and m − M = 20.35 ± 0.02 (also see Table 1). Note, however, that these numbers, and in particular the formal error on the distance, should be taken with caution, given that the behaviour of HB stars is still not well understood, therefore rendering the models somewhat uncertain (see e.g. Gratton et al. 2010). Accordingly, an order of magnitude for the additional uncertainty in the distance can be drawn from the uncertainties of the absolute magnitudes of RHB stars, which are of the order of ∼0.1 mag (Chen, Zhao & Zhao 2009), or ∼5 per cent in the distance.
3.2 Structural parameters
As in the case of the CMD modelling, flat priors are assumed for all parameters, and the posterior distribution is sampled with emcee. Here, we report the best-fitting parameters and their uncertainties corresponding to the 15.9, 50, and 84.1 percentiles of the posterior distribution (see Table 1). Interestingly, we find that in projection on the sky, Crater 2 appears to be completely circular with e < 0.1 at 95 per cent confidence. Its half-light radius is 31 arcmin ± 2.5 arcmin, corresponding to the physical size of 1.07±0.08 kpc at the measured distance of 117 kpc (m − M = 20.35). A zoom-in on the spatial distribution of stars in the proximity of Crater 2 is shown in Fig. 4. The left-hand panel displays the density map of stars that belong to both the RHB and the RGB, the middle panel presents the RHB candidates only, while the right-hand panel deals with BHB density. The BHB candidate stars are selected to lie within the blue dashed box shown in the right-hand panel of Fig. 3. The red solid (dashed) circle shows the half-light radius rh (2rh) of the best-fitting model. An overdensity of stars is visible in both middle and right-hand panel of Fig. 4, with the RHB signal being clearly stronger. The radial profile of Crater 2 is shown in Fig. 5 together with the best-fitting model (red line), which clearly provides an adequate fit to the data. The small bump at R ∼ 100 arcmin is probably caused by the contamination from misclassified galaxies residing in the galaxy overdensity seen in Fig. 2.
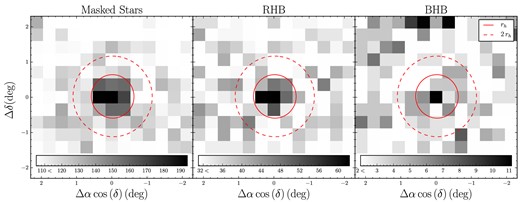
Close-up of the spatial distribution of Crater 2. The left-hand panel shows the density map of all stars that fall within the isochrone mask, i.e. RGB + RHB. The middle panel shows RHB stars only – these are the most numerous stars above the limiting magnitude of the ATLAS survey. The rightmost panel gives the distribution of the BHB candidate stars as selected using the blue box shown in the right-hand panel of Fig. 3. The red solid (dashed) line indicates the half-light radius (twice the half-light radius), and the colour scale in the bottom shows the number of stars per bin.
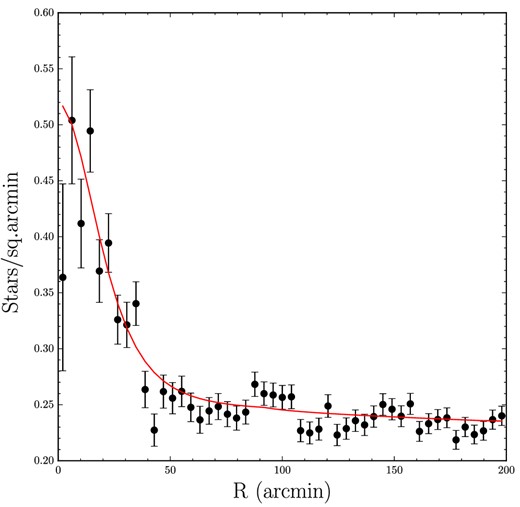
Radial number density profile of Crater 2 as probed by the stars inside the isochrone mask shown in Fig. 3. The red line shows the best-fitting model which includes a Plummer profile with rh = 31 arcmin. The small bump at R ∼ 100 arcmin is probably associated with the small overdensity of misclassified galaxies located close to Crater 2.
The total number of Crater 2 stars with g, r < 22 inside the isochrone mask can be obtained from the measurement of the fraction of Crater 2 member stars in the field f. Using the total number of stars 822 ± 79, we compute the absolute magnitude of Crater 2 by assuming a Chabrier initial mass function (Chabrier 2003) and the best-fitting PARSEC isochrone described in the previous section. The above calculation gives the intrinsic luminosity of the satellite of MV = −8.2 ± 0.1.
4 DISCUSSION AND CONCLUSIONS
4.1 The feeble giant
Fig. 6 compares the structural properties of Crater 2 to those of known satellite systems. Estimates of half-light radius are shown against the values of absolute magnitude for all currently known MW GCs (black dots) and dwarf galaxies (open circles) as well as the dwarfs of the M31 (triangles; McConnachie 2012, updated 2015 Sep); this is complemented by measurements collected for various extended companion objects around nearby galaxies (grey dots; Brodie et al. 2011). To guide the eye, the lines of constant surface brightness of 30 and 31 mag arcsec−2 is drawn. This level – as deduced by e.g. Koposov et al. (2008) – approximately corresponds to the surface brightness detection limit of the current dwarf satellite searches.
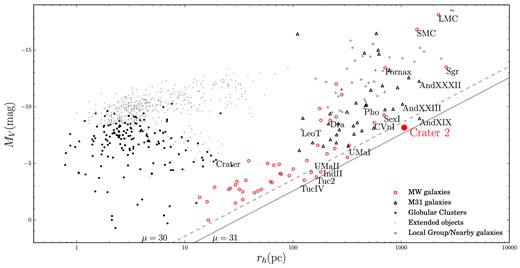
Absolute magnitude versus half-light radius. Local galaxies from McConnachie (2012, updated 2015 September) are shown with different symbols. Dwarf galaxy satellites of the MW are shown with red open circles, the M31 dwarfs with black unfilled triangles, and other nearby galaxies with grey crosses. Black dots are the MW GCs measurements from (Belokurov et al. 2010; Harris 2010; Muñoz et al. 2012; Balbinot et al. 2013; Kim & Jerjen 2015; Kim et al. 2015a,b; Laevens et al. 2015; Weisz et al. 2015) and grey dots are extended objects smaller than 100 pc from Brodie et al. (2011). As the half-light radii of LMC and SMC are unavailable in McConnachie (2012), we measured these ourselves using the 2MASS point source catalogue (Skrutskie et al. 2006). The black solid (dashed) line corresponds to the constant level surface brightness within half-light radius of μ = 31 (30) |$\rm {mag}\,\rm {arcsec}^{-2}$|, which is approximately the surface brightness limit of the searches for resolved stellar systems in the SDSS (Koposov et al. 2008). The position of Crater 2 is marked with a filled red circle. Apart from the only three MW dwarfs exceeding Crater 2 in size, i.e. the LMC, the SMC and the Sgr, we also label the following systems. UMa I, UMa II, Tuc 2 and Tuc IV are the UFDs with surface brightness levels similar to that of Crater 2. Leo T, Dra, Pho, Sex and CVn I all have similar (or slightly higher luminosity) but are smaller in size. Fornax is overwhelmingly more luminous compared to Crater 2, yet not as extended. Finally, there are three systems in the M31 that are comparable (or even larger!) in size to Crater 2: And XIX, And XXIII and And XXXII. The position of the peculiar and extended GC Crater is also marked.
The location of the Crater 2 in the size–luminosity plane is rather remarkable. First, it is one of the lowest surface brightness dwarfs discovered so far, hovering just above the 31 mag arcsec−2 mark. Comparably diffuse are the recently found Tuc 2 and IV as well as the pair of dwarfs in the constellation of Ursa Major. Secondly, the new dwarf appears to be the largest ultrafaint satellite known in the Galaxy, and the fourth largest overall; only the disrupting Sagittarius dwarf and the Magellanic Clouds – both with significantly larger stellar masses – are bigger than Crater 2. In Andromeda on the other hand, it has long been suspected that there exists a subpopulation of oversized dwarfs simply not present in the MW. These would for example include And XIX with the half-light radius of 1.7 kpc (McConnachie et al. 2008) and a somewhat brighter And XXXII with the half-light radius of 1.4 kpc (Martin et al. 2013). At last, with the discovery of Crater 2 some semblance of parity has been established!
It is now being gradually acknowledged that a substantial number of very low surface brightness systems might have been avoiding detection. For example, recently, a discovery of an entire population of ultradiffuse galaxies (UDGs) was reported by van Dokkum et al. (2015) in the Coma cluster. Compared to Crater 2, the Coma UDGs are typically more extended, with sizes between 1.5 and 4 kpc. Most importantly, they reach much higher levels of surface brightness of ∼25 mag arcsec−2, i.e. two orders of magnitude brighter than Crater 2 or Andromeda XIX. It is therefore difficult to claim an unambiguous evolutionary connection between the UDGs and dwarfs similar to Crater 2. For the UDGs, tides seem to be the likely culprit. However, as far as possible Crater 2 formation scenarios are concerned, we can confidently exclude interactions with the Galaxy. The two primary reasons being the near perfect circular shape of Crater 2 isodensity contours and its likely very long orbital period.
Perhaps the following simple, if mundane, genesis hypothesis is worth considering. Do systems like Crater 2 and And XIX represent a natural continuation of the dwarf galaxy distribution in size and surface brightness? This could be the missing part of the dwarf family that only now comes into view helped by data from ever more ambitious wide-area surveys. Additionally, it is not very difficult to imagine that the bulk of the dwarf spheroidals were somewhat larger to begin with. Falling into the potential well of the MW would lead to them experiencing varying amounts of tidal truncation (see Peñarrubia, Navarro & McConnachie 2008). If so then there should be a correlation between the size (and surface brightness) of a dwarf and the time since its infall, with the likes of Crater 2 representing the largely unaffected, recently accreted population. The question, however, remains whether the size and/or the surface brightness of a dwarf could be linked to the physical conditions at the birthplace. This argument can only be developed further if the orbital history of the satellite can be better constrained.
4.2 The Crater-Leo group
Fig. 7 shows the distribution on the sky (in equatorial coordinates) of all satellites (both dwarfs and globulars) located further than 100 kpc from the Galactic centre. Belokurov et al. (2010, 2014) have already pointed out the close alignment between Leo IV, Leo V and Crater. Not only are these positioned almost precisely along a great circle, they also possess very similar radial velocities and distances, suggestive of a common origin in a galaxy group prior to infall into the MW. Surprisingly, as the figure demonstrates, the newly discovered Crater 2 and the classical satellite Leo II could also be part of this group: all five lie close to the great circle with the pole at (α, δ) = (83| $_{.}^{\circ}$|2, −11| $_{.}^{\circ}$|8). In 3D, as the middle panel of Fig. 8 shows, the location of the satellites is consistent with a monotonic distance increase, moving up in declination from Crater 2 to Leo II (bear in mind, though, that the heliocentric distance errors are considerable, i.e. around 10–15 per cent).
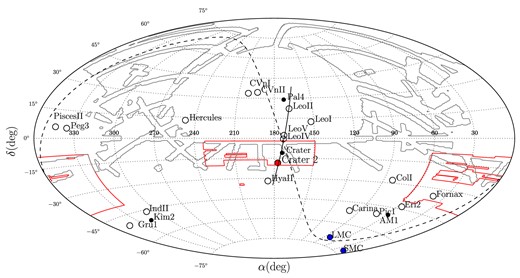
Positions of MW satellites with heliocentric distances between 100 and 400 kpc. Open circles are dwarf galaxies from McConnachie (2012), filled black circles are GCs, filled blue circles show the positions of the LMC and the SMC, and the filled red circle gives the position of Crater 2. The red (grey) contour delimits the ATLAS (SDSS) footprint. The black line shows the segment of the best-fitting orbit, which passes very close to the 3D positions of Crater 2, Crater, Leo IV, Leo V and Leo II. The great circle defined by Nidever et al. (2008) which aligns with the Magellanic stream is also shown with the black dashed line.
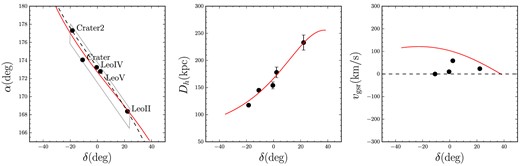
The Crater-Leo group. The left-hand panel shows the positions of Crater, Crater 2, Leo IV, Leo V and Leo II on the sky. Black dashed line indicates the great circle with the pole at (α, δ) = (83| $_{.}^{\circ}$|2, −11| $_{.}^{\circ}$|8) that passes close to all five satellites, and the black box shows the size of the box used to estimate the significance of the association. The middle panel shows the run of the satellites’ heliocentric distance versus declination, and the right-hand panel shows the heliocentric radial velocity (corrected for the solar reflex motion) versus declination. The red line shows an orbit obtained by modelling the 3D positions and the velocities of the four satellites with known radial velocities, i.e. Leo II, Leo IV, Leo V and Crater.
Let us investigate further the significance of the alignment between these distant satellites. We start by considering the Northern Galactic Cap (NGC) area (b > 30|$^\circ$|) as observed by both the VST ATLAS and the SDSS – together the two surveys have covered ∼9000 square degrees in this part of the sky. In this area, the total number of known satellites (GCs and dwarf galaxies) outside 100 kpc radius is 10. Therefore, we create random Monte Carlo realizations of satellite distribution on the sky within the northern SDSS and VST ATLAS footprints assuming uniform distribution on the sky, where the number of satellites is dictated by the Poisson distribution with λ = 10. For each random realization, we determine the largest group of satellites that are strongly aligned, similarly to what is observed for the Crater-Leo group (the satellites in the Crater-Leo group fit within the great circle box with the size of ∼1| $_{.}^{\circ}$|6 × 42|$^\circ$|; see Fig. 8). More specifically, for each simulation we find the maximum number of satellites that can fit within an elongated great circle box with the size 2|$^\circ$|× 45|$^\circ$| of any orientation and location on the sky. On average this number is ∼2.8, however having aligned groups with five or more members is very unlikely, the probability of this is ∼0.0045 which corresponds to ∼2.6σ. Even though the significance appears rather modest, note that this calculation already takes into account the ‘spatial look-elsewhere’ effect, as in the simulations we look for possible alignments at any position on the sky and in any orientation. It is also important that the calculation of the significance has been done assuming a null-hypothesis of uniform distribution of satellites on the sky. If it is not uniform and and is dominated by a plane of satellites as argued by e.g. Pawlowski et al. (2012), the significance of the Crater-Leo group will be different and will depend on detailed properties of the plane of satellites.
The true significance of the orbital synchronization is probably still higher given that both their distances (radial velocities) are similar for the 5 (4) objects in the Leo/Crater group. To assess the plausibility of the group accretion hypothesis, we attempt to model the positions and the kinematics of the Crater-Leo satellites with a single orbit. We used a Navarro–Frenk–White (NFW) halo with a virial mass of 1012 M⊙ and concentration c = 10. The best-fitting orbit that reproduces the 3D positions and goes close to the radial velocities of the satellites is given in Fig. 8. It is, however, immediately clear from the inspection of the figure, that although a single orbit can describe the 3D positions well, it cannot simultaneously match the observed kinematics.
The poor kinematics fit is not surprising: low amplitude of radial motion (as manifested in all four satellites with known velocities) corresponds to the orbital extrema, the pericentre and the apocentre. The kinematics would therefore require these four group members to cluster in the vicinity of either apo or peri, while in reality their distances cover an impressive range of at least 100 kpc. It is, however, well known that tidal debris do not follow orbits exactly. There exists strong energy sorting of debris along the stream, imprinted at the time of stripping. The energy offset between the debris and the progenitor is a function of orbital phase (see e.g. Gibbons, Belokurov & Evans 2014) – the widest energy distribution available around the peri crossing, with the objects unbound closer to the apocentre characterized by energies more similar to that of the progenitor. Thus, it is not unreasonable to conjecture that the satellites stripped from the common group and that are now observed at different phases along the stream, follow distinct orbits, corresponding to the energy at the time of unbinding, each with its own apocentre.
As a matter of fact, long and approximately linear tidal ‘streamlets’ reaching well beyond the average stream apocentre are a ubiquitous feature in simulations of the Sgr dwarf disruption. These, as discussed above, are composed of high-energy particles torn off the progenitor at the penultimate pericentre crossing. If Crater 2 indeed came from the same progenitor, to which we assume Crater, Leo IV, V and II all one day belonged, and the group is currently near the apocentre, the amplitude of the line-of-sight velocity of Crater 2 should be low. Ultimately, to confirm this hypothesis one would require accurate proper motion measurements for as many members of the tentative group as possible. So far, such measurement only exists for the Leo II dwarf (Lépine et al. 2011). Unfortunately, the measurement error is large and only loosely constrains the direction of motion of Leo II, which appears to be marginally consistent with the plane that contains the best-fitting orbit.
Note that there are further, perhaps rather circumstantial, pieces of evidence in favour of the Crater–Crater 2 connection. Both objects are amongst the most extended in the corresponding satellite category: Crater 2 amongst the MW dwarfs, and Crater amongst the Milky Way GCs. Both are highly spherical. Finally, in terms of stellar populations, both have red and short horizontal branches, whose appearance is somewhat unusual given the objects’ low metallicity.
4.3 Summary
Here we have presented the discovery of the Crater 2 dwarf galaxy, identified in the data of the VST ATLAS survey. The luminosity of Crater 2 is MV ≈ −8, i.e. in the range where it could be classified both as a bright ultrafaint dwarf (UFD) or as a faint classical one. With the half-light radius of ∼1.1 kpc, Crater 2 would be the largest amongst the UFDs, and is the fourth largest amongst the MW satellites overall – only the LMC, the SMC and the Sgr are more extended. Consequently, Crater 2 is also one of the lowest surface brightness stellar systems in the Universe ever discovered. Additionally, there is a mounting body of evidence that Crater 2 could have belonged to the satellite group, whose members also included the peculiar GC Crater, UFDs Leo IV and V, as well as the classical dwarf Leo II. We hypothesize that the Crater-Leo group is now dissolved into a narrow tidal debris stream whose apocentre is between 100 and 200 kpc. The stellar overdensity corresponding to Crater 2 was detected at comfortably high levels of statistical significance. If similar size objects with lower luminosity – and hence lower surface brightness – exist, they should be uncovered in the nearest future.
The authors wish to acknowledge many useful discussions with the members of the Cambridge STREAMS club in general, and Wyn Evans, Denis Erkal and Simon Gibbons in particular. We also are grateful to Filippo Fraternali for his advice on the H i data available, and to the anonymous referee for detailed and useful comments. Support for GT is provided by CONICYT Chile. The research leading to these results has received funding from the European Research Council under the European Union's Seventh Framework Programme (FP/2007-2013)/ERC Grant Agreement no. 308024. This research was made possible through the use of the APASS, funded by the Robert Martin Ayers Sciences Fund.
REFERENCES
