


Abstract
We present Spitzer Space Telescope archival mid-infrared (mid-IR) spectroscopy of a sample of 11 planetary nebulae (PNe). The observations, acquired with the Spitzer Infrared Spectrograph (IRS), cover the spectral range 5.2–14.5 μm that includes the H2 0–0 S(2) to S(7) rotational emission lines. This wavelength coverage has allowed us to derive the Boltzmann distribution and calculate the H2 rotational excitation temperature (Tex). The derived excitation temperatures have consistent values ≃900 ± 70 K for different sources despite their different structural components. We also report the detection of mid-IR ionic lines of [Ar iii], [S iv], and [Ne ii] in most objects, and polycyclic aromatic hydrocarbon features in a few cases. The decline of the [Ar iii]/[Ne ii] line ratio with the stellar effective temperature can be explained either by a true neon enrichment or by high density circumstellar regions of PNe that presumably descend from higher mass progenitor stars.
1 INTRODUCTION
Molecular hydrogen (H2) is the most abundant molecule in the Universe. Its excitation and emission have been thoroughly studied theoretically and the emission line ratios have been modelled in detail (Burton 1992; Burton, Hollenbach & Tielens 1992).
Transitions from the rotational and vibrational levels of the ground electronic state of the H2 molecule produce emission lines in the spectral range from the ultraviolet (UV) to the far-infrared (far-IR). The most relevant excitation mechanisms of H2 are: (i) fluorescence or radiative pumping through the absorption of UV radiation from a hot source and (ii) collisional excitation. Photodissociation regions, where a hot source of UV photons irradiates neutral clouds of material, are typical sites for UV excitation of H2. This includes star-forming regions, but it also applies to any cloud illuminated by a local interstellar radiation field (Burton 1992; Habart et al. 2005), and particularly the photodissociation front around a planetary nebula (PN) central star (Black & van Dishoeck 1987; Dinerstein et al. 1988; Sternberg & Dalgarno 1989). On the other hand, shocks propagating into a medium can heat the gas and collisionally excite the H2 molecules (e.g. Hollenbach & Shull 1977; Draine, Roberge & Dalgarno 1983; Smith 1995). This is also the case for the outflowing gas in PNe, which can produce the collisional excitation of H2 in shock regions even if they are embedded in the ionized regions of PNe with high-temperature central stars (Aleman & Gruenwald 2011).
PNe are classical targets for the study of molecular hydrogen, very particularly through its infrared line emission. Near-IR narrowband imaging surveys of PNe have detected the presence of H2 in many objects (e.g. Storey 1984; Webster et al. 1988; Latter et al. 1995; Kastner et al. 1996; Bohigas 2001, 2003a; Guerrero et al. 2000). The H2 emission is detected in the envelopes and photodissociation regions of PNe, where the molecule can be shielded from the UV radiation of the central star by the inner gas and dust or by high-density clumps (Aleman & Gruenwald 2004). Using the known general behaviour and properties of H2 in the interstellar medium (Habart et al. 2005), several studies have attempted to gain insight into the conditions in PNe where this species is found. The correlation between the bipolar morphology of PNe and the H2 detection is well documented (Kastner et al. 1996), suggesting that the H2-bright waists of bipolar PNe are the remnants of dense molecule-rich circumstellar discs. Alternatively, it has been claimed that the preferential detection of H2 emission in bipolar PNe may be an effect of the typically higher effective temperature of their central stars (Phillips 2006; Aleman & Gruenwald 2004, 2011). The consensus is that the brightest H2 emitters tend to be bipolar PNe, but deep near-IR imaging of the 2.122 μm H2 emission line shows that this emission is not exclusive to this morphology (Marquez-Lugo et al. 2013).
Besides the excellent near-IR spectroscopic survey of PNe and study of upper vibrational levels carried out by Hora, Latter & Deutsch (1999), an actual investigation of the excitation mechanism of H2 in PNe and calculations of its excitation temperature have been made in the context of other detailed studies (see e.g. Hora & Latter 1994, 1996; Shupe et al. 1998; Rudy et al. 2001; Lumsden, Puxley & Hoare 2001; García-Hernández et al. 2002; Davis et al. 2003; Likkel et al. 2006; Ramos-Larios, Guerrero & Miranda 2008; Aleman et al. 2011, and references therein). Mid-IR spectroscopy is a powerful tool for the study of the thermal and molecular emission from PNe, since such observations are much less affected by dust extinction. Mid-IR studies of PNe have focused on imaging surveys (e.g. Hora et al. 2004; Phillips & Ramos-Larios 2008, 2010; Zhang & Kwok 2009; Zhang, Hsia & Kwok 2012), but mid-IR spectroscopy of PNe has only been carried out for individual objects for which chemical abundances and H2 excitation temperatures were obtained (Cox et al. 1998; Matsuura & Zijlstra 2005; Hora et al. 2006; Phillips, Ramos-Larios & Guerrero 2011). Currently, mid-IR studies of the excitation temperature of H2 in PNe are scarce.
Using archival Spitzer mid-IR spectroscopy, we have conducted a spectroscopic survey of PNe to assess the presence of ionic species, polycyclic aromatic hydrocarbons (PAHs), and molecular hydrogen. The H2 excitation temperature has been derived using its mid-IR emission lines. These temperatures shed light on the purely rotational component of the excitation temperatures to complement the rotational–vibrational studies obtained by near-IR observations.
Section 2 details the criteria for target selection and data processing. Section 3 describes the mid-IR spectroscopic properties of each PN in our sample. A review of the theory behind the data analysis is given in Section 4 and the final discussion is presented in Section 5.
2 ARCHIVAL DATA: SELECTION AND REDUCTION
2.1 The Spitzer archive
This study made use of the Spitzer Space Telescope (Werner et al. 2004) data base. We used spectroscopic observations obtained with the Infrared Spectrograph (IRS; Houck et al. 2004), one of three Spitzer focal plane instruments. It consists of four separate modules, namely Short-Low (SL), Short-High (SH), Long-Low (LL), and Long-High (LH), which provide low (R ∼ 60–128) and moderate (R ∼ 600) resolution spectroscopic capabilities from 5.2 to 38 μm. The low-resolution modules employ a long slit that allows the acquisition of spatially-resolved spectral information on the same detector array.
In this study we will use low-resolution IRS spectra obtained with the Short-Low SL1 and SL2 modules. The aperture sizes for the SL1 and SL2 modules are 3.7 × 57 arcsec2 and 3.6 × 57 arcsec2, respectively. They cover different spectral ranges, 7.4–14.5 μm for SL1 and 5.2–7.7 μm for SL2. This spectral range is especially suited for analyses of Boltzmann distributions (see Section 4) as it includes the S(2) to S(7) rotational lines of H2.
2.2 Target selection
The procedure for the target selection in this study is as follows: (1) we first searched through the literature for PNe that are known to exhibit H2 emission, (2) then we queried the Spitzer online data base for objects with SL1 and SL2 spectra modules in the 5.2–14.5 μm range, and (3) objects without suitable observations through nearby slits that could be used for background subtraction were discarded.
Eventually, 11 objects were selected for analysis: M 2-51, NGC 2346, NGC 2440, NGC 2818, NGC 3132, NGC 6072, NGC 6445, NGC 6537, NGC 6720, NGC 6781, and NGC 7293. Basic properties of our targets are presented in Table 1. The information on the available Astronomical Observation Requests (AORs) for each object is shown in Table 2. Several PNe known to show H2 emission with available Spitzer data did not meet the criteria above and were thus not included in this study. No suitable background information was available for NGC 40, NGC 650-1, NGC 6369, or NGC 7026; no H2 emission was detected in the SL spectra of J 900, NGC 6629, or NGC 7027; and no SL spectra were available for Hb 12, Hu 2-1, IC 5117, or M 2-9.
Basic properties of target PNe.
| Object | R.A. | Dec. | Distance | Angular size | Physical size | log Ne | Vexp | Teff | References |
|---|---|---|---|---|---|---|---|---|---|
| (J2000) | (kpc) | (arcsec) | (pc2) | (cm−3) | (km s−1) | (103 K) | |||
| M 2-51 | 22 16 03.3 | +57 28 41 | 1.60 | 83 × 58 | 0.64 × 0.45 | 2.94 | – | – | 1, 2 |
| NGC 2346 | 07 09 22.1 | −00 48 17 | 0.90 | 120 × 65 | 0.52 × 0.28 | 2.64 | 12 | >80 | 3, 4 |
| NGC 2440 | 07 41 55.4 | −18 12 33 | 1.90 | 74 × 45 | 0.68 × 0.42 | 3.06 | 25 | 208 | 4 |
| NGC 2818 | 09 16 00.5 | −36 37 32 | 2.84 | 110 × 55 | 1.52 × 0.75 | 3.11 | 18.5 | 160 | 5, 6, 7, 8 |
| NGC 3132 | 10 07 01.8 | −40 26 10 | 0.81 | 85 × 58 | 0.33 × 0.23 | 2.80 | 21 | 100 | 4 |
| NGC 6072 | 16 12 58.6 | −36 13 49 | 1.39 | 120 × 70 | 0.81 × 0.47 | 2.64 | 10 | 140 | 4 |
| NGC 6445 | 17 49 15.3 | −20 00 35 | 1.39 | 50 × 30 | 0.33 × 0.20 | 3.16 | 38 | 170 | 4 |
| NGC 6537 | 18 05 13.4 | −19 50 13 | 2.00 | 230 × 56 | 2.23 × 0.54 | 4.11 | 18 | 250 | 4 |
| NGC 6720 | 18 73 35.1 | +33 01 45 | 0.70 | 96 × 74 | 0.33 × 0.25 | 2.90 | 22 | 125 | 4 |
| NGC 6781 | 19 18 28.1 | +06 32 19 | 0.95 | 200 × 120 | 0.92 × 0.55 | 2.41 | 12 | 112 | 4 |
| NGC 7293 | 22 29 38.8 | −20 50 15 | 0.22 | 1150 × 770 | 1.22 × 0.82 | 1.86 | 21 | 110 | 4 |
Notes: log Ne: logarithm of electronic density; Vexp: expansion velocity; Teff: central star effective temperature. The sizes shown in the table for each object refer to the main nebula only and do not consider the halo.
Spitzer AORs used for the survey.
| Object | AORs | Type | Program | PI | Date |
|---|---|---|---|---|---|
| M 2-51 | 4114688 | IRS Stare | 45 | Roellig, Thomas | 2004 January 6 |
| 4114944 | |||||
| NGC 2346 | 17462272 | IRS Map | 30482 | Houck, James R. | 2007 May 3 |
| 17462016 | |||||
| 17461248 | |||||
| NGC 2440 | 27358208 | IRS Map | 50179 | Sellgren, Kris | 2008 December 5 |
| 27358464 | 2004 December 4 | ||||
| 27360512 | |||||
| NGC 2818 | 27361280 | IRS Map | 50179 | Sellgren, Kris | 2009 January 6 |
| NGC 3132 | 27358720 | IRS Map | 50179 | Sellgren, Kris | 2009 January 14 |
| NGC 6072 | 4115200 | IRS Stare | 45 | Roellig, Thomas | 2005 August 11 |
| 4115456 | |||||
| NGC 6445 | 27361024 | IRS Map | 50179 | Sellgren, Kris | 2008 October 18 |
| NGC 6537 | 27358976 | IRS Map | 50179 | Sellgren, Kris | 2008 November 4 |
| NGC 6720 | 15878656 | IRS Map | 1424 | Calibration | 2005 September 13 |
| NGC 6781 | 16099072 | IRS Map | 1425 | Calibration | 2005 October 19 |
| NGC 7293 | 13736192 | IRS Stare | 1421 | Calibration | 2005 May 29 |
2.3 Data reduction
After selecting the SL1 and SL2 bands for each nebula in Table 2, the Basic Calibrated Data (BCD) were downloaded for analysis from the NASA/IPAC Archive. The Spitzer BCD data have been dark-subtracted, flat-field corrected, and wavelength and flux calibrated. The data were further processed using the software package cubism1 (Cube Builder for IRS Spectral Mapping; Smith et al. 2007) to subtract the sky emission and produce clean, low-resolution spectra for each object. The various processing steps within cubism include characterization of noise in the data and removal of bad pixels. One-dimensional spectra were then extracted and line fluxes measured accounting for bad pixel correction and map creation (e.g. a continuum-subtracted line image).
3 RESULTS
3.1 Slits and spectra
Figs 1 to 12 show optical images of each PN obtained from the red band of the Digital Sky Survey (DSS) where the location of the on-source and background slit positions are marked. The one-dimensional mid-IR spectra in the 5.2–14.5 μm wavelength range of each object obtained after sky subtraction and extraction are also shown in these figures. The 7.4–7.7 μm spectral range is the overlapping region between SL1 and SL2 and the reliability in that portion of the spectra is compromised. Note the different spectral resolution of the SL1 and SL2 modules: emission lines in the 5.2–7.7 μm SL1 spectral range are narrower than those in the 7.5–14.5 μm SL2 spectral range.
![Left: DSS red image of M 2-51 superimposed with the slit positions of the selected source and background (outside the nebula) SL spectra. North is up and east to the left. The DSS red image of a PN is expected to be dominated by the H α and [N ii] nebular emission. Right: Spitzer mid-IR (SL1 + SL2) spectrum of M 2-51, where several H2 and ionic lines are identified.](https://oup.silverchair-cdn.com/oup/backfile/Content_public/Journal/mnras/459/1/10.1093_mnras_stw646/2/m_stw646fig1.jpeg?Expires=1750430866&Signature=imMmYrp46cXY7ixdTrbczR8Xe~uOdBiI0zv1OL6iRQ1Qh5jIhGVQwOrVpzaG5BlLmQBqLmGjKNffr40kXVuO1pgTUUYW3qHV50xnEsUIE-baL-~p~ZnrHFohG2hSk7F~sjI4Wb-NN-Ily0S0kUiOAFaVYDA2xEp4akiJlE6KOgz5hV1SWm2yvRtq5T4Ss4gD1W8m9gNgNPvyPs67eKOQ2vxmtlemvVOGiGb6oc6PP6kWg4rSdPpSNOiqfLe~8XQS59txxTusBToapoeHJyiY3sE1ryj85-Aphq5iosaML4FdczgGgZIew5aq9Ym9GZWdvWn25pi7nqH-mGMN2lknpg__&Key-Pair-Id=APKAIE5G5CRDK6RD3PGA)
Left: DSS red image of M 2-51 superimposed with the slit positions of the selected source and background (outside the nebula) SL spectra. North is up and east to the left. The DSS red image of a PN is expected to be dominated by the H α and [N ii] nebular emission. Right: Spitzer mid-IR (SL1 + SL2) spectrum of M 2-51, where several H2 and ionic lines are identified.
Many important H2 and ionic lines and PAH features are identified in these spectra.
The identification of the broad PAH emission feature at ≃11 μm in the SL2 range may be called into question by the possible presence of the H i (9–7) transition at 11.3 μm. To assess the nature of the emission feature, when detected, we have measured its linewidth and that of nearby ionic or H2 molecular lines. Only features clearly asymmetric and broader than ionic or molecular lines have been identified as PAH features.
Details of the properties of each source and its spectrum are provided below.
3.2 Individual objects
3.2.1 M 2-51
Balick (1987) classified M 2-51 as an early elliptical PN. In the mid-IR, its morphology has also been described as elliptical, with a size of 36 × 56 arcsec2, but with additional extensions along the north-west to south-east direction (Marquez-Lugo et al. 2013). The early evolutionary stage, however, has been questioned by Forveille & Huggins (1991) and Saito et al. (1999) who have classified it as an evolved PN.
The SL spectrum of M 2-51 (Fig. 1) is noisy in the SL1 spectral range, making the identification of molecular hydrogen lines difficult. At any rate, H2 lines are present in this spectral region. Two ionic lines were identified in the spectrum, [Ar iii] λ8.99 μm and [Ne ii] λ12.81 μm. These spectral features generally agree with those found by Marquez-Lugo et al. (2013), also using the Spitzer IRS SL spectra.
3.2.2 NGC 2346
The optical image of NGC 2346 (Fig. 2, left) reveals a bipolar morphology with a narrow waist and open bipolar lobes, in accordance with previous descriptions as an open-ended butterfly PN. The central star is a binary (Mendez & Niemela 1981) and variable, probably due to dust in orbit around it (Arias et al. 2001). Zuckerman & Gatley (1988) found that the H2 emission in the near-IR delineates the equatorial ring and bipolar lobes well, but it is more extended than the emission from ionized gas. The near-IR spectrum is dominated by the H2 emission (Hora et al. 1999). Very recently, Manchado et al. (2015) showed very high resolution imagery in the H2 (1–0) S(1) 2.218 μm line. For the first time, they were able to resolve the diffuse equatorial ring of NGC 2346 into an ensemble of molecular knots and filaments, as those reported in other PNe by Marquez-Lugo et al. (2013) and references therein.
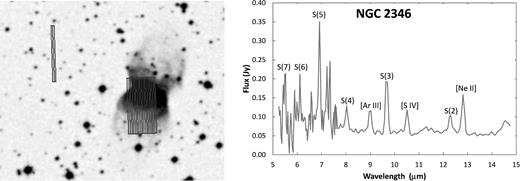
Same as Fig. 1 but for NGC 2346
The mid-IR images of NGC 2346 show evidence of possible concentric rings surrounding the main nebula (Phillips & Ramos-Larios 2010). This kind of structure has been observed in several objects in the optical and IR (e.g. the Cat's Eye Nebula, NGC 6543; Balick, Wilson & Hajian 2001). The mid-IR spectrum (Fig. 2) resembles that of M 2-51 in the strength of its lines and noise in the spectral range covered by the SL2 module. Note the additional detection of the [S iv] λ10.51 μm. A broad feature at ≃11 μm might be assigned to PAH emission, but the quality of the signal makes this identification questionable.
3.2.3 NGC 2440
NGC 2440 has a complex structure. In shallow optical images (Fig. 3, left), it appears as a bipolar PN with its major axis aligned along the east–west direction. Deep exposures reveal up to three distinct bipolar outflows inside the outer main bipolar lobes. The detailed kinematic study presented by López et al. (1998) definitely confirmed the presence of several bipolar structures emerging along different position angles from the central region. The nebula is bright in H2 in the near-IR spectra (Hora et al. 1999); however, the bipolar structures disappear in near-IR H2 images and an outer, roughly circular halo of H2 and radial structures emerge (Latter & Hora 1997). In mid-IR images, this round halo shows evidence of interaction with the interstellar medium, with a sharp edge towards the north-east (Ramos-Larios & Phillips 2009).
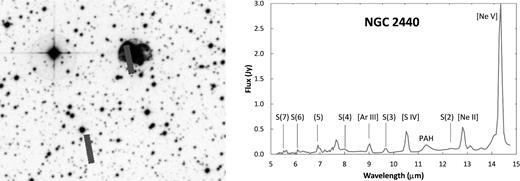
Same as Fig. 1 but for NGC 2440.
The mid-IR spectrum of NGC 2440 (Fig. 3, right) shows contrasting properties to those of the previous sources, M 2-51 and NGC 2346. Its spectrum displays a number of weak H2 emission lines and also [Ar iii], [S iv], and [Ne ii] lines, but it is dominated by the strong [Ne v] λ14.32 μm line. There is a noticeable broad feature at 11.3 μm, which was identified as the PAH emission. The H2 line intensities are generally weaker than those of the ionic species, with S(3) and S(5) being the best defined.
3.2.4 NGC 2818
The morphology of NGC 2818 is that of an irregular bipolar. The available images in the H2 1–0 S(1) emission line show a sort of elliptical structure delineating the H α emission from the equatorial waist and the bipolar lobes (Schild 1995; Bohigas 2003a). In addition, the excellent colour-composite three-colour image in the Spitzer Infrared Array Camera (IRAC) 3.6, 4.5, and 8.0 μm bands of Hora (2007) reveals faint extended emission that closely matches that of the H2 in the near-IR. Assuming a homogeneous expansion rate, the expansion velocity of NGC 2818 implies a kinematic age ∼8400 yr (Vazquez 2012).
The mid-IR spectrum of NGC 2818 (Fig. 4, right) shows very well-defined, bright emission lines for all the H2 lines in the SL1–SL2 spectral range. The S(5) and S(3) lines are the most prominent among the molecular hydrogen transitions. Ionic lines of [Ar iii], [S iv], [Ne ii], and [Ne v] are also detected, as well as a weak emission line at ∼11.3 μm that can be identified with the H i (9–7) recombination line.
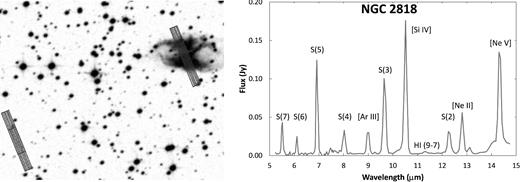
Same as Fig. 1 but for NGC 2818.
3.2.5 NGC 3132
Despite its ellipsoidal morphology, Monteiro et al. (2000) found that a bipolar Diabolo represented the physical structure of NGC 3132 more accurately. This PN is one of the H2 brightest (Storey 1984), with an H2 spatial distribution following the optical morphology. The H2 line ratios derived from near-IR spectra implies shock excitation (Zuckerman & Gatley 1988).
The Spitzer mid-IR IRS spectrum shows all previously identified H2 and ionic emission lines (Fig. 5). The ionic emission lines of [Ar iii], [S iv], and [Ne ii] are the brightest in the spectrum.
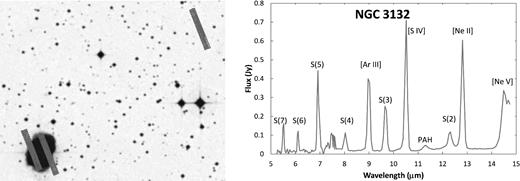
Same as Fig. 1 but for NGC 3132.
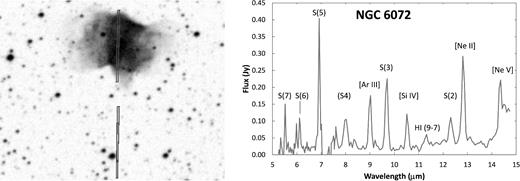
3.2.6 NGC 6072
NGC 6072 has the appearance of an elliptical ring along the north–south direction, with faint extensions in the east–west direction. The nature of this ring is emphasized by its strong CO emission and expansion velocity of the molecular material, ∼15 km s−1 (Cox et al. 1991). The detailed analysis of near-IR H2 and Spitzer IRAC images of NGC 6072 presented by Kwok et al. (2010) reveals a quadrupolar morphology (Manchado, Stanghellini & Guerrero 1996), with a prominent equatorial ring and hints of additional multipolar features. Analyses of near-IR spectra conclude that the H2 is primarily excited by shocks (Zuckerman & Gatley 1988).
The mid-IR spectrum of NGC 6072 is somewhat noisier than the previous ones (Fig. 6, right). The very same transitions found in the mid-IR spectrum of NGC 3132 were found for NGC 6072. The brightest lines in the mid-IR spectrum according to our measurements are H2 0–0 S(5) and [Ne ii].
Same as Fig. 1 but for NGC 6072.
3.2.7 NGC 6445
NGC 6445 is characterized by an inner square-shaped ring surrounded by a faint intricate bipolar structure (Cuesta & Phillips 1999). Based on observations of its density, the nebula appears to be evolved. The mid-IR Spitzer image by Phillips & Ramos-Larios (2010) shows differences in the optical and mid-IR distributions, and the presence of strong 8.0 μm emission outside the central nebula. They argue the possibility that this extended mid-IR emission derives from a cylinder of neutral material that would be responsible for the large-scale collimation of the optical structures.
The mid-IR spectrum of NGC 6445 (Fig. 7, right) resembles closely that of NGC 2440, although with relatively brighter emission in the [S iv] and [Ne ii] lines compared to that of [Ne v]. The H2 transition lines are a bit brighter in NGC 6445 than in NGC 2440, though still fainter than the ionic lines.

Same as Fig. 1 but for NGC 6445.
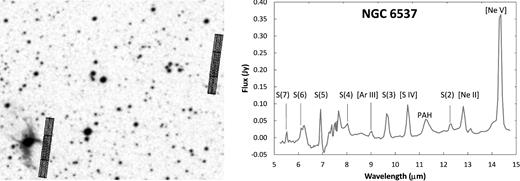
3.2.8 NGC 6537
NGC 6537, also known as the Red Spider Nebula, has a pronounced bipolar shape. The central star is located behind a dense shell of dust, making its properties difficult to determine. Even so, its temperature is estimated to be at least 180 000 K (Hyung 1999).
The spectrum obtained for NGC 6537 (Fig. 8, right) is largely dominated by the [Ne v] λ14.32 μm line at the right end of the spectrum. Other emission lines are also easily identifiable. The [Ar iii] line is noticeably less prominent than in other spectra, and H2 transitions are present. The spectrum obtained in this study is similar to the one presented by Marquez-Lugo et al. (2013) for the lobular region of the nebula.
Same as Fig. 1 but for NGC 6537.
3.2.9 NGC 6720
The well-studied Ring Nebula (NGC 6720 or M57) is an ellipsoidal shell with a bright equatorial region seen almost pole on (Guerrero, Manchado & Chu 1997; O'Dell, Sabbadin & Henney 2007). The expansion velocity of the nebula is 20–30 km s−1. The surface temperature of its central star is 125 000 K (van Hoof et al. 2010).
The near-IR spectrum of the central ring shows prominent H2 emission lines (Hora et al. 1999). The mid-IR spectrum, on the other hand, is dominated by the ionic lines of [S iv], [Ne ii] and [Ar iii], with weaker H2 transitions (right-hand panel of Fig. 9). S(5) and S(3) are the most prominent H2 lines.
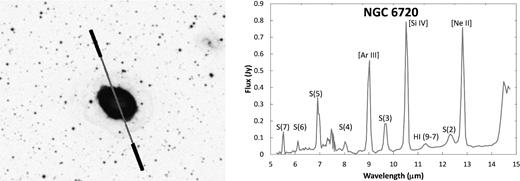
Same as Fig. 1 but for NGC 6720. In this case, the two outer slits in black were used as background.
3.2.10 NGC 6781
Even though NGC 6781 presents an elliptical morphology, it is very likely a bipolar nebula seen almost pole on. The H2 envelope forms a thin hollow cylinder, which is open at both ends and tilted towards the line of sight, with an expansion velocity of 22 km s−1 (Hiriart 2005). It shares with other PNe the peculiar property that the expansion velocity of its molecular gas is greater than the expansion velocity of the ionized gas. An optical and infrared study of this object by Phillips et al. (2011) found an H2 excitation temperature of ∼980 K.
Ionic transitions of [S iv], [Ar iii], and [Ne ii] are found in the mid-IR spectrum of NGC 6781 (Fig. 10, right). Molecular hydrogen lines are also present, but they are weaker than the [S iv] emission line.

Same as Fig. 1 but for NGC 6781. The upper slit in black was used as background.
3.2.11 NGC 7293
Infrared studies of the Helix Nebula (NGC 7293) are numerous, including those by Cox et al. (1998), Hora et al. (2006), and, more recently, the detailed works on H2 cometary knots by Matsuura et al. (2007, 2009) and Aleman et al. (2011). The first of these investigations reported an H2 excitation temperature of 900 ± 50 K for the west edge, while the second one reported mid-IR fluxes for the same AORs as our present work (north and south-west) and colour–colour diagrams, but did not calculate the H2 excitation temperature.
The close similarity of the spectra at positions 1 and 2 for NGC 7293 (Figs 11 and 12) confirms the symmetry of the nebula. The ionic transitions of [S iv] and [Ne v] are notably absent in these spectra. The spectra are otherwise dominated by the S(5), S(3), and S(7) H2 rotational lines.
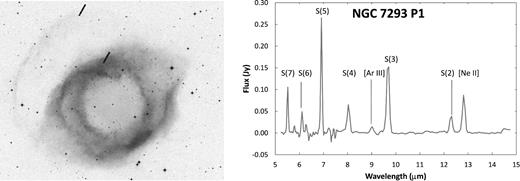
Same as Fig. 1 but for NGC 7293, position 1. In this case, the upper small slit was used as background.
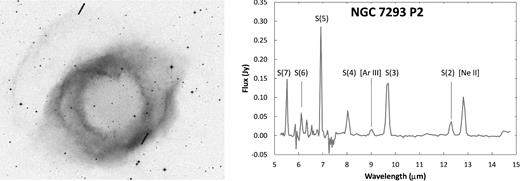
Same as Fig. 1 but for NGC 7293, position 2. The upper position was also used as background.
3.3 Line intensities
Table 3 shows a summary of the H2 and ionic emission lines and PAH features identified in the mid-IR spectra of all targets. The H2 S(5) 6.91 μm and [Ar ii] 6.99 μm emission lines are at the limit of the spectral resolution at this wavelength, ≃0.05 μm. The relative contributions of both lines have been estimated using standard iraf routines for line deblending. With the only exception of NGC 6445, the H2 S(5) line is found to be much brighter than the [Ar ii] line and the flux of the latter line is thus not reported.
Line fluxes (× 10−13 erg s−1 cm−2 Å−1).
| Transition: | H2 S(7) | H2 S(6) | H2 S(5) | [Ar ii] | H2 S(4) | [Ar iii] | H2 S(3) | [S iv] | H i (9–7) | H2 S(2) | [Ne ii] | [Ar v] | [Ne v] | PAH |
|---|---|---|---|---|---|---|---|---|---|---|---|---|---|---|
| λ (μm): | 5.51 | 6.11 | 6.91 | 6.99 | 8.02 | 8.99 | 9.66 | 10.51 | 11.3 | 12.28 | 12.81 | 13.1 | 14.32 | |
| Source | ||||||||||||||
| M 2-51 | 8 | 4 | 14 | – | 11 | 6 | 20 | – | – | 8 | 13 | – | – | No |
| NGC 2346 | 13 | 2 | 23 | – | 7 | 8 | 21 | 7 | – | 7 | 14 | – | – | ? |
| NGC 2440 | 3 | 3 | 9 | – | 8 | 22 | 12 | 58 | – | 7 | 68 | 10 | 439 | Yes |
| NGC 2818 | 3 | 2 | 10 | – | 4 | 4 | 13 | 22 | 0.1 | 5 | 7 | 1 | 20 | No |
| NGC 3132 | 11 | 8 | 38 | – | 11 | 53 | 35 | 83 | – | 14 | 76 | – | 66 | Yes |
| NGC 6072 | 10 | 6 | 30 | – | 15 | 20 | 30 | 13 | 5 | 13 | 38 | – | 24 | No |
| NGC 6445 | 4 | 3 | 12 | 13 | 6 | 59 | 19 | 137 | – | 12 | 108 | 9 | 381 | Yes |
| NGC 6537 | 2 | 3 | 8 | – | 6 | 2 | 11 | 12 | – | 3 | 10 | – | 54 | Yes |
| NGC 6720 | 10 | 3 | 20 | – | 7 | 69 | 25 | 99 | 8 | 14 | 93 | – | 101 | No |
| NGC 6781 | 9 | 4 | 21 | – | 11 | 18 | 27 | 50 | – | 10 | 26 | – | – | Yes |
| NGC 7293 P1 | 7 | 3 | 19 | – | 8 | 2 | 23 | – | – | 6 | 12 | – | – | No |
| NGC 7293 P2 | 9 | 4 | 18 | – | 7 | 2 | 20 | – | – | 5 | 14 | – | – | No |
Among all the molecular hydrogen transitions, the S(5) and S(3) lines were the most prominent in all objects. Many sources show bright forbidden transitions from ionic species. [Ar iii] and [Ne ii] were identified in all sources, and [S iv] was found in all but two, M 2-51 and NGC 7293. Other ionic emission lines include those of [Ar ii], [Ar v], and [Ne v].
The variations in the [Ne v]/[Ne ii] line ratios among the objects in our sample have a clear correlation with the effective temperature of the central stars (Fig. 13, left). Only sources whose Central Star of Planetary Nebula (CSPN) are hotter than 150 000 K have [Ne v] λ14.32 μm line intensities notably larger than those of the [Ne ii] λ12.81 μm line. The larger Ne+3 ionization potential (97.1 eV) with respect to that of neutral Ne (21.6 eV) provides an easy explanation.
![Left: [Ne v]/[Ne ii] line ratios for the object sample plotted against effective temperature of their central stars. Right: [Ar iii]/[Ne ii] line ratios for the sample, also plotted against the central star effective temperature. The open square corresponds to a lower limit for the effective temperature.](https://oup.silverchair-cdn.com/oup/backfile/Content_public/Journal/mnras/459/1/10.1093_mnras_stw646/2/m_stw646fig13.jpeg?Expires=1750430866&Signature=xhvNTvgjorAFzlVSeECvT-dCRgzq2j~lphA1I6sIvPUO4EIxNUN9e9cpKLE3YkUtZblEx-DsU7bsAzozcHDi4~fWe~kdoXwmiiyoVgZzm5eNSHkmfhkMT7AvwbryaIqdfope2Xf2tRZID68hD8EJRLHvROilw9rTQyRZAHlXIyFOZ3t58R4SbqlDjkllkPYV4ONzygwVgOPSt8KeDa59ocweaSDvmpBRMOLG9bU80OeiVWWSINY2HVSRU6yLGdWJzt62Jfxm63PIrWWmGfoLfIB26sEtUCESw9rtSinL3i4N5gyCAYeKr7HOu4TVlGTB1V60T2yvfGXkpcygRJsy7g__&Key-Pair-Id=APKAIE5G5CRDK6RD3PGA)
Left: [Ne v]/[Ne ii] line ratios for the object sample plotted against effective temperature of their central stars. Right: [Ar iii]/[Ne ii] line ratios for the sample, also plotted against the central star effective temperature. The open square corresponds to a lower limit for the effective temperature.
Fig. 13 (right) shows a notable correlation between the [Ar iii]/[Ne ii] line ratio and the stellar effective temperature. With the notable exception of NGC 7293, the [Ar iii]/[Ne ii] line ratio declines steadily from 0.8 for the coldest stars (Teff ∼ 80 000 K) to 0.2 for NGC 6537 (Teff ∼ 250 000 K). This correlation is intriguing, since the ionization potentials required to produce the Ar++ and Ne+ species, 27.6 and 21.6 eV, respectively, seem to imply that this line ratio should increase with increasing effective temperature of the central star. Indeed, simple cloudy simulations for standard parameters for PNe (L⋆ = 1000 L⊙, Ne = 1000 cm−3, radius = 1017 cm, typical PN abundances) confirm this expectation: the [Ar iii]/[Ne ii] line ratio increases by a factor of 4 in the range of effective temperature of the central stars in the sample.
The Collisionally Excited Lines (CEL) emissivity has an exponential dependence on the electron temperature |$\propto T_{\rm e}^{-1/2} \exp (-E_{\rm ex}/kT_{\rm e})$|, where Eex is the excitation energy of a CEL. For an IR fine-structure line of a heavy element (e.g. [Ar iii] λ8.99 μm or [Ne ii] λ12.81 μm lines), the excitation energy Eex is very small, and thus its emissivity is rather insensitive to the electron temperature. However, the emissivity of an IR fine-structure line has a density dependence, and the ratio of these two IR lines would be sensitive to the electron density. cloudy models to assess these effects show that the [Ar iii]/[Ne ii] line ratio decreases as the electron density increases. Therefore, the observed trend of the line ratio in our PN sample can be explained if the sources with higher effective temperatures also have high electron density regions as sampled by the Spitzer aperture. Alternatively, the possibility that the change in the [Ar iii]/[Ne ii] line ratio could also be a result of the relative abundance of argon and neon cannot be totally ruled out.
Finally, it must be noted that there is not a clear correlation of the ratios of molecular hydrogen and ionic line intensities with the stellar effective temperature. Neither is there a clear correlation with the nebular density. Apparently, the mid-IR H2 and ionic line ratios do not depend on the nebular size, central star effective temperature, or nebular density.
4 MOLECULAR HYDROGEN EXCITATION
Within a given electronic level, the different energy levels of the H2 molecules are described by the vibrational quantum number ν and rotational quantum number J. The symmetry of the H2 molecule implies that it has no dipole moment, making dipole rotational/vibrational transitions in the same electronic state forbidden. Electric quadrupole transitions may still occur, with selection rules ΔJ = 0 or ± 2, with 0–0 transitions forbidden, and no strict rules for Δν (Shull & Beckwith 1982). These transitions are labelled according to the change in ν and the final value of J (ΔJ = −2, 0, and +2 are labelled as the O, Q and S branches, respectively).
The H2 0–0 rotational lines lie between 3 and 28 μm. Since the H2 molecule has a very small moment of inertia, the rotational lines are widely spaced and easily separated by low-resolution spectrometers. In the mid-IR region observed by the low-resolution IRS Spitzer spectra, the H2 lines correspond to the pure rotational transitions ν = 0–0 S(2) to S(7) within the vibrational and electronic ground states.
The H2 molecule can be excited by different mechanisms, including fluorescence and collisional excitation (Habart et al. 2005). In the first case, the absorption of a UV photon in the Lyman and Werner bands results in a rotational–vibrational cascade towards the ground state (Black & van Dishoeck 1987). In a PN, these UV photons can originate in the central star, but they can also be the result of emission from strong shocks. Alternatively, when shocks are moderate, the H2 transitions arise through thermal excitation (Sternberg & Dalgarno 1989). The different predicted line strengths between thermal collisional and fluorescence excitation can allow us to distinguish between these two mechanisms by means of IR spectroscopy, but this requires information on the line ratios of H2 lines from differing vibrational states ν, because collisions can thermalize the lowest vibrational levels and mimic thermal excitation. Sometimes this happen if the gas is very dense (Black & van Dishoeck 1987).
4.1 H2 excitation temperatures
We used the integrated flux of each H2 line from the spectrum of each object to calculate the population levels according to the procedure outlined in the previous section. The population diagram showing the log of the quotient in equation (2) against the upper temperature for the energy level of each transition is shown in Figs 14 and 15. The data points in these figures all show a linear trend. Since all the data points correspond to a unique transition ν, this linear trend cannot be directly interpreted as a thermal distribution of the population of the energy levels of the H2 molecules. At any rate, the negative inverse of the slope of the linear fits can be used to measure the rotational H2 excitation temperature, Tex(rot).
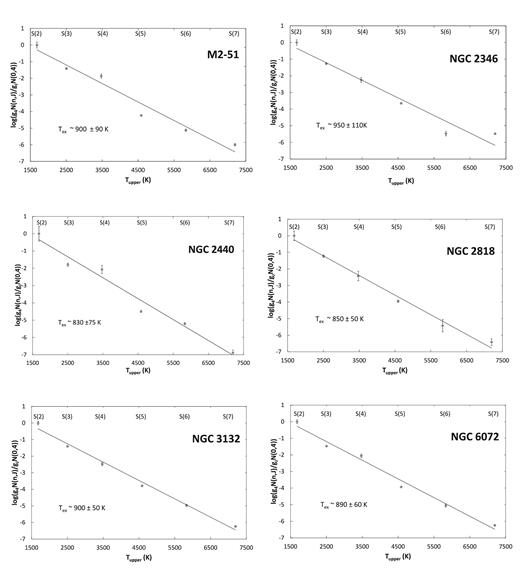
Mean variation in H2 populations for the ν = 0–0 S(2)–S(7) transitions is represented in the excitation diagrams for M 2-51, NGC 2346, NGC 2440, NGC 2818, NGC 3132, and NGC 6072. The results are based on averages of line strengths for selected spectral positions (error bars are included). The least-squares fit to the results implies rotational excitation temperatures of ∼800–950 K.
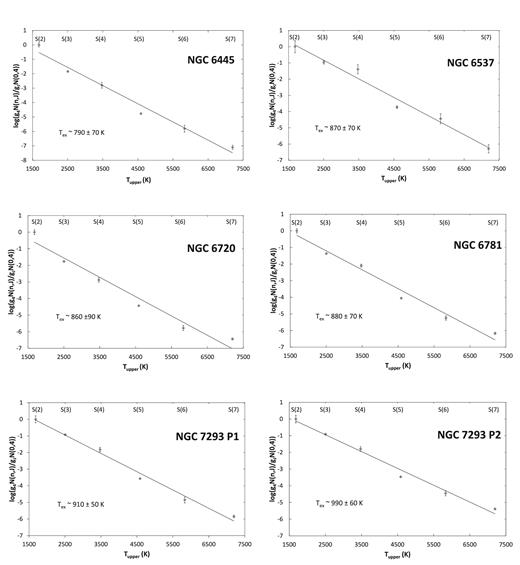
Same as Fig. 14 but for NGC 6445, NGC 6537, NGC 6720, NGC 6781, and both positions of NGC 7293.
Table 4 shows a summary of the rotational excitation temperatures obtained for each object of our survey. An average Tex(rot) of ∼900 ± 70 K was found for the objects in the survey, with no noticeable differences in temperature among the objects in our sample.
H2 rotational excitation temperatures.
| Object | Tex H2 | Ref. | Notes | |
|---|---|---|---|---|
| This work | Literature | |||
| (K) | (K) | |||
| M 2-51 | 900 ± 90 | – | – | – |
| NGC 2346 | 950 ± 110 | 1260 ± 200 | – | – |
| NGC 2440 | 830 ± 80 | 1070 ± 200 | 1 | North lobe |
| 2020 ± 200 | – | East lobe | ||
| NGC 2818 | 850 ± 50 | – | – | – |
| NGC 3132 | 900 ± 50 | – | – | – |
| NGC 6072 | 890 ± 60 | – | – | – |
| NGC 6445 | 790 ± 70 | 1520 | 2 | – |
| NGC 6537 | 870 ± 70 | 3600 | 2 | Inner region |
| NGC 6720 | 860 ± 90 | 1245 ± 100 | 1 | Ring |
| 2000 ± 200 | – | Halo | ||
| NGC 6781 | 880 ± 70 | – | – | – |
| NGC 7293 P1 | 900 ± 50 | 900 | 3 | – |
| NGC 7293 P2 | 990 ± 60 | – | – | – |
The regions covered by the slits include very different morphological features (innermost regions, envelopes, bipolar lobes) with different expansion velocities and levels of exposure to UV radiation. This excitation temperature is otherwise similar to that found in NGC 6302, using also H2 mid-IR emission lines (Matsuura & Zijlstra 2005).
5 DISCUSSION
Our analysis of archival Spitzer IRS SL1 and SL2 spectra of a sample of PNe has identified ionic transitions including [Ar iii], [Ne ii], [Ne v], and [S iv]. The detection of emission lines from species of neon and argon imply that the progenitor stars of the PNe were all at least second-generation stars. The [Ne v] is dominant in sources with hot central stars, which is an effect of the high ionizing power of their stellar spectra. This high-ionization line particularly dominates the spectra of NGC 2440, NGC 6445, and NGC 6537, with the hottest CSPN in the sample. These nebulae also present bipolar morphologies.
The decline of the [Ar iii]/[Ne ii] line ratio with stellar effective temperature may be interpreted as a true decline of the Ar/Ne abundance ratio. This may reflect the synthesis of neon during the late evolutionary stages of the progenitor stars of those PNe in our sample with a high-temperature CSPN. High-temperature CSPNs have been associated with type I PNe descending from the most massive intermediate-mass stars (Corradi & Schwarz 1995). The study of the production of α-elements in a large sample of Galactic PNe reveals that neon can indeed be produced in type I PNe (Milingo et al. 2010), but these theoretical studies do not claim a tight correlation between the production of α-elements and the initial mass of the star. Alternatively, the line ratio decline can be coupled with increasing nebular densities, resulting also from the large mass ejection and fast stellar evolution of the most massive PN progenitors.
The broad PAH feature centred at 11.30 μm is detected in a number of PNe in this sample. The feature is present in the spectra of NGC 2440, NGC 3132, NGC 6445, NGC 6537, and NGC 6781. There is a possible detection in NGC 2346, but it is absent in M 2-51, NGC 2818, NGC 6072, NGC 6720, and NGC 7293; this latter case concurs with Hora et al. (2006). The presence of this feature is typically interpreted as indicative of C–H bending (Fleming et al. 2010) after the absorption of UV photons (Leger & Puget 1984; Allamandola, Tielens & Barker 1989; Kwok 2000), as it is found to be weaker in non-C-rich PNe (Volk & Cohen 1990).
Finally, our analysis of NGC 7293 is consistent with that reported by Hora et al. (2006) regarding the absence of PAH emission. These authors argue that the PAH emission could have been missed due to the small size of the slits compared to the extension of the object. Meanwhile, Cox et al. (1998) reported that the absence of PAHs is consistent with the evolved nature of NGC 7293, having dissociated or dispersed all of its dust grains. The H2 is shock-excited, with shock velocities of a few tens of km s−1 (Hora et al. 2006).
5.1 Previous determination of H2 excitation temperatures
The H2 rotational excitation temperatures derived in this work are all in the range of 900 K. Among the nebulae in our sample, NGC 2346, NGC 2440, and NGC 6720 were included in the near-IR spectroscopic study of upper vibrational levels of the H2 molecule carried out by Hora et al. (1999). In that paper, NGC 2346 is considered to be UV-excited and an H2 rotational excitation temperature of 1260 ± 200 K is reported. This value is larger than the one reported here, 950 ± 110 K, but within the uncertainties. The temperatures derived for different regions of NGC 2440 and NGC 6720 range from 1070 ± 200 K to 2020 ± 200 K for the former and from 1245 ± 100 K to 2000 ± 200 K for the latter. Hora et al. (1999) suggest that all these regions (see Table 4) are UV excited, except probably the halo of NGC 6720. The temperatures in the north lobe of NGC 2440 and ring of NGC 6720 are consistent with our results, but not the temperatures in the hottest regions.
Other PNe with reported H2 excitation temperatures are NGC 6445 and NGC 6537 (1520 K and 3600 K, respectively, Davis et al. 2003) and NGC 7293 (900 K, Cox et al. 1998). The most discrepant temperature is that of NGC 6537, but we note that Davis et al. (2003) derived a value for the innermost nebular regions of this extremely high excitation PN, whereas the mid-IR spectrum presented here traces the outer bipolar lobes.
NGC 6781 has been reported to exhibit strong [Ar iii], [S iv], and [Ne ii] emission in the internal nebular shell, which drops off suddenly outside its borders (Phillips et al. 2011). Our study confirmed the line intensity ratios of these ionic lines, whereas the H2 excitation temperatures provided by Phillips et al. (2011) are in good agreement with the value of 880 K derived in this work.
6 SUMMARY AND CONCLUSIONS
We present an investigation of archival Spitzer IRS spectra of a sample of PNe to search for mid-IR H2 lines. Among the original sample of 14 PNe with useful Spitzer IRS SL observations known to exhibit H2 emission lines in the near-IR, 11 PNe show detectable mid-IR H2 lines. This result increases the number of known PNe with mid-IR H2 emission lines from three (NGC 6302, NGC 6781, and NGC 7293) to 12.
The spectral analysis detects all the H2 0–0 transitions from the S(2) to the S(7) lines. Among these lines, the H2 0–0 S(3) λ9.66 μm line is the brightest. The analysis of the population distribution of the H2 molecules of these PNe reveals a Tex(rot) excitation temperature of 900 K for all of them. The conspicuous uniformity of the excitation temperature is intriguing, because the observations trace different morphological features of a non-uniform sample of PNe with different morphologies and evolutionary stages. Near-IR studies are needed to confirm these excitation temperatures and to diagnose the excitation mechanism of H2 in these PNe.
Ionic lines of [Ar iii], [S iv], [Ne ii], and [Ne v] are also detected. Their line intensities show the expected positive correlation of the [Ne v]/[Ne ii] line ratio with the CSPN effective temperature. On the other hand, the anti-correlation between the [Ar iii]/[Ne ii] and the CSPN effective temperature is not expected and may imply changes in the elemental ratios that suggest that PNe with the hottest CSPN, probably descending from more massive progenitors, are able to produce neon. Alternatively, the more massive progenitors produce regions of higher density that reduce the [Ne v]/[Ne ii] line ratio.
We would like to thank an anonymous referee for several perceptive remarks. The authors thank V. Guzmán-Jiménez for her advice and insight into the cubism package. HM is grateful for CONACyT scholarship 478329/276214. GRL acknowledges support from CONACyT (grant 177864), CGCI, PROMEP, and SEP (Mexico). JAT acknowledges the support of the CSIC JAE-Pre student grant 2011-00189. JAT and MAG are supported by the Spanish MICINN (Ministerio de Ciencia e Innovación) grant AYA 2011-29754-C03-02 and AYA 2014-57280-P co-funded with FEDER funds. This research has made use of the NASA/IPAC Infrared Science Archive, which is operated by the Jet Propulsion Laboratory at the California Institute of Technology, under contract with the National Aeronautics and Space Administration. The Digitized Sky Survey images were produced at the Space Telescope Science Institute under US Government grant NAG W-2166. The images of these surveys are based on photographic data obtained using the Oschin Schmidt Telescope on Palomar Mountain and the UK Schmidt Telescope. The plates were processed into the present compressed digital form with the permission of these institutions.
This work is based on observations made with the Spitzer Space Telescope, which is operated by the Jet Propulsion Laboratory at the California Institute of Technology under a contract with NASA.
cubism, and a manual detailing its use, are available from the Spitzer Science Center at http://ssc.spitzer.caltech.edu/archanaly/contributed/cubism.
REFERENCES
