


Abstract
Open clusters (OCs) are crucial for studying the formation and evolution of the Galactic disc. However, the lack of a large number of OCs analysed homogeneously hampers the investigations about chemical patterns and the existence of Galactocentric radial and vertical gradients, or an age–metallicity relation. To overcome this, we have designed the Open Cluster Chemical Abundances from Spanish Observatories (OCCASO) survey. We aim to provide homogeneous radial velocities, physical parameters and individual chemical abundances of six or more red clump stars for a sample of 25 old and intermediate-age OCs visible from the Northern hemisphere. To do so, we use high-resolution spectroscopic facilities (R ≥ 62 000) available at Spanish observatories. We present the motivation, design and current status of the survey, together with the first data release of radial velocities for 77 stars in 12 OCs, which represents about 50 per cent of the survey. We include clusters never studied with high-resolution spectroscopy before (NGC 1907, NGC 6991, NGC 7762), and clusters in common with other large spectroscopic surveys like the Gaia-ESO Survey (NGC 6705) and Apache Point Observatory Galactic Evolution Experiment (NGC 2682 and NGC 6819). We perform internal comparisons between instruments to evaluate and correct internal systematics of the results, and compare our radial velocities with previous determinations in the literature, when available. Finally, radial velocities for each cluster are used to perform a preliminary kinematic study in relation with the Galactic disc.
1 INTRODUCTION
Discs are the defining stellar component of most of late-type galaxies, including the Milky Way. They contain a substantial fraction of the baryonic matter, angular momentum and evolutionary activity of these galaxies, such as formation of stars, spiral arms or bars, and the various forms of secular evolution (see van der Kruit & Freeman 2011, for a review). Understanding the formation and evolution of discs is, therefore, one of the key goals of galaxy formation research. Two complementary approaches are used to study the growth and evolution of galactic discs over cosmic time. The first one consists in analysing discs at different redshifts (e.g. Wisnioski et al. 2015). Although these studies are limited to global information integrated over the discs stellar populations, they are able to trace the evolution of discs properties with time. The second approach, so-called galactic archaeology, consists in reconstructing the disc evolution through resolving their stellar populations into individual stars (e.g. Carrera et al. 2011). The disc evolution is fossilized in the orbital distribution of stars, their chemical composition and ages as a function of position: i.e. in form of radial and vertical gradients. Part of this information may be diluted through dynamical evolution and radial mixing in the disc, which is less severe for clusters than for field stars. Therefore, the clusters are more suitable targets for disc studies.
The disc of our own galaxy, the Milky Way, offers an excellent test bed for investigating its evolution using all the power of the galactic archaeology approach. In spite of the great observational effort performed to unveil the details of the disc structure, these are still unknown. The vertical density profile has been characterized as a sum of two exponential components, the so-called thin and thick discs (e.g. Yoshii 1982; Gilmore & Reid 1983). Recent studies have focused on dissecting the disc into subsets of stars of very similar chemical composition, also called mono-abundance populations (e.g. Ivezić et al. 2008). These studies found that in the solar neighbourhood the vertical structure is composed of a smooth continuum of disc thicknesses (e.g. Bovy, Rix & Hogg 2012). However, the stellar disc population shows a clear bimodal distribution in ([Fe/H], [α/Fe]) with two sequences of high- and low-[α/Fe] (Adibekyan et al. 2012; Nidever et al. 2014). The high-[α/Fe] is more prominent in the inner disc, while the low-[α/Fe], and in particular its metal-poor end, dominates in the outer disc. Eggen, Lynden-Bell & Sandage (1962) suggested the possibility that the stellar disc formed ‘upside-down’ in the sense that old stars were formed in a relatively thick component, or are kinematically heated very quickly after their birth, while younger populations form in successively thinner discs. It has been thought for a long time that the vertical distribution of the disc is the result of some type of heating either due to satellite mergers (e.g. Abadi et al. 2003) or radial migration (e.g. Sellwood & Binney 2002). However, late results (e.g. Bird et al. 2013) point to a scenario similar to the early suggestion by Eggen et al. (1962).
The radial structure of the Galactic disc has been investigated using different tracers trying to cover as much Galactocentric distances as possible. Some of these tracers are H ii regions (e.g. Balser et al. 2011), B-type stars (e.g. Daflon et al. 2009), Cepheid variables (e.g. Andrievsky et al. 2013; Lemasle et al. 2013; Korotin et al. 2014; Genovali et al. 2015), planetary nebulae (e.g. Stanghellini & Haywood 2010) or open clusters (OCs, see below) and also main-sequence (e.g. Nordström et al. 2004; Cheng et al. 2012; Mikolaitis et al. 2014) or giant field populations (e.g. Hayden et al. 2014; Huang et al. 2015). Although all of them agree on the existence of a radial metallicity gradient in the sense that stellar populations are richer towards the inner disc, there are discrepancies about how this gradient behaves. While the radial gradient described by OCs flattens at large Galactocentric distances (e.g. Carrera & Pancino 2011; Frinchaboy et al. 2013), the Cepheids do not show a slope change in the outer disc (e.g. Lemasle et al. 2013). These discrepancies can be partially explained by the fact that each tracer is representative of stellar populations of different age. Until the recent arrival of large Galactic surveys, most of the studies were limited by the small sample size. The current large surveys are also hampered by the lack of accurate distances. This issue will be improved significantly in the near future by the advent of Gaia space mission data (see Section 1.1).
In comparison with other tracers, some of the OC properties, such as distances or ages, can be accurately determined (see Friel 1995, for a review). In fact, most stars, including the Sun, are formed in stellar clusters although most of them are dissolved in the first few Myr (e.g. Portegies Zwart, McMillan & Gieles 2010). Those that survive are the more massive OCs or those that have had less encounters, which contain the fossil record of the disc formation. Moreover, OCs cover a wide range of age that also allows one to study the evolution of the disc with time (e.g. Carrera & Pancino 2011; Frinchaboy et al. 2013). The number of clusters old enough (≳250 Myr) for such a study will be increased with Gaia observations making this kind of studies even more promising.
For all these reasons, OCs have been used for a long time to investigate the Galactic disc, starting from the pioneering studies by Janes (1979) and Panagia & Tosi (1980). A review of the early Galactic disc studies using OCs as tracers can be found in Friel (1995). A great observational effort has been performed to characterize OCs homogeneously (e.g. Friel et al. 2002; Bragaglia & Tosi 2006; Sestito et al. 2008; Friel, Jacobson & Pilachowski 2010; Donati et al. 2015) and/or to increase the observed samples (e.g. Twarog, Ashman & Anthony-Twarog 1997; Carrera & Pancino 2011; Jacobson, Friel & Pilachowski 2011a; Jacobson, Pilachowski & Friel 2011b). All these investigations agree on the fact that the iron content decreases with increasing radius as has been found using other tracers (e.g. Lemasle et al. 2013). Most of the previously cited works were limited to the inner 15 kpc. However, investigations based on samples containing clusters at larger Galactocentric distances (e.g. Carrera & Pancino 2011; Yong, Carney & Friel 2012; Frinchaboy et al. 2013) found that the gradient appears to flatten from a radius of about 12 kpc, which is near the dynamical signature for Galactic corotation (Lépine et al. 2011). Moreover, it seems that the metallicity gradient observed in the inner disc was steeper in the past and has flattened with time (Carrera & Pancino 2011; Jacobson et al. 2011b; Yong et al. 2012; Frinchaboy et al. 2013), as it is seen in M33 (Beasley et al. 2015). No significant trends with radius have been observed in the abundances of other chemical species (e.g. Yong et al. 2012).
1.1 OCCASO in the context of large surveys
Our understanding of the Milky Way in general and the Galactic disc in particular is going to change significantly in the next years with the Gaia space mission (Perryman et al. 2001; Lindegren 2005; Mignard 2005). Gaia is a full-sky scanning satellite observing all stars down to 20th magnitude with precisions at the μas level. Parallaxes and proper motions of individual stars will be as precise as 1 per cent for the OCs up to a distance of 1.5 kpc, and 10 per cent for almost all known clusters. Importantly, the faint limiting magnitude and the high precision will allow the discovery of distant clusters. However, spectroscopic capabilities to derive chemical abundances are limited due to the low resolution and the small wavelength coverage of the Gaia Radial Velocity Spectrometer.
On the other hand, the Kepler space mission and its extension K2 is providing asteroseismic data with unprecedented detail, which will allow one to quantify global properties of stars such as age, mass and radii to accuracies near 1 per cent (Gilliland et al. 2010). It is targeting solar-like stars, red giants, classical pulsating stars and oscillating stars in binaries and clusters. The advantages of asteroseismology for clusters are that, unlike estimates of colours and magnitudes, seismic data do not suffer from uncertainties in distance or extinction and reddening. Asteroseismic observations of many stars allow testing stellar evolution theory and provide important constraints on the ages and chemical compositions of stars. K2 data (Howell et al. 2014) is particularly interesting because it covers a wider area and more clusters than the original Kepler field.
The Gaia and Kepler space observations are being complemented with several ongoing and forthcoming ground-based spectroscopic surveys. Low- and medium-resolution spectroscopic surveys (R < 10 000), such as the RAdial Velocity Experiment (Conrad et al. 2014), the Sloan Extension for Galactic Understanding and Exploration (Lee et al. 2008) and Large Sky Area Multi-Object Fiber Spectroscopic Telescope (Li et al. 2015) survey, provide radial velocities, together with rough information about the chemical content of the studied stars. Large high-resolution spectroscopic surveys (R ≳ 20 000) such as the ongoing Apache Point Observatory Galactic Evolution Experiment (APOGEE; Frinchaboy et al. 2013), the Gaia-ESO Survey (GES; Gilmore et al. 2012; Randich, Gilmore & Gaia-ESO Consortium 2013), the GALactic Archaeology with HERMES (GALAH; De Silva et al. 2015) and the forthcoming WEAVE (Dalton et al. 2012) provide detailed information about the chemical composition, in addition to radial velocities.
However, most of the large high-resolution spectroscopic surveys do not have dedicated observations of OCs. Except for a few systems observed for calibration purposes, OC stars are targeted only when they fall in the field of view of other targets. This means that the results for most of the studied clusters are based on observations of one or two members only. Currently, APOGEE is the only survey sampling the Northern hemisphere. GES and GALAH are operating in the South, and WEAVE has not yet defined the observations of OCs and will not start operations until at least 2017. APOGEE is obtaining high-resolution (R ∼ 22 500) spectra in the infrared H band, which allows one to sample the innermost regions of the Galaxy. However, it is sampling OC stars at any evolutionary stage and it is not observing a minimum of stars in each cluster. In fact, six or more cluster members have been analysed only in seven of the OCs observed for calibration purposes. This makes detailed studies of the Milky Way OCs using APOGEE data difficult.
There are other long-term projects dedicated to the study of the OCs. The Bologna Open Cluster Chemical Evolution project (Bragaglia & Tosi 2006) uses both colour–magnitude diagram (CMD) synthesis and high-resolution spectra to infer cluster properties such as age, distance and chemical composition. The WIYN Open Cluster Study (von Hippel & Sarajedini 1998) is also obtaining photometry, astrometric and spectroscopic data for few nearby OCs. However, these surveys have been designed to study each cluster individually and not to provide a sample of OCs to constrain the chemical evolution of the Galactic disc.
Therefore, GES is the only large survey that has a programme particularly designed to study the existence of trends in the Galactic disc. GES is designed to use the FLAMES capabilities (GIRAFFE+UVES; Pasquini et al. 2002) at the second VLT unit in order to complement the Gaia mission. GES cluster observations include 20–25 OCs older than 0.5 Gyr. For them, GES is using the GIRAFFE fibres to derive radial velocities and chemical abundances in stars at any evolutionary stage brighter than V ∼ 19 with a resolution R ∼ 20 000. The six UVES fibres, which cover a wavelength range between 4800 and 7000 Å with a resolution of 47 000, are being used to measure accurate radial velocities and detailed chemical abundances for the brightest targets, mostly red clump (RC) stars. The UVES observations of old OCs have been designed to obtain a homogeneous sample of chemical abundances to study the Galactic disc. Using stars in the same evolutionary stage avoids the blurring of the trends due to chemical inhomogeneities produced by stellar nucleosynthesis itself, and ensures the homogeneity of the sample.
Several key OCs such as the most metal-rich, NGC 6791, and the oldest, Berkeley 17, together with several systems towards the Galactic anticentre or those observed by the Kepler mission are only visible from the North, thus will not be observed by GES.
The Open Cluster Chemical Abundances from Spanish Observatories (OCCASO) survey has been designed to overcome many of the above caveats. It will obtain accurate radial velocities and chemical abundances for more than 20 chemical species from high-resolution spectra (R ≥ 62 000) in Northern OCs using the facilities available at Spanish observatories. As such, it is a natural complement to the GES observations from the South and the Gaia mission from space. The goal of this paper is to present the survey, its observations, data reduction and analysis strategies. We also give a detailed analysis of the radial velocities for the first batch of observations.
The general survey strategy is described in Section 2. More in detail: science drivers of the survey (Section 2.1) criteria used to select the cluster sample (Section 2.2), observational facilities used (Section 2.3), observational strategy (Section 2.4) and data reduction procedure (Section 2.5). The first data release is described in Section 3, which includes the description of the observational material (Section 3.1), the accuracy on the wavelength calibration (Section 3.2) and the results on the radial velocities (Section 3.3). Finally, an external comparison of the stars in common with previous works is done in Section 3.4, and a discussion of the results based on the kinematics of the disc and spiral arms is presented in Section 3.5. A summary is provided in Section 4.
2 THE OCCASO SURVEY
2.1 OCCASO science drivers
As discussed in the previous section, the main OCCASO science driver is the study of the chemical evolution of the Galactic disc. Therefore, the observations and analysis strategies have been optimized for this purpose. However, the OCCASO observational data and results can contribute to our understanding of other astrophysical questions. Here we summarize some of these additional science topics that can be addressed with OCCASO.
Galactic disc kinematics. The same reasons that make OCs good chemical tracers of the Galactic disc justify their use as tracers to investigate the Galaxy dynamics. The rotation curve described by OCs is similar to that derived from other thin disc populations such as Cepheids, H ii regions or molecular clouds (e.g. Hron 1987; Scott, Friel & Janes 1995; Glushkova et al. 1998; Friel et al. 2002). It seems that the rotational velocity gradually decreases with age. This is accompanied by a smooth increase of the line-of-sight velocity dispersion (Hayes & Friel 2014). However, there are several OCs with unusual kinematics that keep them away from the disc or the inner regions of the Galaxy. It has been suggested that several OCs in the outer disc could have been accreted during a dwarf galaxy merger. In this sense, two OCs Saurer 1 and Berkeley 29 have been related to the Galactic anticentre stellar structure, also known as Monoceros stream (Frinchaboy et al. 2006). An extragalactic origin has also been proposed for the most metal-rich known OC, NGC 6791 (Carraro et al. 2006). However, accurate proper motions derived from Hubble Space Telescope data suggest that this cluster was formed near the Galactic bulge (Bedin et al. 2006). In addition to the chemical abundances, OCCASO will provide radial velocities for observed stars with uncertainties of about 0.5 km s−1 (see Section 3.3). These radial velocities together with the proper motions provided by the Gaia mission will allow us to study the three-dimensional kinematics of the OCs, trace their orbits and relate them to the spiral structure of the Galactic disc.
Stellar evolution laboratories. OCs have been widely used to check the applicability of stellar evolutionary models and the validity of their physical parameters and prescriptions such as convective overshooting (e.g. Pietrinferni et al. 2004) and rotation (e.g. Carlberg 2014; Lanzafame & Spada 2015). In spite of the progress performed in last years, current evolutionary models are not able to completely reproduce the CMDs of many OCs independently of their metallicities (e.g. Ahumada et al. 2013). A possible explanation could be that each cluster has different abundance ratios (Gallart, Zoccali & Aparicio 2005). Stellar evolutionary models for different chemical compositions besides the iron and α-elements have not been available until very recently (e.g. VandenBerg et al. 2012). The chemical abundances provided by OCCASO will help to constrain the parameters of such.
OCCASO could also contribute in the understanding of a variety of topics such as the study of the internal dynamics of old (highly evolved) OCs (e.g. Bonatto & Bica 2003; Davenport & Sandquist 2010), and the detection of signs of the existence of multiple stellar populations (Carrera 2012b; Geisler et al. 2012; Cunha et al. 2015). However, the small number of stars sampled in each cluster makes these kind of studies from OCCASO data only difficult.
2.2 Cluster and star selection
We select OCs to observe in OCCASO according to the following criteria:
Visible from the Northern hemisphere.
Ages ≳0.3 Gyr, since intermediate-age and old OCs are excellent probes of the structure and chemo-dynamical evolution of the Galactic disc.
With six or more stars in the expected position of the RC area of the CMD.1 In general, RC stars are clearly identified even in sparsely populated CMDs. In some cases, however, it is not easy to differentiate an RC star from a red giant branch (RGB) star in OCs, so for simplicity we refer them as RC from now on. Selecting RGB stars instead of RC would not imply abundance changes except maybe for light elements, e.g. C or N. Spectra from these kinds of stars are less line-crowded and therefore easier to analyse than those of the brighter giants. Moreover, targeting objects in the same evolutionary state avoids measuring distinct abundances for some elements due to effects of stellar evolution. The requirement of six stars has been chosen to have reasonable statistics for the chemical abundances of each cluster.
With RC magnitude brighter than V ∼ 15 mag, constrained by the available instruments/telescopes.
Prioritizing those with ages, metallicities, heights from the plane or Galactocentric distances lying in poorly studied regions of the RGC–[Fe/H], Age–[Fe/H], z–[Fe/H] diagrams. In this way, we will improve the sampling homogeneity of the Galactic disc.
Some clusters with previous high-resolution studies in the literature (e.g. Bragaglia & Tosi 2006; Carrera & Pancino 2011; Carrera 2012a), and OCs selected in other surveys (GES, APOGEE) for comparison purposes.
Following the outlined criteria, we selected a list of 25 candidate OCs, distributed in the RGC–[Fe/H], Age–[Fe/H], z–[Fe/H] diagrams as seen in Fig. 1. This paper focuses on the first 12 OCs for which observations were completed by 2015 January. Some basic properties of these clusters are listed in Table 1, and they are represented as red squares in Fig. 1.
![[Fe/H] as a function of |z|, RGC and Age. Grey dots correspond to the high-resolution data of OCs compiled by Carrera & Pancino (2011). Black dots are the full sample of 25 OCs within OCCASO. Red squares are the 12 OCs released in this paper. Solid lines in the middle panel show the linear fit for OCs inwards and outwards of RGC = 12.5 kpc.](https://oup.silverchair-cdn.com/oup/backfile/Content_public/Journal/mnras/458/3/10.1093_mnras_stw518/2/m_stw518fig1.jpeg?Expires=1749850712&Signature=A3V2KvcVhQ6d4p~fftDO3p8GZG2dlX4rUg9E9XodfXpZxf1rn9RMFIfOFjMuuj9o5HjsIHUnKVBqrsGXF76d7IR6Qw-xTLec~Atf9bPODDo57K33XCFT9fG7cQYyNBAzu7o13l9KvvurMvUEyjJopxyuJN3bQhYlLZmydrh-04zKnQYa7XGkDiUJpZ0u30d4zAhAQsVo58eWgPxxJuvu4Uv33fv55FwuE6QL60StKXgDcPqjeG8jIxuK2pfEAD3IJrl6gkInqhmSs3ZDWVH9e6pkRE6iy~Sq9WtTUk9S0VpSm21r8iICyk3AIDL0PD9~jMSTJf7Pmfd5Oppry3FfSg__&Key-Pair-Id=APKAIE5G5CRDK6RD3PGA)
[Fe/H] as a function of |z|, RGC and Age. Grey dots correspond to the high-resolution data of OCs compiled by Carrera & Pancino (2011). Black dots are the full sample of 25 OCs within OCCASO. Red squares are the 12 OCs released in this paper. Solid lines in the middle panel show the linear fit for OCs inwards and outwards of RGC = 12.5 kpc.
Completed clusters of OCCASO by the end of 2015 January. D, RGC, z and Age are from Dias et al. (2002). We list the V magnitude of the RC and the number of stars observed in the last two columns. The photometry used to select the stars in each OC is indicated as a footnote.
| Cluster | D | RGC | z | Age | VRC | Stars |
|---|---|---|---|---|---|---|
| (kpc) | (kpc) | (pc) | (Gyr) | |||
| IC 47561 | 0.48 | 8.14 | +41 | 0.50 | 9 | 7 |
| NGC 7522 | 0.46 | 8.80 | −160 | 1.12 | 9 | 7 |
| NGC 19073 | 1.80 | 10.24 | +9 | 0.31 | 9 | 6 |
| NGC 20994 | 1.38 | 9.87 | +74 | 0.34 | 12 | 7 |
| NGC 25395 | 1.36 | 9.37 | +250 | 0.37 | 11 | 6 |
| NGC 26826 | 0.81 | 9.16 | +426 | 2.81 | 10.5 | 8 |
| NGC 66337 | 0.38 | 8.20 | +54 | 0.42 | 8.5 | 4a |
| NGC 67058 | 1.88 | 6.83 | −90 | 0.25 | 11.5 | 7 |
| NGC 68199 | 2.51 | 7.81 | +370 | 2.39 | 13 | 6 |
| NGC 699110 | 0.70 | 8.47 | +19 | 1.28 | 10 | 6 |
| NGC 776211 | 0.78 | 8.86 | +79 | 1.99 | 12.5 | 6 |
| NGC 778912 | 1.80 | 9.27 | −168 | 1.41 | 13 | 7 |
1 Alcaino (1965); 2Johnson (1953); 3Pandey et al. (2007); 4Kiss et al. (2001); 5Choo et al. (2003); 6Montgomery, Marschall & Janes (1993); 7Harmer et al. (2001); 8Sung et al. (1999); 9Rosvick & Vandenberg (1998); 10Kharchenko et al. (2005); 11Maciejewski & Niedzielski (2007); 12Mochejska & Kaluzny (1999); McNamara & Solomon (1981).
aIt has only four stars in the RC but was included for observation in a night with non-optimal weather conditions.
To select individual stars within each cluster, we use the available literature information, with the following procedure:
(a) the targets are first selected among the stars located in the expected position of the RC in the CMD from the available photometries (see Fig. 2);
(b) membership information based on radial velocities and proper motions, if available, is taken into account (see Table 6);
(c) stars already flagged as non-members or spectroscopic binaries are avoided.

In some cases where membership information is not available (poor photometry, no prior information about radial velocities or proper motions), we acquire complementary medium-resolution spectroscopy. The strategy is to obtain radial velocities and overall metallicities for a large selection of objects in the line of sight of the cluster, to constrain the selection of members (see Carrera et al. 2015, for further details).
2.3 Observational facilities
There is no easy access for the European community to a spectrograph with similar multi-object capabilities as UVES, in the Northern hemisphere. However, at Spanish observatories there are several echelle high-resolution spectrographs available with resolutions and wavelength coverage ranges similar to, or larger than, UVES. In particular, for OCCASO we have selected: CAFE at the 2.2 m telescope in the Centro Astronómico Hispano-Alemán (CAHA), FIES at the 2.5 m NOT telescope in the Observatorio del Roque de los Muchachos (ORM) and HERMES at the 1.2 m Mercator telescope also in the ORM. See Table 2 for a summary of the instrument characteristics.
Characteristics of the instruments and telescopes used for the OCCASO survey.
| Telescope/instrument | Diameter | Spectral range | Resolution |
|---|---|---|---|
| NOT/FIES | 2.5 m | 3700–7300 Å | 67 000 |
| Mercator/HERMES | 1.2 m | 3770–9000 Å | 85 000 |
| 2.2 mCAHA/CAFE | 2.2 m | 3900–9500 Å | 62 000 |
| Telescope/instrument | Diameter | Spectral range | Resolution |
|---|---|---|---|
| NOT/FIES | 2.5 m | 3700–7300 Å | 67 000 |
| Mercator/HERMES | 1.2 m | 3770–9000 Å | 85 000 |
| 2.2 mCAHA/CAFE | 2.2 m | 3900–9500 Å | 62 000 |
The high-resolution Fibre-fed Echelle Spectrograph (FIES; Telting et al. 2014) is a cross-dispersed echelle spectrograph mounted at the 2.5 m Nordic Optical Telescope (NOT), and located in the ORM in the island of La Palma (Spain). FIES is mounted in a heavily isolated building separated from the NOT building. It is connected to the Cassegrain focus of the telescope with a fibre bundle offering a maximum resolution of R ∼ 67 000. The wavelength coverage of the output spectra is 3700–7300 Å without gaps.
The High Efficiency and Resolution Mercator Echelle Spectrograph (HERMES; Raskin et al. 2011) is a fibre-fed prism-cross-dispersed echelle spectrograph at the 1.2 Mercator telescope, located in the ORM as well. It is mounted in a temperature-controlled room and fibre-fed from the Nasmyth A focal station through an atmospheric dispersion corrector. The size of the detector enables a coverage of the 3770–9000 Å wavelength range, with a maximum resolution of R ∼ 85 000.
The Calar Alto Fiber-fed Echelle spectrograph (CAFE; Aceituno et al. 2013) is an instrument constructed at the 2.2 m telescope in the CAHA in Calar Alto, Almería (Spain). CAFE is installed in a temperature- and vibration-controlled room. It offers a maximum resolution of R ∼ 62 000, and a spectral coverage of 3900–9500 Å.
Since only one star can be observed at once in each of the spectrographs, we distribute our observations among the three different telescopes/instruments according to the magnitude of the stars. This allows us to develop OCCASO on a timeline similar to GES. The brightest targets (V ≤ 13) are assigned to HERMES@Mercator, and the faintest stars (V > 13) are assigned mainly to FIES@NOT and [email protected] m CAHA. Current efficiency of CAFE is lower than expected, and all the faint stars were finally moved to FIES.
2.4 Observational strategy
All stars are observed in at least three exposures lasting 80–3600 s, depending on their magnitude, until a global signal-to-noise ratio (SNR) of at least 70 per pixel at λ ∼ 6000 Å is reached. For the faintest targets (V ≥ 14), this condition is relaxed to an SNR ∼50. In each run, we take a sky exposure to subtract the sky emission lines and, when relevant, the sky background level (see Section 2.5). Hot, rapidly rotating stars were observed twice per run to remove sky absorption features, like telluric bands of O2 and H2O. Standard calibration images (flat, bias and arcs) were also taken at the beginning and end of each night. In general, we assign each cluster to one instrument to maximize the precision in our measurements. In order to guarantee the homogeneity of our whole sample, at the beginning of the survey we have repeated observations of a set of few stars with the three instruments. Additionally, Arcturus (α-Bootes) and μ-Leonis, two extensively studied stars, part of the Gaia Benchmark stars (Blanco-Cuaresma et al. 2014; Jofré et al. 2014; Heiter et al. 2015) and the APOGEE reference stars (Smith et al. 2013), were observed with the three telescopes for the sake of comparison. We distribute the target stars among the observing runs (see Section 3.1) taking into account their magnitudes, the quality of the nights and the characteristics of the instruments.
2.5 Data reduction
The first part of the data reduction consists in bias subtraction, flat-field normalization, order tracing and extraction, wavelength calibration and order merge. This step is performed with the dedicated pipelines for each instrument: HERMESDRS for HERMES@Mercator (Raskin et al. 2011), FIESTool for FIES@NOT (Telting et al. 2014), and the pipeline developed by J. Maíz-Apellániz for [email protected] m CAHA, and used in Negueruela (2014). We have checked that the results from the pipelines are appropriate: the spectra are correctly extracted, calibration in λ is realistic and the merging of the orders does not introduce artefacts and defects in the regions were orders overlap. The useful range from CAFE spectra is taken as 4500–9000 Å to avoid saturated telluric lines and other instrumental defects at the red and blue edges. We take the whole wavelength ranges for HERMES and FIES.
After these initial steps of reduction, the spectra from the three instruments are handled in the same way. The established reduction protocol consists in the following.
Subtraction of sky emission lines using sky exposures. It was only applied to those cases where the levels of the skylines were higher than 3 per cent of the continuum, to avoid adding noise to the spectra.
Normalization by fitting the continuum with a polynomial function and radial velocity determination of the individual spectra using daospec (Stetson & Pancino 2008, see details in Section 3.3).
Correction of telluric features using the iraf2 task telluric. To do so, we acquire one or two exposures of a hot, rapidly rotating star (among HR551, HR7235, HR2198, HR8762 or HR3982, taking into account visibility) in each run. The strong O2 band around 7600 Å in HERMES and CAFE spectra is saturated and cannot be removed properly.
Heliocentric correction to account for observer's motion is obtained with the iraf task rvcorrect.
The accuracy of the wavelength calibration is tested through the measurement of the radial velocity of sky emission lines. For each run, we measure the radial velocities of the skylines: 6300.304, 6363.78, 6863.95, 7276.405, 7913.708, 8344.602 and 8827.096 Å when visible, in all sky exposures and/or in target star exposures before applying the heliocentric correction. The obtained offset, if any, is used to correct the individual exposures with the iraf task dopcor (see Section 3.2).
Combination of the single normalized spectra of the same star and telescope. We use the iraf task scombine with a median algorithm and a sigma-clipping rejection. This aims to reach the maximum SNR for final radial velocity determination and further abundance analysis.
Final radial velocity determination and normalization of the combined spectra using daospec.
As an example of the results of the reduction protocol, we show three regions of the combined and normalized spectrum of the star NGC 2682 W141 in Fig. 3.
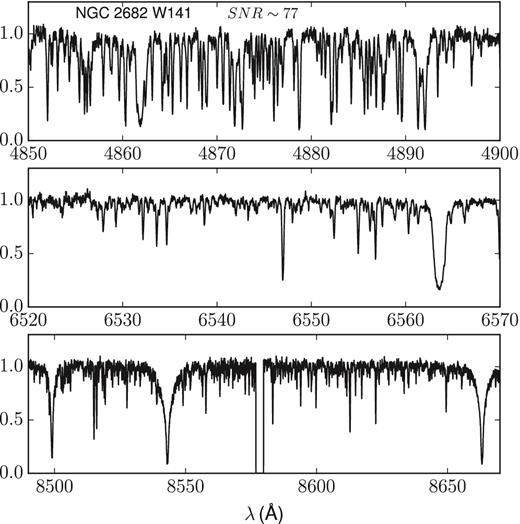
The Ca triplet (bottom), Hα (middle) and Hβ (top) regions of the final combined and normalized spectrum of the star NGC 2682 W141 observed with HERMES (SNR ∼ 77). A small gap from the order merging can be seen around 8580 Å.
3 OCCASO FIRST DATA RELEASE: RADIAL VELOCITIES
In this section, we present the radial velocities obtained from the reduced spectra acquired until 2015 January for the completed clusters.
3.1 Observational material
OCCASO observations started in 2013 January. Until 2015 January, we have completed a total of 53 nights of observations. The number of nights, dates and instrument of each run are summarized in Table 3 together with the percentage of time lost due to bad weather, and a description of the quality of the sky.
Runs devoted to the project that are included in this paper.
| Run | Period | Instrument | No. of | Time | Qa |
|---|---|---|---|---|---|
| nights | lost | ||||
| 1 | 1–2 Apr 2013 | FIES | 2 | 50 per cent | 2 |
| 2 | 25–29 July 2013 | HERMES | 5 | 0 per cent | 1 |
| 3 | 23–25 Sept 2013 | FIES | 3 | 50 per cent | 2 |
| 4 | 1–6 Oct 2013 | HERMES | 5 | 30 per cent | 1 |
| 5 | 25–29 Nov 2013 | FIES | 5 | 40 per cent | 2 |
| 6 | 3–7 Jan 2014 | CAFE | 5 | 100 per cent | 3 |
| 7 | 26 Jan 2014b | FIES | 1 | 0 per cent | 2 |
| 8 | 29–30 Jan 2014 | CAFE | 2 | 100 per cent | 3 |
| 9 | 21–25 May 2014 | HERMES | 5 | 15 per cent | 1 |
| 10 | 14–15 July 2014 | CAFE | 2 | 0 per cent | 2 |
| 11 | 6–8/10–11 Sept 2014 | FIES | 5 | 10 per cent | 2 |
| 12 | 7–11 Oct 2014 | FIES | 5 | 25 per cent | 1 |
| 13 | 18–22 Dec 2014 | HERMES | 5 | 15 per cent | 1 |
| 14 | 1–3 Jan 2015 | CAFE | 3 | 0 per cent | 1 |
aQuality of the night – 1: good seeing (<1 arcsec), no clouds; 2: medium seeing (1–2 arcsec), disperse thin clouds, low dust, we were forced to observe stars 1–2 mag brighter than expected; 3: bad seeing (>2 arcsec), clouds, no observations.
bShared period, only a fraction of the night was used for this project.
In this period, we have finished observations of 12 clusters which comprise a total of 77 stars (401 spectra), together with Arcturus and μ-Leo used for comparison purposes. For these clusters, we have achieved the initial requirement of observing at least six stars per cluster with an SNR ∼70.
3.2 Wavelength calibration accuracy
The wavelength calibration accuracy is key for the radial velocity determination. To re-assess it, we calculate the radial velocity offsets of sky emission lines as described in Section 2.5. The mean values and standard deviations of the radial velocity offsets are listed in Table 4. We can conclude the following.
All FIES runs have negligible offset except for run#1, for which it has a value of 5.09 ± 0.44 km s−1. The pipeline could not be run in the telescope during the observing run, and it was run a posteriori using a version built to be used outside the NOT. The origin of the offset could be related to the use of inappropriate calibration images when running the pipeline. We have corrected the individual spectra of this run using this value.
Table 4.Mean radial velocity offsets and standard deviations for each run (number as in Table 3) from visible skylines in the spectra (see the text for more details).
Run Instrument vr (km s−1) No. of measured lines 1 FIES 5.09 ± 0.44 9 3 FIES 0.09 ± 0.26 5 5 FIES 0.07 ± 0.24 6 7 FIES − 0.04 ± 0.17 7 11 FIES − 0.5 ± 0.7 6 12 FIES 0.00 ± 0.19 7 2 HERMES − 0.16 ± 0.28 9 4 HERMES − 0.26 ± 0.77 7 9 HERMES − 0.42 ± 0.72 7 13 HERMES − 0.29 ± 0.89 7 10 CAFE 2.45 ± 0.52 6 14 CAFE 2.64 ± 0.72 7 Run Instrument vr (km s−1) No. of measured lines 1 FIES 5.09 ± 0.44 9 3 FIES 0.09 ± 0.26 5 5 FIES 0.07 ± 0.24 6 7 FIES − 0.04 ± 0.17 7 11 FIES − 0.5 ± 0.7 6 12 FIES 0.00 ± 0.19 7 2 HERMES − 0.16 ± 0.28 9 4 HERMES − 0.26 ± 0.77 7 9 HERMES − 0.42 ± 0.72 7 13 HERMES − 0.29 ± 0.89 7 10 CAFE 2.45 ± 0.52 6 14 CAFE 2.64 ± 0.72 7 Table 4.Mean radial velocity offsets and standard deviations for each run (number as in Table 3) from visible skylines in the spectra (see the text for more details).
Run Instrument vr (km s−1) No. of measured lines 1 FIES 5.09 ± 0.44 9 3 FIES 0.09 ± 0.26 5 5 FIES 0.07 ± 0.24 6 7 FIES − 0.04 ± 0.17 7 11 FIES − 0.5 ± 0.7 6 12 FIES 0.00 ± 0.19 7 2 HERMES − 0.16 ± 0.28 9 4 HERMES − 0.26 ± 0.77 7 9 HERMES − 0.42 ± 0.72 7 13 HERMES − 0.29 ± 0.89 7 10 CAFE 2.45 ± 0.52 6 14 CAFE 2.64 ± 0.72 7 Run Instrument vr (km s−1) No. of measured lines 1 FIES 5.09 ± 0.44 9 3 FIES 0.09 ± 0.26 5 5 FIES 0.07 ± 0.24 6 7 FIES − 0.04 ± 0.17 7 11 FIES − 0.5 ± 0.7 6 12 FIES 0.00 ± 0.19 7 2 HERMES − 0.16 ± 0.28 9 4 HERMES − 0.26 ± 0.77 7 9 HERMES − 0.42 ± 0.72 7 13 HERMES − 0.29 ± 0.89 7 10 CAFE 2.45 ± 0.52 6 14 CAFE 2.64 ± 0.72 7 All HERMES offsets are compatible with 0 km s−1 within the errors. The mean value is −0.28 ± 0.11 km s−1. This offset can be neglected given the spectral resolution of the instrument.
Both runs from CAFE present a roughly constant offset of unknown origin, with a mean value and standard deviation of 2.55 ± 0.62 km s−1. We have shifted all the spectra from these runs by −2.55 km s−1.
3.3 Radial velocities
We present here the results of the radial velocities for stars in the 12 completed clusters (77 stars), and the reference stars Arcturus and μ-Leo. This is a total of 79 stars from which 17 have repeated observations with more than one telescope: 25 were observed with FIES@NOT, 66 were observed with HERMES@Mercator and 11 were observed with [email protected] m CAHA.
All radial velocities are measured using daospec (Stetson & Pancino 2008). daospec is a fortran code that finds absorption lines in a stellar spectrum, fits the continuum, identifies lines from a provided linelist and measures equivalent widths (EWs). daospec also provides radial velocity estimates using a cross-correlation procedure based on the line centres and on their reference laboratory wavelength in the linelist (i.e. a sort of line mask cross-correlation). To run daospec, we used the doop code (Cantat-Gaudin et al. 2014a), an algorithm that optimizes its most critical parameters in order to obtain the best measurements of EWs. In brief, it fine tunes the full width at half-maximum and the continuum placement among other parameters, through a fully automatic and iterative procedure.
We built our linelist starting from the public GES linelist version 3, which contains 47 098 lines. However, this linelist goes from 4700 < λ < 6800 Å and our covered spectral range is much wider. Therefore, we extended our linelist redder than 6800 Å using the linelist described in Pancino et al. (2010). The final linelist has 1400 lines, from which ∼1000 (after a sigma-clipping rejection criteria) are used for the radial velocities. Further details will be provided in Casamiquela et al. (in preparation), where we will release the linelist together with the physical parameters and individual abundance determinations from OCCASO.
We compute radial velocities from both individual and combined exposures for each star, as mentioned in Section 2.5. Using the combined exposures, we perform a comparison among the three instruments, and we compute the final values per star. We perform a membership selection after which we compute the average radial velocity for each of the 12 clusters. Details are given in the following subsections.
3.3.1 Individual exposures
We measure radial velocities from individual exposures after rectifying the offsets calculated in Section 3.2, and once heliocentric corrections are applied. The values obtained are listed in Table 5. The first, second and third columns denote the star identifier (taken from WEBDA3), night of observation and instrument, respectively; the fourth column indicates the Heliocentric Julian Date (HJD) of the observation; and the fifth column lists the measured radial velocity and the uncertainty. The quoted uncertainties are those calculated by daospec, which correspond to the line-by-line radial velocity variance.
Radial velocities from individual spectra. The complete version of the table can be found in the electronic version of the journal, and in the CDS.
| Star | Night | Instrument | HJD | vr, indiv |
|---|---|---|---|---|
| (km s−1) | ||||
| IC4756 W0042 | 2013-07-29 | HERMES | 2456503.42986657 | −24.7 ± 0.6 |
| IC4756 W0042 | 2013-07-29 | HERMES | 2456503.4350752 | −24.7 ± 0.6 |
| IC4756 W0042 | 2013-07-29 | HERMES | 2456503.44028436 | −24.7 ± 0.6 |
| IC4756 W0042 | 2014-05-21 | HERMES | 2456799.71796826 | −24.5 ± 0.7 |
| IC4756 W0042 | 2014-05-21 | HERMES | 2456799.72317693 | −24.5 ± 0.7 |
The uncertainties on the individual radial velocities are constrained by the resolution and wavelength range (which limits the number of lines used) of the instrument, and the SNR of the spectrum. The distribution of uncertainties is shown in Fig. 4, with median values of 0.6 ± 0.1 km s−1 for FIES, 0.8 ± 0.4 km s−1 for HERMES and 1.2 ± 0.3 km s−1 for CAFE.
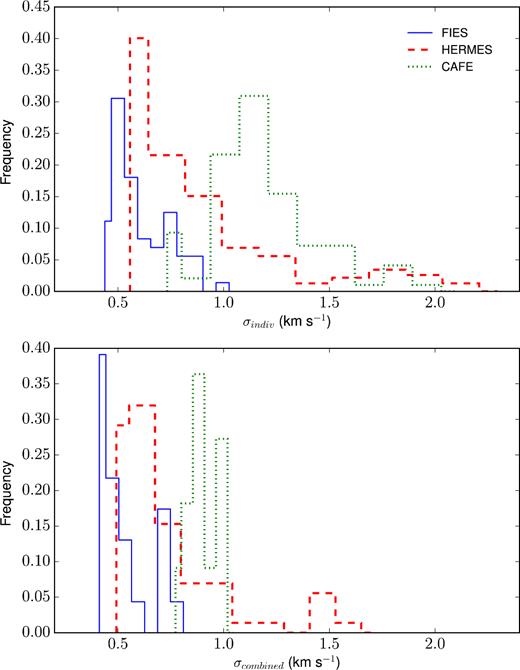
Radial velocity uncertainty distributions from the individual spectra (top panel), and the combined spectra (bottom panel), for each instrument. The histograms are scaled to facilitate the visualization.
Although our observations are not designed to look for spectroscopic binaries,4 we can detect them by comparing the radial velocity obtained from different exposures of the same star. Individual radial velocities for all stars agree within the errors but one, NGC 6819 W983, with a radial velocity of 3.2 ± 0.8 km s−1 from the exposure in the night 2013 July 25, and −8.3 ± 0.8 km s−1 from the three consecutive exposures in the night 2013 July 29. We flag this star as possible spectroscopic binary (see Section 3.3.3 for further discussions).
There can be other single-line spectroscopic binaries within our sample that we are not detecting because in most cases we have taken the individual exposures in the same night. In this case, we would only detect them if the period is very short.
3.3.2 Combined spectra and comparison among instruments
The final values of the radial velocities are obtained running again doop on the combined spectra. The results of each star and instrument are specified in columns 9, 10 and 11 (for FIES, HERMES and CAFE, respectively) of Table 6. The radial velocity uncertainties are reduced with respect to the ones from individual spectra due to the higher SNR, as shown in the lower panel of Fig. 4. Now the median dispersion values for each instrument are 0.5 ± 0.1 km s−1 for FIES, 0.7 ± 0.3 km s−1 for HERMES and 0.93 ± 0.07 km s−1 for CAFE.
Radial velocities obtained with FIES, HERMES and CAFE, and the combination of all instruments vr, OCCASO. Values from the literature are vr, ref, and differences with the literature are computed as Δvr = vr, OCCASO − vr, ref. Information on membership in the literature is shown: probability from proper motion (Pμ), from radial velocity |$P_{v_{{\rm r}}}$| and membership classification (Class). Last column points out special cases discussed in the text. Star IDs are from WEBDA. The complete table can be found in the electronic version of the journal, and in the CDS.
| Cluster | Star | RA | Dec. | V | Pμ | |$P_{v_{{\rm r}}}$| | Class | vr, FIES | vr, HERMES | vr, CAFE | vr, OCCASO | vr, ref | Δvr | Reference | Remark |
|---|---|---|---|---|---|---|---|---|---|---|---|---|---|---|---|
| Arcturus | 14:15:39.672 | +19:10:56.67 | −0.05 | −5.1 ± 0.5 | −5.0 ± 0.6 | −4.9 ± 0.8 | −5.0 ± 0.9 | −5.19 ± 0.03 | 0.19 | Blanco-Cuaresma et al. (2014) | |||||
| μ-Leo | 09:52:45.817 | +26:00:25.03 | 3.88 | 13.7 ± 0.6 | 13.8 ± 0.7 | 14.5 ± 1.0 | 13.9 ± 1.2 | 13.53 ± 0.03 | 0.37 | Blanco-Cuaresma et al. (2014) | |||||
| IC 4756 | W0042 | 18:37:20.77 | +05:53:43.1 | 9.46 | −24.7 ± 0.6 | −24.7 ± 0.6 | −24.9 ± 0.2 | 0.2 | Mermilliod, Mayor & Udry (2008) | ||||||
| −25.2 ± 0.7 | 0.5 | Valitova et al. (1990) | |||||||||||||
| W0044 | 18:37:29.72 | +05:12:15.5 | 9.79 | 0.961 | −25.8 ± 0.7 | −25.8 ± 0.7 | −26.0 ± 0.1 | 0.2 | Mermilliod et al. (2008) | ||||||
| −26.6 ± 0.2 | 0.8 | Valitova et al. (1990) | |||||||||||||
| W0049 | 18:37:34.22 | +05:28:33.5 | 9.43 | 0.961 | −25.2 ± 0.6 | −25.2 ± 0.6 | −25.4 ± 0.1 | 0.2 | Mermilliod et al. (2008) | ||||||
| −26.0 ± 0.4 | 0.8 | Valitova et al. (1990) | |||||||||||||
| W0081 | 18:38:20.76 | +05:26:02.3 | 9.38 | 0.911,0.9910 | −23.1 ± 0.7 | −23.1 ± 0.7 | −23.2 ± 0.1 | 0.1 | Mermilliod et al. (2008) | ||||||
| −27.9 ± 0.5 | 4.8 | Valitova et al. (1990) | |||||||||||||
| W0101 | 18:38:43.79 | +05:14:20.0 | 9.38 | 0.941,0.9910 | −25.5 ± 0.7 | −25.5 ± 0.7 | −25.7 ± 0.1 | 0.2 | Mermilliod et al. (2008) | ||||||
| −25.6 ± 0.2 | 0.1 | Valitova et al. (1990) | |||||||||||||
| W0109 | 18:38:52.93 | +05:20:16.5 | 9.02 | 0.961,0.9910 | −24.5 ± 0.5 | −24.8 ± 0.6 | −24.0 ± 0.9 | −24.5 ± 0.6 | −25.2 ± 0.1 | 0.7 | Mermilliod et al. (2008) | ||||
| −24.4 ± 0.4 | −0.1 | Valitova et al. (1990) | |||||||||||||
| W0125 | 18:39:17.88 | +05:13:48.8 | 9.29 | 0.921,0.9910 | −24.5 ± 0.4 | −24.7 ± 0.5 | −24.0 ± 0.9 | −24.5 ± 0.6 | −24.9 ± 0.1 | 0.4 | Mermilliod et al. (2008) | ||||
| −24.4 ± 0.4 | −0.1 | Valitova et al. (1990) | |||||||||||||
| NGC 752 | W0001 | 01:55:12.60 | +37:50:14.60 | 9.48 | 0.932,0.9310 | Ma | 5.3 ± 0.4 | 5.3 ± 0.4 | 5.2 ± 0.1 | 0.1 | Mermilliod et al. (2008) | ||||
| 4.73 ± 0.20 | 0.57 | Böcek Topcu et al. (2015) | |||||||||||||
| W0024 | 01:55:39.35 | +37:52:52.69 | 8.91 | 0.992,0.9310 | Ma | 5.6 ± 0.4 | 5.7 ± 0.5 | 5.6 ± 0.5 | 5.4 ± 0.1 | 0.2 | Mermilliod et al. (2008) | ||||
| 4.86 ± 0.19 | 0.74 | Böcek Topcu et al. (2015) | |||||||||||||
| W0027 | 01:55:42.39 | +37:37:54.66 | 9.17 | 0.992,0.9310 | Ma | 4.9 ± 0.5 | 4.8 ± 0.5 | 4.9 ± 0.5 | 4.6 ± 0.1 | 0.3 | Mermilliod et al. (2008) | ||||
| 4.39 ± 0.19 | 0.51 | Böcek Topcu et al. (2015) | |||||||||||||
| W0077 | 01:56:21.63 | +37:36:08.53 | 9.38 | 0.982,0.9110 | Ma | 5.2 ± 0.5 | 5.2 ± 0.5 | 5.0 ± 0.1 | 0.2 | Mermilliod et al. (2008) | |||||
| 4.58 ± 0.20 | 0.62 | Böcek Topcu et al. (2015) | |||||||||||||
| W0137 | 01:57:03.12 | +38:08:02.73 | 8.90 | 0.992,0.9310 | Ma | 5.7 ± 0.5 | 5.5 ± 0.6 | 5.6 ± 0.5 | 5.2 ± 0.1 | 0.4 | Mermilliod et al. (2008) | ||||
| 5.59 ± 0.20 | 0.01 | Böcek Topcu et al. (2015) | |||||||||||||
| W0295 | 01:58:29.81 | +37:51:37.68 | 9.30 | 0.992,0.9310 | Ma | 5.6 ± 0.5 | 5.6 ± 0.5 | 5.2 ± 0.1 | 0.4 | Mermilliod et al. (2008) | |||||
| 6.32 ± 0.23 | −0.72 | Böcek Topcu et al. (2015) | |||||||||||||
| W0311 | 01:58:52.90 | +37:48:57.30 | 9.06 | 0.992,0.9210 | Ma | 6.0 ± 0.6 | 6.0 ± 0.6 | 5.8 ± 0.1 | 0.2 | Mermilliod et al. (2008) | |||||
| 5.19 ± 0.19 | 0.81 | Böcek Topcu et al. (2015) | |||||||||||||
| NGC 1907 | W0062 | 05:27:49.053 | +35:20:10.13 | 12.41 | 0.9810 | Mb | 2.6 ± 1.6 | 2.6 ± 1.6 | −2.08 ± 1.4 | 4.68 | Glushkova & Rastorguev (1991) | ||||
| W0113 | 05:28:04.207 | +35:19:16.32 | 11.81 | 0.6110 | Mb | 2.2 ± 0.6 | 2.2 ± 0.6 | 1.67 ± 0.9 | 0.53 | Glushkova & Rastorguev (1991) | |||||
| W0131 | 05:28:05.276 | +35:19:49.64 | 12.30 | 0.9810 | Mb | 2.3 ± 1.2 | 2.3 ± 1.2 | −0.68 ± 2 | 2.98 | Glushkova & Rastorguev (1991) | |||||
| W0133 | 05:28:05.863 | +35:19:38.87 | 12.74 | 0.9810 | −0.2 ± 1.7 | −0.2 ± 1.7 | |||||||||
| W0256 | 05:28:01.783 | +35:21:14.89 | 11.23 | 0.9810 | Mb | 2.8 ± 0.8 | 2.8 ± 0.8 | 1.45 ± 0.69 | 1.35 | Glushkova & Rastorguev (1991) | |||||
| W2087 | 05:27:38.899 | +35:17:18.04 | 13.09 | 63.4 ± 1.0 | 63.4 ± 1.0 | X | |||||||||
| … | … | … | … | … | … | … | … | … | … | … | … | … | … | … | … |
Membership probabilities: Pμ: 1Herzog, Sanders & Seggewiss (1975), 2Platais (1991), 3Zhao et al. (1984), 4Sanders (1977), 5Sanders (1973), 6McNamara, Pratt & Sanders (1977), 7Sanders (1972), 8Kharchenko et al. (2005), 9McNamara & Solomon (1981), 10Dias et al. (2014); |$P_{v_{{\rm r}}}$|: iGeller, Latham & Mathieu (2015), iiMilliman et al. (2014).
We use the final combined spectra of the repeated stars to make a comparison among instruments (see Fig. 5). Fifteen stars were observed with both FIES@NOT and HERMES@Mercator, nine stars observed with both [email protected] m CAHA and FIES@NOT, and five stars observed with both HERMES@Mercator and [email protected] m CAHA. We notice the following.
For HERMES-FIES comparison, we find a mean offset and dispersion of 〈Δvr〉 = −0.10 ± 0.12 km s−1.
 Figure 5.
Differences in vr obtained for the stars in common between HERMES@Mercator and FIES@NOT (top panel), [email protected] m CAHA and FIES@NOT (central panel), and [email protected] m CAHA and HERMES@Mercator (bottom panel). The error bars are the sum in quadrature of the two uncertainties.
For CAFE-FIES, we find a mean offset of 〈Δvr〉 = 0.40 ± 0.20 km s−1.
For the CAFE-HERMES case, we find a mean offset of 〈Δvr〉 = 0.60 ± 0.28 km s−1.
All offsets are in agreement within the observational uncertainties and follow the expectations from sky emission lines results (see Table 4 and Section 3.2).
3.3.3 Final values from combined spectra
The final values of the radial velocity for each star are derived from the combined spectra. For the cases of stars observed with several instruments, we adopt the weighted mean of all the determinations, and the mean of the nominal errors as the uncertainty. These final values are found in column 12 of Table 6.
In general, stars have compatible radial velocities within the same cluster. This is because they were already pre-selected to be very likely cluster members, as explained in Section 2.2. However, a re-analysis of membership is performed. We flag as non-members those stars which have vr not compatible at the 3σ level of the radial velocity of the cluster. We have used the median and the mean absolute deviation (MAD). We iterate this by rejecting the non-members and recalculating the median radial velocity, until we find a sample of compatible stars. Under this criterion, we flag the following five stars.
NGC 1907 W2087 has a significant difference of ∼60 km s−1 with respect to the other stars from the same cluster. The four values from individual exposures of this star (see Table 5) are compatible with each other, so probably it is a non-member star or a large period spectroscopic binary. There is no other measurement in the literature for comparison.
NGC 2539 W233 has a radial velocity of 34.8 ± 1.1 km s−1, which is 5.4 km s−1 above the median of the other five stars. It was already flagged as spectroscopic binary by Mermilliod et al. (2008). They obtain a variability with the maximum at 28.3 ± 1.1 km s−1. This value is compatible with ours within 3σ.
NGC 2682 W224 has a radial velocity 6.5 km s−1 under the median of the cluster. The four individual spectra were taken in two consecutive days and the individual radial velocities are in agreement. It was already flagged as member spectroscopic binary by Jacobson et al. (2011b) and Geller et al. (2015).
NGC 6819 W983 has a variable radial velocity as shown in Table 5 and discussed in Section 3.3.1. For this reason, we do not give a final value of the radial velocity, and we do not include it in Table 6. Neither Hole et al. (2009) nor Milliman et al. (2014) identify this star as a radial velocity variable, obtaining a final radial velocity of 2.36 ± 0.20 km s−1. Both studies are based on the same spectra (six observations) and classify this star as single member for having e/i < 4 (external error divided by internal error). If this star was confirmed to be a cluster binary member, we could consider it in the abundance analysis of the cluster.
NGC 7762 W0084 has a large difference of ∼ 40 km s−1 with respect to the other stars from the same cluster. Radial velocities obtained from the three individual spectra acquired in two consecutive nights are consistent within the uncertainties. There are neither previous radial velocity measurements nor information on membership for this cluster.
Special attention must be paid to NGC 7789. Following the iterative procedure described above, two stars should be rejected: W08260 and W07714. Radial velocities of all stars in this OC compare well with the literature for stars in common (Gim et al. 1998; Jacobson et al. 2011b, see Table 6), which considers all of them as members. Moreover, Jacobson et al. (2011b) reported that they find a broader dispersion compared with other OCs. Taking into account the OC mean radial velocity and dispersion from the three large samples in the literature (Table 7), all the seven stars studied here fall inside the distribution. Therefore, we have decided to keep these two stars as members.
Radial velocities of each cluster calculated as the median of the non-spectroscopic binaries and bona fide member stars. The MAD is assigned as the uncertainty; the numbers of stars considered as members and used to derive the cluster radial velocity are written in parentheses. Other determinations of the cluster radial velocity are shown in column 3, and the reference is listed in column 4. Difference between OCCASO and literature is computed as Δv = vr − vr, lit. Note that larger differences in the comparisons of NGC 1907 with Glushkova & Rastorguev (1991), and NGC 7789 are commented in the main text (Sections 3.4 and 3.3.3.)
| Cluster | vr~(km s−1) | vr, lit(km s−1) | Δvr, lit(km s−1) | Reference |
|---|---|---|---|---|
| IC 4756 | −24.7 ± 0.7 (7) | −25.0 ± 0.2 (15) | 0.3 | Valitova et al. (1990) |
| −25.15 ± 0.17 (17) | 0.45 | Mermilliod et al. (2008) | ||
| NGC 752 | 5.6 ± 0.4 (7) | 5.04 ± 0.08 (16) | 0.56 | Mermilliod et al. (2008) |
| 4.82 ± 0.20 (10) | 0.78 | Böcek Topcu et al. (2015) | ||
| NGC 1907 | 2.3 ± 0.5 (5) | 0.1 ± 1.8 (4) | 2.2 | Glushkova & Rastorguev (1991) |
| NGC 2099 | 8.6 ± 0.6 (7) | 8.30 ± 0.20 (30) | 0.3 | Mermilliod et al. (2008) |
| NGC 2539 | 29.4 ± 0.7 (5) | 28.89 ± 0.21 (11) | 0.51 | Mermilliod et al. (2008) |
| NGC 2682 | 33.9 ± 0.5 (7) | 33.52 ± 0.29 (23) | 0.38 | Mermilliod et al. (2008) |
| 33.73 ± 0.83 (110) | 0.17 | Pasquini et al. (2011) | ||
| 33.3 ± 0.6 (22) | 0.6 | Jacobson et al. (2011b) | ||
| 33.67 ± 0.09 (141) | 0.23 | Yadav et al. (2008) | ||
| 33.74 ± 0.12 (77) | 0.16 | Pasquini et al. (2012) | ||
| NGC 6633 | −28.6 ± 0.3 (4) | −28.95 ± 0.09 (6) | 0.35 | Mermilliod et al. (2008) |
| NGC 6705 | 34.5 ± 1.7 (7) | 35.08 ± 0.32 (15) | −0.58 | Mermilliod et al. (2008) |
| 34.1 ± 1.5 (21) | 0.4 | Cantat-Gaudin et al. (2014b) | ||
| NGC 6819 | 3.0 ± 0.5 (5) | 2.45 ± 1.02 (566) | 0.55 | Milliman et al. (2014) |
| NGC 6991 | −12.3 ± 0.6 (6) | – | – | |
| NGC 7762 | −45.7 ± 0.3 (5) | – | – | |
| NGC 7789 | −53.6 ± 0.6 (7) | −54.9 ± 0.9 (50) | 1.3 | Gim et al. (1998) |
| −54.7 ± 1.3 (26) | 1.1 | Jacobson et al. (2011b) | ||
| −54.6 ± 1.0 (29) | 1.0 | Overbeek et al. (2015) |
The rest of studied stars from the observed clusters are compatible with being members of their parent cluster. We point out that stars NGC 1907 W0133, NGC 6819 W978 and NGC 7762 W0003 have radial velocities outside of the 3MAD margin of the cluster, but when also considering the uncertainties on these radial velocities, these stars are still within the cluster distributions, and are included as members in our sample (see Fig. 6). The doubtful cases of membership will be probably solved when doing the abundance analysis.
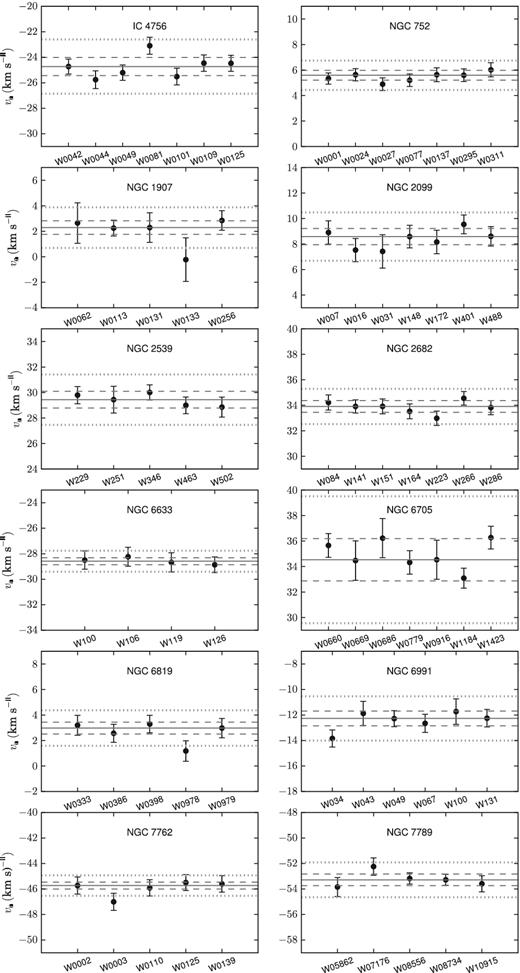
Radial velocities of the cluster stars considered as members. The solid line corresponds to the median radial velocity of the cluster (calculated with the considered member stars), the dashed line corresponds to the mean absolute deviation level 1MAD and the dotted line shows the 3MAD level.
3.3.4 Radial velocities of clusters
The sample of non-spectroscopic binaries and bona fide member stars is used to compute the cluster radial velocity. Median values and MAD are found in Table 7 and plotted in Fig. 6. We also list in Table 7 previous determinations of the cluster radial velocity, for those references where a mean value is given. All values from the literature are compatible within 3σ with the ones derived here.
The radial velocity dispersions within each cluster are found between 0.3 and 1.7 km s−1. The quoted dispersions are the result of (a) the precision that we have in our radial velocity determinations (Table 6), which is computed as the line-by-line radial velocity variance found by daospec, (b) a fraction of undetected binaries, and (c) the intrinsic internal dispersion of each cluster. In most of the cases, the dispersions in Table 7 are at the level of the quoted precisions. Only, the dispersion for NGC 6705 is very well above the uncertainties (1.7 km s−1). This can be indicative that either this cluster has a larger fraction of undetected binaries or that this is indeed the intrinsic radial velocity dispersion, and that this OC is kinematically hot. Given that the star-by-star comparison of this cluster with the literature is coherent within the uncertainties (Fig. 7 and Table 6), we tend to think that this is the intrinsic velocity dispersion. Moreover, this OC is the most massive and youngest cluster in the sample. Cantat-Gaudin et al. (2014b) selected bona fide members and found a mean radial velocity of 34.1 ± 1.5 km s−1 from 21 stars (UVES targets), and 35.9 ± 2.8 km s−1 from 536 stars (GIRAFFE targets). Our result confirms the high intrinsic velocity dispersion of this cluster.
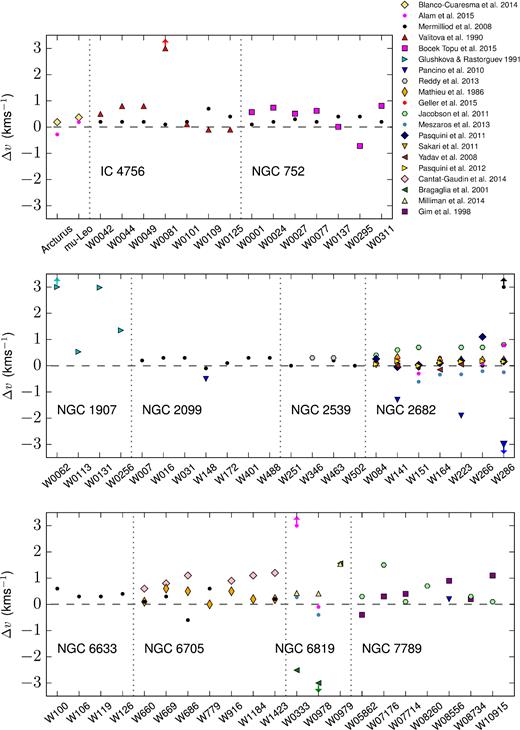
Radial velocity comparison with the literature. Stars are grouped by cluster. Differences, in the direction OCCASO literature, are plotted for each star. Different points in the same x-coordinate denote different literature values for the same star. Points out of the set y-limits are marked with an arrow. We have not plotted here stars NGC 2539 W233 and NGC 2682 W224, for being possible spectroscopic binaries as explained in Section 3.3.3. Uncertainties are specified in Table 6.
3.4 Comparison with the literature
We compared our final values for each star (column 12 of Table 6), with previous measurements in the literature, when available (column 13 of Table 6). Since in most cases our individual exposures are taken during the same night, this external comparison is also useful to identify potential spectroscopic binaries.
Calculated differences with each author are shown in Table 6 (column 14) and illustrated in Fig. 7. We exclude from this comparison the confirmed spectroscopic binaries already described in Section 3.3.3 (NGC 6819 W983, NGC 2539 W233 and NGC 2682 W224). The mean differences with each author are shown in Table 8.
Mean offsets and dispersions calculated for each author from the values in Table 6. Offsets (second column) are in the direction OCCASO literature; the number of stars for each paper is listed in the third column.
| Reference | Δvr (km s−1) | N |
|---|---|---|
| Blanco-Cuaresma et al. (2014) | 0.28 ± 0.09 | 2 |
| Mermilliod et al. (2008)a | 0.21 ± 0.21 | 40 |
| Valitova et al. (1990)b | 0.33 ± 0.39 | 6 |
| Glushkova & Rastorguev (1991) | 2.4 ± 1.6 | 4 |
| Pancino et al. (2010)c | −0.88 ± 0.79 | 4 |
| Cantat-Gaudin et al. (2014b) | 0.95 ± 0.21 | 6 |
| Mathieu et al. (1986) | 0.24 ± 0.18 | 14 |
| Bragaglia et al. (2001) | −0.5 ± 2.0 | 2 |
| Gim et al. (1998) | 0.42 ± 0.49 | 6 |
| Alam et al. (2015)d | 0.06 ± 0.34 | 7 |
| Mészáros et al. (2013) | −0.27 ± 0.25 | 7 |
| Pasquini et al. (2011) | 0.26 ± 0.36 | 7 |
| Sakari et al. (2011) | 0.00 | 1 |
| Yadav et al. (2008) | −0.05 ± 0.07 | 3 |
| Pasquini et al. (2012) | 0.12 ± 0.06 | 7 |
| Milliman et al. (2014) | 0.13 ± 0.06 | 3 |
| Böcek Topcu et al. (2015) | 0.4 ± 0.5 | 7 |
| Geller et al. (2015) | 0.4 ± 0.5 | 5 |
aExcluded NGC 2682 W286.
bExcluded IC 4756 W0081.
cExcluded NGC 2682 W286.
dExcluded NGC 6819 W0333.
We find good agreement with the literature except for five stars.
IC 4756 W0081: we find a difference of 4.8 km s−1 with Valitova et al. (1990), and a difference of only 0.1 km s−1 with Mermilliod et al. (2008). Given the small differences of the other stars in common with Valitova et al. (1990), we consider this case an outlier in this comparison and we exclude it to calculate the mean difference with these authors (Table 8). Our three individual measurements are taken within the same night (Table 5), so we cannot know if this star is a spectroscopic binary. A large set of measurements from Mermilliod et al. (2008) do not show variability.
NGC 1907 W0062: we find a difference of 4.68 km s−1 with Glushkova & Rastorguev (1991). We have three other stars from the cluster NGC 1907 in common with these authors, with differences of 0.53, 2.98, 1.35 km s−1. Their uncertainties are of the order of 1 km s−1. The mean difference with these authors is large (2.4 ± 1.6 km s−1), even if we consider the star W0062 as outlier (1.6 ± 1.0 km s−1). Glushkova & Rastorguev (1991) reported large uncertainties in their final values due to large errors in the observational data.
NGC 6819 W0333: there is a discrepancy of −2.11 km s−1 with Bragaglia et al. (2001), of 0.43 km s−1 with Milliman et al. (2014) and 8.8 km s−1 with Alam et al. (2015), which is the Data Release 12 (DR12) of APOGEE. We find a difference of only 0.7 km s−1 with Mészáros et al. (2013), which is the Data Release 10 (DR10). This star is reported to have ‘high persistency’5 in the APOGEE detector by Alam et al. (2015). Given the low differences of the other stars in common, this effect could be the explanation for the discrepancy. From a set of five measurements, Milliman et al. (2014) identify this star as single member.
NGC 6819 W0978: there is a difference of −4.76 km s−1 with Bragaglia et al. (2001), and a small difference with both APOGEE DR10 and DR12, −0.4 and −0.1 km s−1, respectively. Also we see a small difference of 0.41 km s−1 with Milliman et al. (2014), which identify this star as single member. Bragaglia et al. (2001) have used a spectral resolution of R = 40 000. They do not specify their errors, but they report that they were not interested in obtaining precise radial velocities.
NGC 2682 W286: we find significant differences of 8.1 and −5.1 km s−1 with Mermilliod et al. (2008) and Pancino et al. (2010), respectively. Since we find differences smaller than 1 km s−1 for the same star with six other authors (Mathieu et al. 1986; Jacobson et al. 2011b; Pasquini et al. 2011, 2012; Mészáros et al. 2013; Alam et al. 2015), we consider this case as outlier, and we exclude it to calculate the mean difference with Mermilliod et al. (2008) and Pancino et al. (2010) in Table 8.
We can state that large differences are found for few specific authors and stars. Given that for the same stars we find compatible values with other authors, we do not interpret these discrepancies as due to binarity but some spurious measurements in the literature. For all these stars mentioned above, we make use of our radial velocities.
Arcturus and μ-Leo are compared with the values given by Blanco-Cuaresma et al. (2014) for the Gaia Benchmark stars. These are two stars with very precise determination of the radial velocity because they are taken as standard stars for the Gaia mission wavelength calibration. We find a difference of 0.19 and 0.37 km s−1, respectively. We also compare with the results for the APOGEE DR12, which are −0.28 and 0.19 km s−1, respectively. All differences are lower than our quoted uncertainties.
We compare the six stars in common with GES for the cluster NGC 6705 with Cantat-Gaudin et al. (2014b, 21 stars analysed), finding a mean offset of 0.95 ± 0.21 km s−1. However, comparison of individual stars agrees within the quoted uncertainties.
Besides, we have seven stars in common with APOGEE DR12 (Alam et al. 2015), and eight stars in common with APOGEE DR10 (Mészáros et al. 2013). To make an overall comparison, we do not take into account the star NGC 2682 W224 and NGC 6819 W0333 for the reasons already discussed. We find a mean offset of 0.06 ± 0.34 km s−1 with Alam et al. (2015) and −0.27 ± 0.25 km s−1 with Mészáros et al. (2013).
All the computed mean differences with literature estimates are listed in Table 8. The largest offset is found for Glushkova & Rastorguev (1991) and is already commented above. The mean of the differences with the other authors is 0.2 ± 0.7 km s−1. This means that the accuracy with the overall literature is formally consistent with the quoted uncertainties.
3.5 Discussion: relation to the disc kinematics
As described in Section 2.1, Galactic disc kinematics is one of the science topics of OCCASO. This section is devoted to a preliminary analysis with the 12 OCs published here. A more detailed investigation will be carried out when all observations will be completed and Gaia proper motions will be available. Our analysis here is also limited by the small range of Galactocentric distances of the 12 OCs, mainly in the range 8–10 kpc. Most of the OCs studied here are located in the vicinity of the Local arm. Three of them are in the Perseus arm, and only NGC 6705 is located in the Sagittarius arm (see Fig. 9).
3.5.1 Radial velocity with respect to the GSR and RSR
It is well known that the Galactocentric velocity of any source in the Galactic disc can be described using two components: (a) the velocity associated with a circular orbit around the Galactic Centre, constrained by the Galactocentric distance and defining the regional standard of rest (RSR), and (b) an additional peculiar velocity, the velocity with respect to such RSR. The velocity with respect to RSR tells us how much the motion of the cluster differs from the Galactic disc rotation.
Fig. 8 presents vGSR as a function of Galactic longitude.8 The values corresponding to circular orbits at different radii have been overplotted. There is a good correlation between the Galactocentric distance of each cluster and the corresponding circular orbits, meaning that line-of-sight vRSR are small. The obtained values of vRSR and vGSR are listed in Table 9. The vRSR are in the range of −27 to +24.7 km s−1, typical values for the disc populations. Mean vRSR of the eight clusters located in the Local arm is −2 km s−1 with a standard deviation of 14 km s−1. Again, rather typical.
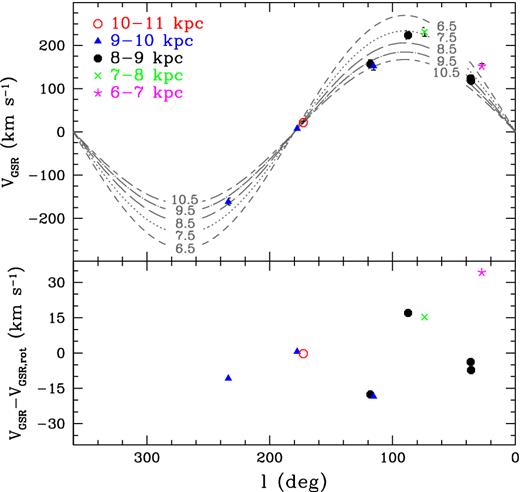
Upper panel: distribution of the studied clusters in the l–vGSR plane. The symbols change as a function of Galactocentric radius. vGSR has been computed assuming (U⊙, V⊙, W⊙) = (10.7,15.6,8.9) km s−1 and Θ0 = 240 km s−1 from Reid et al. (2014). Lines represent circular orbits at different radii showing the rotation curve derived by Reid et al. (2014). Errors in vGSR are not plotted since they are smaller than the point size (see Table 9). Lower panel: differences between the velocities of the clusters with respect to the GSR and the circular velocity at the position of each cluster vGSR − vGSR, rot.
Radial projections of the velocities with respect to the regional standard of rest vRSR and the galactic standard of rest vGSR.
| Cluster | vGSR | vRSR |
|---|---|---|
| (km s−1) | (km s−1) | |
| Sagittarius arm: | ||
| NGC 6705 | 151.9 ± 5.2 | |$24.7^{+ 3.3}_{ -2.9}$| |
| Local arm: | ||
| IC 4756 | 123.8 ± 6.4 | |$-13.1^{+ 1.0}_{ -1.1}$| |
| NGC 752 | 142.1 ± 6.7 | |$10.7^{+ 0.6}_{ -0.6}$| |
| NGC 2539 | −161.4 ± 8.4 | |$-5.6^{+ 1.7}_{ -1.6}$| |
| NGC 2682 | −85.6 ± 5.4 | |$14.8^{+ 0.9}_{ -0.8}$| |
| NGC 6633 | 118.3 ± 6.3 | |$-15.2^{+ 0.5}_{ -0.6}$| |
| NGC 6819 | 230.8 ± 10.0 | |$12.2^{+ 0.8}_{ -0.8}$| |
| NGC 6991 | 223.6 ± 10.5 | |$3.8^{+ 0.7}_{ -0.7}$| |
| NGC 7762 | 156.7 ± 9.3 | |$-27.0^{+ 1.0}_{ -1.1}$| |
| Perseus arm: | ||
| NGC 1907 | 21.7 ± 2.5 | |$-1.2^{+ 1.2}_{ -1.2}$| |
| NGC 2099 | 7.9 ± 2.0 | |$0.2^{+ 0.7}_{ -0.7}$| |
| NGC 7789 | 152.0 ± 9.6 | |$-24.0^{+ 2.6}_{ -2.7}$| |
We have also computed vRSR using different assumptions for the Galactic rotation and Sun's location taken from Antoja et al. (2011) and Sofue, Honma & Omodaka (2009). The mean differences of vRSR from the different assumptions are smaller than 0.4 km s−1, well within uncertainties due to the errors in radial velocity and distances. Therefore, our vRSR do not favour one or another Galactic rotation curve or location of the Sun.
3.5.2 Spatial velocity with respect to RSR
Us, Vs and Ws are the components of the non-circular velocity at the position of each cluster. These are computed from proper motions (Dias et al. 2014) and our radial velocities, using the values for the motion of the Sun with respect to the LSR from Reid et al. (2014). Mean values and dispersions of the non-circular velocity for the HMSRF studied by Reid et al. (2014) are indicated for each arm in italics. The last three columns list the differences in the direction OCCASO – 〈HMSFR〉.
| Cluster | μαcosδ | μδ | Us | Vs | Ws | ΔUs | ΔVs | ΔWs |
|---|---|---|---|---|---|---|---|---|
| (mas yr−1) | (mas yr−1) | (km s−1) | (km s−1) | (km s−1) | (km s−1) | (km s−1) | (km s−1) | |
| Sagittarius arm: | 4.44 ± 10.36 | 3.98 ± 11.51 | −3.60 ± 6.75 | |||||
| NGC 6705 | −1.23 | 1.31 | 3.77 ± 7.83 | 39.10 ± 11.14 | 22.44 ± 13.68 | −0.67 | 35.11 | 26.03 |
| Local arm: | 1.96 ± 10.44 | −3.90 ± 4.51 | 5.01 ± 10.16 | |||||
| IC 4756 | −0.60 | −1.69 | −15.17 ± 2.27 | −2.74 ± 2.78 | 6.15 ± 3.47 | −17.13 | 1.16 | 1.14 |
| NGC 752 | 1.81 | −3.90 | −4.25 ± 2.99 | 12.17 ± 3.16 | 0.47 ± 3.13 | −6.21 | 16.07 | −4.54 |
| NGC 2539 | −3.20 | −1.24 | 14.82 ± 7.41 | −8.57 ± 6.83 | −7.45 ± 9.96 | 12.86 | −4.67 | −12.47 |
| NGC 2682 | −9.40 | −4.87 | −19.35 ± 4.48 | −14.07 ± 5.27 | −8.32 ± 5.97 | −21.31 | −10.17 | −13.33 |
| NGC 6633 | −2.27 | −4.95 | −12.75 ± 1.77 | −9.16 ± 2.26 | 4.42 ± 2.67 | −14.71 | −5.26 | −0.59 |
| NGC 6819 | −6.07 | −3.57 | 17.15 ± 21.00 | 2.67 ± 3.38 | 71.73 ± 23.10 | 15.19 | 6.57 | 66.72 |
| NGC 6991 | −1.50 | 1.94 | −10.46 ± 6.09 | 3.04 ± 0.65 | 18.40 ± 6.59 | −12.42 | 6.94 | 13.39 |
| NGC 7762 | 3.44 | −2.21 | −10.45 ± 12.84 | −38.51 ± 7.91 | −10.35 ± 6.31 | −14.41 | −34.61 | −15.36 |
| Perseus arm: | 4.44 ± 10.36 | 3.98 ± 11.51 | −3.60 ± 6.75 | |||||
| NGC 1907 | −0.85 | −4.22 | −0.07 ± 1.53 | −7.98 ± 13.63 | −17.89 ± 14.94 | −4.51 | −11.96 | −14.29 |
| NGC 2099 | 2.08 | −6.40 | −1.37 ± 0.91 | −28.28 ± 11.24 | 1.75 ± 11.22 | −5.81 | −32.26 | 5.35 |
| NGC 7789 | 2.86 | −0.74 | −36.58 ± 18.89 | −55.50 ± 13.93 | −1.62 ± 13.48 | −41.02 | −59.48 | 1.98 |
The uncertainty has been derived from classical Markov chain Monte Carlo simulation with 10 000 random realizations for each cluster.
Taking the values from Table 10, we find mean values and standard deviations of 〈Us〉 = −6 ± 15 km s−1, 〈Vs〉 = −9 ± 24 km s−1, 〈Ws〉 = 7 ± 23 km s−1. Studies of velocity dispersions as a function of age such as Holmberg, Nordström & Andersen (2009, fig. 7) indicate that for stars of ages 0.8–2.5 Gyr we expect σU and σV between 15 and 25 km s−1. So, this is well verified in our sample. There are only four OCs, NGC6705, NGC6819, NGC7762 and NGC7789, with velocities with respect to their RSR larger than about 30 km s−1 and are the ones with the larger errors. Particularly remarkable is NGC6819 with a vertical velocity of 71.73 ± 23.10 km s−1.
IC 4756 and NGC 6633, both in the Local arm, are located close together and have similar age and spatial non-circular velocity. Taken together, this may indicate some relationship in their formation. Better uncertainties in proper motions like the ones that Gaia will provide, and comparison of chemical abundances (which is the main purpose of OCCASO), will clarify this issue.
Finally, in Fig. 9 we have plotted the spatial distribution of the 12 OCs in the Galactic plane. The location of the spiral arms, as derived by Reid et al. (2014), and the (Us, Vs) components for each cluster have been overplotted. High-mass star-forming regions (HMSFR) studied by Reid et al. (2014) are also included. We have calculated mean values and dispersions of the HMSFR 〈Us〉, 〈Vs〉, 〈Ws〉 in each arm. And we have computed differences between the OC components and these mean values (see the last three columns in Table 10), to see if there exists a hint of dynamical relationship between our OCs and the arms. In general, the differences fall inside the 3σ margin except for the clusters NGC 7789 (Perseus arm), NGC 7762 and NGC 6819 (Local arm), and NGC 6705 (Sagittarius arm). We do not find correlations with age, but our sample is limited in number. Again, precise proper motions of Gaia can help on the interpretation of the kinematics of the studied clusters.
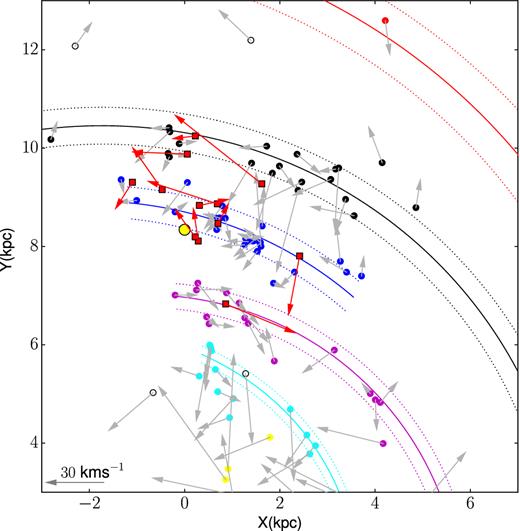
Spatial distribution of the 12 studied clusters in this paper (red squares). The Sun (big yellow circle) is at (0,8.34) kpc. The Galaxy's spiral arm positions and widths (coloured solid and dashed lines) are obtained from Reid et al. (2014). Coloured circles show the locations of HMSFR studied in Reid et al. (2014). Circles are color coded taking into account the spiral arm where they are assigned to, as described in Reid et al. (2014). The arrows show the spatial velocity with respect to the RSR projected on to the plane from Reid et al. (2014, in grey) and from this study (red).
4 SUMMARY
The OCCASO survey has been designed to obtain radial velocities and homogeneous abundances for more than 20 chemical species for RC stars in a sample of 25 Northern OCs with ages ≳0.3 Gyr. These data will allow us to properly analyse the existence of trends with RGC, z and age, in the Galactic disc. Moreover, our sample of OCs is complementary to GES-UVES observations of intermediate-age and old Southern OCs. For this reason, we include OCs in common with GES to guarantee homogeneity between both surveys. At the end of both surveys, a homogeneous sample of chemical abundances for around 50 OCs will be available.
We have collected observational data from high-resolution spectroscopy during 53 nights of observation using the fibre-fed echelle spectrographs FIES and HERMES at the ORM, and CAFE at CAHA. We have done a comparison among the results from the three instruments used, obtaining good agreement within the uncertainties.
The radial velocity analysis has been performed for 77 stars in 12 OCs. We have derived radial velocities from 401 individual exposures. With these values, we have found a new possible spectroscopic binary NGC 6819 W983, which has never been identified as a multiple system. We have derived radial velocities from the combined spectra with SNR ≥ 70, obtaining uncertainties of 0.5–0.9 km s−1. We have used these values of the radial velocities to confirm or discard membership from our sample of stars and compute a median radial velocity for each OC. In particular, we have obtained radial velocities for OCs never studied before with high-resolution spectroscopy: NGC 1907 (vr = 2.3 ± 0.5 km s−1), NGC 6991 (vr = −12.3 ± 0.6 km s−1) and NGC 7762 (vr = −45.7 ± 0.3 km s−1).
The radial velocities obtained in this paper agree with the values from previous authors within the uncertainties, except for few cases. We have compared the stars in common with other two large spectroscopic surveys: GES, six stars in common with an average difference of Δvr = 0.95 ± 0.21 km s−1; and APOGEE, seven stars in common with Mészáros et al. (2013, DR10) a mean difference Δvr = −0.27 ± 0.25 km s−1, and seven stars in common with Alam et al. (2015, DR12) a mean difference of Δvr = 0.06 ± 0.34 km s−1.
Median radial velocities for each OC have been used to study their kinematics in relation to the disc and the spiral arms. It is shown that all of the studied clusters follow the expected rotation of the Milky Way assuming the rotation curve derived by Reid et al. (2014).
Adding information of proper motions from Dias et al. (2002), we have derived full spatial velocities, and we have compared the non-circular velocities among them. There seems to be no clear relation of the peculiar velocities among the OCs from the same spiral arm (except for IC 4756 and NGC 6633), nor with the peculiar velocities of the HMSFR (Reid et al. 2014) from the same arms. From our sample, we calculate the dispersion in the two components of the plane velocity: σU and σV = 15 and 24 km s−1, which is expected for a population of ages 0.8–2.5 Gyr as seen in Holmberg et al. (2009).
We are grateful to the referee for the suggestions that improved this work. We warmly thank F. Figueras for her useful comments and discussions. This work is based on observations made with the Nordic Optical Telescope, operated by the Nordic Optical Telescope Scientific Association, and the Mercator Telescope, operated on the island of La Palma by the Flemish Community, both at the Observatorio del Roque de los Muchachos, La Palma, Spain, of the Instituto de Astrofísica de Canarias. This work is also based on observations collected at the Centro Astronómico Hispano Alemán (CAHA) at Calar Alto, operated jointly by the Max-Planck Institut für Astronomie and the Instituto de Astrofísica de Andalucía (CSIC).
This research made use of the WEBDA data base, operated at the Department of Theoretical Physics and Astrophysics of the Masaryk University, and the SIMBAD data base, operated at the CDS, Strasbourg, France. This work was supported by the MINECO (Spanish Ministry of Economy) – FEDER through grant ESP2013-48318-C2-1-R and ESP2014-55996-C2-1-R and MDM-2014-0369 of ICCUB (Unidad de Excelencia ‘María de Maeztu’).
CG, CEM-V and RC acknowledge support from the IAC (grantP/301204) and from the Spanish Ministry of Economy and Competitiveness (grant AYA2014-56795).
LC acknowledges financial support from the University of Barcelona under the APIF grant, and the financial support by the European Science Foundation (ESF), in the framework of the GREAT Research Networking Programme.
Actually, some bright clusters not fulfilling this condition were added to be observed during nights of non-optimal weather conditions.
iraf is distributed by the National Optical Astronomy Observatory, which is operated by the Association of Universities for Research in Astronomy (AURA) under a cooperative agreement with the National Science Foundation.
In many cases several observations are consecutive.
The APOGEE detector suffers from the persistence effect, where the amount of charge deposited can be affected by the previous exposure. This is further explained in Nidever et al. (2015).
Values obtained by their model A5.
Available at http://irsa.ipac.caltech.edu
OCs at |$b>15\deg$| (NGC 2682 and NGC 752) are not plotted since at these latitudes the line-of-sight component of the velocity is not in the Galactic plane.
REFERENCES
SUPPORTING INFORMATION
Additional Supporting Information may be found in the online version of this article:
Table 5.pdf
Table 6_v2.pdf
Please note: Oxford University Press is not responsible for the content or functionality of any supporting materials supplied by the authors. Any queries (other than missing material) should be directed to the corresponding author for the paper.
