


Abstract
We report the detection of CO(1-0) emission from NGC 1277, a lenticular galaxy in the Perseus Cluster. NGC 1277 has previously been proposed to host an overmassive black hole (BH) compared to the galaxy bulge luminosity (mass), based on stellar-kinematic measurements. The CO(1-0) emission, observed with the IRAM Plateau de Bure Interferometer (PdBI) using both, a more compact (2.9-arcsec resolution) and a more extended (1-arcsec resolution) configuration, is likely to originate from the dust lane encompassing the galaxy nucleus at a distance of 0.9 arcsec (∼320 pc). The double-horned CO(1-0) profile found at 2.9-arcsec resolution traces 1.5 × 10⁸ M⊙ of molecular gas, likely orbiting in the dust lane at ∼550 km s−1, which suggests a total enclosed mass of ∼2 × 10¹⁰ M⊙. At 1-arcsec resolution, the CO(1-0) emission appears spatially resolved along the dust lane in east–west direction, though at a low signal-to-noise ratio. In agreement with the previous stellar-kinematic measurements, the CO(1-0) kinematics is found to be consistent with an ∼1.7 × 10¹⁰ M⊙ BH for a stellar mass-to-light ratio of M/LV = 6.3, while a less massive BH of ∼5 × 10⁹ M⊙ is possible when assuming a larger M/LV = 10. While the molecular gas reservoir may be associated with a low level of star formation activity, the extended 2.6-mm continuum emission is likely to originate from a weak AGN, possibly characterized by an inverted radio-to-millimetre spectral energy distribution. Literature radio and X-ray data indicate that the BH in NGC 1277 is also overmassive with respect to the Fundamental Plane of BH activity.
INTRODUCTION
The discovery of scaling relations between supermassive black holes (BHs) and their host galaxies has been a major observational result in the field of galaxy evolution over the last ∼15–20 yr. Scaling relations have been found between the mass of the supermassive BH and the stellar velocity dispersion of the host galaxy bulge (MBH − σ relation), the bulge luminosity (MBH − Lsph relation), and bulge mass (MBH − Msph relation), (e.g. Magorrian et al. 1998; Ferrarese & Merritt 2000; Gebhardt et al. 2000; Marconi & Hunt 2003; Häring & Rix 2004; Gültekin et al. 2009a; Graham et al. 2011; Sani et al. 2011; McConnell & Ma 2013). These empirical scaling relations have been interpreted as a sign of co-evolution between supermassive BHs and their host galaxies, mediated by AGN feedback (e.g. Silk & Rees 1998; Di Matteo, Springel & Hernquist 2005). However, the implicit build-up of scaling relations in the course of hierarchical merging, as proposed by Peng (2007) and Jahnke & Macciò (2011), may play a role as well. A more complex picture involving self-regulatory and non-causal processes may be required to explain the various aspects of the observed BH–galaxy correlations (see Kormendy & Ho 2013, for a recent review).
Outliers from the BH scaling relations are of particular interest for the purpose of testing and interpreting these relations. Larger sample sizes of galaxies with reliable measurements of BH and galaxy parameters have recently led to refined analyses, by which it has been possible to reconcile some of the previous outliers with the BH relations. Barred galaxies have been found to deviate from the MBH − σ relation of non-barred galaxies, explaining some of the outliers with undermassive BHs (e.g. Graham 2008). Similarly, based on a classification into ‘classical’ bulges (formed by mergers) and ‘pseudo’-bulges (dominated by secular evolution and related to bars), Kormendy, Bender & Cornell (2011) have identified ‘pseudo’-bulges as outliers from the relations. Graham (2012) and Graham & Scott (2013) have recently proposed that the location of galaxies in the MBH − Msph plane can be interpreted as a bent relation, resulting from the superposition of two different relations for galaxies with ‘Sérsic’ and ‘core-Sérsic’ spheroids in the low- and high-mass regime, respectively. ‘Core-Sérsic’ spheroids, which are typically more massive and thought to be dominated by dry mergers, follow a nearly log-linear MBH − Msph relation, while ‘Sérsic’ spheroids, which are thought to be dominated by rapid BH growth in gas-rich processes, follow a steeper, almost quadratic relation at BH masses below ∼(2–10) × 108 M⊙. Some low-redshift AGN with apparently undermassive BHs (e.g. Mathur et al. 2012; Busch et al. 2014) could be representatives of this near-quadratic relation (Graham & Scott 2015).
At the high-mass end, the BH scaling relations have recently been challenged by a number of galaxies hosting ultramassive BHs of the order of 1010M⊙, the largest BH masses known to date. Ultramassive BHs are likely to provide new insights into galaxy and BH growth, as they must have experienced the strongest growth over time. Ultramassive BHs seem to typically be associated with central massive galaxies in clusters. Two such galaxies, NGC 4889 and NGC 3842, have measured BH masses of |$2.1^{+1.6}_{-1.6}\times 10^{10}\ \mathrm{M}_{\odot }$| and |$9.7^{+3.0}_{-2.5}\times 10^9\ \mathrm{M}_{\odot }$|, respectively (McConnell et al. 2011, 2012) and further indirect arguments suggest a similar association (Hlavacek-Larrondo et al. 2012). Ultramassive BHs seem to show a tendency to be overmassive compared to the MBH − σ relation, while they are still largely in agreement with the MBH − Msph relation (cf. McConnell & Ma 2013). This deviation could indicate that the growth of the central galaxies in clusters has had a significant contribution from dry mergers, which tend to increase velocity dispersion more than stellar mass (Volonteri & Ciotti 2013). However, the dry-merger scenario is observationally controversial (Savorgnan & Graham 2015).
An extreme case for an ultramassive BH is NGC 1277, which is not a Brightest Cluster Galaxy, but a 1.2 × 10¹¹ M⊙ compact S0 galaxy in the core of the Perseus Cluster, about 3.8 arcmin away from the Brightest Cluster Galaxy NGC 1275 (van den Bosch et al. 2012). A number of recent studies have analysed the BH mass in NGC 1277 based on stellar kinematics. The first measurement was published by van den Bosch et al. (2012), who found a BH mass of (1.7 ± 0.3) × 1010 M⊙, using Schwarzschild models for the long-slit stellar kinematics and input photometry from multi-Gaussian expansion of a Hubble Space Telescope (HST) image. The measurement by Yıldırım et al. (2015) has resulted in a marginally smaller best-fitting BH mass of 1.3 × 10¹⁰ M⊙, but, otherwise, in a good general agreement with the van den Bosch et al. (2012) results. Most recently, Walsh et al. (2016) have presented a revised BH mass of (4.9 ± 1.6) × 109 M⊙, based on stellar-kinematic data at higher spatial resolution than used in the previous studies. van den Bosch et al. (2012) report an extreme BH-to-stellar mass ratio, with a BH mass amounting to 59 per cent of the bulge mass or 14 per cent of the total stellar mass of NGC 1277. Even with the latest BH mass measurement of (4.9 ± 1.6) × 109 M⊙, the BH in NGC 1277 is overmassive compared to the K-band MBH − Lsph relation (Walsh et al. 2016).
NGC 1277 could have lost a fraction of its stellar mass by tidal stripping in the cluster environment, which could explain why the BH is overmassive. However, van den Bosch et al. (2012) find no strong indications that would suggest that NGC 1277 has been affected by tidal stripping. Optical spectra suggest that the stellar population of NGC 1277 is uniformly old (∼10 Gyr), and the galaxy shows no obvious signs of interactions (van den Bosch et al. 2012; Trujillo et al. 2014; Martín-Navarro et al. 2015). NGC 1277 has been discussed as a local example of a ‘relic’ galaxy, which has not undergone any significant transformations in its recent evolution and shows a stellar mass density profile similar to the ones found for massive compact high-redshift galaxies (Trujillo et al. 2014; Ferré-Mateu et al. 2015).
The overmassive BH in NGC 1277 has possibly been in place since this last violent star formation episode, because significant BH accretion without coeval star formation is unlikely (van den Bosch et al. 2012). By analysing an X-ray Chandra spectrum of NGC 1277, Fabian et al. (2013) find evidence of a power law from an unresolved central point source with a 0.5–7 keV luminosity of 1.3 × 1040 erg s−1 (corrected for absorption) and extended thermal gas. NGC 1277 has also been reported to be associated with an unresolved radio continuum detection with fluxes of 2.85 and 1.6 mJy at 1.4 and 5 GHz, respectively (Sijbring 1993). Fabian et al. (2013) argue that the current growth rate of the BH is likely to be negligible and that radiatively efficient Bondi accretion on to such a massive BH would suggest a 5–6 orders of magnitude larger luminosity of the X-ray power-law source than observed. The small current growth rate is surprising because the X-ray properties of NGC 1277 are characteristic of minicoronae and the corona lies within the Bondi radius (Sun et al. 2007; Fabian et al. 2013).
In view of the extreme properties of NGC 1277, Fabian et al. (2013) have proposed an evolutionary scenario based on the assumption that ultramassive BHs acquired the bulk of their mass at high redshift, where the most massive haloes could grow BHs rapidly. This rapid BH growth would most likely have involved extreme AGN feedback, shutting down new star formation. By z = 3, ultramassive BHs are then likely to be hosted in compact red bulges with a passive stellar population. Fabian et al. (2013) suggest that the further evolution of these host bulges depends on whether they are able to accrete external gas and stars. Galaxies like NGC 1277, moving at high velocity in a cluster core, may have remained virtually unchanged since z = 3, whilst Brightest Cluster Galaxies, centred in the cluster potential well, may have continued to grow significantly. Graham & Scott (2015) point out that the location of NGC 1277 in the MBH − Msph plane overlaps with an extrapolation of the near-quadratic relation for ‘Sérsic’ spheroids to high masses, where the plane is typically populated by ‘core-Sérsic’ spheroids. In this interpretation, NGC 1277 could be a rare example of a galaxy in which growth by gas-rich processes has continued on a near-quadratic relation instead of being terminated at the typical break mass. This scenario, however, is more difficult to reconcile with the small present growth rate of the BH in NGC 1277 and the predominantly old stellar population.
The first BH mass measurement for NGC 1277 by van den Bosch et al. (2012), which resulted in (1.7 ± 0.3) × 1010 M⊙, has been controversial. Emsellem (2013) argues that this large value for the BH mass is mostly determined by the fit to the central part of the measured Gauss-Hermite h4 profile, so that the accuracy of this parameter is critical. The N-body realizations presented by Emsellem (2013) show that a smaller BH mass of 5 × 10⁹ M⊙ provides a good fit to the stellar kinematics, except for a small discrepancy in the Gauss-Hermite h4 parameter. According to Emsellem (2013), an even smaller BH mass is possible, if variations in the mass-to-light ratio or high-velocity stars in the central region are present. These N-body realizations are based on a new multi-Gaussian expansion of the HST photometry and on the assumption that the potential is defined by a constant mass-to-light ratio of M/LV = 10 without any dark matter halo. As an alternative scenario, Emsellem (2013) also demonstrates that an end-on view on an inner bar together with a BH of only 2.5 × 10⁹ M⊙ can reproduce the stellar kinematics, except for the central part of the h4 profile. The smaller BH mass of 5 × 10⁹ M⊙ suggested by Emsellem (2013) is consistent with the most recent measurement of (4.9 ± 1.6) × 109 M⊙ reported by Walsh et al. (2016) based on stellar kinematic data at high spatial resolution.
An independent constraint on the BH mass of NGC 1277 can be obtained by using gas kinematics as a tracer of the gravitational potential (e.g. Davis et al. 2013; Davis 2014; Onishi et al. 2015). In this paper, we report the first detection of CO(1-0) emission from the centre of NGC 1277, based on observations with the IRAM PdBI. We interpret the CO(1-0) and 2.6-mm continuum data with the help of an optical image, obtained from archival HST data, and discuss implications for the BH mass of NGC 1277. The observations and data reduction of the IRAM and ancillary data are described in Section 2. The results obtained for the CO(1-0) and 2.6-mm continuum emission are presented in Section 3. In Section 4, we interpret the origin of the molecular gas and continuum detections, derive constraints for the enclosed mass from the molecular gas kinematics, and discuss star formation in the molecular gas as well as BH accretion scenarios. We summarize the main results in Section 5 and conclude with notes on the role of NGC 1277 in BH and galaxy growth scenarios. Throughout the paper, we will assume a scale of 353 pc arcsec−1 and a luminosity distance modulus of 34.39 (i.e. a luminosity distance of 75.5 Mpc), consistent with the values used by van den Bosch et al. (2012).
OBSERVATIONS AND DATA REDUCTION
IRAM PdBI data
The millimetre data for NGC 1277 were obtained using the IRAM PdBI in both, a more extended and a more compact configuration, providing spatial resolutions of ∼1 arcsec and ∼2.9 arcsec, respectively. A list of all observations, indicating the number of antennas, the minimum and maximum baselines, and the calibrators, is provided in Table 1. In order to observe the redshifted CO(1-0) line in NGC 1277, the dual-polarization receiver in the 3-mm band was tuned to 113.356 GHz, according to the optical systemic velocity of NGC 1277 of 5066 km s−1 (Falco et al. 1999). We verified the systemic velocity based on stellar absorption lines (Ca i λ2.26 μm, Mg i λ2.28 μm, and CO bandheads at about 2.29, 2.32, and 2.35 μm) in a single nuclear-aperture K-band spectrum of NGC 1277, extracted from a subset of archival NIFS (Gemini North) data from programme GN-2011B-Q-27 (PI: D. Richstone), (see Walsh et al. 2016). The systemic velocity derived from fitting this spectrum with template stars from the NIFS spectral template library v2.0 (Winge, Riffel & Storchi-Bergmann 2009) using pPXF (Cappellari & Emsellem 2004) agrees within ∼20 km s−1 with the value of 5066 km s−1. Since an offset of this order of magnitude is negligible compared to the accuracy at which the CO(1-0) data are analysed, we will present the CO(1-0) data using the reference velocity of 5066 km s−1.
Journal of observations.
| Configuration | Observation | Number of | Minimum | Maximum | RF | Phase/amplitude | Flux |
|---|---|---|---|---|---|---|---|
| date | antennas | baseline (m) | baseline (m) | calibrator | calibrator | calibrator | |
| Compact | 2014-Dec-16 | 6 | 24 | 176 | 3C 454.3 | 3C 84, 0300+470 | MWC 349 |
| 2015-Feb-19 | 7 | 24 | 144 | 3C 84 | 3C 84, 0300+470 | MWC 349 | |
| 2015-Apr-11 | 7 | 24 | 176 | 0059+581 | 3C 84, 0300+470 | LKHA 101 | |
| 2015-Jul-03 | 6 | 24 | 97 | 3C 454.3 | 3C 84, 0300+470 | MWC 349 | |
| 2015-Jul-06 | 6 | 24 | 97 | 3C 454.3 | 3C 84, 0300+470 | MWC 349 | |
| Extended | 2014-Mar-12 | 6 | 88 | 452 | 3C 273 | 3C 84, 0307+380 | 0307+380 |
| 2014-Mar-14 | 6 | 88 | 452 | 2013+370 | 3C 84, 0307+380 | MWC 349 |
The PdBI observations of NGC 1277 were performed using the Wide-Band correlator WideX, which provides a spectral resolution of 1.95 MHz and a bandwidth of 3.6 GHz covering the CO(1-0) line as well as the adjacent 2.6-mm continuum. The J2000 coordinates R.A. = 03h19m 51|${^{\rm s}_{.}}$|5 and Dec = +41°34′24|${^{\prime\prime}_{.}}$|7 were used as pointing reference. The data for both configurations were reduced using the IRAM gildas software clic and mapping.
Observations at low spatial resolution
The observations in the more compact configuration (special CD configuration, including the new seventh antenna) – obtained between 2014 December 16 and 2015 July 6 – cover baselines between 24 and 176 m and a total on-source time of 9.38 h for seven antennas. The details of these observations are listed in Table 1. The phase and amplitude calibration was performed based on 3C 84 and quasar 0300+470. Either MWC 349 or LKHA 101 were used as flux calibrators, while 0059+581, 3C 454.3, or 3C 84 were used as RF calibrators. The RF calibration based on 3C 84 could be affected by CO(1-0) emission from 3C 84. This calibrator was nevertheless chosen for the observations on 2015 February 19, because no obvious contamination was found and because the calibration was improved by using this strong calibrator instead of the weaker alternatives. The final UV table was created by merging the data from all observing dates using a spectral resolution of 40 MHz (105.8 km s−1).
The UV table was mapped using 256 × 256 spatial pixels, natural weighting, no tapering, and a pixel size of 0.61 × 0.61 arcsec2. The data cube was cleaned by applying Högbom deconvolution (Högbom 1974) to each spatial plane. The deconvolution was performed with a predefined support covering the emission that is evident in each channel close to the reference position of NGC 1277. The resulting beam size is 2.96 × 2.78 arcsec2. The 1σ noise level per 40-MHz channel in the cleaned cube is found to be 0.36 mJy beam−1 at 6000 km s−1 and increases to 0.62 mJy beam−1 at −3400 km s−1 with a value of about 0.47 mJy beam−1 around the NGC 1277 reference velocity. The continuum was subtracted from the cleaned data cube by subtracting the average of all channels close to the line emission but excluding the velocity range of the line itself. A number of the highest and lowest velocity channels were not considered when computing the continuum, since they show indications of unidentified features or noise peaks.
Observations at high spatial resolution
In the more extended configuration (B configuration), NGC 1277 was observed on 2014 March 12 and 14, respectively (see Table 1). These observations cover baselines between 88 and 452 m and a total on-source time of 8.29 h with six antennas. The phase and amplitude calibration for both observing dates was derived from observations of 3C 84 and quasar 0307+380. The flux is based on 0307+380 or MWC 349, while 3C 273 or 2013+370 were used as RF calibrators. The final UV table was created by merging the data from both observing dates using a spectral resolution of 40 MHz or 105.8 km s−1.
The UV table was converted into a data cube by mapping the data spatially on to 512 × 512 pixels using natural weighting, no tapering, and a pixel size of 0.24 × 0.24 arcsec2. The data cube was cleaned using the same method as applied to the low-resolution data. The resulting beam size in this more extended configuration is 1.15 × 0.86 arcsec2. The 1σ noise level per 40-MHz channel in the cleaned cube increases with decreasing velocity from about 0.3 mJy beam−1 at 6000 km s−1 to 0.6 mJy beam−1 at −3400 km s−1 with a value of 0.42 mJy beam−1 around the NGC 1277 reference velocity.
Since the CO(1-0) emission in this data set is weak, a blind detection assessment was performed on the cleaned data cube, both before and after continuum subtraction, using a wrapper around SExtractor (Bertin & Arnouts 1996). For each channel in the cube, a narrow-band image was created by averaging over a predefined number of neighbouring channels. In order to account for different line widths, the channel average was varied between a single channel and the maximum range of channels, using only odd numbers for a symmetric average around the central channel. Each narrow-band image was sent to SExtractor in order to identify all groups of pixels with values above a certain detection threshold. Both, the detection threshold as well as the minimum area covered by pixels above this threshold, are user-defined input parameters of SExtractor. In order to improve the detection process, we applied the SExtractor image filtering before detection, using a Gaussian convolution kernel with an FWHM of 4 pixels (0.96 arcsec), which roughly matches the beam size.
The detection assessment of the full data cube using single-channel narrow-band images, a SExtractor detection threshold of 3σ, and a minimum detection area of 3 pixels, results in the detection of a continuum emission peak at a mean offset of ΔR.A. = −0.15 arcsec and ΔDec = 0.18 arcsec for most channels across the full frequency range. In order to isolate weak line emission, a continuum subtraction was performed using the same method as applied to the low-resolution data. The resulting continuum image has a 1σ background noise level of 0.089 mJy beam−1. A new detection assessment was performed on the continuum-subtracted data cube, using a detection threshold of 2σ and a minimum detection area of 1 pixel to detect faint features. Within a distance of 13 arcsec around the reference position, only one detection is identified at a >5σ (peak flux over background rms) level. This detection at ∼5.1σ is found at ΔR.A. = 0.48 arcsec and ΔDec = 0.17 arcsec from the reference position when averaging three channels (320 km s−1) around a central velocity of +530 km s−1. While this detection is rather marginal based on the blind assessment, we will show in Section 3.3 that this feature is clearly confirmed as CO(1-0) emission from NGC 1277 by comparison with the data obtained at lower spatial resolution.
Ancillary optical data
Ancillary archival data from HST observations in the F550M filter are used to compare the millimetre observations with the optical features of NGC 1277. The optical HST image has already been presented by other authors to discuss the morphology of NGC 1277 (van den Bosch et al. 2012; Emsellem 2013; Fabian et al. 2013; Trujillo et al. 2014). We found the World Coordinate System (WCS) of the archival HST image to be offset, which we corrected by comparing the positions of objects in an ∼45 × 45 arcsec2 cut-out around NGC 1277 to coordinates from the Guide Star Catalog (GSC) 2.3 (Lasker et al. 2008). Four of these objects, extracted using the IMSTAR routine included in the wcstools package (e.g. Mink 1997), were found to match catalogued sources. Based on these, a new plate solution was derived using the iraf1 task CCMAP with a second-order polynomial fit. The fit shows an rms of about 0.2 arcsec, which is a similar order of magnitude as the average absolute astrometry error of 0.2–0.3 arcsec of the GSC 2.3 (Lasker et al. 2008). The HST image was resampled according to the new plate solution on to 0.05 × 0.05 arcsec2 pixels using the software swarp (Bertin et al. 2002) with a LANCZOS3 interpolation and an oversampling factor of 3. The final image quality, based on stars in the image field of view, is ∼0.14–0.15 arcsec (Gaussian FWHM).
RESULTS
Optical morphology
As already discussed by other authors (van den Bosch et al. 2012; Emsellem 2013; Fabian et al. 2013), the HST optical image shows a prominent dust lane around the centre of NGC 1277 (Fig. 1). The dust lane has a radius of ∼0.9 arcsec (∼320 pc), (see also, e.g. Fabian et al. 2013), and is seen nearly edge-on. van den Bosch et al. (2012) deduce an inclination of ∼75°, suggesting a similar inclination for the galaxy, if the dust lane is in the plane of the galaxy disc. It has been noted by Fabian et al. (2013) that the large central mass concentration corresponding to an ∼1010 M⊙ BH in NGC 1277 would imply high circular velocities of 480 km s−1 for gas orbiting in the dust lane.
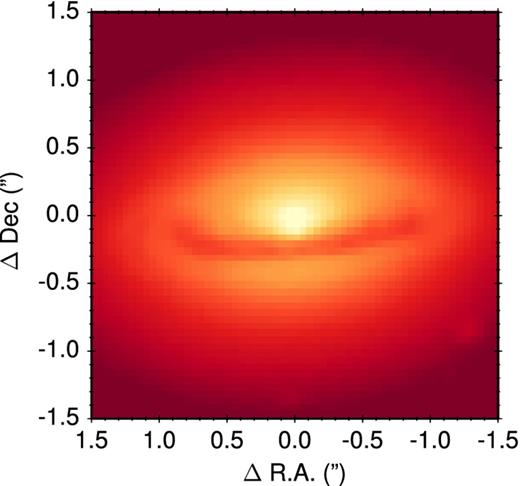
Optical F550MHST image of the central 3 × 3 arcsec2 region of NGC 1277. The image is shown in arbitrary units in a logarithmic colour scale chosen to enhance the contrast on the dust lane. The centre of the relative coordinate system is determined from a Gaussian fit to the nuclear emission peak.
2.6-mm continuum emission
The 2.6-mm continuum of NGC 1277 (Fig. 2), obtained from the high-spatial-resolution data, shows an integrated flux of (5.6 ± 0.2) mJy in a pseudo-circular aperture with a diameter of 3.36 arcsec. The continuum is found to be extended at the spatial resolution of 1 arcsec and shows a possible weak feature to the south. In order to probe the continuum extension, both, a point source and a circular Gaussian model, were fitted to the continuum map after convolution of the models with the beam. Both models result in ΔR.A. = −0.15 arcsec and ΔDec = 0.18–0.19 arcsec for the continuum position with respect to the pointing reference. This is in agreement with the position derived from the basic blind detection assessment in Section 2.1.2. Fitting a point source model, yields a best-fitting flux of 4.7 mJy. It is obvious that this fit only recovers about 80 per cent of the total flux of 5.6 mJy, obtained by direct aperture integration. The residual map of the continuum after subtraction of the point-source model (Fig. 3, top panel) shows that the continuum has extended excess emission compared to a point source. Fitting a single circular Gaussian instead of a point source, yields best-fitting parameters of 5.5 mJy for the flux and 0.5 arcsec for the Gaussian FWHM. The circular Gaussian model recovers most of the flux measured via direct aperture integration, and the residuals (Fig. 3, bottom panel) are negligible.
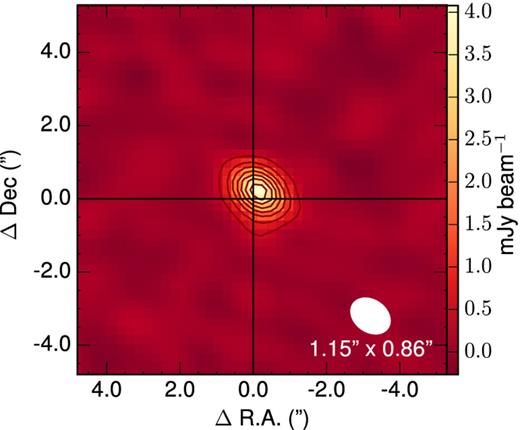
Map of the 2.6-mm continuum of NGC 1277 based on the data obtained in the more extended configuration. Contour levels start at 5σ and are shown in steps of 6σ (at 0.44, 0.98, 1.51, 2.04, 2.58, 3.11, 3.64 mJy beam−1). The colour scale extends from −3σ to the continuum peak value. The size and orientation of the beam are indicated in the lower right corner.
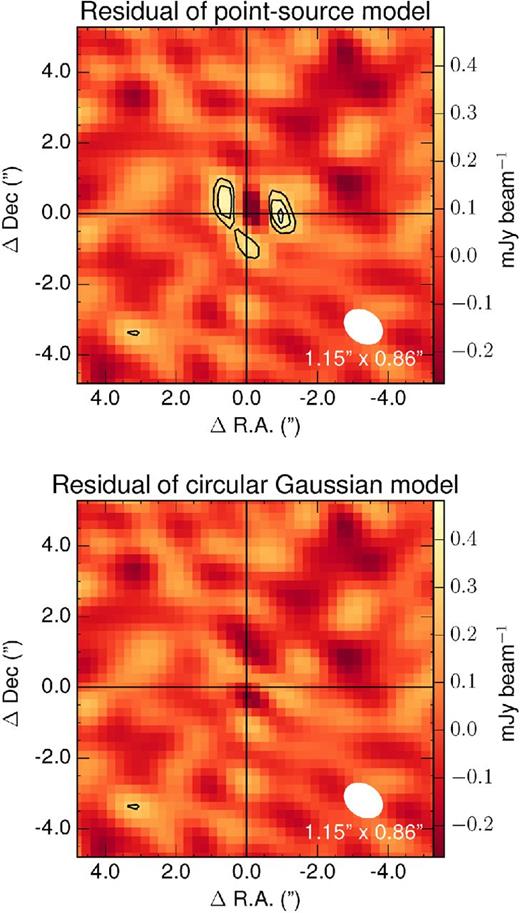
Residual maps after subtracting a point source model (top) and a circular Gaussian model (bottom) from the 2.6-mm continuum of NGC 1277, based on the high-resolution data. The 1σ noise level of the maps is 0.089 mJy beam−1. Contour levels start at 3σ and are shown in steps of 1σ (at 0.27, 0.35, and 0.44 mJy beam−1). The colour scale in both plots is identical and ranges between −3σ and the peak value of the map in the top panel. The size and orientation of the beam are indicated in the lower right corner.
CO(1-0) emission
A very broad CO(1-0) line is clearly detected close to the pointing reference in the data obtained at low spatial resolution (Figs 4 and 5). The line is symmetrically centred around the systemic velocity of NGC 1277 and marginally resolved in terms of kinematics. The map of the CO(1-0) emission, shown in Fig 4, has been computed by spectrally integrating the data over a symmetric range of 13 channels of 40-MHz width (i.e. 1380 km s−1) around the systemic velocity of NGC 1277. This wide spectral range has been selected to cover the full CO(1-0) line profile, as marked by the vertical dashed lines in the middle panel of Fig. 5, where the spectrum from the brightest pixel of the emission peak is displayed. The flux of the CO(1-0) emission peak, integrated over a pseudo-circular aperture with a diameter of 6.1 arcsec, and the corresponding H2 mass are listed in Table 2.
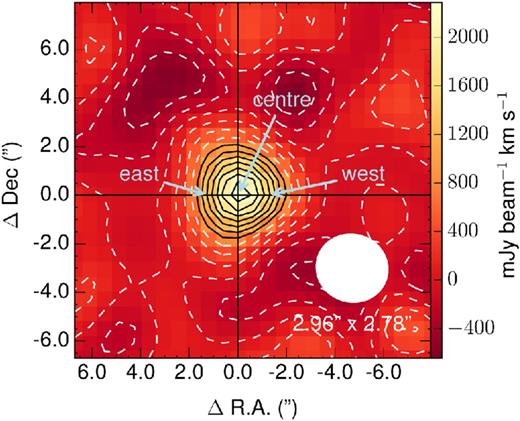
Map of the CO(1-0) detection for NGC 1277 obtained in the more compact configuration. The CO(1-0) line has been integrated over a symmetric velocity range of 1380 km s−1 (13 channels of 40 MHz) around the systemic velocity. The 4σ to 10σ contours (859, 1074, 1289, 1503, 1718, 1933, and 2148 mJy beam−1 km s−1) are shown as black solid lines. The −3σ to 3σ contours (−644, −430, −215, 0.0, 215, 430, and 644 mJy beam−1 km s−1) are shown as white dashed lines. The size and orientation of the beam are indicated in the lower right corner. ‘east’, ‘centre’, and ‘west’ mark the positions of the three pixels from which the marginally resolved spectra shown in Fig. 5 were extracted.
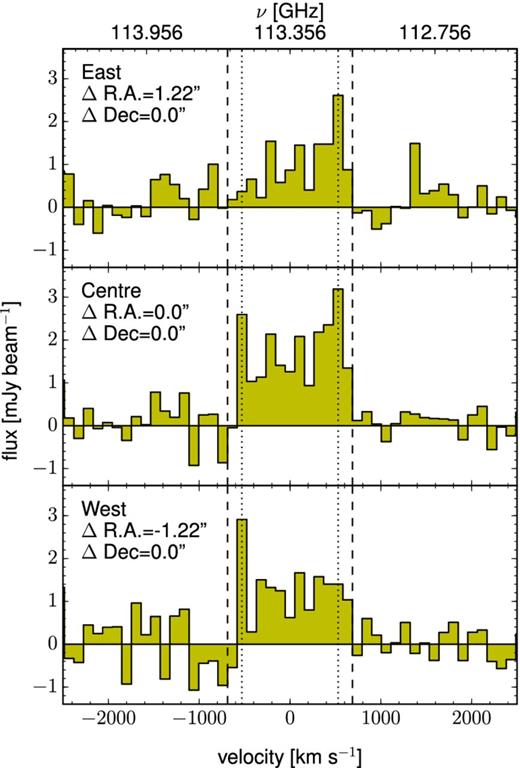
Spectra extracted from an eastern, central, and western pixel in the CO(1-0) emission peak, as indicated in Fig. 4. The spectra are shown at a spectral resolution of 40 MHz (105.8 km s−1). The vertical dotted lines mark +530 and −530 km s−1, which roughly coincides with the peaks of the double-horned line profile. The vertical dashed lines indicate the symmetric spectral range of 13 channels around the systemic velocity that was used to compute the integrated CO(1-0) map presented in Fig. 4.
Summary of the physical properties of the three main CO(1-0) detections, i.e. the double-horn profile at 2.9 arcsec spatial resolution as well as the clear and marginal detections of the redshifted and blueshifted horn, respectively, at 1-arcsec resolution. The columns show the integrated flux, the corresponding H2 mass calculated via equations 3 and 4 from Solomon & Vanden Bout (2005) assuming a Milky Way conversion factor of α = 4.6 M⊙ (K km s−1 pc2)−1, and the line centre and width, as used for the integrated line maps (see Figs 4–7).
| Detection | Beam size | Flux | M(H2) | Line centre | Line width |
|---|---|---|---|---|---|
| (arcsec2) | (mJy km s−1) | (108 M⊙) | (km s−1) | (km s−1) | |
| Double-horn profile | 2.96 × 2.78 | 2400 ± 400 | 1.5 ± 0.3 | 0 | 1380 |
| Redshifted horn | 1.15 × 0.86 | 300 ± 100 | 0.19 ± 0.06 | 530 | 320 |
| Blueshifted horn | 1.15 × 0.86 | 200 ± 100 | 0.13 ± 0.06 | −420 | 320 |
The central CO(1-0) profile (Fig. 5, middle panel) shows clear indications of a double-horned shape with a stronger velocity component centred at +530 km s−1 and a less pronounced component centred at −530 km s−1. The comparison of the three spectra from an eastern, central, and western pixel in Fig. 5 suggests that the CO(1-0) kinematics is marginally resolved in east–west direction. The pronounced horn at +530 km s−1 is mostly contributed by the eastern part of the CO(1-0) emission peak, while the weaker horn at −530 km s−1 seems to be associated with the western part.
At 1-arcsec resolution, in the more extended configuration, a clear ∼5σ detection is only found for the pronounced velocity component at +530 km s−1, as deduced from the blind detection assessment in Section 2.1.2. The narrow-band image of this single CO(1-0) detection is indicated via the two solid (black) contours in Fig. 6. This image has been averaged over three 40-MHz channels (i.e. 320 km s−1) around a central velocity of +530 km s−1 in order to isolate the line emission as suggested by the detection experiment. The emission peak is found at ΔR.A. = 0.48 arcsec and ΔDec = 0.15 arcsec, in agreement with the position derived from the detection experiment. The total flux measured for this peak in the above image, using a pseudo-circular aperture with a diameter of 1.92 arcsec, and the corresponding H2 mass are listed in Table 2. The spectrum of this emission peak, extracted from the brightest pixel, is shown in the top panel of Fig. 7. The spectrum shows a narrow (roughly three-channel-wide) line centred at +530 km s−1. In comparison to Fig. 5, it is obvious that this single detection corresponds to the pronounced red horn of the double-horned CO(1-0) profile seen in the more compact configuration. Fig. 7 also shows a number of apparent features in the spectral region at <−1000 km s−1, which we ascribe to the increasing noise towards higher frequencies.
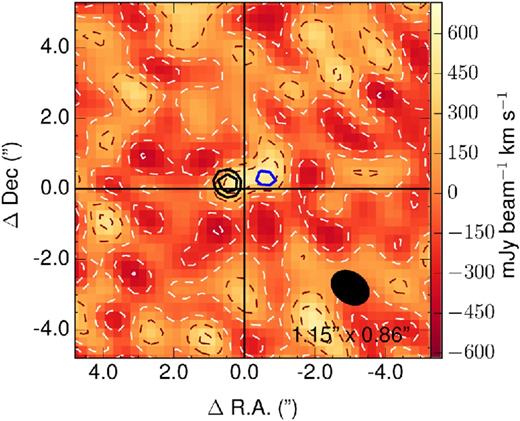
Map of CO(1-0) emission features in the more extended configuration. The two (black) 3σ and 4σ contours (232 and 310 mJy beam−1 km s−1) east of the reference position show the only clear CO(1-0) detection, obtained by spectrally integrating the data cube over three channels of 40 MHz (i.e. 320 km s−1) around a central velocity of +530 km s−1 (see also Section 2.1.2). This detection corresponds to the redshifted horn of the double-horned profile detected in the more compact configuration (Fig. 5). The (blue) 3σ contour (263 mJy beam−1 km s−1) west of the reference position shows a marginal detection from the blueshifted horn of the profile, obtained by spectrally integrating three channels of 40 MHz (i.e. 320 km s−1) around a central velocity of −420 km s−1. The underlying colour image shows the map obtained by integrating the cube over the full spectral range of the double-horned profile (i.e. 13 channels of 40 MHz or 1380 km s−1, as indicated by the dashed vertical lines in Fig. 5). White dashed contours mark the 0 to −3σ levels at 0.0, −207, −413, and −620 mJy beam−1 km s−1, respectively. Dark red dashed contours indicate the 1σ and 2σ levels at 207 and 413 mJy beam−1 km s−1, respectively. Note that 3σ is not reached. The size and orientation of the beam are indicated in the lower right corner.
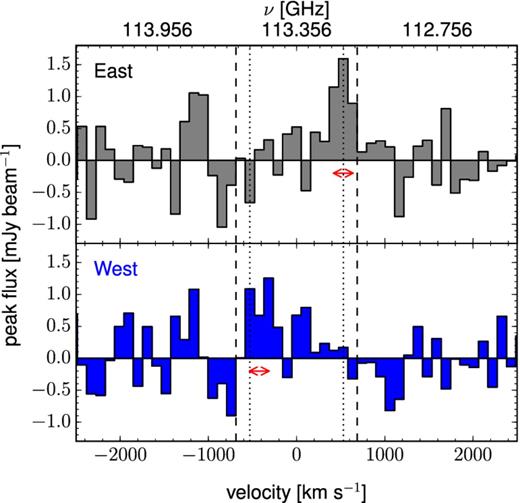
Spectra of the CO(1-0) detections in the more extended configuration. The upper panel shows the spectrum extracted from the brightest pixel in the eastern emission peak (black contours in Fig. 6). The lower panel shows the corresponding spectrum for the western, marginal emission peak (blue contour in Fig. 6). The arrows indicate the spectral integration ranges that were used to compute the maps of the emission peaks shown as solid (black and blue) contours in Fig. 6. For comparison with the double-horn profile seen in the data at low spatial resolution, the vertical dotted and dashed lines from Fig. 5 are reproduced here.
By visually inspecting the 1-arcsec resolution data in light of the double-horned profile seen at 2.9-arcsec resolution, we found indications of a marginal CO(1-0) emission peak associated with the blueshifted horn of the profile. This peak is just above the 3σ level when spectrally integrating the cube over 320 km s−1 around a central velocity of −420 km s−1 [single (blue) contour in Fig. 6]. The spectrum of this peak is shown in the lower panel of Fig. 7, and the corresponding total flux and gas mass, derived by integrating the emission over a pseudo-circular aperture with a diameter of 1.92 arcsec, are listed in Table 2. The peak is found at ΔR.A. = −0.63 arcsec and ΔDec = 0.32 arcsec, i.e. to the west of the detection associated with the redshifted horn. Although the current signal-to-noise ratio is low, the 1-arcsec resolution data seem to spatially resolve the east–west alignment of the redshifted and blueshifted CO(1-0) emission that has already been indicated by the data at 2.9-arcsec resolution (Fig. 5).
Possible evidence for CO(1-0) emission from the region connecting the two emission peaks is found when integrating the 1-arcsec resolution data over the full spectral range covered by the double-horned profile seen at 2.9-arcsec resolution (i.e. 1380 km s−1). None of the features in the resulting map, shown as the underlying colour image in Fig. 6, reaches the 3σ limit. However, the map suggests that the two CO(1-0) emission peaks are located at the opposite ends of an underlying ridge of positive emission. In view of the double-horned profile found at lower spatial resolution, it can be speculated that this emission ridge originates from components of the double-horned profile that are just below the current detection limit.
The clearly detected CO(1-0) emission peak associated with the velocity of +530 km s−1 shows a spatial offset of 0.6 arcsec to the east compared to the 2.6-mm continuum emission (Fig. 8). Assuming that the 1σ positional uncertainty ΔΘ for a signal-to-noise ratio SNR and a beam size ΘB is given by ΔΘ ≈ ΘB/(2 × SNR), the CO(1-0) line emission involves a positional uncertainty of ΔΘ ∼ 0.1 arcsec (using the major axis of the beam size (1.15 arcsec) and the SNR of the CO(1-0) emission peak of ∼5.1). Compared to this estimate, the measured offset between the CO(1-0) detection and the 2.6-mm continuum emission has an ∼6σ significance. (For the continuum peak, the uncertainty is much smaller than 0.1 arcsec, as it is detected with a much larger SNR.) For completeness, the marginal detection from CO(1-0) emission that is kinematically associated with the opposite side of the double-horned profile has been added to Fig. 8 (single blue contour). This emission shows an offset of about 0.5 arcsec to the west of the continuum peak. It is also noteworthy that the direction of the offset of the CO(1-0) emission peaks with respect to the 2.6-mm continuum does not coincide with the possible weak extension of the continuum to the south, mentioned in Section 3.2.
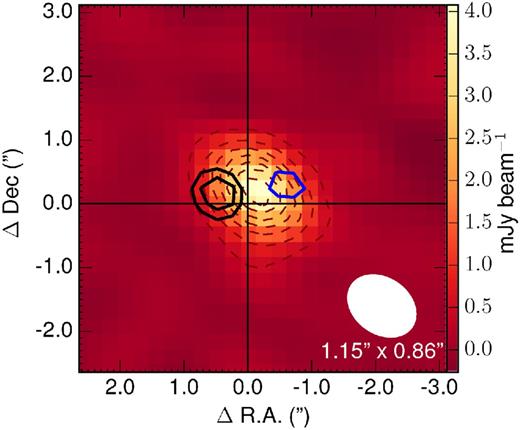
Position of the CO(1-0) emission peaks relative to the 2.6-mm continuum emission in the data at 1-arcsec resolution. The continuum colour scale and contours (dark red dashed lines) are the same as in Fig. 2. The contours for the two CO(1-0) peaks (black and blue) are shown as in Fig. 6. The size and orientation of the beam are indicated in the lower right corner.
Marginal evidence of a spatial gradient across the CO(1-0) kinematic components in east–west direction is also found in the combined data set after merging the 1-arcsec and 2.9-arcsec resolution data. The position–velocity diagram extracted from this merged data set along a slit oriented in east–west direction is shown in Fig. 9. Apart from the dominant +530 km s−1 component, the CO(1-0) emission is characterized by a low signal-to-noise ratio in this spatially resolved diagram. However, the diagram indicates that the highest velocity (+530 km s−1) component is located farthest to the east, while the lowest velocity components around −530 km s−1 are found farthest to the west. The evidence for a spatial gradient between the two extreme velocity components discussed in this section would be consistent with molecular gas clumps in rotation around a roughly north–south axis.
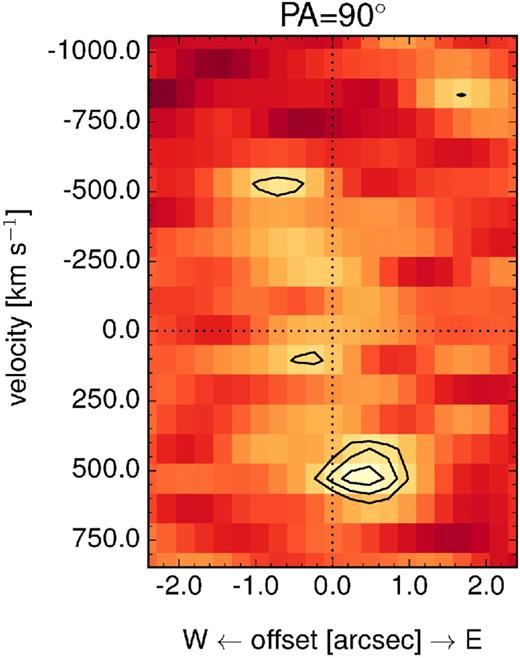
Position–velocity diagram of the CO(1-0) emission, extracted along a 0.72-arcsec-wide slit oriented in east–west direction and centred on the position defined by the peak of the 2.6-mm continuum. The diagram is based on the combined data set of all CO(1-0) observations discussed in this paper. This merged data set has a beam size of 1.4 × 1.1 arcsec2 with a major axis orientation along PA = 52° and is shown at a spectral resolution of 40 MHz (105.8 km s−1) after continuum subtraction. Contours start at 4σ and increase in steps of 1σ.
DISCUSSION
CO(1-0) kinematics and BH mass
The CO(1-0) data for NGC 1277 are consistent with a scenario in which the CO(1-0)-emitting molecular gas is distributed in a ring corresponding to the dust lane (see Fig. 1). The double-horned line profile shown by the CO(1-0) emission in the more compact configuration (2.9-arcsec resolution) in Fig. 5 suggests that CO emission is detected from the full extent of the dust lane. In Figs 10 and 11, we compare the CO(1-0) line profile to model predictions for different gas distributions and BH masses, based on a realistic model of the mass distribution in the centre of NGC 1277. According to the data by van den Bosch et al. (2012), the half-light radius is 1 kpc, and the total stellar mass is 1.2 × 10¹¹ M⊙. The distribution of light is such that a maximum of circular velocity of 476 km s−1 is reached at a radius of 0.56 kpc, when the mass-to-light ratio is selected as M/LV = 6.3. This mass distribution corresponds also to the model of Emsellem (2013), although the peak velocity is now 600 km s−1, with a higher M/LV = 10. We therefore adopted for the rotational velocity due to the stars the curve labelled ‘no BH’ in fig. 4 of Emsellem (2013), corresponding to the best multi-Gaussian expansion fit of the light distribution. To this stellar contribution, we added a point mass with two different values, as shown in Figs 10 and 11. For the molecular gas, we first assume a nuclear ring, corresponding to the dust lane. The ring is modelled using a constant surface density between 0.8 and 1.2 arcsec radii, or between 0.28 and 0.42 kpc. Since this distribution does not allow us to sample the high velocities expected in the centre near the BH, we also consider another extreme molecular gas distribution, which is an exponential disc with a scale of r0 = 50 pc, ending also at 0.42 kpc. For these two molecular gas distributions, we test two values for the BH mass, the high value of 1.7 × 10¹⁰ M⊙ proposed by van den Bosch et al. (2012) and the lower value of 5 × 10⁹ M⊙ selected by Emsellem (2013), which is consistent with the most recent measurement by Walsh et al. (2016). The inclination of the gas disc is assumed i = 75°.
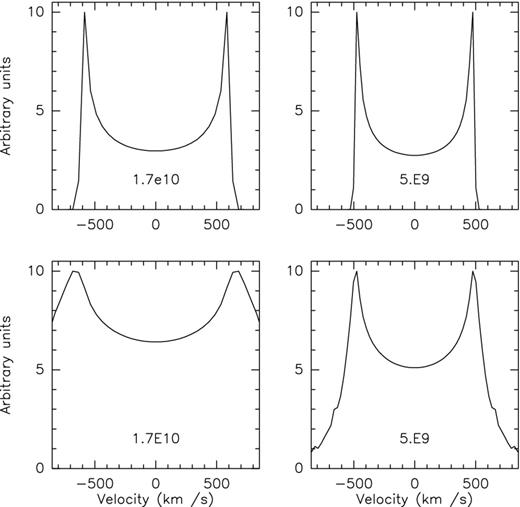
Molecular gas spectrum from the nuclear disc, computed assuming the van den Bosch et al. (2012) mass model for the stellar distribution with M/LV = 6.3, and a BH mass of 1.7 × 10¹⁰ M⊙ (left) and 5 × 10⁹ M⊙ (right). The top two spectra correspond to a gas distribution in a ring, with constant surface density between 0.28 and 0.42 kpc (or 0.8 and 1.2 arcsec), and the bottom two spectra to a gas distribution in an exponential disc of characteristic scale 50 pc.
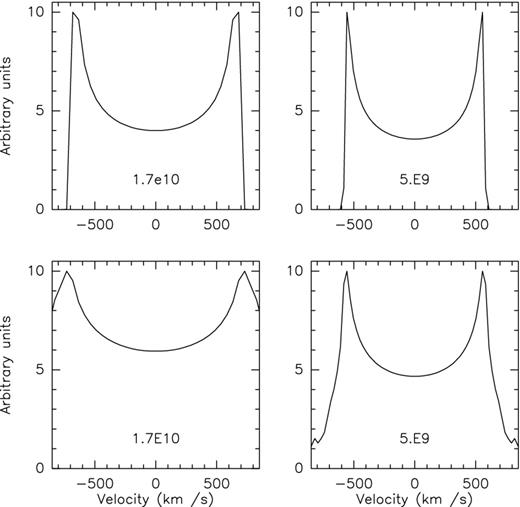
Same as Fig. 10, but now assuming M/LV = 10.
The simulation clearly shows that the most likely gas distribution is indeed the nuclear ring, corresponding to the dust lane. For the case of an exponential gas distribution, the velocity wings of the line are boosted, which is not observed. The ring-like gas distribution is also supported by the preliminary results for the underlying spatial and kinematic structure of the CO(1-0) emission, discussed in Section 3.3 and summarized in the form of the position–velocity diagram in Fig. 9. The emission components corresponding to the highest velocities around +530 and −530 km s−1 are most enhanced and show the strongest evidence for a spatial separation. Such a position–velocity diagram is expected for gas orbiting in an inclined ring, where the highest line-of-sight velocities coincide with the orbital nodes of the ring, i.e. the edges of the projected lane of gas. For a smooth gas distribution, these edges would, furthermore, be characterized by enhanced gas emission as a result of line-of-sight projection effects. On the contrary, for gas orbiting around a central point mass in an inclined exponential disc, the highest velocities and strongest emission would be found in the centre.
If the molecular gas is distributed in the dust lane, the rotational velocities probe the total enclosed mass. The two horns of the observed CO(1-0) profile in Fig. 5 are roughly located at V = +530 and −530 km s−1 with respect to the systemic velocity of NGC 1277. For an inclination of i = 75°, this corresponds to a rotational velocity of Vrot = V/cos (90° − i) ≈ 550 km s−1. The enclosed mass is given by |$M_\mathrm{enc}= (V_\mathrm{rot}^2 r)/G$|, where r is the distance of the gas from the BH and G is the gravitational constant. Using a distance of r ∼ 320 pc (0.9 arcsec), corresponding to the radius of the dust lane, the resulting total enclosed mass is Menc ∼ 2 × 10¹⁰ M⊙. The models in Figs 10 and 11 provide a more detailed analysis by distinguishing the stellar and BH mass contributions. Compared to the line profile in Fig. 5, the best model for M/LV = 6.3 (Fig. 10) appears to be the top left one, supporting the high mass for the BH. For M/LV = 10 (Fig. 11), the width of the observed CO(1-0) spectrum can also be reproduced by the 5 × 10⁹ M⊙ BH (top right panel). We conclude that the observed CO(1-0) line profile is consistent with a 1.7 × 10¹⁰ M⊙ BH, while a lower mass of 5 × 10⁹ M⊙ is likewise possible, if the underlying mass distribution is characterized by M/LV = 10.
In the data at 1-arcsec spatial resolution, the only clear CO(1-0) detection is associated with the pronounced kinematic component around +530 km s−1. This emission peak is found to be offset by ∼0.6 arcsec largely to the east of the 2.6-mm continuum peak. It could originate from a molecular gas clump close to the eastern orbital node of the dust lane. As discussed in Section 3.3, we also find marginal evidence of a CO(1-0) emission peak on the opposite side of the 2.6-mm continuum peak associated with similar absolute, but blueshifted, velocities. This emission may originate from a region close to the western orbital node of the dust lane. The H2 masses derived for the eastern and western emission peaks are ∼2 × 10⁷ and ∼1 × 10⁷ M⊙, respectively (see Table 2). These values are at the upper end of the gas masses found for the most massive giant molecular clouds in the Milky Way (e.g. Murray 2011). In addition to the molecular cloud scenario, it is also possible that the peaks are enhanced by line-of-sight crowding effects, which would be expected around the orbital nodes of an inclined ring model. The above interpretation, in which the CO(1-0) peaks are associated with the orbital nodes of the dust lane, is highlighted in comparison to the HST image in Fig. 12. While a blind comparison between the millimetre data and the HST image is subject to the astrometric uncertainty of ∼0.3 arcsec in the HST image, the astrometry in this figure has been adjusted by hand in order to align the 2.6-mm continuum peak with the optical galaxy nucleus.
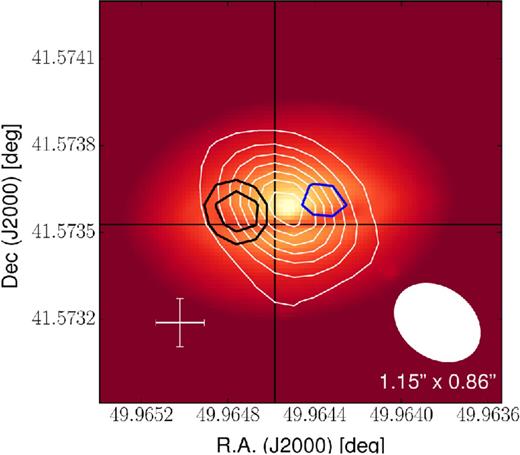
Overlay of the CO(1-0) line and 2.6-mm continuum emission found at 1-arcsec spatial resolution and the HST image. For this overlay, the astrometry of the HST image has been adjusted by hand in order to match the scenario, in which the 2.6-mm continuum peak is associated with the optical galaxy nucleus. The HST image is shown in colour scale. The 2.6-mm continuum contours (white) and the contours for the two CO(1-0) peaks (black and blue) are the same as in Fig. 8. The size and orientation of the beam corresponding to the continuum and CO(1-0) map is indicated in the lower right corner. The error bar in the lower left corner shows the estimated uncertainty of ±0.3 arcsec in the absolute astrometry of the HST image.
The molecular gas as a reservoir for star formation
The CO(1-0) emission discussed here indicates a reservoir of molecular gas in the central region of NGC 1277, which can potentially fuel star formation. The H2 mass of 1.5 × 10⁸ M⊙ (Table 2) corresponding to the double-horned profile seen at 2.9-arcsec resolution is in good agreement with the typical H2 masses found for early-type galaxies from ATLAS3D (Young et al. 2011), but lower than the integrated H2 masses found for dust-lane early-type galaxies (4 × 10⁸ to 2 × 10¹⁰ M⊙, Davis et al. 2015). A rough estimate of the mean surface density of the 1.5 × 10⁸ M⊙ of molecular gas in NGC 1277 results in about 500 M⊙ pc−2. According to the Kennicutt–Schmidt relation (Schmidt 1959; Kennicutt 1998), this could imply a star formation rate density of ∼0.5 M⊙ yr−1 kpc−2 and an integrated star formation rate of the order of 0.1 M⊙ yr−1. For this estimate, the size of the molecular gas reservoir and star formation region is assumed to be the ring confined to radii between 0.8 arcsec and 1.2 arcsec, consistent with the model presented in Section 4.1. However, the exact dimensions of the ring are unknown, so that this estimate involves large uncertainties. In addition, it also has to be taken into account that the mean gas surface density may not be a good representation of the actual surface density, since the gas distribution could be clumpy. Further insights into the clumpiness of the gas distribution could be obtained from high-resolution observations. However, based on the current sensitivity limit of the data obtained at 1-arcsec resolution, it remains unclear whether the observed CO(1-0) emission peaks rather originate from giant molecular clouds or from line-of-sight projection effects.
The FUV emission in star-forming regions is dominated by young (≲100 Myr) massive stars. Therefore, the star formation history derived from optical spectra may not be sufficiently sensitive to a low level of recent star formation with a rate of a few 0.1 M⊙ yr−1 in a stellar population otherwise dominated by old stars. The stellar population properties based on optical spectra for NGC 1277 indicate a uniformly old ≳10 Gyr stellar population (van den Bosch et al. 2012; Trujillo et al. 2014; Martín-Navarro et al. 2015). Furthermore, the optical spectra presented by Martín-Navarro et al. (2015) in their Fig. 2 do not provide any strong evidence of H α emission as an indicator of active star formation. By visual inspection, the figure only shows a possible emission peak close to the H α wavelength in the nuclear averaged spectrum, which could be associated with weak emission from ionized gas.
Since the above estimates for the star formation rate in NGC 1277 involve large uncertainties, we also have to consider the possibility that star formation is suppressed despite the presence of a 1.5 × 10⁸ M⊙ reservoir of molecular gas. Shear can have a disruptive effect on star formation by altering the collapse and fragmentation of molecular clouds (e.g. Hocuk & Spaans 2011; Dobbs & Pringle 2013). High shear has been discussed as a possible explanation for the lower star formation efficiency with respect to the Kennicutt–Schmidt relation, displayed by early-type galaxies from the ATLAS3D sample (Davis et al. 2014). In the steeply rising gravitational potential towards the centre of NGC 1277, shear can potentially play a role in preventing efficient star formation in molecular clouds in the region of the dust lane.
Active star formation would tend to lower the V-band stellar mass-to-light ratio compared to a uniformly old stellar population. As discussed in Section 4.1, a tendency towards a lower M/LV would be in favour of a larger BH mass, because the required velocity width of the CO(1-0) line profile can only be reproduced when compensating the smaller stellar mass contribution with a larger central BH mass (see Figs 10 and 11). However, recent observational data are rather in support of a high mean stellar mass-to-light ratio in the central region. Based on optical long-slit spectra obtained in 0.8-arcsec seeing, Martín-Navarro et al. (2015) suggest that the stellar mass-to-light ratio in NGC 1277 increases towards the nucleus. These data are limited in spatial resolution and lack detailed information on the run of the stellar mass-to-light ratio inside the region encompassed by the dust lane. The innermost off-nuclear radial bin in their data roughly corresponds to the radius of the dust lane. A high stellar V-band mass-to-light ratio of M/LV = (9.3 ± 1.6) for the central 1.3 arcsec in NGC 1277 has also been reported by Walsh et al. (2016), based on high-spatial-resolution near-infrared integral field spectroscopy. This value is derived from stellar-dynamical models assuming a constant mass-to-light ratio, so that possible radial variations in the mass-to-light ratio are not traced.
Origin of the 2.6-mm continuum emission
The 2.6-mm continuum flux of NGC 1277 of (5.6 ± 0.2) mJy could be associated with star formation or with an AGN-related radio jet. In order to discuss the origin of this continuum emission, we show the 2.6-mm continuum flux together with the infrared-to-radio spectral energy distribution of NGC 1277 in Fig. 13. The analysis of the spectral energy distribution is likely to involve uncertainties given that the composite is based on an inhomogeneous data set. Furthermore, the significance of the models discussed in the following is limited by the small number of published data at radio frequencies. To our knowledge, the only published data in the radio domain are the 1.4 and 5 GHz detections of 2.85 and 1.6 mJy, respectively, reported by Sijbring (1993), who found the radio source to be unresolved in the corresponding 13 × 19 arcsec2 and 3.5 × 5.2 arcsec2 beams.
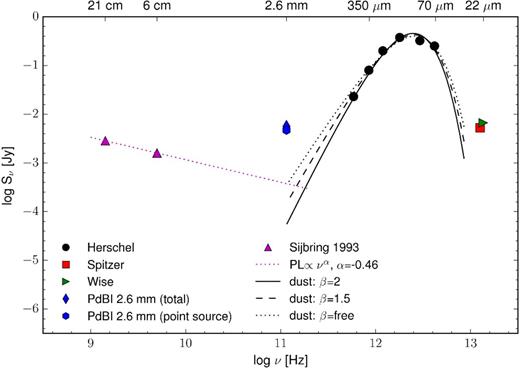
Infrared-to-radio spectral energy distribution of NGC 1277, together with an example model fit based on the far-infrared and radio data (see text for details). The infrared measurements are compiled based on data from Herschel, Spitzer, and Wise, as described in the text. For the 2.6-mm continuum measured in this work the figure shows both, the total aperture-integrated flux as well as the point source contribution discussed in Section 3.2. The 1.4 and 5 GHz fluxes are taken from Sijbring (1993). The solid, dashed, and dotted black lines show the fits for the dust component, assuming β = 2, β = 1.5, and a free β, as described in the text, extrapolated to 2.6 mm. The dotted (magenta) line connecting the 1.4 and 5 GHz data points shows the results from fitting a power-law Sν∝να to the 1.4 and 5 GHz fluxes.
Fig. 13 shows example models for the available data, based on the far-infrared and radio continuum, which underpredict the flux at 2.6 mm by about one order of magnitude. The infrared data include data from Herschel, Spitzer, and Wise. The Herschel photometry measurement was performed using the Herschel Interactive Processing Environment (HIPE) 13.0.0. The SPIRE fluxes are from SUSSEXtractor, while the results from the Timeline Fitter agree within a few per cent. The PACS fluxes are derived from aperture photometry with aperture correction included. We used the python code mbb_emcee to fit modified blackbodies to photometry data using an affine invariant Markov chain Monte Carlo (MCMC) method, with the Herschel passband response folded (Dowell et al. 2014). Assuming that all dust grains share a single temperature Td, that the dust distribution is optically thin, and neglecting any power-law component towards shorter wavelengths, the fit results in a temperature of Td/(1 + z) = (24.0 ± 0.8) K, a luminosity |$L_\mathrm{IR} (8\hbox{-}1000\ \mu \mathrm{m}) = (2.3\pm 0.2) \times 10^9\ \mathrm{L}_{\odot }$|, and a dust mass of Md = (2.6 ± 0.5) × 106 M⊙ for β = 2. For β = 1.5, the corresponding values are Td/(1 + z) = (27 ± 1) K, |$L_\mathrm{IR} (8\hbox{-}1000\ \mu \mathrm{m}) = (2.4\pm 0.2) \times 10^9\ \mathrm{L}_{\odot }$|, and Md = (1.3 ± 0.2) × 106 M⊙. We also performed a fit using a free β parameter, which results in Td/(1 + z) = (32 ± 5) K, |$L_\mathrm{IR} (8\hbox{-}1000\ \mu \mathrm{m}) = (2.4\pm 0.2) \times 10^9\ \mathrm{L}_{\odot }$|, Md = (9 ± 5) × 105 M⊙, and β = 1.1 ± 0.4. The dust temperatures are similar to the ones found for the cold-to-warm dust component in galaxies. The cold component (∼15–25 K) has been interpreted as diffuse dust heated by the general interstellar radiation field from young and/or old stellar populations, while the warmer component (∼30–40 K) is assumed to be associated with dust in star-forming regions heated by young O and B stars (e.g. Cox, Kruegel & Mezger 1986). The uniformly old stellar population of NGC 1277 identified via optical spectroscopy (van den Bosch et al. 2012; Trujillo et al. 2014; Martín-Navarro et al. 2015) is likely to provide heating of diffuse dust by the general interstellar radiation field. As discussed in Section 4.2, NGC 1277 may also host a low level of active star formation, which could contribute a warmer dust component. However, it is evident that the cold-to-warm dust component derived from the model in Fig. 13 can clearly not account for the continuum emission found at 2.6 mm.
The excess of the 2.6-mm continuum in Fig. 13 (both, when considering the total flux or only the point source contribution) with respect to the synchrotron-like radio continuum derived from the 1.4 and 5 GHz fluxes of NGC 1277 is about one order of magnitude. The 2.6-mm flux indicates an inverted spectral energy distribution from the radio to the millimetre regime, which cannot be fully explained by Sν ∝ ν−0.1 free–free emission from H ii regions (cf. Murphy et al. 2011) and rather suggests AGN emission. Some of this excess at 2.6 mm could be caused by variability or by extended non-thermal emission probed more prominently by the larger beam size corresponding to the 1.4 and 5 GHz data. Similarly inverted spectra have been found for a number of low-luminosity AGN and elliptical galaxies (Doi et al. 2005, 2011). These authors discuss the possibility that the strong flux at millimetre wavelengths is a signature of the accretion disc in an advection-dominated accretion flow (Ichimaru 1977). More data at radio and millimetre wavelengths will be required for a more stringent interpretation of the radio-to-millimetre spectral energy distribution of NGC 1277.
The presence of a weak AGN in NGC 1277 would be consistent with X-ray data. Fabian et al. (2013) find evidence for an unresolved power-law source with a 0.5–7 keV luminosity of 1.3 × 1040 erg s−1. A rough estimate indicates that an AGN producing the X-ray and the non-thermal radio emission would be in agreement with the known radio-X-ray correlations for AGN. The 6-cm (5 GHz) flux of S6 cm = 1.6 mJy from Sijbring (1993) corresponds to a luminosity of L6 cm = 5.5 × 1037 erg s−1. Using the 0.5–7 keV as an approximation for the 2–10 keV luminosity, the radio and X-ray fluxes are consistent with the radio-X-ray correlation, which is, e.g. shown by the corresponding projection of the Fundamental Plane of BH activity in Merloni, Heinz & di Matteo (2003, left-hand panel of their fig. 3).
Implications for gas accretion on to the BH
If NGC 1277 hosts a BH with a mass of ∼5 × 10⁹ to 1010 M⊙, this BH is overmassive compared to the value expected from the Fundamental Plane of BH activity (Merloni et al. 2003), assuming that the radio continuum as well as the X-ray power-law source are indeed associated with an AGN. According to the Fundamental Plane relation from Gültekin et al. (2009b), the 6-cm radio luminosity of 5.5 × 1037 erg s−1 (see Section 4.3) combined with an approximate 2–10 keV luminosity of 1.3 × 1040 erg s−1 (Fabian et al. 2013, and Section 4.3) suggests a BH mass of about 1 × 10⁸ M⊙, which is two orders of magnitude smaller than the BH mass of 1.3 × 10¹⁰ to 1.7 × 10¹⁰ M⊙ suggested by van den Bosch et al. (2012) and Yıldırım et al. (2015) and still significantly smaller than the revised BH mass measurement of (4.9 ± 1.6) × 109 M⊙ from Walsh et al. (2016).
There is evidence that the gas accretion on to the BH in NGC 1277 deviates from simple Bondi accretion. Based on the thermal gas detected within the Bondi radius, Fabian et al. (2013) show that the accretion luminosity expected from radiatively efficient Bondi accretion is 5–6 orders of magnitude more luminous than the observed X-ray power-law component. As pointed out in Section 4.3, a similar order-of-magnitude difference is suggested by the 6-cm flux from Sijbring (1993), which is consistent with the radio-X-ray correlation as one projection of the Fundamental Plane of BH activity (though for a much smaller BH). Why the observed X-ray luminosity of the central point source in NGC 1277 is much smaller than the one expected for radiatively efficient Bondi accretion, remains unclear. Fabian et al. (2013) suggest the possibility of a very radiatively inefficient accretion process. Alternatively, gas angular momentum may be responsible for lowering the accretion rate (Li, Ostriker & Sunyaev 2013).
The dust lane is likely to play an important role in impeding cold gas accretion. This has already been pointed out by Fabian et al. (2013), considering the high velocities in the dust lane that would be expected from the large BH mass. Our data support this picture, since the CO(1-0) detection is consistent with emission from a ring and shows the predicted high rotational velocities. While the gas in the dust lane may eventually loose angular momentum due to viscous processes and begin to spiral inward, the current lack of cold gas in the nuclear region may be the reason for the very low current BH accretion rate.
SUMMARY AND CONCLUSIONS
We have reported a detection of CO(1-0) emission from NGC 1277, probed at ∼1 and ∼2.9 arcsec spatial resolution, using the IRAM PdBI. The data indicate that the molecular gas is distributed in the ring of the dust lane encompassing the nucleus of NGC 1277 at a distance of 0.9 arcsec. Furthermore, the molecular gas shows high rotational velocities of ∼550 km s−1. This is suggested consistently by the low- and high-resolution data. The low-resolution data reveal a very broad, double-horned line covering a symmetric velocity range around the systemic velocity of NGC 1277, which appears marginally resolved in terms of kinematics in east–west direction. In the high-resolution data, the pronounced red horn of the double-horned profile, centred at ∼+ 530 km s−1, is detected with an offset of ∼0.6 arcsec to the east of the 2.6-mm continuum peak, while a marginal detection of kinematic components associated with the blue horn are found to the west of the continuum peak. The high rotational velocities of the molecular gas provide independent evidence for a central mass concentration of ∼2 × 10¹⁰ M⊙ inside the radius of the dust lane. This enclosed mass is large enough to potentially host an ultramassive BH as massive as reported by van den Bosch et al. (2012) and Yıldırım et al. (2015) based on stellar kinematics. Compared to models with realistic mass distributions for M/LV = 6.3, the spatially unresolved CO(1-0) line profile is consistent with the profile expected for the presence of a central 1.7 × 10¹⁰ M⊙ BH. However, a lower mass BH of 5 × 10⁹ M⊙, consistent with the revised measurement by Walsh et al. (2016), is also possible, if the stellar mass-to-light ratio is assumed to be M/LV = 10.
Future observations are required in order to further resolve this ambiguity in the gas-kinematic measurement. Tighter gas-kinematic constraints on the BH mass can be expected from sensitive observations at high angular resolution, by probing gas clouds as close as possible to the BH (i.e. the gas with the highest rotational velocities). If the molecular gas is indeed largely confined to a ring, such observations will ultimately be limited by the lack of gas in the vicinity of the BH. However, depending on the radial extent of the ring, gas kinematics from the innermost parts of the ring may already be sufficiently sensitive to the central gravitational potential to provide a clearer distinction between the BH mass and extended stellar mass contributions. A better knowledge of the stellar mass-to-light ratio in the circum-nuclear region could similarly improve the gas-kinematic BH mass constraints. Stellar absorption line studies for NGC 1277 have so far been limited in spatial resolution (see e.g. the discussion by Yıldırım et al. 2015), so that the detailed run of stellar mass-to-light ratio with radius inside the region encompassed by the dust lane remains uncertain. Recent results by Walsh et al. (2016) indicate a high stellar mass-to-light ratio of M/LV = 9.3 ± 1.6 for the central region of NGC 1277. This measurement is based on stellar-dynamical models assuming a constant mass-to-light ratio out to a radius of 1.3 arcsec (∼460 pc), which covers the full extent of the dust lane. This value would be in favour of an ∼5 × 10⁹ M⊙ gas-kinematic BH mass, in agreement with the stellar-dynamical mass derived by Walsh et al. (2016).
The strong underlying 2.6-mm continuum emission of NGC 1277 cannot be explained by the cold dust component seen in the far-infrared and appears to be in excess of the radio-to-millimetre spectral energy distribution expected for free–free emission from H ii regions. Based on literature X-ray and radio data, we suggest that the 2.6-mm continuum is caused by a weak AGN. The continuum is extended and shows marginal evidence of an extension to the south that could be related to a radio-jet.
If the BH in NGC 1277 is as massive as ∼5 × 10⁹ to ∼1.7 × 10¹⁰ M⊙, it appears to be an overmassive outlier with respect to the Fundamental Plane of BH activity as well as the MBH − Lsph,K-relation – although the latter may strongly depend on the details of the bulge-disc decomposition (Savorgnan & Graham 2016). It is likely that the peculiar properties of NGC 1277 are a result of its location in the environment of the Perseus Cluster. It has been suggested that the formation of ultramassive BHs may have proceeded rapidly in the early Universe, well before z ∼ 2–3 (Dubois et al. 2012; Fabian et al. 2013). Early BH growth in NGC 1277 is supported by the fact that NGC 1277 seems to currently lack any significant BH accretion. The offset from the MBH − Lsph,K-relation indicates that NGC 1277 has either lost a large part of its stellar mass or has not been able to acquire additional stellar mass and gas after an initial phase of star formation. Furthermore, the predominantly old stellar population, the currently small BH accretion rate, and the offset from the Fundamental Plane of BH activity suggest that NGC 1277 has been devoid of gas during its recent evolution. A stripping event in the cluster environment could have removed large parts of the gas and stellar mass, although this scenario has so far been regarded less likely (e.g. van den Bosch et al. 2012). If NGC 1277 has been moved off the MBH − Lsph,K-relation by tidal stripping, this implies that galaxies with ultramassive BHs have been close to, or in agreement with, this relation by z ∼ 2–3 and that ultramassive BHs have primarily evolved in lockstep with their host galaxies. Alternatively, as suggested by Fabian et al. (2013), NGC 1277 may have undergone quenching at high redshift and may have been prevented from acquiring further gas and stellar mass by its off-centre location in the Perseus Cluster, in contrast to central cluster galaxies which may have grown significantly through mergers. In this case, NGC 1277 would have neither experienced galaxy nor BH growth in its more recent evolution and may be a ‘relic’ galaxy (Trujillo et al. 2014), in terms of both, its stellar population and BH. This scenario has recently been explored in more detail by Ferré-Mateu et al. (2015). As these authors discuss, this scenario implies that the growth of ultramassive BHs may have preceded the growth of their host galaxies, so that all galaxies with ultramassive BHs may have been outliers from the BH-bulge luminosity (mass) relation by z ∼ 2–3, in a similar manner as still observed for NGC 1277 today. It is noteworthy that the BH in the central galaxy of the Perseus Cluster, NGC 1275, is significantly less massive than the one suggested for NGC 1277 (Scharwächter et al. 2013). As a possible explanation, Shields & Bonning (2013) proposed that NGC 1277 may have captured a massive BH that had originally grown in NGC 1275.
Regardless of which process may have led to this particular BH distribution in NGC 1275 and NGC 1277, it is evident that probing the most massive BHs in clusters will provide new insights into cluster formation and evolution. Given the very small number of confirmed ultramassive BHs to-date, future observations are required in order to better understand the growth of the most massive BHs and their host galaxies as well as the role of the cluster environment.
We thank the anonymous referee for a constructive report and interesting suggestions which have led to Section 4.2. This work is based on observations carried out under projects number X094 and W14DB with the IRAM Plateau de Bure Interferometer. IRAM is supported by INSU/CNRS (France), MPG (Germany) and IGN (Spain). We are grateful to the IRAM staff, especially Sabine König, for supporting the observations. JS and FC acknowledge the European Research Council for the Advanced Grant Program Num 267399-Momentum. This research has made use of the NASA/IPAC Extragalactic Database (NED) which is operated by the Jet Propulsion Laboratory, California Institute of Technology, under contract with the National Aeronautics and Space Administration. Some of the data presented in this paper were obtained from the Mikulski Archive for Space Telescopes (MAST). STScI is operated by the Association of Universities for Research in Astronomy, Inc., under NASA contract NAS5-26555. Support for MAST for non-HST data is provided by the NASA Office of Space Science via grant NNX09AF08G and by other grants and contracts.
NOTE ADDED IN PROOF
Based on a new bulge/disc decomposition and new stellar-kinematic data, Graham et al. (2016) propose that NGC 1277 might be brought back on the BH-to-host spheroid mass relation, albeit with a high M/LV = 12.3.
iraf is distributed by the National Optical Astronomy Observatories, which are operated by the Association of Universities for Research in Astronomy, Inc., under cooperative agreement with the National Science Foundation.
REFERENCES
