


Abstract
In this paper, assuming the validity of distance duality relation, η = DL(z)(1 + z)−2/DA(z) = 1, where DA(z) and DL(z) are the angular and the luminosity distance, respectively, we explore two kinds of gas mass density profiles of clusters: the isothermal β model and the non-isothermal double-β model. In our analysis, performed on 38 massive galaxy clusters observed by Chandra (within the redshift range of 0.14 < z < 0.89), we use two types of cluster gas mass fraction data corresponding to different mass density profiles fitted to the X-ray data. Using two general parameterizations of η(z) (phenomenologically allowing for distance duality violation), we find that the non-isothermal double-β model agrees better with the distance duality relation, while the isothermal β model tends to be marginally incompatible with the Etherington theorem at 68.3 per cent confidence level (CL). However, current accuracy of the data does not allow to distinguish between the two models for the gas-density distribution at a significant level.
1 INTRODUCTION
In this paper, we propose a new method to derive observed ηobs(z) parameter from the cluster gas mass fraction fgas = Mgas/Mtot inferred from X-ray data, and we use the assumption that DDR should be valid (i.e. η(z) = 1) to discuss appropriateness of two cluster gas mass density profiles assumed. More specifically, we use two data sets of cluster gas mass fraction derived from Chandra X-ray data (LaRoque et al. 2006) under two different assumptions about the gas mass density profiles: isothermal β model and non-isothermal double-β model.
In our analysis we consider two particular parameterizations of phenomenological η(z) dependence:(i) η = η0 + ηP1z; (ii) η(z) = η0 + ηP2z/(1 + z). The first expression is a linear parametrization equivalent to the first order Taylor expansion in redshift. The second one is inspired by the commonly used Chevalier-Polarski-Linder (CPL) parametrization for dark energy equation of state (Chevallier & Polarski 2001; Linder 2003) and is equivalent to the first order expansion in the scale factor a(t) which is the only gravitational degree of freedom in Freedman–Robertson–Walker cosmology. These two parametrizations have been extensively used to investigate the properties of dark energy in the literature (Cao et al. 2012; Cao & Zhu 2014; Cao et al. 2015). Assuming that the Etherington theorem is valid (which is quite reasonable assumption), the best-fitting value obtained with a given data set should be η0 = 1 and ηP = 0. Our results indicate that the non-isothermal double-β model tends to be more compatible with the reciprocity relation than the isothermal β model. This kind of result is an interesting example of how general principles (like DDR) could be used to assess the validity of assumptions concerning local physical conditions.
This paper is organized as follows. In Section 2, we introduce two samples of gas mass fraction data from 38 X-ray luminous galaxy clusters and their corresponding mass density profiles. Statistical method and constraint results on η(z) parameters are presented in Section 3. Finally, we summarize our main conclusions and make a discussion in Section 4.
2 GALAXY CLUSTER SAMPLES
The cluster gas mass fraction is defined as a ratio of the X-ray emitting gas mass to the total mass of a cluster, i.e. fgas = Mgas/Mtot. Gas mass Mgas is derived from the X-ray surface brightness while the total mass Mtot can be obtained by assuming that the gas is in hydrostatic equilibrium with the cluster Navarro-Frenk-White (NFW) potential. In order to perform appropriate calculations, one needs the gas mass density profile. Therefore, in our analysis aimed at constraining free parameters (η0, ηP) in general expression for η(z), we will use the gas mass fractions obtained with different gas mass density profiles.
In order to calculate ηobs from the data (according to equation (6) shown below) we use two sets of gas mass fraction fgas both derived from a sample of 38 luminous X-ray clusters with temperatures Tgas > 5 keV, observed by Chandra X-ray Observatory (LaRoque et al. 2006) located at redshifts from z = 0.14 to z = 0.89. In fact, LaRoque et al. (2006) presented results of their analysis using exclusively X-ray data (for isothermal β-model) and a combination of Chandra X-ray data and BIMA/OVRO interferometric radio SZE data for the double-β model. However, according to Holanda, Gonçalves & Alcaniz (2012), the gas mass fraction measurement via SZE depends only on the angular diameter distance, so it is insensitive to the validity of the DDR. Therefore, only the high resolution Chandra X-ray data are considered in our analysis. The above mentioned two sets of fgas were obtained within the most commonly used isothermal β model and under assumption of the non-isothermal double-β model, respectively.
Fig. 1 displays these data and their observational statistical uncertainties. We will also consider possible systematic uncertainties influencing the derived gas mass fraction following the discussion in (Bonamente et al. 2006) concerning their method of calculating the angular diameter distances of galaxy clusters. The effect of these systematical uncertainties on the gas mass fractions is summarized in table 3 of LaRoque et al. (2006). Note that the systematic difference between fgas derived from the isothermal β model and the double-β model still exists. From a purely statistical point of view, non-parametric Wilcoxon signed rank test reveals that difference between these two data sets is significant at the level of p = 0.0001. More specifically, the assumption of isothermality can potentially affect the gas mass fraction measurements by about (−5 per cent) through its effects on both gas mass and total mass. Therefore, an appropriate systematic uncertainty will be assigned to the gas mass fractions derived from the isothermal β model. In order to show the major sources of uncertainty in the present analysis, we display the ratio between systematic and statistical uncertainties for these data in Fig. 2.
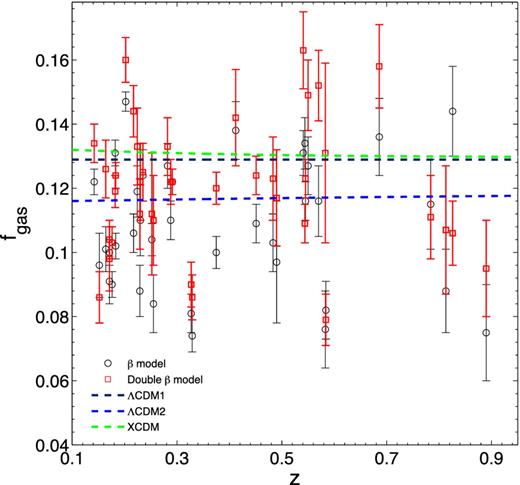
The cluster gas mass fraction data derived from a sample of 38 luminous X-ray clusters observed by Chandra X-ray Observatory (LaRoque et al. 2006). Black circles and red squares with the error bars correspond to the results obtained under the assumption of isothermal β model and non-isothermal double-β model, respectively. The predictions of fgas(z) under the assumption of DDR are also overplotted, for the three reference cosmologies (see Table 1) considered in this paper.
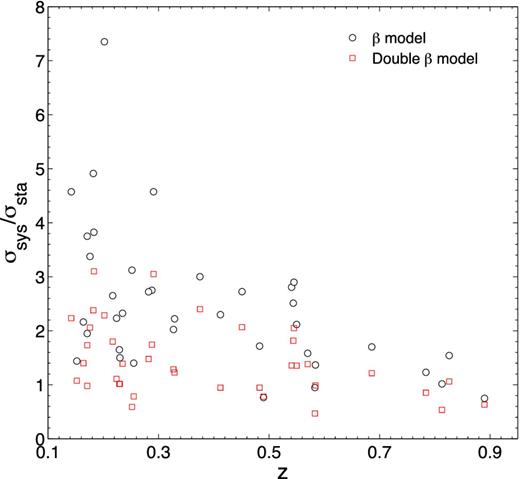
The ratio between systematic and statistical uncertainties for the cluster gas mass fraction data. Black circles and red squares with the error bars correspond to the results obtained under the assumption of isothermal β model and non-isothermal double-β model, respectively.
Let us now describe how we extracted the observed DDR parameter ηobs from the cluster gas mass fraction data. Massive galaxy cluster are the largest known bound systems in the Universe and are expected to provide a unique information of the matter content of the Universe. The baryonic-to-total mass ratio of clusters should closely match the ratio of Ωb/Ωm, where Ωb and Ωm are the present dimensionless density parameter of the baryonic matter and dust matter, respectively. Since the reconstructed fgas depends on the angular diameter distances at different redshifts, |$f_{{\rm gas}} \propto D_{A}^{1.5}(z)$|, a number of studies have used it to probe the acceleration of the Universe and thus the properties of dark energy (Allen et al. 2004, 2008; Ettori et al. 2009; Cao & Zhu 2014).
Parameters of three cosmologies considered: standard concordance ΛCDM model (ΛCDM1), ΛCDM best fitted to Planck data (ΛCDM1), XCDM model best fitted to Planck+WMAP9 data.
| Cosmology | Cosmological parameters |
|---|---|
| ΛCDM1 | Ωm = 0.30, H0 = 70.0 km s−1 Mpc−1 |
| ΛCDM2 | Ωm = 0.315, H0 = 67.3 km s−1 Mpc−1 |
| XCDM | Ωm = 0.294, w = −1.05, H0 = 70.4 km s−1 Mpc−1 |
| Cosmology | Cosmological parameters |
|---|---|
| ΛCDM1 | Ωm = 0.30, H0 = 70.0 km s−1 Mpc−1 |
| ΛCDM2 | Ωm = 0.315, H0 = 67.3 km s−1 Mpc−1 |
| XCDM | Ωm = 0.294, w = −1.05, H0 = 70.4 km s−1 Mpc−1 |
3 ANALYSIS AND RESULTS
We performed an Markov Chain Monte Carlo analysis and marginalized over the nuisance parameters (K, ϒ0, αϒ, ε) by multiplying the probability distribution functions and then integrating (Ganga et al. 1997). When DA(z) is calculated within the fiducial model (Ωm = 1 − ΩΛ, H0) = (0.30, 70 km s−1 Mpc−1) consistent with WMAP9 observations, we obtain the results shown in Table 2. Obviously both statistical and systematic uncertainties should be included in the analysis. Therefore they have been displayed explicitly in Table 2. In the case of the first parametrization η(z) = η0 + ηP1z, the best-fitting η parameters are η0 = 1.068 ± 0.133, ηP1 = −0.084 ± 0.187 (stat+sys) for the isothermal β model and η0 = 0.991 ± 0.117, ηP1 = −0.037 ± 0.147 (stat+sys) for the non-isothermal double-β model. One can see that gas mass fractions obtained from the non-isothermal double beta model, are in better agreement with the reciprocity relation (η0 = 1, ηP1 = 0). However, from the statistical point of view this preference is marginal.
Summary of the results for η(z) = η0 + ηP1z and η(z) = η0 + ηP2z/(1 + z), respectively, at 1σ confidence level for the β model and double-β model. The statistical and systematic uncertainties in η are shown separately. Two samples including the n = 38 full sample and the n = 29 sub-sample are used (see text for definitions). Source of cosmological priors are also given in brackets.
| β model: parameterizations (sample/cosmology) | η0 | ηP1 |
|---|---|---|
| η(z) = η0 + ηP1z (Full sample/ΛCDM1) | η0 = 1.068 ± 0.099(stat) ± 0.034(sys) | ηP1 = −0.084 ± 0.058(stat) ± 0.129(sys) |
| η(z) = η0 + ηP2z/(1 + z) (Full sample/ΛCDM1) | η0 = 1.080 ± 0.104(stat) ± 0.051(sys) | ηP2 = −0.148 ± 0.117(stat) ± 0.276(sys) |
| η(z) = η0 + ηP1z (Sub-sample/ΛCDM1) | η0 = 1.108 ± 0.115(stat) ± 0.033(sys) | ηP1 = −0.144 ± 0.075(stat) ± 0.312(sys) |
| η(z) = η0 + ηP1z (Sub-sample/ΛCDM2) | η0 = 1.028 ± 0.104(stat) ± 0.037(sys) | ηP1 = −0.127 ± 0.072(stat) ± 0.127(sys) |
| η(z) = η0 + ηP2z/(1 + z) (Sub-sample/ΛCDM2) | η0 = 1.060 ± 0.112(stat) ± 0.047(sys) | ηP2 = −0.276 ± 0.134(stat) ± 0.282(sys) |
| η(z) = η0 + ηP1z (Sub-sample/XCDM) | η0 = 1.242 ± 0.127(stat) ± 0.041(sys) | ηP1 = −0.265 ± 0.087(stat) ± 0.148(sys) |
| η(z) = η0 + ηP2z/(1 + z) (Sub-sample/XCDM) | η0 = 1.285 ± 0.135(stat) ± 0.052(sys) | ηP2 = −0.529 ± 0.166(stat) ± 0.305(sys) |
| Double-β model: parameterizations (sample/cosmology) | η0 | ηP2 |
| η(z) = η0 + ηP1z (Full sample/ΛCDM1) | η0 = 0.991 ± 0.102(stat) ± 0.015(sys) | ηP1 = −0.037 ± 0.060(stat) ± 0.087(sys) |
| η(z) = η0 + ηP2z/(1 + z) (Full sample/ΛCDM1) | η0 = 1.002 ± 0.104(stat) ± 0.027(sys) | ηP2 = −0.092 ± 0.114(stat) ± 0.178(sys) |
| η(z) = η0 + ηP1z (Sub-sample/ΛCDM1) | η0 = 0.981 ± 0.104(stat) ± 0.017(sys) | ηP1 = −0.023 ± 0.069(stat) ± 0.089(sys) |
| η(z) = η0 + ηP2z/(1 + z) (Sub-sample/ΛCDM1) | η0 = 0.996 ± 0.108(stat) ± 0.030(sys) | ηP2 = −0.078 ± 0.132(stat) ± 0.184(sys) |
| η(z) = η0 + ηP1z (Sub-sample/ΛCDM2) | η0 = 0.915 ± 0.095(stat) ± 0.018)(sys) | ηP1 = −0.015 ± 0.064(stat) ± 0.082(sys) |
| η(z) = η0 + ηP2z/(1 + z) (Sub-sample/ΛCDM2) | η0 = 0.924 ± 0.102(stat) ± 0.024(sys) | ηP2 = −0.049 ± 0.121(stat) ± 0.182(sys) |
| η(z) = η0 + ηP1z (Sub-sample/XCDM) | η0 = 1.101 ± 0.117(stat) ± 0.024(sys) | ηP1 = −0.139 ± 0.078(stat) ± 0.08(sys) |
| η(z) = η0 + ηP2z/(1 + z) (Sub-sample/XCDM) | η0 = 1.123 ± 0.121(stat) ± 0.027(sys) | ηP2 = −0.257 ± 0.143(stat) ± 0.196(sys) |
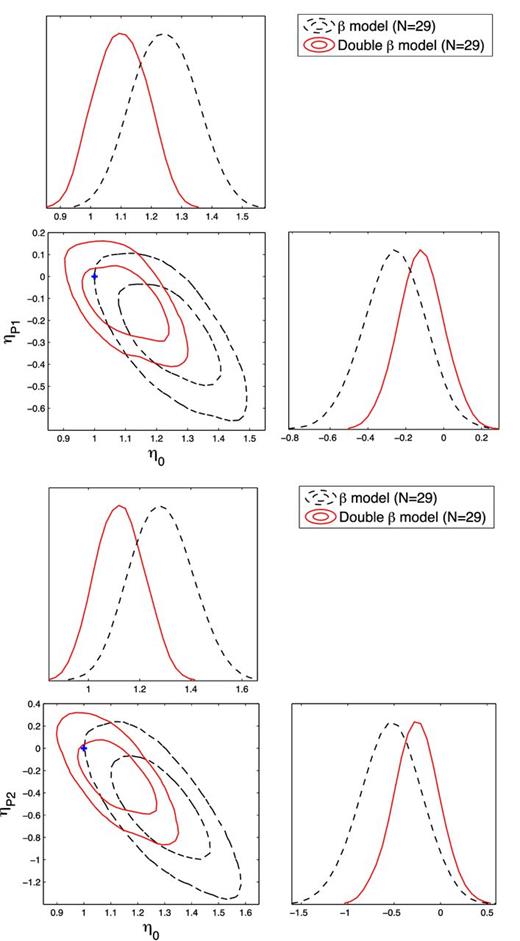
According to the findings of LaRoque et al. (2006), some objects: Abell 665, ZW 3146, RX J1347.5−1145, MS 1358.4 + 6245, Abell 1835, MACS J1423+2404, Abell 1914, Abell 2163, Abell 2204 have questionable reduced χ2. By excluding these objects from the full sample we obtained a sub-sample of 29 galaxy clusters, on which we performed a similar analysis. The results are displayed in Fig. 3. As compared with the previous case, one can see that the non-isothermal double-β model is in even much better agreement with the DDR (η0 = 0.981 ± 0.121, ηP1 = −0.023 ± 0.158; ± corresponds to 68.3 per cent CL) than the isothermal β model (η0 = 1.108 ± 0.148, ηP1 = −0.144 ± 0.387). When compared with the previous analysis, the incompatibility of the isothermal β-model with the validity of DDR is clearly more evident at 1σ, although the significance of this conclusion is not high enough from the statistical point of view.
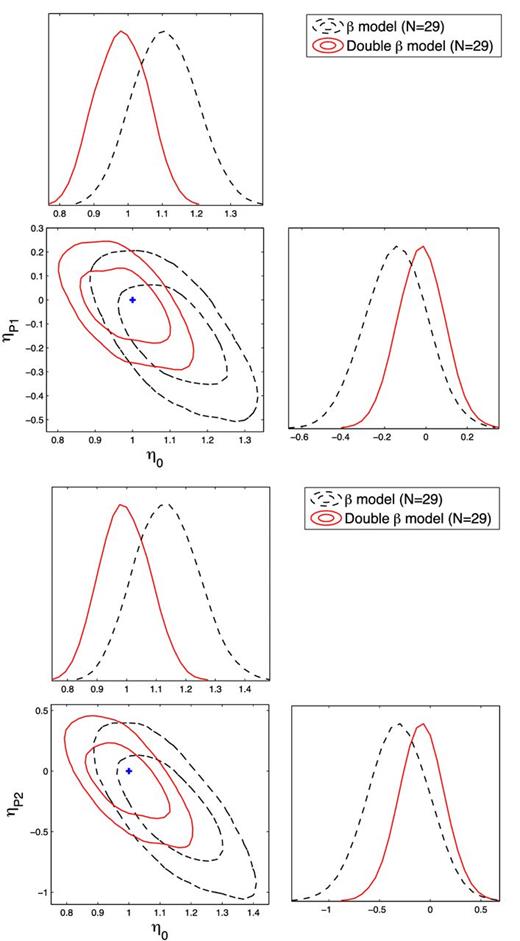
Confidence contours and marginalized likelihood distribution functions for the parameters in η(z) = η0 + ηP1z and η(z) = η0 + ηP2z/(1 + z) relation. Black dashed lines and red lines correspond to the fits obtained on the full n = 29 sub-sample under the assumption of isothermal β model and non-isothermal double-β model, respectively. The blue cross represents the expected case when the DDR holds exactly (η0 = 1, ηP1,2 = 0).
In the case of second parametrization η(z) = η0 + ηP2z/(1 + z), results for the n = 38 full sample and n = 29 sub-sample, are shown in Table 2. Respective confidence regions on the η0 − ηP2 plane and marginalized likelihood distributions for the parameters are shown in Fig. 3. As one can see the double-β model again seems to be favoured over the isothermal β-model.
As we already mentioned, one can contemplate other types of best-fitting ‘true’ cosmology instead of the standard concordance ΛCDM model. Therefore, we also considered the ΛCDM model but with parameters bets fitted to the Planck data. In this case, we only analysed the n = 29 sub-sample and the results are presented on Table 2 and Fig. 4. Moreover, since ΛCDM while useful has its own conceptual problems and might not be the ultimate model of the Universe, we have also considered quintessential XCDM model. In particular, we have taken its parameters (w, Ωm = 1 − ΩΛ, H0) = (−1.05, 0.294, 70.4 km s−1 Mpc−1) according to Cai et al. (2014) best fit to Planck+WMAP9 data. The results obtained with n = 29 sub-sample are presented in Table 2 and Fig. 5.
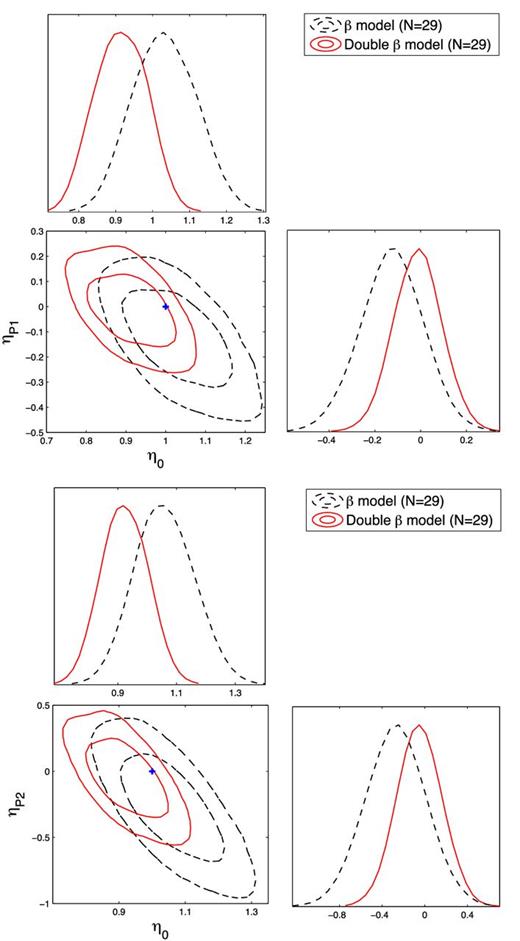
Confidence contours and marginalized likelihood distribution functions for the η parameters for the case when Planck best-fitting ΛCDM parameters were taken to represent a ‘true’ cosmology. Black dashed lines and red lines correspond to the fits obtained on the n = 29 sub-sample under the assumption of isothermal β model and non-isothermal double-β model. The blue cross represents the expected case when the DDR holds exactly.
The same as Fig. 4, but for the case when XCDM model was taken to represent a ‘true’ cosmology.
Even though, considering both statistical and systematic uncertainties, we find (at the level of best-fitting values) that isothermal β-model is incompatible with the validity of DDR at 1σ, it is difficult to distinguish these two density models by using fgas measurements. As discussed in (LaRoque et al. 2006), the results of fgas derived from models including the single-β model and double-β model fit to the X-ray data agree well enough to claim that the cluster core can be accounted for by either excluding it from the fit or modelling the gas with the double β-model.
We have also checked whether one can get tighter constraints on η (and hence gain more discriminative power concerning alternative density profiles) by fixing ηP = 0. The results are shown in Fig. 6. One can see that the two model density profiles are statistically compatible but again the double-β model looks better with the mode of the likelihood coinciding with the DDR expectation η = 1.
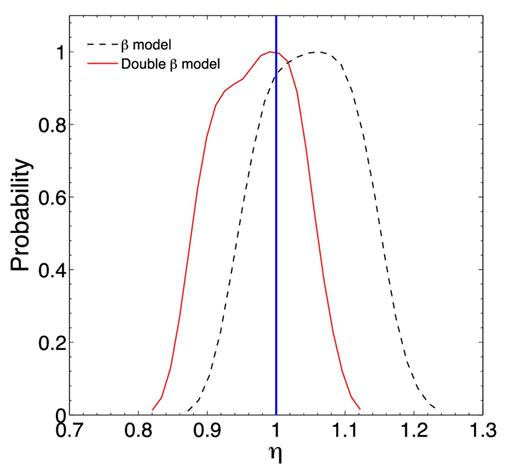
Likelihood functions for η parameter corresponding to the isothermal β model (black dashed line) and non-isothermal double-β model (red continuous line). Results are obtained with the n = 29 sub-sample of clusters. WMAP9 best-fitting ΛCDM parameters were taken to represent a ‘true’ cosmology. The blue vertical line represents the expected case when the DDR holds exactly.
4 CONCLUSIONS
Clusters of galaxies are the largest virialized objects in the Universe. Therefore, they can serve as excellent probes of cosmology: their number density can be predicted and tested against observations. More than that, combined X-ray and Sunyaev–Zeldovich observations can in principle be used to measure absolute distances to the clusters and to test cosmology (the Hubble constant, dark energy etc.). However, for cosmological applications we need to have at least a reliable ‘proxy’ for the gas mass distribution in clusters and this is otherwise known to be complicated (e.g. from strong and weak lensing studies). So we need to compromise by making assumptions like isothermal β model or its ‘offspring’ – the non-isothermal double-β model. In this paper, we addressed the question of which of these two proxies is more supported by the data.
Our judgement was based on the assumed validity of the DDR — the DDR (for which there are good reasons to believe that it's true). To be specific, we have studied two samples of cluster gas mass fraction data obtained from 38 X-ray luminous galaxy clusters observed by Chandra in the redshift range 0.14 ∼ 0.89 (LaRoque et al. 2006) the full sample and its n = 29 sub-sample produced by excluding some ‘suspect’ clusters.
Bearing in mind, that in practice some systematic effects might disturb the DDR relation, we parametrized it in two ways: η(z) = η0 + ηP1z and η(z) = η0 + ηP2z/(1 + z). Then we checked which of the two ‘proxy’ models for gas mass distribution (isothermal β-model and non-isothermal double β-model) performs better. Our result is that within standard concordance cosmology (ΛCDM1) double-β model is marginally better respecting the DDR (at 1 σ level). If one takes instead ΛCDM parameters best fitted to Planck data, both models are compatible. However, within the quintessential XCDM cosmology double-β model is preferred at 2σ level. The preference of the double-β model over isothermal β model can be best seen on marginalized distributions of η0, ηP parameters where it shows up irrespectively of the cosmology assumed.
We conclude by saying that as the cluster sample size increases with upcoming X-ray cluster surveys, we hope the method proposed in this paper may prove useful to improve the constraints on cluster gas mass density profiles.
The authors are grateful to the referee for very useful comments that allowed us to improve the paper. This work was supported by the Ministry of Science and Technology National Basic Science Program (Project 973) under Grant Nos. 2012CB821804 and 2014CB845806, the Strategic Priority Research Program ‘The Emergence of Cosmological Structure’ of the Chinese Academy of Sciences (No. XDB09000000), the National Natural Science Foundation of China under Grant Nos. 11503001, 11373014 and 11073005, the Fundamental Research Funds for the Central Universities and Scientific Research Foundation of Beijing Normal University, and China Postdoctoral Science Foundation under grant no. 2015T80052 and the Opening Project of Key Lab of Computational Astrophysics of Chinese Academy of Science. This research was also partly supported by the Poland-China Scientific & Technological Cooperation Committee Project No. 35-4. MB obtained approval of foreign talent introducing project in China and gained special fund support of foreign knowledge introducing project.
REFERENCES
