-
PDF
- Split View
-
Views
-
Cite
Cite
N. B. Tyndall, C. A. Ramsbottom, C. P. Ballance, A. Hibbert, Valence and L-shell photoionization of Cl-like argon using R-matrix techniques, Monthly Notices of the Royal Astronomical Society, Volume 456, Issue 1, 11 February 2016, Pages 366–373, https://doi.org/10.1093/mnras/stv2637
Close - Share Icon Share
Abstract
Photoionization cross-sections are obtained using the relativistic Dirac Atomic R-matrix Codes (darc) for all valence and L-shell energy ranges between 27 and 270 eV. A total of 557 levels arising from the dominant configurations 3s23p4, 3s3p5, 3p6, 3s23p3[3d, 4s, 4p], 3p53d, 3s23p23d2, 3s3p43d, 3s3p33d2 and 2s22p53s23p5 have been included in the target wavefunction representation of the Ar iii ion, including up to 4p in the orbital basis. We also performed a smaller Breit–Pauli (bp) calculation containing the lowest 124 levels. Direct comparisons are made with previous theoretical and experimental work for both valence shell and L-shell photoionization. Excellent agreement was found for transitions involving the 2Po initial state to all allowed final states for both calculations across a range of photon energies. A number of resonant states have been identified to help analyse and explain the nature of the spectra at photon energies between 250 and 270 eV.
1 INTRODUCTION
The complex process of photoionization in such fields as plasma physics and astrophysics is of ongoing interest. Photoprocesses are clearly evident in astrophysics for spectral modelling. However, hydrogenic approximations are often employed where data is absent or incorrectly formatted (Jerkstrand et al. 2012). The Opacity Project (OP) (Cunto & Mendoza 1992; Cunto et al. 1993) provides one source for photoionization cross-sections which are often beneficial, but generally more sophisticated calculations need to be performed. A relativistic approach can offer an accurate level resolved spectra, allowing detailed comparisons to be carried out between experiment and theory (Müller et al. 2002, 2009).
Experiments have recently and are currently being performed for inner shell transitions. Examples of the excellent agreement achieved between theory and experiment has been noted for the lighter systems B2+ and N+ (Müller et al. 2010; Gharaibeh et al. 2011) during K-shell photoionization. In addition, poor agreement at higher photon energies was found between OP results and experimental photoionization cross-sections for C+ (Kjeldsen et al. 2001). This reinforces the need to conduct sophisticated R-matrix calculations on high-performance computing facilities to match advancements in experimental technologies.
We focus in this paper on the photoionization of Ar ii. The strong λ7135 Å line (from the neighbouring ion stage Ar iii), which is a consequence of the forbidden transition 1D2 → 3P2 within the ground state complex 3s23p4, has been measured in a number of planetary nebula (Aller & Keyes 1987). It has also been suggested that argon be used as a metal abundance indicator for spectral diagnostics (Barker 1980). This intense line has been observed in the binary of η Carinae and used to model wind interaction within the system (Gull et al. 2009). Specifically, there has been work adopting the line ratio (Ar iii λ7135 Å)/(O iii λ5007 Å) to determine oxygen abundance in H ii and star-forming regions (Stasińska 2006). Another useful application is in the analysis of the ionic/elemental abundances of Ar2 +/Ar in three H ii regions using data recorded from Spitzer (Lebouteiller et al. 2008).
A number of lines have also been detected using beam-foil techniques in the wavelength region λ500–λ1000 Å (Pinnington, Curnutte & Dufay 1971), theta pinch experiments (Hansen & Persson 1987) for the optical region, and also through capillary-discharge tube experiments (Luna et al. 2000). A compilation of weighted oscillator strengths have been evaluated through a Multi-Configuration Hartree-Fock mchf approach in two separate cases (Luna et al. 2001; Froese Fischer, Tachiev & Irimia 2006). Many of these transitions are only accessible by including the 3d and n = 4 complex orbitals and retention of these are critical for subsequent calculations.
Lowly ionized argon systems, and even neutral argon have been studied with scrutiny due to their importance as mentioned above. We focus on the work that has been carried out by Covington et al. (2011) and Blancard et al. (2012), which consider the photoionization process involving Ar+. Both works include experimental and theoretical calculations.
Covington et al. (2011) have computed absolute cross-sections for the valence shell photoionization up to photon energies of 60 eV for the statistically weighted, ground state complex only. All experimental results are obtained from the merged beam technique that has been carried out at the Advanced Light Source (ALS) with a spectral resolution of 10 meV. In contrast, Blancard et al. (2012) have investigated photoionization at the L-shell between an energy range of 240–282 eV for multiple ion stages of argon. The experiment has been conducted at SOLEIL in France to a larger spectral resolution of 140 meV and directly compares with mchf and opas calculations detailed therein. The experimental procedure is similar to that mentioned above, with the photon beam produced by a magnet undulator on the PLEIADES line, merged with various argon ion beams.
This paper details single photon valence shell and L-shell photoionization processes, comparing with previous work where appropriate. The remainder of this paper shall be structured as follows. Section 2 discusses the structure calculation in preparing a model for Ar iii, Section 3 contains a brief overview on R-matrix theory applied to photoionization and Section 4 presents the results obtained and discussions. Finally, in Section 5, we summarize our findings in the conclusions.
2 STRUCTURE MODEL
2.1 Breit–Pauli approach
We employed an analytic Slater-type orbital description for the bound orbitals up to 3p from the tables of Clementi & Roetti (1974). The computer package civ3 was then utilized to extend this basis expansion by including the 3d, 4s, 4p and 4d orbitals. These additional orbitals have been optimized in an LSπ coupling scheme on the lowest quintet states of the configurations 3s23p3[3d, 4s, 4p, 4d], respectively. A total of 124 Jπ levels were included in the basis set with configurations from 3s23p4, 3s3p5, 3p6 and 3s23p3[3d, 4s, 4p, 4d]. Configuration-interaction terms are also included to account for additional correlation in each wavefunction. These configuration-interaction expansions of the target wavefunctions employ a Breit–Pauli approach through one body perturbative corrections to the non-relativistic Hamiltonian operator. These corrections are described in full in the literature (Scott & Burke 1980) and carried through to be used consistently in the Breit–Pauli (PBP) R-matrix method. This, the first of our Ar iii models, is labelled in Table 1 as PBP.
The list of calculations performed throughout this paper are recorded and indexed for reference in the first column. The configurations and levels associated are also retained.
| . | Number of . | Configurations . |
|---|---|---|
| Calculation . | levels . | included . |
| PBP | 124 | 3s23p4, 3s3p5, 3p6, 3s23p33d |
| 3s23p3[4s, 4p, 4d] | ||
| DARC1 | 209 | 3s23p4, 3s3p5, 3p6, 3s23p33d |
| 3s23p3[4s, 4p] + | ||
| 3s23p23d2 + 3p53d | ||
| DARC2 | 257 | DARC1 + |
| 3s23p3[4d, 5s] | ||
| DARC3 | 557 | DARC1 + |
| 3s3p43d + 3s3p33d2 | ||
| + 2s22p53s23p5 |
2.2 Relativistic approach
Unlike in civ3 where we optimize the additional orbitals on the lowest lying states of the respective configuration, grasp0 considers the optimization process on every state included in the calculation, unless specified otherwise by the user.
Initially we have included the important configurations 3s23p4, 3s3p5, 3p6, 3s23p3[3d, 4s, 4p], 3p53d and 3s23p23d2, which gives rise to 209 levels. This model is labelled as DARC1 in Table 1. We augment this model with the inclusion of the 3s23p3[4d, 5s] configurations in DARC2 raising the number of levels to 257. The reason to perform this slightly larger evaluation was to test whether the inclusion of these high lying nl = 4d and 5s levels affect the convergence of the photoionization cross-section, or whether their contribution could be deemed negligible. An accurate representation for the low-lying wavefunctions of the residual ion is always of major importance for photoionization calculations. In an attempt to further improve correlation effects we perform a final relativistic evaluation, in which we include the additional 3s3p43d levels (mixing with 3s23p4 and have the effect of lowering the relative 3P2 ground energy), as well as all levels with configuration 3s3p33d2 which improve the odd parity levels. The configuration 2p53s23p5 has also been incorporated into the expansion of Ar iii as it allows us to extend our evaluations to L-shell photoionization and results in an additional 10 levels. We label this, our largest Ar iii model, as DARC3 in Table 1 containing 557 individual fine-structure levels.
We present in Table 2 the energy levels (in eV) relative to the Ar iii ground state for the lowest 14 fine-structure levels for this ion. We directly compare the ab initio energies from the PBP, DARC1, DARC2 and DARC3 evaluations with two theoretical R-matrix works (Munoz Burgos et al. 2009; Stancalie et al. 2012), both of which performed electron-impact excitation evaluations and generated their basis set for Ar iii with the autostructure (Badnell 1986), adapted from the original superstructure (Eissner, Jones & Nussbaumer 1974), computer package. Comparisons are also made with the recorded NIST levels compiled by Saloman (2010) which incorporates designations from observed spectral analysis of existing works.
Energies and assignments for the lowest 14 levels of the Ar iii system presented in eV. Stancalie, Pais & Mihailescu (2012) and Munoz Burgos et al. (2009) are theoretical R-matrix results for electron impact excitation calculations, and the NIST results are observational data taken from Saloman (2010). The remaining results are the present works summarized in Table 1.
| . | . | . | . | Present . | Stancalie . | Burgos . | |||
|---|---|---|---|---|---|---|---|---|---|
| Index . | Configuration . | Level . | NIST . | PBP . | DARC1 . | DARC2 . | DARC3 . | et al. . | et al. . |
| 1 | 3s23p4 | 3P2 | 0.0000 | 0.0000 | 0.0000 | 0.0000 | 0.0000 | 0.0000 | 0.0000 |
| 2 | 3s23p4 | 3P1 | 0.1379 | 0.1498 | 0.1391 | 0.1391 | 0.1367 | 0.1325 | 0.1306 |
| 3 | 3s23p4 | 3P0 | 0.1947 | 0.2119 | 0.1952 | 0.1952 | 0.1942 | 0.1895 | 0.1864 |
| 4 | 3s23p4 | 1D2 | 1.7370 | 2.0093 | 2.1402 | 2.1402 | 2.0423 | 1.9266 | 2.0245 |
| 5 | 3s23p4 | 1S0 | 4.1244 | 4.3337 | 3.4318 | 3.4318 | 4.2673 | 4.3089 | 3.8654 |
| 6 | 3s3p5 | 3P2 | 14.1095 | 14.1116 | 14.1877 | 14.0961 | 13.9520 | 13.9529 | 13.6370 |
| 7 | 3s3p5 | 3P1 | 14.2331 | 14.2461 | 14.3136 | 14.2219 | 14.0752 | 14.2220 | 13.7526 |
| 8 | 3s3p5 | 3P0 | 14.2988 | 14.3164 | 14.3793 | 14.2877 | 14.1394 | 14.1490 | 13.8125 |
| 9 | 3s3p5 | 1P1 | 17.8565 | 18.4640 | 18.2749 | 18.2060 | 18.1696 | 17.4928 | 17.7255 |
| 10 | 3s23p33d | 5D0 | – | 18.2182 | 18.0206 | 18.0102 | 17.6992 | – | – |
| 11 | 3s23p33d | 5D1 | 17.9635 | 18.2203 | 18.0211 | 18.0107 | 17.6996 | 17.5912 | 17.9119 |
| 12 | 3s23p33d | 5D2 | 17.9642 | 18.2243 | 18.0220 | 18.0116 | 17.7005 | 17.5908 | – |
| 13 | 3s23p33d | 5D3 | 17.9650 | 18.2306 | 18.0233 | 18.0130 | 17.7019 | 17.3458 | 17.9214 |
| 14 | 3s23p33d | 5D4 | 17.9667 | 18.2394 | 18.0255 | 18.0152 | 17.7040 | 17.5911 | 17.9296 |
All of the present calculations agree extremely well when compared with NIST, but the results from the DARC3 model give best overall agreement across the 14 levels considered. Differences of less than 4 per cent are found for all energy separations with the exception of the 3s23p4 1D2 state where a difference of 15 per cent is recorded. This level of disparity is evident, however, for all the theoretical predictions listed. Due to the sophistication of the DARC3 model and the fact that it allows us to investigate L-shell photoionization, it is this model that we incorporate primarily into our collision calculations.
3 THE PHOTOIONIZATION CALCULATIONS
The R-matrix box was set at 13.28 a. u., which was sufficient to encompass our most diffuse orbital, the 4p. We also require 22 continuum orbitals to describe the outgoing electron at energies just above the L-shell. To ensure all resonant features have been properly resolved, a fine mesh of 60 000 points across the lower energy range 27–60 eV has been adopted, with similar increments for the L-shell energy region. Both length and velocity forms of the dipole moment operator in equation (3) are in suitable agreement when describing the photoionization cross-section. Up to 45 eV the difference in results is within 20 per cent and therefore all results are provided in the length gauge.
4 RESULTS
Before embarking on the large-scale DARC3 calculation, we thought it prudent to investigate first the important properties and characteristics found in the photoionization cross-section of Ar ii in its ground state. In Fig. 1, we present the total photoionization cross-section in Mb on a logarithmic scale as a function of photon energy in eV, from the initial ground Ar ii2P|$^{\rm {o}}_{3/2}$| state to all allowed final states. Three calculations are presented in this figure; both the 209 level DARC1 and its contributions from the 3s23p4 levels indexed as 1–5 in Table 2 and the extended 257 level DARC2 calculation. Clearly Fig. 1 shows the importance of including at least the first five 3s23p4 levels of Ar iii in this photoionization calculation. The contributions from these levels dominates the total cross-section up to a photon energy of approximately 50 eV and all three calculations exhibit excellent agreement up to this point. It is essential, therefore, that an accurate description is achieved for the wavefunction representation of those low-lying levels. Above 50 eV the additional levels associated with the more complex DARC1 and DARC2 models come into play and the cross-section rises as we move to higher photon energies as more channels become accessible. Interestingly, the inclusion of the additional 3s23p34d and 3s23p35s levels in the DARC2 model has little or no effect on the photoionization cross-section produced by the DARC1 model up to 60 eV, both data sets showing near perfect agreement. Therefore we do not retain these additional 3s23p34d and 3s23p35s configurations in our largest DARC3 calculation as can be seen from Table 1.
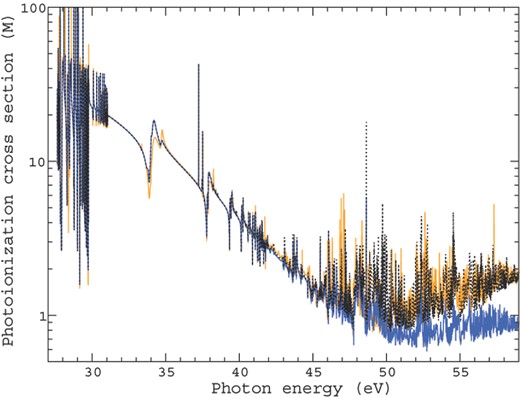
Photoionization cross-section from the initial 2P|$^{\rm {o}}_{3/2}$| to allowed final states given in Mb on a logarithmic scale against the photon energy in eV. The dashed black line represents the result from DARC1, the solid blue line is the contribution from levels indexed 1–5 in Table 2, and the solid orange line is the extension to DARC2.
4.1 Valence shell photoionization
The only available data currently in the literature for valence shell photoionization of Ar ii up to photon energies of 60 eV is performed by Covington et al. (2011). In this paper, both theoretical and experimental cross-sections are presented. Absolute cross-sections are obtained from the merged beam technique at the Advanced Light Source (ALS) with a spectral resolution of 10 meV. It was found that the primary ion beam contained a mixture of both 2P|$_{3/2}^{\rm o}$| and 2P|$_{1/2}^{\rm o}$| initial states. Hence, the total cross-section was presented as a statistical weighting of the odd parity J = 3/2 ground and J = 1/2 metastable states, respectively. The accompanying theoretical cross-sections presented by Covington et al. (2011) were evaluated using the Breit–Pauli R-matrix approach. A total of 48 LSJπ fine-structure levels were included in the wavefunction representation with configurations 3s23p4, 3s3p5, 3p6 and 3s23p23d2. Some important correlation effects are thus omitted from this model such as levels associated with the 3s23p33d configuration and those arising from the lower n = 4 complex.
In order to compare with this data, we present in Fig. 2 the total photoionization cross-section from the initial 2Po ground state of Ar ii statistically weighted to the J = 3/2 and J = 1/2 states. We present two of our calculations in the figure, the most sophisticated DARC3 model and, in order to perform a direct comparison with the Breit–Pauli theoretical results of Covington et al. (2011), the PBP 124 level model outlined in Table 1. To match experimental resolving power, we convolute our total results with a 10 meV Gaussian profile at full-width half-maximum (FWHM). In addition, to replicate the target thresholds, we have shifted our threshold values recorded in Table 2 to the experimental NIST values where possible, during the diagonalization of the Hamiltonian matrix. The remaining levels not contained in NIST are shifted by an average proportion to each corresponding angular and spin momentum state, which has little effect on the background and is meant only for consistency. This ensures that resonance features are properly positioned with respect to the observed thresholds, making a direct comparison with experiment more meaningful.
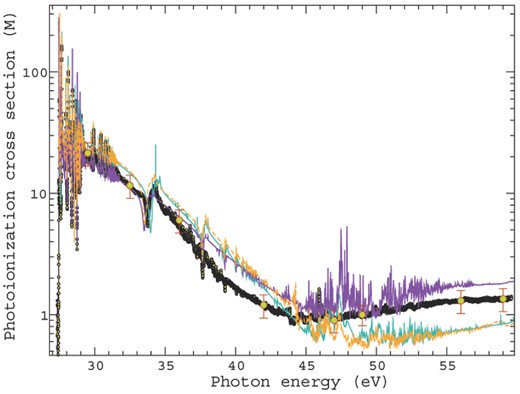
Total photoionization cross-section measured in Mb on a logarithmic scale as a function of photon energy in eV. All results display the initial ground state, statistically weighted 2Po, with J = 3/2 and J = 1/2 odd states to all allowed final states. A 10 meV Gaussian convolution at FWHM is applied to compare directly with experimental resolution for all theoretical calculations. The yellow circles, green circles with error bars and solid turquoise line are the experimental results, absolute measurements at resonance free regions and theoretical calculations respectively, performed by Covington et al. (2011). The dashed orange and solid purple lines represent our PBP and DARC3 calculations respectively.
We can clearly see in Fig. 2 that the low-energy region just above threshold is completely dominated by 3s23p5 → 3s23p4nl transitions occurring at discrete energies prior to the ejection of an electron. This densely populated region of Rydberg resonances up to approximately 30 eV is followed by a steep decline in the photoionization cross-section forming the expected Cooper minimum around 45–50 eV. This minimum is well known to appear in the spectra of noble gases (Cooper 1962). Above this minimum the cross-section rises due to excitations from 3p → 3d transitions, before monotonically decreasing towards zero with increasing photon energy.
Excellent agreement is evident between the 124 level PBP and the 48 level Breit–Pauli calculation of Covington et al. (2011), for all photon energies up to 60 eV. Note that the cross-section in Fig. 2 is plotted on a log scale. Evidently the larger basis expansion of the present PBP evaluation, which includes the 4s, 4p and 4d orbitals, has minimal effect on the resulting photoionization cross-section. Both of these Breit–Pauli evaluations, however, underestimate the cross-section above roughly 45 eV and lie considerably lower than the experimental measurements from ALS. The larger DARC3 evaluation, incorporating 557 fine-structure levels, gives much better agreement with experiment at photon energies above the Cooper minimum. This is partly due to the more substantial calculation, and also a more accurate description of the wavefunctions included. Both techniques in fact are known to reproduce similar results as shown in a study by Berrington et al. (2005), showing that the average difference in effective collision strengths for Fe14+ to be 6 per cent between all transitions considered. The additional levels included, and the Rydberg resonances converging on to their thresholds, have the effect of raising the cross-section above 45 eV.
In order to further emphasize the excellent agreement between the DARC3 and the experimental measurements, we zoom in on the photon energy region just above threshold, from 27.8–29.2 eV, in Fig. 3. It is clearly evident that the disparities found between theory and experiment in this very narrow energy range are negligible and excellent conformity is achieved. This high level of agreement supports the accuracy of the DARC3 evaluation and we believe that these valence shell photoionization cross-sections for the ground state of Ar ii accurately reproduce the experimental spectrum.
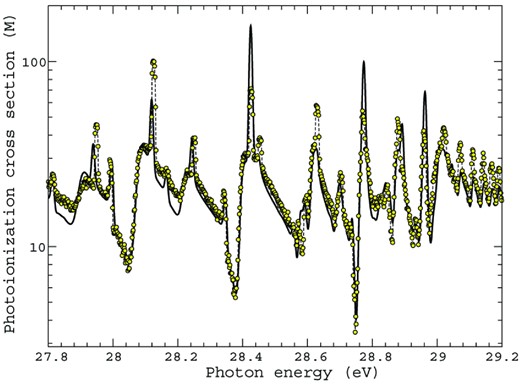
Photoionization cross-section measured in Mb on a logarithmic scale as a function of the photon energy between 27.8-29.2 eV just above threshold. The solid black line is the current statistically weighted, initial ground state, DARC3 calculation against the experimental values from Covington et al. (2011) represented by the yellow circles taken from Fig. 2.
In Fig. 4 we present the total photoionization cross-section for the process defined in equation (2), photoionization from the lowest excited initial 3s3p6 2S1/2 bound state of Ar ii to all possible allowed final states of Ar iii. These evaluations were carried out using the DARC3 model and present for the first time, cross-sections for photoionization from an excited Ar ii state. There are no other theoretical or experimental data with which we can compare in this figure. The cross-section is presented as a function of the photon energy in eV which ranges from just above the ionization threshold to beyond the opening of the L-shell thresholds. The photoionization cross-section tends towards zero with increasing energy, and it is only due to the inclusion of the additional 10 hole states in the DARC3 model do we witness contributions to the cross-section at photon energies between 200–250 eV.
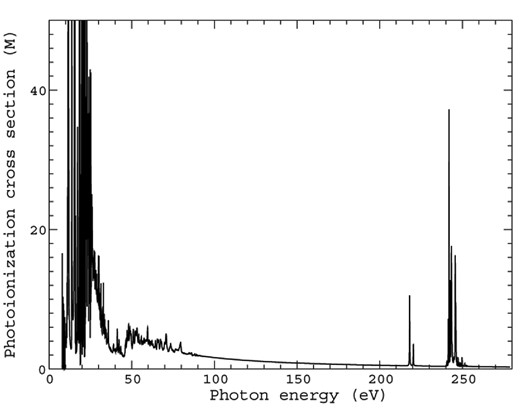
Total ground state photoionization cross-section measured in Mb as a function of the photon energy between 0-280 eV. The transition is from the initial state 3s3p62S1/2 to all allowed final states from the DARC3 model.
4.2 L-shell photoionization
Calculations and experiment have been carried out at the L-shell energy region between 250 and 280 eV by Blancard et al. (2012) at the SOLEIL facility in France as described in Section 1. All the results herein have been convoluted with a 140 meV Gaussian profile at FWHM to match the spectral resolution of experiment. Similar to the valence shell comparisons, the initial ground state cross-section is formed from a statistically weighted average of the contributions from the odd J = 3/2 and J = 1/2 partial waves. Due to time of flight between the ion source and interacting region, excited levels can populate the main ion beam. This leads to a possible inclusion of the initial 3s3p62S1/2 bound state which may also contribute to the total cross-section. In Fig. 4 we have already shown the immediate result of the lowest excited initial bound state transitions arising from the configuration 3s3p6.
In order to compare with experiment, we have presented our results against various ionization channels from Blancard et al. (2012) in Fig. 5. The time-scale for Auger decay is much shorter than the time of flight required by the argon ions after interaction with a photon, and therefore, the single ionization channel from experiment depicts the characteristics of photoionizing a valence electron. We can directly compare with this process in Fig. 5 by omitting the contribution from the additional 10 target states annotated by asterisks. Both above and during these thresholds we expect a rise in the photoionization cross-section as more channels are opened and become accessible. The total result obtained by DARC3 can be compared directly to the combination of both single and double ionization modes of experiment. We have neglected the error bars for both modes in order to visualize the results more clearly.
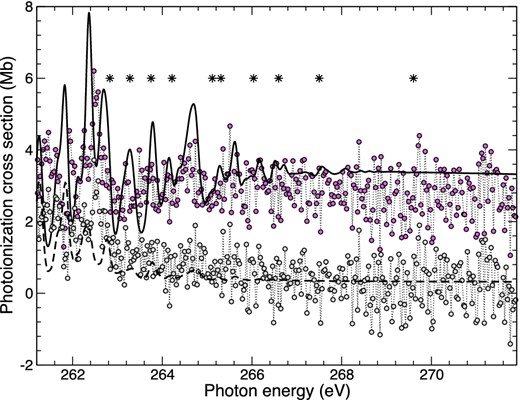
The photoionization cross-section is presented on a linear scale against photon energy in eV above 261.2 eV. The solid black line represents our current DARC3 model convoluted at 140 meV FWHM and the dashed black line is the contribution to the cross-section from valence shell photoionization of the 3s and 3p. The grey circles are experimental values of Blancard et al. (2012) for the single ionization channel and pink circles represent the total contribution. Each 2p53s23p5 threshold is represented by an asterisk.
We now present in Fig. 6 the photoionization cross-section, on a linear scale, as a function of incident photon energy in eV across the L-shell threshold range from 250 to 270 eV. Comparisons are made between the present DARC3 cross-section and the measurements performed by Blancard et al. (2012). Clearly excellent agreement is evident between theory and experiment across the range considered, as the features and energy positions of the resonance profiles exhibit good agreement. We note that as we have employed orbitals optimized on the valence state photoionization, an energy shift of 7.5 eV was required to match the experimental spectra to our current results. The theory clearly predicts this process to a high standard of accuracy and allows us to benchmark the quality of results obtained from experiment.
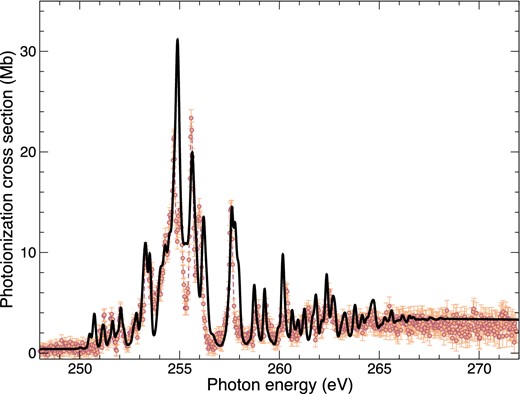
Photoionization cross-section measured in Mb on a logarithmic scale as a function of the photon energy in eV between 250 and 270 eV. The circles are the experimental results from Blancard et al. (2012) with error bars included. The solid black line represents our current, DARC3 model results for the statistically weighted initial ground state, convoluted at 140 meV at FWHM.
In an attempt to investigate the features further, we have broken down the spectrum in Fig. 7 from the total into each of the allowed, final, even J states J = 1/2, J = 3/2 and J = 5/2. Clearly visible is the intense spike at ≈254.9 eV which is dominated by transitions of the form, 2p → nd, ns which are engulfed by the convolution. The second strong peak at ≈255.65 eV is visible mostly through the metastable initial state transition from another strong 2p → nd, J = 3/2 resonance. In reference to Fig. 4, the cross-section has already reached close towards zero in the photon energy range of interest and therefore any contribution to the total cross-section from these initial excited bound states would result in a reduction to the intensity of each resonant state.
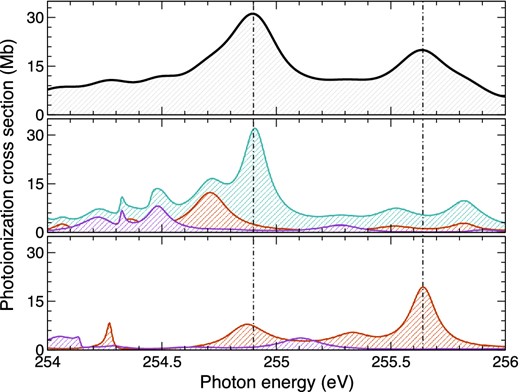
The total convoluted FWHM at 140 meV photoionization cross-section between 254–256 eV taken from Fig. 6 highlighting the intense resonant peaks. The spectra is broken into the contributions from each dipole allowed symmetry from both initial (middle third) and metastable (bottom third) initial states according to their statistical weighting. These even J = 5/2, 3/2, 1/2 partial symmetries are the solid turquoise, red and purple lines. The total (top third) summed contribution is presented by the solid black curve and the two dominate resonances are marked by the dashed line.
This method of deconstructing the cross-section is also important to identify which initial state has been photoionized during the experiment. It is clear however that the strongest profiles are not well isolated and therefore eliminates the possibility to further conduct any analysis on the weighted contributions. We therefore retain the statistical averaging of the ground state as our best result.
5 CONCLUSIONS
Photoionization cross-sections have been produced for the three lowest states of Ar ii from two independent R-matrix methods, darc and bp. Both evaluations differ considerably in size and sophistication. Energy levels obtained from the target wavefunctions have been shown to be in excellent agreement with previous theoretical works and also with the observed values contained in the NIST data base. All photoionization spectra reported in this paper have been properly resolved with a very fine mesh of incident photon energies and comparisons have been made where possible. Excellent agreement is clearly evident between theory and experiment up to the L-shell energy region for all photon energies considered. Agreement has been obtained with the present DARC3 model which was shown to better reproduce experimental measurements for a number of energy ranges, particularly just above threshold and the Cooper minimum in the low energy section of the spectrum. The results pertaining to the energy region of 250–270 eV are the first R-matrix calculations performed to date and clearly resolve the majority of resonance structure. This model thus represents the largest and most sophisticated evaluation of Ar ii photoionization from the ground and first excited state, providing the most complete cross-sections to date.
The work presented in this paper has been supported by STFC through the grant ST/K000802/1. The authors would like to gratefully acknowledge the advice received from both J. M. Bizau (Blancard et al. 2012) and B. McLaughlin (Covington et al. 2011) and also for providing their data sets presented in this paper. The authors would finally like to acknowledge that this work has been carried out on the Cray XC40 Hazel Hen machine in Stuttgart, Germany through the grant number 44009 and the PAMOP project.
REFERENCES


