


Abstract
We present optical spectra and images of the X-ray binary Circinus X-1. The optical light curve of Cir X-1 is strongly variable, changing in brightness by 1.2 mag in the space of four days. The shape of the light curve is consistent with that seen in the 1980s, when the X-ray and radio counterparts of the source were at least ten times as bright as they are currently. We detect strong, variable H α emission lines, consisting of multiple components which vary with orbital phase. We estimate the extinction to the source from the strength of the diffuse interstellar bands and the Balmer decrement; the two methods give AV = 7.6 ± 0.6 mag and AV > 9.1 mag, respectively. The optical light curve can be modelled as arising from irradiation of the companion star by the central X-ray source, where a low-temperature star fills its Roche lobe in an orbit of moderate eccentricity (e ∼ 0.4). We suggest that the companion star is overluminous and underdense, due to the impact of the supernova which occurred less than 5000 yr ago.
1 INTRODUCTION
Cir X-1 is a highly unusual X-ray binary, whose nature has been a puzzle for many years. A 16.6 d period was discovered in X-ray modulations (Kaluzienski et al. 1976), and Whelan et al. (1977) discovered radio flares with the same period. The X-ray intensity of the source has changed by two orders of magnitude over the more than 40 yr since its discovery, ranging from a peak of twice the intensity of the Crab nebula in the late 1990s (Saz Parkinson et al. 2003) to 10 mCrab in 2008–2009 (Nakajima et al. 2010). Since 2010, the source has begun to brighten again at X-ray wavelengths, suggesting it may once more be moving into an active phase.
The accreting star was shown to be a neutron star by the discovery of type I X-ray bursts observed in a brief episode in 1984–1985 (Tennant, Fabian & Shafer 1986). During this period of very low X-ray activity, the X-ray timing behaviour put Cir X-1 in the class of atoll sources (Oosterbroek et al. 1995), believed to be neutron stars with low magnetic fields accreting at a low rate. However, RXTE observations when the source was brighter showed clear Z-source behaviour (Shirey, Bradt & Levine 1999). Z-source behaviour is characteristic of neutron stars accreting near the Eddington limit from a low-mass companion; Cir X-1 is unusual in that it only sometimes shows this behaviour. X-ray bursts were detected in 2010 as the source began to brighten again (Linares et al. 2010); these bursts were the first seen for 25 yr since the initial bursting episode in 1984–1985 (Tennant et al. 1986).
With all these conflicting characteristics, the nature of the companion star remains extremely unclear. The optical counterpart was identified as a faint red star with strong H α and weak He i lines (Whelan et al. 1977). From the strength of the λ6284 diffuse interstellar absorption line, Whelan et al. (1977) found a rather uncertain estimate for the reddening of the optical counterpart of E(B − V) ∼ 3.5 mag. The large reddening, combined with the eccentric orbit evidenced by the X-ray modulation, suggested that the companion star was an early-type supergiant transferring mass via a stellar wind.
Murdin et al. (1980) suggested a model for the system where the X-rays are periodically absorbed by a stellar wind from a massive O or B supergiant (|$M \simeq 20 {{\; {\rm M_{\odot }}}}$|) in a highly eccentric orbit, e ∼ 0.7 to 0.8. This model, and any other model involving a massive star as the mass donor, require large values for the reddening, AV ∼ 11 mag.
Doubts were cast on the massive star model by subsequent observations. Nicolson, Feast & Glass (1980) found correlated changes in the optical and infrared fluxes from Cir X-1, which suggests that they are physically related. Further, the large drop in both fluxes between 1976 and 1979 suggests that the donor star cannot be dominating the light from the system, and the large changes in brightness must be related to the infalling material. Argue & Sullivan (1982) showed that the optical counterpart had been wrongly identified in the very crowded field, and was in fact several magnitudes fainter than that measured by Whelan et al. (1977). This was further clarified by Moneti (1992), who found that the counterpart is in fact one of three (unrelated) stars within 1.5 arcsec. Haynes (1987) suggested the donor star was more likely to be a main-sequence B-star, with |$M \sim 5{{\; {\rm M_{\odot }}}}$|. Stewart et al. (1991) concluded, from the revised magnitude and the interstellar absorption derived from X-ray observations, that AV ≳ 3.0 and the donor star is a main-sequence star with spectral type no earlier than type G. Jonker, Nelemans & Bassa (2007) detected near-IR Paschen absorption, which they attributed to stellar lines from a supergiant B5–A0 star.
Recently, Heinz et al. (2013) detected a young supernova remnant around Circinus X-1 in X-ray and radio observations. Assuming this is the remnant from the supernova that gave rise to Cir X-1's neutron star, this places an upper limit of t < 4600 yr on the age of the system, which would make Cir X-1 the youngest known X-ray binary. This very young age places further constraints on the companion star; if it is low-mass, it must still be on the main sequence, as there has not been enough time for significant evolution since the supernova event.
Unfortunately, efforts to unambiguously detect the companion star itself at optical wavelengths have been unsuccessful. The visible spectrum is dominated by strong, asymmetric H α emission (Mignani, Caraveo & Bignami 1997). Johnston, Fender & Wu (1999) and Johnston et al. (2001) found this H α line to be highly variable, both over a single orbit, and over many years. It is not clear where the H α emission is produced, and since it consists of several components, it may arise in more than one region in the binary. No stellar features were identified in the very red spectrum.
The extinction towards the source is likewise uncertain; the unknown nature of the companion affects any estimate of the extinction. If the companion star is massive, then the extinction to the source must be large, in order to produce the observed red spectrum. A late spectral type companion, on the other hand, would require less reddening to match the observed colours.
Different authors have used X-ray observations to determine the interstellar absorption towards the source, with varying results. Stewart et al. (1991) suggest the observed low-energy cut-off gives NH ∼ 6 × 1021 cm−2, giving AV ∼ 3, using the relation of Predehl & Schmitt (1995): NH = 1.79 ± 0.03AV [mag] × 1021 [cm−2]. Fits to data from ROSAT and ASCA converge on a value of NH ∼ 2 × 1022 cm−2 (Mignani et al. 1997), which implies AV ∼ 11. RXTE and Swift spectra (D'Aì et al. 2012) give a minimum value for the interstellar absorption of NH ∼ 1 × 1022 cm−2, which corresponds to AV > 5.6 mag. These X-ray derived columns are effectively upper limits on the interstellar contribution to the absorption.
The distance to the source was recently determined from an X-ray light echo to be |$9.4^{+0.8}_{-1.0}\;\mathrm{kpc}$| (Heinz et al. 2015), a distance consistent with previous best estimates of around 8 kpc (see Heinz et al. 2013 for a discussion of the various suggested distances to the source).
In this paper, we report on spectroscopic observations obtained in order to determine the spectral type of the companion. In Section 2, we describe our Gemini observations; in Section 3 we discuss the light curve of the source, and in Section 4 we put limits on the extinction towards the source. In Section 5 we discuss the constraints that our observation put on the nature of the companion, and a possible model for the system that satisfies these constraints.
2 OBSERVATIONS AND DATA REDUCTION
We used the Gemini Multi-Object Spectrograph (gmos; Hook et al. 2004) on the 8 m Gemini-S telescope to observe Cir X-1 on six separate occasions in 2013 February–April; a complete log of observations is shown in Table 1. Observations were carried out in queue-scheduled mode. The R400 grating was used in conjunction with the G5325 blocking filter, giving a dispersion of 1.36 Å pixel−1 and a resolution of 8 Å full width at half-maximum (FWHM, measured from arc lines). The CCD was binned by 2 in the spatial direction for the spectral exposures, giving a pixel scale of 0.146 arcsec pixel−1. Severe fringing affects the red end of each spectrum, making the region beyond 7200 Å unusable.
Journal of observations of Cir X-1. Columns show the ID of the spectrum, the date of the observation, the modified Julian date of the centre of each observation, the exposure time, and FWHM seeing. The last two columns show the phase of the mid-point of the observation, according the quadratic ephemeris of Nicolson (2007), and the cycle number N from this ephemeris, being the number of 16.6 d cycles since MJD=43076.32.
| ut Date | MJD | texp | Seeing | Phase | Cycle | |
|---|---|---|---|---|---|---|
| (s) | (arcsec) | ϕ | ||||
| A | 2013 Feb 22 | 56346.338 | 6300 | 0.6 | 0.018 | 802 |
| B | 2013 Feb 23 | 56347.381 | 2100 | 0.8 | 0.081 | 802 |
| C | 2013 Feb 26 | 56350.304 | 3150 | 0.7 | 0.257 | 802 |
| D | 2013 Mar 02 | 56354.259 | 1050 | 0.9 | 0.496 | 802 |
| E | 2013 Mar 18 | 56370.237 | 4200 | 0.9 | 0.464 | 803 |
| F | 2013 Apr 21 | 56404.213 | 2100 | 0.8 | 0.521 | 805 |
Acquisition images were taken with each observation using an r-band filter (r_G0326); the exposure time for the acquisition images was 10 s. The seeing was measured from the FWHM of the stars on the acquisition images, and is listed in Table 1.
The field is crowded, with two nearby unrelated stars within 1.5 arcsec (Moneti 1992), so a slit-width of 1.0 arcsec was used, and the slit was oriented 8| $_{.}^{\circ}$|5 east of north. This put star 2 of Moneti (1992) on the slit as well as Cir X-1. A seeing condition (seeing <0.8 arcsec) was set on the scheduling of the observations to ensure that the two objects were well separated on the slit. No constraint was put on sky transparency, so the data are not photometric.
The data were reduced using standard GMOS tools in iraf. Each observation block consisted of series of 1050 s exposures of our source, interspersed with flat-fields, with the central wavelength alternated between 6500 and 6550 Å in order to eliminate the small wavelength gaps between the detectors. During the reduction, all the spectra from the same night were added together to create a single spectrum with total exposure time as indicated in Table 1. We named these six spectra A–F, as shown in the first column. Standard reduction procedures were followed to remove bias and pixel-to-pixel gain variations, extract the spectra and determine the wavelength solution. Flux calibration was performed by comparing with the spectrum of the observed flux standard LTT 6248. However, since the data were taken in non-photometric conditions, the flux calibration should be considered only approximate.
The second last column of Table 1 shows the phase of each observation, calculated from the ephemeris of Nicolson (2007), based on the timing of the radio flares. The phases of the spectra range between 0.02 (just after phase 0, which we take to represent periastron) and 0.52 (just after apastron). The good period coverage of the observations (at least of the first half of the orbit) was serendipitous, an accidental outcome of queue scheduling with a good seeing constraint.
3 PHOTOMETRY
Inspection of the acquisition images (Fig. 1) shows that the brightness of Cir X-1 changed dramatically over the six epochs that we have data for. We used these r-band acquisition images to investigate the changing brightness of the source. Although the data were not taken under photometric conditions, the field is crowded, so we were able to do relative photometry with ease. Instrumental magnitudes were determined using the aperture photometry function of the gaia (Graphical Astronomy and Image Analysis) tool. Seven reasonably isolated stars in the vicinity of Cir X-1 were chosen, including the stars used by Moneti (1992, see his fig. 1). The zero-point was estimated using a nearby star from the USNO-B1.0 catalogue.
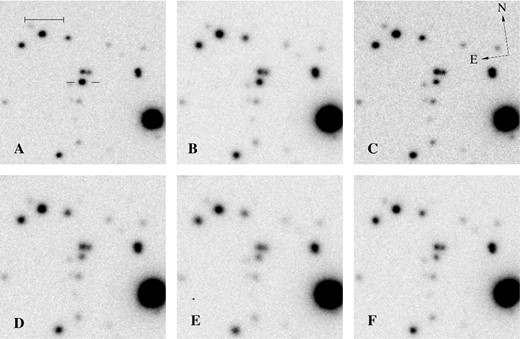
Montage of Cir X-1 in each of the six acquisition images (Table 1). Cir X-1 is indicated by the horizontal bars in the top-left panel; the scale bar in the top-left corner is 5 arcsec in length. North is up and east is to the left, skewed by 8| $_{.}^{\circ}$|5 E of N, as shown in the top-right panel.
We measured the brightness of Cir X-1 on the six acquisition images, taken on the dates listed in Table 1. The results are shown in Fig. 2, as a function of both phase and MJD. The light curve shows a drop of 1.2 mag over a space of 4 d (∼0.25 in phase) during 2013 February.
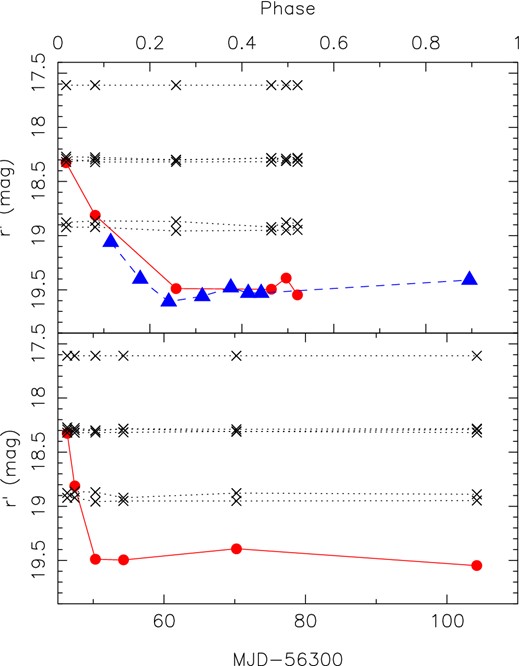
Instrumental r-band light curve for Cir X-1 (filled circles, red solid line), relative to several field stars (crosses, black dotted line). The brightest object is USNO-B1.0 0328−0672991, which was used to determine the (approximate) zero-point. The light curves are shown as a function of phase (top panel) and of MJD (bottom panel). The blue open triangles (dashed line) show the R-band light curve of Moneti (1992), with re-calculated phases (see text).
We cannot tell a priori if this is an orbital change or a secular change in brightness, since we have very sparse time coverage. Comparison with the only previous study of the optical light curve of Cir X-1 is instructive, however. The shape of the change in brightness that we see is similar to, though larger than, that observed by Moneti (1992), in data from 1989. He reported a drop of 0.6 mag in V and R between phase 0.07 and 0.2, followed by a slow rise at R up to phase 0.8. We note that if we re-calculate the phases of Moneti's data points using the ephemeris of Nicolson (2007), the two light curves line up almost exactly (see Fig. 2); the larger change in brightness seen in our photometry is then due to the fact that we have a data point closer to the time of the radio flare.
It seems reasonable to conclude, then, that we are seeing variations directly linked to the orbit in the brightness of Cir X-1. This implies that the optical light curve has changed surprisingly little over the past 25 yr, despite the X-ray intensity, radio flux density, and H α equivalent width (EW) changing by factors of 10 or more over that time (see e.g. Johnston et al. 1999; Armstrong et al. 2013).
3.1 Comparison with X-ray light curve
D'Aì et al. (2012) found that since 2007, Cir X-1 has been in a state characterized by persistent mCrab X-ray flux, punctuated by sporadic several-week-long outbursts. In Fig. 3, we show the X-ray light curve from the Monitor of All-sky X-ray Image (MAXI; Matsuoka et al. 2009). During the times of our optical spectra (indicated by black vertical bars), the X-ray activity of the source was low; there had been an outburst several orbits earlier, but the average X-ray flux during our observations was 0.02photons cm−2 s−1. Assuming a power-law spectrum with photon index Γ = 1.7, this corresponds to a X-ray flux (0.1–100 keV) of 9.6 × 10⁻¹⁰ erg cm−2 s−1, or a luminosity LX = 1.0 × 1037 erg s−1, assuming NH = 2 × 1022 cm−2 and d = 9.4 kpc.
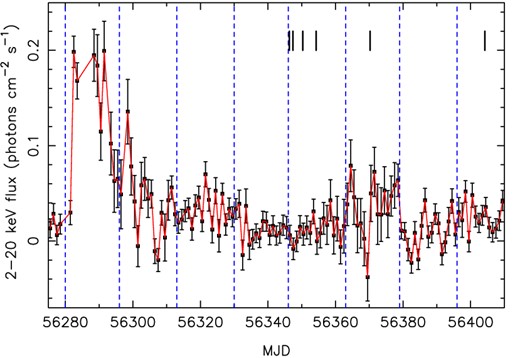
X-ray light curve from MAXI, over the whole 2–20 keV band. The dashed lines show the times of periastron; the thick black vertical bars show the times of our optical spectra (Table 1). The optical spectra were taken during a period of low X-ray activity.
Because of the faintness of the source during the period when our spectra were taken, there is no X-ray spectrum available.
4 SPECTROSCOPY
The optical spectrum of Cir X-1 consists of an extremely red continuum, with several emission lines: H α λ6563, He i λ6678, and He i λ7065. Several clear absorption features are also visible, but these are all due to diffuse interstellar bands (DIBs); see Section 4.2.1. No stellar features are visible, with the possible exception of a single unidentified line near 6980 Å. This line does not appear to be associated with a DIB, and is visible in all but one of the six epochs, as can be seen in Fig. 5.
Fig. 4 shows the spectrum with the highest S/N, spectrum A.
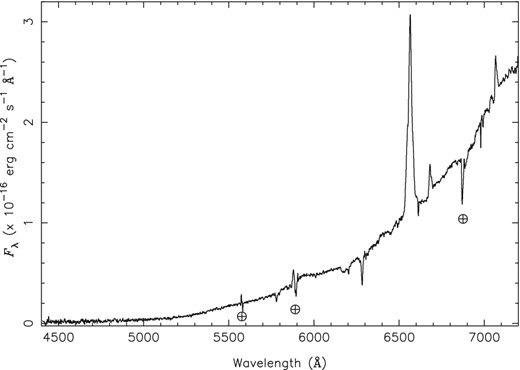
The highest signal/noise spectrum of Cir X-1, spectrum A, taken on 2013 Feb 22. The spectrum is the sum of six separate exposures. The continuum is extremely red; emission lines of H α λ6563, He i λ6678, and He i λ7065 can be seen, as well as absorption features, which are nearly all due to interstellar absorption.
4.1 Emission lines
All six spectra show a strong H α emission line, but both the shape and intensity of the line vary significantly between the observations. Much weaker He i lines are also visible. Fig. 5 shows the region around H α containing the emission lines in all six spectra.
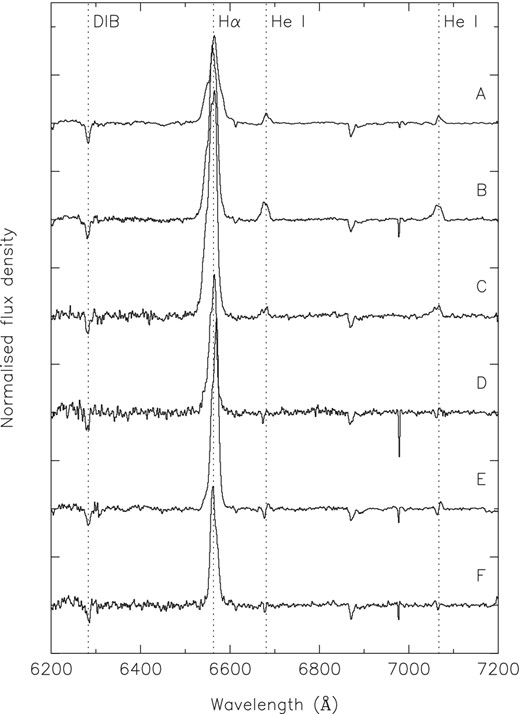
The region around H α in all six epochs; the name of each observation is shown at the right of each spectrum, which are offset vertically for clarity. Each spectrum has been normalized by a polynomial fit to the continuum. The position of the H α and He i emission lines, as well as the strongest of the DIBs, are shown with dotted lines; see Fig. 7 for the identification of other features. The flux of the H α line is greatest in spectrum A, but the EW is largest in spectrum C because of the fading of the continuum between the two epochs (Table 2).
4.1.1 H α brightness
The EW of the H α line ranges from 40 to 120 Å in the different spectra. Because the continuum level is changing dramatically over the six epochs (Section 3), some of this variation in EW is due to the changing brightness of the continuum. Table 2 shows the line flux and EW of the H α line in each spectrum, measured by direct summation of pixels in the line.
Variability in the H α emission lines. The columns show the name and phase ϕ of the spectrum, and the EW W and the flux of the H α line.
| W | fH α | ||
|---|---|---|---|
| Spectrum | ϕ | (Å) | (× 10−15 erg cm−2 s−1) |
| A | 0.018 | 46 ± 2 | 5.3 ± 0.2 |
| B | 0.081 | 89 ± 6 | 5.0 ± 0.3 |
| C | 0.257 | 117 ± 7 | 3.5 ± 0.2 |
| D | 0.496 | 54 ± 6 | 1.2 ± 0.1 |
| E | 0.464 | 70 ± 4 | 1.9 ± 0.1 |
| F | 0.521 | 40 ± 9 | 0.9 ± 0.2 |
| W | fH α | ||
|---|---|---|---|
| Spectrum | ϕ | (Å) | (× 10−15 erg cm−2 s−1) |
| A | 0.018 | 46 ± 2 | 5.3 ± 0.2 |
| B | 0.081 | 89 ± 6 | 5.0 ± 0.3 |
| C | 0.257 | 117 ± 7 | 3.5 ± 0.2 |
| D | 0.496 | 54 ± 6 | 1.2 ± 0.1 |
| E | 0.464 | 70 ± 4 | 1.9 ± 0.1 |
| F | 0.521 | 40 ± 9 | 0.9 ± 0.2 |
In Johnston et al. (2001), we reported that the EW of the H α line declined from 580 Å in 1976 to 10–20 Å in 2000. Subsequent observations found that EW of the line continued to decline; by 2006 it had dropped to ≲ 5 Å, and was undetected on some occasions (Johnston, Wu & Soria, in preparation). The brightness of the continuum had not changed significantly over this time, so this decline represents a real and dramatic decrease in the intensity of the emission line (Johnston et al. 2001).
Our new observations show that this long-term decline in brightness of the emission line has not continued; the EW has recovered to levels last seen in 1999–2000, when the X-ray emission seen by RXTE was at its peak.
4.1.2 H α morphology
As we found in our previous observations (Johnston et al. 1999, 2001), the H α line shows multiple components, with a broad and a narrow component at different velocities. We fit Gaussian profiles to the H α line using the specfit package in iraf (Kriss 1994). After normalizing each spectrum by a low-order polynomial fit to the continuum, we fit either two or three gaussians to the H α line. Only spectrum C, taken on 2013 Feb 26 (phase 0.257) clearly required a third component to fit the line profile. The other spectra are fitted with a broad component (with |$\mathrm{FWHM} \sim 1200{{\rm km s^{-1}}}$|) plus a single narrow component (|$\mathrm{FWHM} \sim 500{{\;{\rm km\,s^{-1}}}}$|).
The fits to the H α profiles are shown in Fig. 6. Near phase 0 (panel A), the line is broad and symmetric, with both broad and narrow component aligning at almost the same velocity. At other phases, the two components appear at very different velocities, with the narrow component (or components) always redward of the broad component. This trend of line shape with phase is similar to that seen in Johnston et al. (2001), where the line was observed to change from single-peaked at phase 0, to double-peaked for phases 0.6–0.9. Johnston et al. (2001) ascribed the appearance of double-peaked lines during the second half of the orbit to the creation of a Keplerian disc during the orbital cycle, a disc that is subsequently destroyed during the next periastron passage. Unfortunately, none of our current spectra were taken during the second half of the orbit, so we cannot check if this behaviour has persisted.
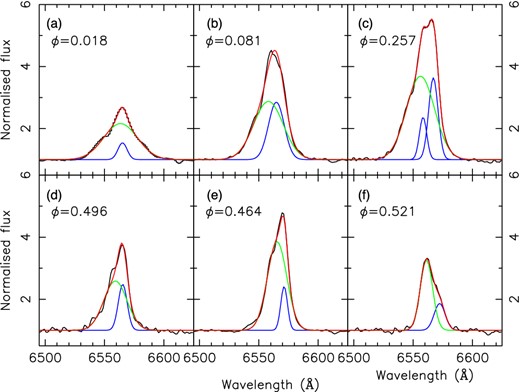
Line profiles of H α in all six epochs; the name and phase of each observation is shown in the top-left corner. The spectra were first normalized by a polynomial fit to the continuum. The line is broad and symmetric near phase 0, but at other phases the broad and narrow components have different velocities, with the broad component always blueward of the narrow component.
4.1.3 He i lines
The spectra also show emission lines of He i λ6678 and λ7065. Spectra A–C show the line in emission; in spectra D–F the emission line is much weaker, and there is also an absorption component in both lines.
(Further discussion of the emission lines is deferred to Johnston et al., in preparation, where we will discuss spectroscopic observations of the source over many years.)
4.2 Reddening
As discussed above, the extinction to the source is not well constrained. We use our spectra to determine this extinction in two different ways: using the DIBs, and using the Balmer decrement.
4.2.1 Diffuse interstellar bands
Fig. 7 shows the normalized spectrum in the region around H α with features identified. Apart from a couple of terrestrial features, all but one of the observed absorption lines are DIBs. DIBs are absorption features of unknown origin which are observed in the spectra of stars seen through significant column densities of interstellar material (see Herbig 1975, for a review).
![Spectrum A in the region around H α, with features identified. ‘DIB’ indicates the DIBs at (from left to right) λλ5780, 5797, 6010, 6178, 6202, 6270, 6283, 6306, and 6613. Several terrestrial features (the [O i] λ5577 line and the B band) are indicated; the gaps near 5900 and 7200 Å are due to interstellar Na D and the chip gap.](https://oup.silverchair-cdn.com/oup/backfile/Content_public/Journal/mnras/456/1/10.1093/mnras/stv2669/2/m_stv2669fig7.jpeg?Expires=1750210047&Signature=4KgtV9huskNCUo8oVFx2aSMzHnAjqItpGQ58-NixbDSIzSs24P7k1RNVMpqf3Do08RTn3RhtxRvLno-X6nL4MpemsWGD6cFdwDhpscKe8K8N81SlsgApBa9OGYfQvVzzu-jBYWiTdkV2~nlBiFBT2dpOAvj6XZAkDTa0sRslDyvzD-M2XRoXwnJvfkDPcQcrcHfWEFtaLPDEGxJYzH2~6KLqJy4ujCycYEJ6Pjoe9aZ29xQKcOeNp8ag-AZhydfFws8-KAvsQCJQ2YFaYhO4uje1hZwdjlmcT6xIY6hkNrRCgmFSrb-IAZk2iS2PJ3-e39q0iHasMvKLHmSpo7hxjA__&Key-Pair-Id=APKAIE5G5CRDK6RD3PGA)
Spectrum A in the region around H α, with features identified. ‘DIB’ indicates the DIBs at (from left to right) λλ5780, 5797, 6010, 6178, 6202, 6270, 6283, 6306, and 6613. Several terrestrial features (the [O i] λ5577 line and the B band) are indicated; the gaps near 5900 and 7200 Å are due to interstellar Na D and the chip gap.
We can use the EWs of DIBs to determine the extinction E(B − V), using the relations from Herbig (1975), who found a correlation between line strength and colour excess for reddened stars. We measured the strengths of several of the strongest DIBs in our highest S/N spectrum, spectrum A: these measurements are shown in Table 3. Herbig (1975) tabulated coefficients a0 for the correlation between EW W of 17 different DIBs and extinction E(B − V), of the form W = a0E(B − V). We used these tabulated a0 values for three of the strongest DIBs (λλ6010, 6202, and 6613) to estimate the colour excess towards Cir X-1.
| W | |||
|---|---|---|---|
| Line | (mÅ) | a0 | E(B − V) |
| 6010 | 453 | 159 | 2.85 |
| 6202 | 655 | 288 | 2.27 |
| 6613 | 625 | 285 | 2.19 |
| W | |||
|---|---|---|---|
| Line | (mÅ) | a0 | E(B − V) |
| 6010 | 453 | 159 | 2.85 |
| 6202 | 655 | 288 | 2.27 |
| 6613 | 625 | 285 | 2.19 |
| W | |||
|---|---|---|---|
| Line | (mÅ) | a0 | E(B − V) |
| 6010 | 453 | 159 | 2.85 |
| 6202 | 655 | 288 | 2.27 |
| 6613 | 625 | 285 | 2.19 |
| W | |||
|---|---|---|---|
| Line | (mÅ) | a0 | E(B − V) |
| 6010 | 453 | 159 | 2.85 |
| 6202 | 655 | 288 | 2.27 |
| 6613 | 625 | 285 | 2.19 |
The mean colour excess from these three lines is E(B − V) = 2.44 ± 0.21, which corresponds to an extinction of AV = 3.1E(B − V) = 7.6 ± 0.6 mag.
4.2.2 Balmer decrement
The intrinsic Balmer ratio could be significantly less than 2.86 if the material emitting the line is optically thick. Many X-ray binaries have values for H α/H β close to 2.7, indicating the lines are optically thin (e.g. Shahbaz et al. 1996; Soria, Wu & Johnston 1999; Shahbaz et al. 2004). However, there are exceptions, e.g. in GX339−4, where the Balmer decrement was observed to be close to unity in the soft state (Rahoui, Coriat & Lee 2014). Given the absence of H β in our spectra, a value for the intrinsic ratio fH α/fH β = 1.0 would give an even higher limit for the extinction, AV > 12.1. Such a high value for the extinction is not consistent with our estimate from the DIBs, or from X-ray spectra, so we will take our best estimate for the reddening to be in the range AV = 7.6–9.1 mag.
4.3 Continuum shape
With no spectral features from the companion star, we are unable to further constrain its spectral type using spectroscopy. The absence of stellar features suggests the optical light is not being dominated by the companion star; this is true in many low-mass X-ray binaries, where the bulk of the light in the optical region comes from re-processed X-ray radiation from an accretion disc and/or the heated face of the companion. The imperfect flux calibration of our spectra means we cannot fit the spectra with any degree of certainty.
5 DISCUSSION
5.1 Irradiated companion model
Our light curve for Cir X-1 shows the visible light from the source drops by 1.2 mag in 4 d (a quarter of an orbit), and is consistent with that seen in 1989 by Moneti (1992). This rapid change, together with a spectrum devoid of stellar features, suggests that the optical light is dominated by re-processed X-ray radiation. The modulation indicates that the reprocessing material is not axisymmetric around the X-ray source; in X-ray binaries this is typically an asymmetric accretion disc, or the heated face of the companion star.
In Johnston et al. (1999), we proposed a model for Cir X-1, where the binary consists of a neutron star and an intermediate mass companion in a highly eccentric orbit. During periastron passage, the companion star overfills its Roche lobe, causing a transfer of mass at a super-Eddington rate, which in turn drives a strong matter outflow. After periastron, mass transfer from the companion ceases as the star detaches from the critical Roche surface, but accretion continues at a near-Eddington rate as the neutron star captures the residual matter in its Roche lobe. An accretion disc gradually forms, so between phases 0.5 and 0.9 there is steady accretion. The disc is then disrupted by tidal forces during the following periastron passage. Support for this model was provided in Johnston et al. (2001), where we twice detected double-peaked emission lines, in spectra taken almost a year apart, at phases 0.88 and 0.62.
If the accretion disc is destroyed during periastron passage, then the disc cannot be the site of the optical emission. Here, we consider the possibility that the variation we see in the visible light curve comes entirely from the heated face of the companion star.
A donor star of radius R at a distance d from the neutron star will subtend a solid angle |$\theta = \pi \left(\frac{R}{d}\right)^2$| as seen from the neutron star. Thus, the amount of X-ray radiation intercepted by the companion will depend on both its size and on the shape of the orbit. The orbital period is well known, P = 16.6 d, and the primary is known to be a neutron star, so we need to know the mass of the companion and the orbital eccentricity.
We can use the decline in the optical flux to put limits on the shape of the orbit. The more eccentric the orbit, the more rapidly the companion star recedes after periastron, so the more rapidly the flux should drop. We used the Eclipsing Light Curve code (elc; Orosz & Hauschildt 2000) to investigate how the light drops as a function of orbital eccentricity. We do not have enough data to do a fit, but we can test some indicative models. We started with the same model as above: P = 16.6 d, |$M_1 = 4{\rm M_{\odot}}$|, |$M_2 = 1.4{\rm M_{\odot}}$|. We take the neutron star to be a point source of X-rays with luminosity LX. We have set the argument of periastron to be 90° (i.e. the neutron star is in front of the companion star at periastron; required to get maximum heating at phase 0) and the orbital inclination i to be 80°. A high inclination angle is suggested by the presence of X-ray dips, but our results are not very sensitive to the exact value chosen.
We take the companion star to be a cool star (T1 = 4500 K) with radius equal to the size of the Roche lobe at periastron. For a given companion mass (and hence mass ratio q), the amplitude of the variation is principally due to the X-ray luminosity LX: as the eccentricity increases, the two stars are closer together at periastron, so a lower X-ray luminosity is required to achieve the same change in temperature. However, the width of the variation is due almost entirely to the eccentricity e: as the eccentricity increases, the stars spend a smaller fraction of the orbit at close distances with the companion facing us. Table 4 shows some typical values for our fitted parameters. We find that an orbit with eccentricity e = 0.8 (the suggested value from Johnston et al. 1999) does not match our light curve well: the optical flux declines much too rapidly, taking only Δϕ = 0.04 = 16 h to drop by 1.2 mag. The eccentricity needs to be about 0.4 before it matches our light curve, dropping 1.2 mag in Δϕ = 0.25 = 4 d. Fig. 8 shows the predicted light curve for these two values of the orbital eccentricity, compared with our observed values. A high value for the eccentricity is clearly ruled out.
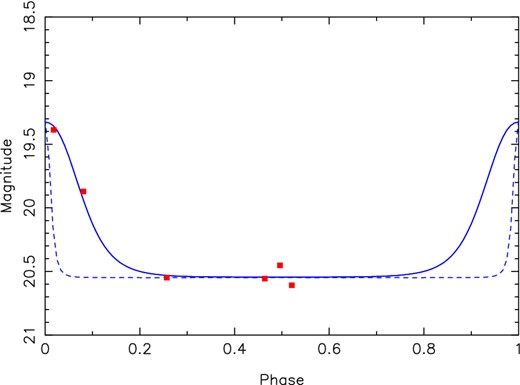
Model from the elc code of an irradiated star with |$M_2 = 4{{\; {\rm M_{\odot }}}}$| and T = 4500 K. The red squares are our observed light curve (see Fig. 3); the blue dashed line is a model with eccentricity e = 0.8, while the solid line has e = 0.4. Note that the X-ray luminosity is different in these two cases (see Table 4). The vertical axis is V-band magnitudes on an arbitrary scale.
Example models fitted to the light curve. For assumed values for the companion star mass and temperature, we look for the values of the X-ray luminosity LX and eccentricity e which reproduce the shape of our light curve: a 1.2 mag drop in intensity in Δϕ = 0.25 of an orbit.
| M1 | T1 | log LX | e |
|---|---|---|---|
| (|${{\; {\rm M_{\odot }}}}$|) | (K) | (LX in erg s−1) | |
| 4 | 4500 | 37.2 | 0.40 |
| 4 | 7000 | 38.4 | 0.42 |
| 10 | 4500 | 37.3 | 0.40 |
| 10 | 7000 | 38.5 | 0.41 |
| M1 | T1 | log LX | e |
|---|---|---|---|
| (|${{\; {\rm M_{\odot }}}}$|) | (K) | (LX in erg s−1) | |
| 4 | 4500 | 37.2 | 0.40 |
| 4 | 7000 | 38.4 | 0.42 |
| 10 | 4500 | 37.3 | 0.40 |
| 10 | 7000 | 38.5 | 0.41 |
Changing the mass of the donor star has very little effect on the eccentricity required to fit the light curve. Jonker et al. (2007) modelled the donor star as a |$10{{\; {\rm M_{\odot }}}}$| star, so we repeated the fit using that mass. Again, we required an eccentricity e = 0.40 to reproduce the width of the drop in the light curve; the change in separation for a different mass ratio is not nearly as important as the shape of the orbit. Thus, our light curve is insensitive to the mass of the donor star.
The temperature of the companion, however, does have an effect. As the temperature of the donor star increases, the X-ray luminosity required to reproduce the observed 1.2 mag change in brightness also increases. In going from T = 4500 K to T = 7000 K, the X-ray luminosity of the neutron star goes up by more than an order of magnitude, from log LX = 37.2 to log LX = 38.4 (where LX is the X-ray luminosity in erg s−1). An X-ray luminosity log LX = 37.2 corresponds to 0.09LEdd for a |$1.4{{\; {\rm M_{\odot }}}}$| star. The 2–20 keV MAXI light curve during the time of our optical spectra (Fig. 3) shows Cir X-1 had a persistent X-ray flux within a factor of a few of this value (see Section 3.1), so this level of X-ray illumination is not unreasonable, particularly if we include the whole X-ray band. A luminosity a factor of 10 higher, however, is not consistent with the known source brightness during our observations. This favours the companion being a cool star.
We assumed here that the donor star is filling its Roche lobe at periastron. This is an upper limit to the size of the companion, and sets a lower limit to the amount of X-ray heating required. If the donor star is any smaller, it intercepts a smaller fraction of the X-ray radiation and experiences less heating, and so requires a greater X-ray luminosity to achieve the same brightness variation.
Thus, our light curve can be explained by X-ray heating of the companion, if the eccentricity of the orbit is not too high (e ∼ 0.4) and the temperature of the companion star is low (T ∼ 4500K). The mass of the companion star is not constrained by the light curve.
Many authors have assumed a rather high value for the eccentricity of Cir X-1 (e ∼ 0.7–0.9), based on modelling of radio (Haynes, Lerche & Murdin 1980), X-ray (Shirey 1998) or optical data (Johnston et al. 1999). By contrast, Jonker et al. (2007) modelled the system as a |$10{{\; {\rm M_{\odot }}}}$| supergiant B5–A0 star in an orbit with e = 0.45. This eccentricity and mass are compatible with our model, though the temperature of the companion is not.
We also see strong and variable emission lines in our spectra, whose shape and velocity change with orbital phase. At phase 0, the emission line is broad and symmetric, while at other phases the line is asymmetric, with the narrow component always appearing redward of the broad component. It is not clear where these components arise, but they could well also be associated with the heated face of the companion star.
5.2 Constraints on the companion
Despite having not detected any stellar features in our spectra, our observations none the less place quite stringent constraints on the nature of the companion star.
Absolute magnitude. The apparent magnitude of the system at minimum light is V = 21.46 ± 0.02 (Moneti 1992), which represents an upper limit to the brightness of the companion – any contribution from a disc etc. would mean the companion was fainter still. The best estimate for the distance to Circinus X-1 is 9.4 kpc (Heinz et al. 2015). Using our range of estimates for AV = 7.6–9.1, this apparent magnitude corresponds to an absolute magnitude of MV = −0.7 to −2.2, so the upper limit to the absolute magnitude of the companion star is MV = −2.2.
Age. The age of the companion must be the same age as the star which went supernova. Assuming the minimum mass for a supernova progenitor is |$8{{\; {\rm M_{\odot }}}}$|, this corresponds to a lifetime τ ≤ 4 × 10⁷ yr (see below). Heinz et al. (2013) determined the age of the binary to be <4600 yr, so the companion star cannot be older than the sum of these two times. Depending on its mass, this places strict limits on its evolutionary state.
Size. Using our irradiated star model for the light curve, the donor star is assumed to be filling its Roche lobe. Given the high X-ray luminosity of the source, this seems a reasonable assumption. If the star is not filling its Roche lobe, then it must be transferring material via a wind. However, the long-term average X-ray luminosity is around 1037 erg s−1; if the mass is inefficiently transferred in a wind, the donor star would need to lose at least |$10^{-6}\;{{\; {\rm M_{\odot }}}}\,\mathrm{yr}^{-1}$| to reach this luminosity (see e.g. Frank, King & Raine 2002, section 4.9). Stars less massive than |${\sim } 15{{\; {\rm M_{\odot }}}}$| do not have winds this strong, and more massive stars are ruled out by the luminosity criterion.
From this size constraint, we can derive a limit on the average density of the donor star. There is a well-known relationship between the period and the density for Roche lobe-filling stars:where Ph is the orbital period in hours. This relation is derived by combining Paczyński's approximation for the Roche lobe radius (Paczyński 1971) with Kepler's third law. However, it is in fact only valid for q < 0.8; for larger values of q (larger donor masses), Paczyński's relation underestimates the volume of the Roche lobe. This means that the real average density of the star will be less than the density 〈ρ〉 estimated using equation (1). For the orbital period of Cir X-1, this gives us a limit on the density of the companion: 〈ρ〉 < 0.003 g cm−3 for e = 0.4, independent of the mass of the star M1.(1)\begin{equation} \langle \rho \rangle = \frac{107}{P_\mathrm{h}^2 (1-e)^3}\; \mathrm{g}\,\mathrm{cm}^{-3}, \end{equation}
We can now try to find stars which satisfy the above criteria: MV > −2.2, 〈ρ〉 < 0.003 g cm−3, and |$\tau \le 4 \times 10^7\;\mathrm{y\text{r}}$|. We used the PARSEC stellar isochrones (Bressan et al. 2012), and plotted the average stellar density versus absolute magnitude for different isochrones.
Fig. 9 shows three representative isochrones, ending with τ = 4 × 10⁷ yr, which is the last model which contains a |$8{{\; {\rm M_{\odot }}}}$| star, and hence represents the oldest possible age for the companion star (constraint ii). The star must lie to the right of MV = −2.2 (constraint i), and below 〈ρ〉 = 0.003 g cm−3 (constraint iii). There are no stars that satisfy all three constraints. Stars which have low enough density to satisfy the density criterion are too bright to satisfy the absolute magnitude criterion, unless they have lower mass, in which case they do not satisfy the age criterion (as they have not had time to evolve to large sizes and low densities).
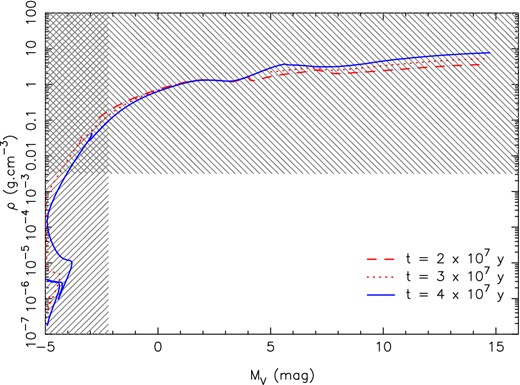
Average density 〈ρ〉 versus absolute magnitude MV for stars from the PARSEC isochrones. Three ages are shown: τ = 2 × 10⁷ (red dashed line), 3 × 10⁷ (red dotted line), and 4 × 10⁷ yr (blue solid line). The last age is the upper limit to the lifetime of the star which produced the supernova, and hence of the age of the companion. The shaded regions show the regions disallowed by the constraints from our data: MV > −2.2 and 〈ρ〉 < 0.003 g cm−3, so the companion star must fall in the blank area, where none of the models lie.
5.3 A companion star heated by the supernova
What is the solution to this conundrum? We propose that it may lie in the very young age of the binary since the supernova explosion. When the supernova explodes, the impact of the ejecta on the companion star can have a major, though comparatively short-term, effect. Several authors have calculated the consequences for the companion star, (e.g. Marietta, Burrows & Fryxell 2000; Hirai & Yamada 2015); they find that the companion is heated by the supernova ejecta, suffers some mass-loss, and will expand to have higher luminosity and lower surface effective temperature. For example, Hirai & Yamada (2015) find models where the temperature decreases from 50 000 to 4000 K (their fig. 8), depending on the scenario. The effect on the companion star will last a considerable time, of the order of the thermal time-scale of the star. Pan, Ricker & Taam (2012) and Shappee, Kochanek & Stanek (2013) find that the companion remains bright for several thousand years after the explosion.
Thus, we have the interesting situation that the donor star can be low mass, and hence not have evolved, but also a giant star, due to the fact that it is still recovering from the impact of the blast, less than 5000 yr ago. Jonker et al. (2007) concluded the companion was a hot supergiant star in an orbit with e = 0.45. We suggest that the star does have a density similar to that of a supergiant, but much lower temperature, due to it being ‘puffed up’ by the deposition of energy from the supernova. Their estimate of the eccentricity agrees with what we find, e ∼ 0.4.
There could also be another contribution to the heating of the companion: tidal stresses along the eccentric orbit will provide additional internal heat due to tidal friction, just as Io's interior is kept heated by tidal forces from Jupiter.
Note that, if the star has been swelled up by the impact of the supernova, it might not be necessary for it to fill its Roche lobe. Red giant stars can have significant winds even at lower masses, so the star might not completely fill its Roche lobe, with wind accretion, more focused at periastron, providing the mass transfer.
We should note that we cannot rule out the possibility that the secondary star is underdense because it has not yet reached the main sequence. If the secondary has sufficiently low mass, it is possible that the primary becomes a supernova before the secondary star has contracted on to the main sequence. B stars with pre-main-sequence companions are known in wide orbits from the visual binary sample of Lindroos (1986), so this possibility should be considered.
5.4 Other possible scenarios
There are other possible scenarios for the system that might be able to fit the observed constraints. If the optical radiation is not coming from an irradiated companion, then the X-rays must be being re-processed elsewhere in the system. An accretion disc is an obvious possibility, though as described above we currently have no evidence in our spectra for an ordered accretion disc existing at all phases of the orbit. If the bulk of the light were coming from a disc, it would explain the total absence of stellar features in our spectra. However, in order to reproduce the strongly varying light curve, we would require an asymmetric disc or accretion flow.
We can also consider cases where it is not the companion star being irradiated. One possible model is that the companion is a Be star, which is a rapidly rotating B star with an excretion disc (sometimes called a ‘decretion disc’, in reference to the fact that the mass is flowing outwards instead of inwards; see Rivinius, Carciofi & Martayan 2013, for a review). In this case, the X-rays are not produced by Roche lobe overflow from the star; instead, the baseline X-ray emission comes from the wind from the disc, while the eccentric orbit means that near periastron the disc reaches the Roche surface and produces outbursts. The varying optical light curve is explained by irradiation from the central X-ray source, just as in our previous scenario; both star and disc are more strongly irradiated at periastron (with the disc probably contributing most of the irradiated area). However, we do not prefer this model, for several reasons. Both disc and central star are likely to be too hot to produce the 1.2 mag drop (Section 5.1), plus the star is likely to contribute too much light. In addition, neither our optical spectra nor the infrared spectra of Jonker et al. (2007) show double-peaked lines, which are typical for Be stars, and the orbital period of Cir X-1 is shorter than any other Be/X-ray binaries (see e.g. Reig 2011, for a review).
6 CONCLUSIONS
We have found a strongly varying optical light curve for Cir X-1, with the brightness changing by 1.2 mag in four days (0.25 of an orbit). This light curve is similar to that found by Moneti (1992) in the 1980s, when the X-ray and radio brightness were much higher than they currently are. We also observe strong, variable H α emission lines, on top of an almost featureless but very red continuum.
We interpret the optical variability as arising from X-ray irradiation of the companion star, or (less likely) a companion star plus disc, in a moderately eccentric orbit (e ∼ 0.4). If the star is filling its Roche lobe, then the combination of age, brightness, and radius of the companion star is incompatible with normal stellar models. The very young age of the system – determined by Heinz et al. (2015) to be less than 5000 yr since the supernova explosion – gives us a possible solution to this problem: the supernova explosion which produced the neutron star deposited enough energy in the companion to ablate and shock heat the star. The envelope of the star is puffed up, and the star can take thousands of years to return to the main sequence. We suggest that we are seeing the companion to Cir X-1 in this expanded state. A detailed model for the system will require simultaneous X-ray and optical observations.
We thank Dick Hunstead and Kinwah Wu for useful conversations, and the anonymous referee for suggestions which greatly improved the paper. Based on observations obtained at the Gemini Observatory (program ID GS-2013A-Q-59, processed using the Gemini iraf package), which is operated by the Association of Universities for Research in Astronomy, Inc., under a cooperative agreement with the NSF on behalf of the Gemini partnership: the National Science Foundation (United States), the National Research Council (Canada), CONICYT (Chile), the Australian Research Council (Australia), Ministério da Ciência, Tecnologia e Inovação (Brazil), and Ministerio de Ciencia, Tecnología e Innovación Productiva (Argentina).
This research has made use of the MAXI data provided by RIKEN, JAXA, and the MAXI team.
REFERENCES
