


Abstract
We present an analysis of optical and infrared spectra of the recurrent nova RS Oph obtained during between 2006 and 2009. The best fit to the optical spectrum for 2006 September 28 gives Teff = 3900 K for log g = 2.0, while for log g = 0.0 we find Teff = 4700 K, and a comparison with template stellar spectra provides Teff ∼ 4500 K. The observed spectral energy distribution (SED), and the intensities of the emission lines, vary on short (≲1 d) time-scales, due to disc variability. We invoke a simple one-component model for the accretion disc, and a model with a hot boundary layer, with high (∼3.9 × 10⁻⁶ M⊙ yr−1) and low (∼2 × 10⁻⁸ M⊙ yr−1) accretion rates, respectively. Fits to the accretion disc-extracted infrared spectrum (2008 July 15) yield effective temperatures for the red giant of |${T_{\rm eff}}= 3800 \pm 100$| K (log g = 2.0) and |${T_{\rm eff}}= 3700 \pm 100$| K (log g = 0.0). Furthermore, using a more sophisticated approach, we reproduced the optical and infrared SEDs of the red giant in the RS Oph system with a two-component model atmosphere, in which 90 per cent of the surface has Teff = 3600 K and 10 per cent has Teff = 5000 K. Such structure could be due to irradiation of the red giant by the white dwarf.
1 INTRODUCTION
RS Ophiuchi is a recurrent nova (RN), an interacting binary system in which multiple nova outbursts have been observed; it has undergone eight known or suspected outbursts since 1898 (Anupama 2008), the most recent peaked on 2006 February 12.94 ± 0.04 ut (Hounsell et al. 2010).
RS Oph consists of a white dwarf (WD) primary close to the Chandrasekhar limit, accreting material from a red giant (RG; spectral type M2IIIpe+, see SIMBAD1 and Fekel et al. 2000) secondary star. The RN eruption is explained in terms of a thermonuclear runaway on the surface of the WD (e.g. Starrfield et al. 1972; Starrfield 2008) following the accretion of sufficient mass by the WD to trigger ignition. In quiescence, the optical spectrum is dominated mainly by the RG. The variable observed hot component in RS Oph spectrum can be explained by a WD+accretion disc (AD) embedded in an envelope of wind from the M giant secondary. The observed variations of its hot component are a result of (a) fluctuations in the mass accretion rate; (b) changes in the column density of the absorbing wind envelope, which is optically thick (Dobrzycka et al. 1996; Anupama & Mykolaevska 1999).
Unlike the classical novae, the masses of the WD in RNe may be increasing over time. If the WD is a CO WD, then the mass of the WD in RS Oph may eventually reach the Chandrasekhar limit and explode as a Type Ia supernova (Iben & Tutukov 1984; Wood-Vasey & Sokoloski 2006). Whether or not RS Oph is gaining mass remains a matter of considerable debate (e.g. Ness et al. 2009).
Wallerstein et al. (2008) determined elemental abundances for the donor stars of RS Oph and the RN T CrB (which also has a RG secondary; see Anupama 2008). They analysed the 6500–8800 Å spectral range, using Fe i, Ni i, Si i and Ti i lines to establish effective temperatures of 4100–4400 K (RS Oph) and 3600 K (T CrB). From analysis of the equivalent widths of atomic lines they determined a near-solar metallicity for both stars, but with large (factor ∼2) uncertainties. Similarly, Pavlenko et al. (2008) analysed infrared (IR) spectra of RS Oph and determined |${T_{\rm eff}}= 4100\pm 100$| K for the secondary. They also found that the metallicity of the secondary is solar, but with a deficit of carbon and an overabundance of nitrogen with respect to solar (see also Scott et al. 1994).
A nitrogen overabundance and a carbon underabundance is known in a variety of the normal RGs, with a range of metallicities (Smith, Briley & Harbeck 2005, and references therein), and is due to the conversion of C to N in the CN-cycle of hydrogen burning, and the subsequent dredge-up of the products on the RG Branch (e.g. Smith & Lambert 1985, 1986; Smiljanic et al. 2009). Therefore, the material accreting on to the WD from the M giant secondary in the RS Oph system likely is N-enhanced (see fig. 14 of Ness et al. 2009).
Pavlenko et al. (2010) carried out an analysis of a high-resolution IR spectrum of the RG component of RS Oph and found 12C/13C = 16 ± 3. This value is consistent with those typically observed in the atmospheres of RG stars in open clusters after first dredge-up (Smiljanic et al. 2009). Likely, the RG in RS Oph has undergone some further mixing, suppressing the 12C/13C ratio still further.
Dust is present in the RS Oph system (Evans et al. 2007; van Loon 2008; Woodward et al. 2008), emitting primarily at λ ≳ 10 μm. Rushton et al. (2010) have modelled the spectral energy distribution (SED) of RS Oph in the near-IR (1–5 μm) and found that Teff is essentially constant over the period 2006 August – 2008 July. Rushton et al. (2010) have shown that there also is evidence for dust emission in the near-IR at 3–5 μm. Observations at longer wavelengths clearly show that this emission by the dust envelope is variable (Rushton et al., in preparation).
In this paper, we do not consider the effect of the dust on the optical spectra: Pavlenko et al. (2008) and Rushton et al. (2010) have shown that even the near-IR spectrum of RS Oph is not affected by emission from the hot (∼500–600 K) dust known to reside in the RS Oph environment, and which is likely a permanent feature of the system.
2 OBSERVATIONS AND REDUCTION
2.1 Optical spectra
An optical spectrum of RS Oph was obtained with the Boller & Chivens (B&C) Spectrograph2 at the Steward Observatory 2.3 m Bok Telescope on Kitt Peak, Arizona over multiple epochs. Details of the observations are presented in Table 1. Also included in Table 1 is the orbital phase ϕ, defined such that ϕ ≃ 0.5 and ∼ 1.0 at quadrature. The ephemeris for the orbit is from Fekel et al. (2000), essentially the same phases are obtained using the parameters in Brandi at al. (2009).
Bok (+B&C Spectrograph) observing log.
| Total | Orbital | |||
|---|---|---|---|---|
| Average | integration | phase | ||
| ut date | airmass | Ncombine | (s) | (ϕ) |
| 2006 Sep 28.11 | 1.51 | 24 | 1440 | 0.52 |
| 2007 May 09.33 | 1.71 | 14 | 840 | 0.98 |
| 2007 May 10.31 | 1.74 | 38 | 2280 | 0.97 |
| 2008 Jun 25.19 | 1.84 | 7 | 210 | 0.84 |
| 2009 May 07.28 | 2.18 | 10 | 225 | 0.50 |
| 2009 May 08.28 | 2.20 | 10 | 450 | 0.48 |
All observations were obtained with a 400 line mm−1 4889 Å first-order grating, using a grating tilt of 6|$_{.}^{\circ}$|5, a 1.5 arcsec wide longslit, and appropriate order blocking filters. The scheme yielded a spectral resolution at the detector of ∼5 Å.
The optical data were reduced in iraf3 using standard two-dimensional optical spectroscopic data reductions techniques (Howell 1992). For each set of observations, multiple B&C spectra were obtained and combined with median filtering to enable removal of cosmic rays prior to extraction. Wavelength calibration was performed using HeArNe calibration lamps with exposures at the position of the target. Corrections for pixel-to-pixel response variations (flat-field) were accomplished using a high intensity quartz-halogen continuum lamp in the instrument. Spectra of spectrophotometric standard stars were obtained at airmasses similar to that of RS Oph to correct for instrumental response and provide flux calibration.
The low-resolution Bok data provide some evidence for variability of the spectra. In the top panel of Fig. 1, we show six spectra across Hβ line obtained on different ut dates. The spectra shown here are normalized to obtain similar pseudo-continuum fluxes around the Hβ λ = 486.1 nm line, seen in emission. Despite the comparatively low resolution (R = 1000) we see noticeable changes in the Hβ emission even on a 1 d time-scale: there are significant changes between 2007 May 9 and 10, and 2009 May 7 and 8 (see upper panel of Fig. 1). These variations in Hβ emission are greater than the uncertainties in flux calibration, and we consider them real. Furthermore, we note the similarity of Hβ on days 2007 May 9 and 2009 May 8, despite the difference of the observed SEDs on the same dates (see bottom panel of Fig. 1). Indeed, we see a relatively stronger Hβ when the disc is in a low state on day 2006 September 26 (see Section 3.2). In the bottom panel of Fig. 1, we show the observed SEDs for the same six dates. Again, the observed SEDs, as well as the Hβ line, change on a time-scale ∼1 d, the data for 2007 May 9 and 10, and for 2009 May 7 and 8, are identified by arrows in the figure. Optical flickering of RS Oph and SED variability are also reported by Worters et al. (2007), Voloshina, Sementsov & Metlov (2008), Kundra, Hric & Gális (2010) and Zamanov (2011).
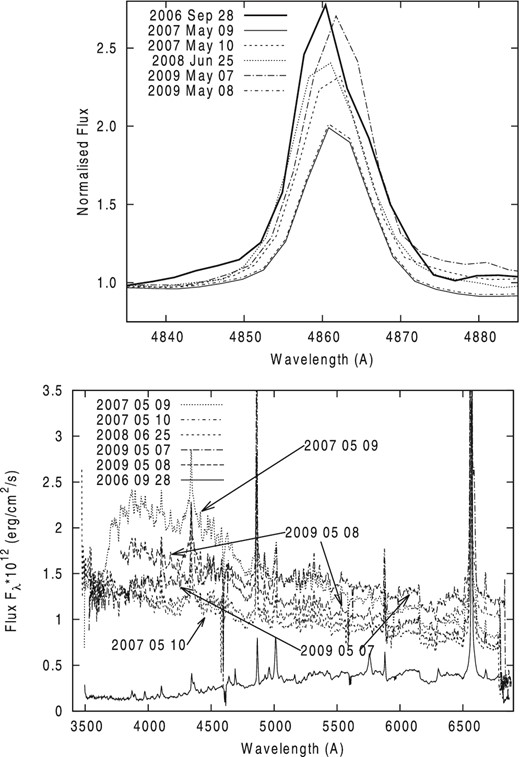
Top: profiles of Hβ on different dates. Fluxes are normalized to the same value at 4835 Å. Bottom: comparison of the observed fluxes in the 2006 September optical spectrum of RS Oph with the observed SEDs on the other dates. These and other figures are available in colour on ftp://ftp.mao.kiev.ua/pub/yp/Papers/2015rsoph
2.2 IR spectrum
IR spectroscopy of RS Oph on various dates (see table 1 in Rushton et al. 2010) was obtained at the United Kingdom Infrared Telescope (UKIRT), with the UKIRT Imager Spectrometer (UIST; Ramsay et al. 2004). The observations were obtained in stare-nod-along-slit mode, with a 2-pixel-wide slit. We obtained data in the different band grisms, giving a spectral coverage of 0.86–5.31 μm and resolution R ∼ 600–2000. We obtained spectra of HR 6493 (F3 V) immediately before we obtained spectra of RS Oph, for calibration purposes. Detailed information about the observational procedure and reduction process is given by (Rushton et al. 2010, see the table 1 therein). For this paper, we have used the spectrum obtained on 2008 July 25, being the nearest date to the optical spectrum; see Section 4.2.
3 THE OPTICAL SPECTRUM
3.1 The spectrum of RS Oph in 2006 September
The earliest spectrum (2006 September) was obtained during the post-outburst minimum, and before the resumption of optical flickering when the AD, which is destroyed by the nova eruption, had not been fully re-established (Worters et al. 2007).
We compare the observed SEDs in 2006 with similar data available for ‘normal’ RGs. Our rationale for this is that, for our purposes, the definition of the SED relates more to the continuum fluxes formed at the level of the photosphere: molecular bands and atomic lines form above the photosphere, where their formation may be affected by processes such as irradiation, chromospheric-like features, etc. Our aim at this stage is to determine effective temperatures.
We found the shape of the SED of RS Oph soon after the 2006 eruption seems very similar to those of known RGs in the STELIB data base.4 A direct comparison of the RS Oph SED from 2006 September with observed fluxes of the K-giants HD54719, HD72184 and HD72324 and the M-giant HD146051 is shown in Fig. 2.
![Left: comparison of the observed fluxes in the 2006 September optical spectrum of RS Oph to the observed SEDs of four template stars taken from the STELIB data base (http://webast.ast.obs-mip.fr/stelib), from the top: HD72324: Teff/log g/[Fe/H] = 4750/1.9/0, HD72184: 4525/2.05/-0.05, HD54719: 4325/2.17/0.02, HD146051: 3783/0.0/0. Right: result of the comparison of observed fluxes of RS Oph in 2006 September with SEDs of the same template stars using χ2 criteria, see Section 4.1. Spectral ranges of the continuum fluxes comparison are marked by solid lines at Flux =1.0 on the left-hand panel.](https://oup.silverchair-cdn.com/oup/backfile/Content_public/Journal/mnras/456/1/10.1093/mnras/stv2546/2/m_stv2546fig2.jpeg?Expires=1749878456&Signature=cHLTNCr3RI3gtEJsvwHgtL7hyerX03j2sXlQGhBN-rUOvsiAkb-mVt61p9Ta3WpTQ1hxq35UcCq6qknZ99lwcS8fz0BHTg3NZQpePoI9pegzeZoWKWSUaRKCnE4Wj-FfiI6Lf7dTdS1HD1LvwYKyUi59fjIQlSdPZQVbpJuJkypmThp4iuV5luVMO0V1nNAjfg-I1V4haAoL2QQMMlJa6R-cYe8KV0xFcUF5pRuLRbdFJzRZMUPpJE85uqE32A4b6XjHUhAyn9rWTWc00FLAQl5Z5U7oKg7UGtDphhyCuAmWjNtKI~H9LbqAFD1plJXRdZXpsDCzUL-dUxLCNlYq5g__&Key-Pair-Id=APKAIE5G5CRDK6RD3PGA)
Left: comparison of the observed fluxes in the 2006 September optical spectrum of RS Oph to the observed SEDs of four template stars taken from the STELIB data base (http://webast.ast.obs-mip.fr/stelib), from the top: HD72324: Teff/log g/[Fe/H] = 4750/1.9/0, HD72184: 4525/2.05/-0.05, HD54719: 4325/2.17/0.02, HD146051: 3783/0.0/0. Right: result of the comparison of observed fluxes of RS Oph in 2006 September with SEDs of the same template stars using χ2 criteria, see Section 4.1. Spectral ranges of the continuum fluxes comparison are marked by solid lines at Flux =1.0 on the left-hand panel.
The atmospheric parameters for the template stars were obtained from Massarotti et al. (2008) (HD54719) and Luck & Challener (2005) (HD72184, HD72324) and Koleva & Vazdekis (2012) (HD146051). The effective temperatures are |${T_{\rm eff}}= 4325$| K (HD54719), |${T_{\rm eff}}= 4525$| K (HD72184) and |${T_{\rm eff}}= 4750$| K (HD72324), and 3783 K (HD146051). These four RGs have solar metallicity, similar gravities, at least within the error bars, and differ by their Teff. Visual inspection of Fig. 2 shows that the effective temperature of the secondary of RS Oph in 2006 September seems to be 4500 ± 200 K, if we ignore the presence of the molecular bands (such as TiO) in the RG spectrum. Such molecular bands may be formed well way from the photosphere, in the cool molsphere (Tsuji 1996) existing around RGs. In the case of a complex system such as RS Oph we should regard the use of spectral features for spectral classification with some caution: the shape of the observed SED is more reliable for determining the effective temperature of the RG. With this caveat, the overall shape of the continuum of RS Oph, as well as some absorption features, agree best with the spectrum of HD72184. The best-fitting SED template to the RS Oph spectrum, using χ2 criteria, confirm this finding, see right-hand panel of Fig. 2. On the other hand, the molecular bands in RS Oph are in better agreement with those in the spectrum of the M-giant HD146051. We revisit the case of RS Oph in Section 4.1.
We acknowledge that our comparison of the continuum SEDs of RS Oph and the RGs to estimate Teff, as in Fig. 2, is very qualitative, because the gravities of the RGs are not well known: a more accurate comparison would compare stars having the same log g, so that the RGs are at the same evolutionary stage as the RG in RS Oph. Furthermore, we should note that the evolution of the secondary in RS Oph, and the physical state of its atmosphere, differs considerably from that of a ‘normal isolated’ RG. However, our simple and phenomenological comparison is model independent. Therefore, we use these results only for the purposes of preliminary evaluation: more robust fits of our theoretical spectra to the observed spectra will be carried out in the Section 4.1.
The data in Fig. 2 show several emission lines superimposed on the spectrum of the RG in RS Oph in 2006 September, and it is also clear that there is a hot component that contributes significantly below 4000 Å. It seems likely that this excess is due to the presence of the re-established AD and indeed our attempt to model this part of the spectrum (see below) appears to confirm this; however we shall see that fitting the SEDs below 4000 Å is possible for a wide range of parameters for the newly reformed AD. A full analysis is beyond the scope of this paper; in general, it is not straight-forward to model this flux excess using only the short wavelength range available at the edge of the observed spectral region. In any case, this excess affects only a narrow spectral region, and to simplify our discussion in the sense of reducing the number of the adopted parameters, we did not take into account the SED at these wavelengths in our analysis. We believe that at wavelengths >4000 Å at least the atomic absorption spectrum of RS Oph is formed mainly in the photosphere of the RG.
3.2 The spectrum at later dates
The observed SEDs of RS Oph at later dates differ considerably from that in 2006 September. In the bottom panel of Fig. 1, we compare observed fluxes in 2006 and at later times. In general, at the later dates, the emission features are stronger, and the continuum is stronger in the blue; the latter is due to the development of the hot AD after 2006 September (Worters et al. 2007). Evidently the contribution of the AD to the observed SED is significant at later dates. As a result, the overall slopes of the observed SED change: the observed fluxes increase to the red in 2006; on later dates the observed fluxes increase to the blue.
A feature at 6160–6290 Å is clearly seen in the spectra of RS Oph for all dates. This is most prominent in the 2006 spectrum, after which its strength decreases (see upper panel of Fig. 3). Likely this is absorption in the TiO γ′ system (Fig. 3 lower panel), which has a band head at 6160 Å and which is known to be the strongest band system in M-star spectra. Interestingly, this feature is weak or even absent in the observed spectra of stars hotter than 4300 K (see Fig. 2). On the other hand, our theoretical modelling predicts the appearance of significant TiO spectral features only for model atmospheres having |${T_{\rm eff}}\lt 4200$| K (Fig. 3 lower panel). The appearance of TiO absorption features, despite being reduced in strength by AD veiling after 2006, indicates the presence of cooler regions in the RG atmosphere (see Section 4.3).
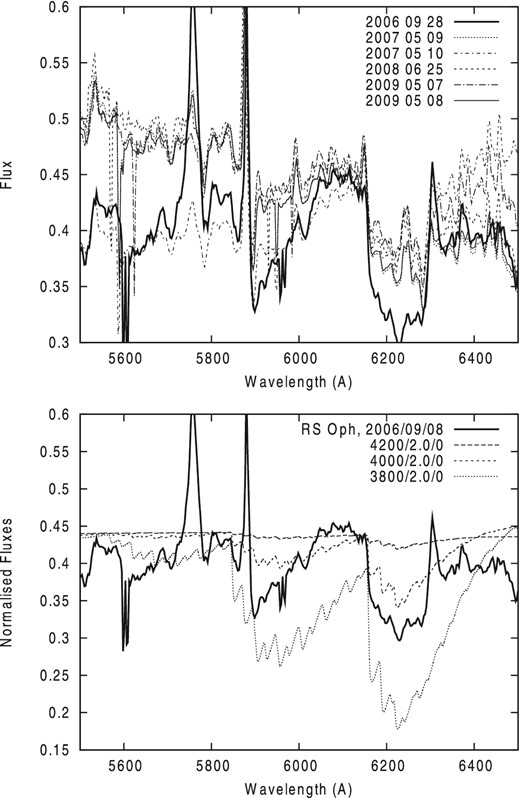
Top: the relative strength of the 6200 Å absorption in RS Oph on the dates indicated. Bottom: comparison of detail in the spectrum of RS Oph around 6200 Å in 2006, with computed model atmospheres having different Teff, showing profiles of the TiO γ′-band system across this spectral region. Theoretical spectra are convoluted with a Gaussian with R = 1200.
3.3 Modelling spectra with an AD
3.3.1 A simple model including an AD
Various values of |$\dot{M}$| for RS Oph have been reported in the literature, ranging from e.g. ∼2 × 10⁻⁸ M⊙ yr−1 (Nelson et al. 2011, based on X-ray observations of RS Oph ∼540–740 d after the 2006 eruption) to ∼3.9 × 10⁻⁶ M⊙ yr−1 (Schaefer 2009, a paper that summarizes literature values of |$\dot{M}$| for RS Oph). As the WD is close to the Chandrasekhar limit, there is little scope for variation in ρ, so this range of |$\dot{M}$| translates to a factor ≲4 in the range of T*. The inner and outer disc radii Rin and Routwere varied to obtain the fit to the observed SEDs.
To factor in the AD we first carried out fits to the data for the later dates, using the lower accretion rates reported for RS Oph, namely |$\dot{M} \sim 2\times 10^{-8}$| M⊙ yr−1. Our numerical modelling shows that the low |$\dot{M}$| values correspond to the SED that shows a drop of flux in the blue part of spectrum of RS Oph such as we see only for 2009 May 7, see Fig. 4. Fits to the observed fluxes in the blue spectrum of RS Oph can be obtained with T* = 20 000 K for 2009 May 7; the solution with |$\dot{M} \sim 2\times 10^{-8}$| M⊙ yr−1 with the parameters listed in Table 3.
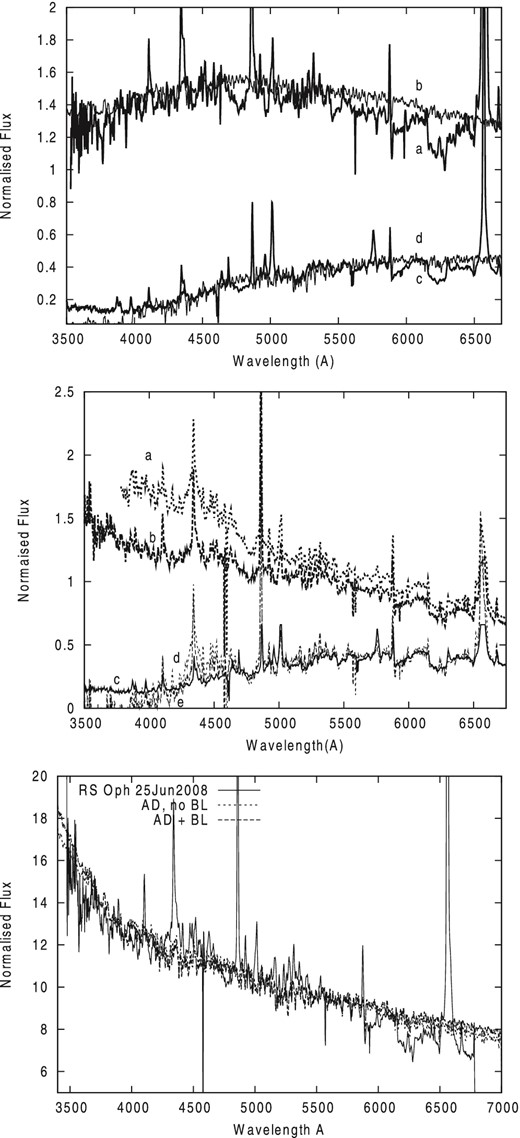
Top: comparison of the SED observed on 2009 May 07 (a) with a model spectrum RG+AD (b), and extracted spectrum (d) with 2006 September 9 (c). Parameters of the RG model atmosphere and AD are |${T_{\rm eff}}= 4200$| K, log g = 2.0 and T* = 20 000 ± 3 000, respectively. Middle: the observed spectra of RS Oph in 2006 September 09 (c), 2008 June 25 (b) and 2009 May 08 (a), and the spectra of 2008 June 25 (e) and 2009 May 08 (d) after the extraction of the AD contribution. Bottom: comparison of the SED observed in 2008 June 25 (thick line) with theoretical fluxes computed for our accretion model discs with and without BL.
However, observed SEDs for other dates do not show the same drop in the blue part of the spectrum: they seem to require a higher T*, corresponding to a higher |$\dot{M}$|. For our present purposes, we adopt T* = 68 000 K, yielding a maximum disc temperature Tmax ≃ 33 300 K and which corresponds to the higher accretion rate, ∼3.9 × 10⁻⁶ M⊙ yr−1. Indeed for this accretion rate, we obtain fits of similar quality for the other four dates (see Table 2). This procedure allows us to extract the contribution of the AD from the five spectra that appear to be affected by the presence of the disc. We refer to these spectra as ‘AD-extracted’.
There is general agreement for the parameters Rin and Rout derived from the fits to the observed spectra using the simple AD model for 2007 May 10 and 2008 Jun 25 (see Table 2); in view of the fact that all the spectra were obtained close to quadrature (see Table 1) this is perhaps not unsurprising. We note that, in this model, Rin and Rout depend on the normalization constant used to fit theoretical spectra to the observed SEDs. We also note that the values of Rin and Rout given in Table 2 are for normal orientation of the orbital plane. Taking into account the orbital inclination of RS Oph, i = 39° (Riberio et al. 2009), we obtain more realistic values for the outer radius Rout of the disc of ≃10 R⊙ and ≃12 R⊙. These agree within a factor ∼3 of theoretical estimates by Wynn (2008), King & Pringle (2009) and more recently Alexander et al. (2011), who predict that the Roche lobe in RS Oph may extend to 25 R⊙, and that the radius of the AD should be ∼17 R⊙.
Parameters Rin and Rout of the AD1 model, in R⊙, here |$\dot{M} = \sim \!3.9\times 10^{-6}$|.
| Date | T* (K) | Rin | Rout |
|---|---|---|---|
| 2007 May 09 | 68000 | 0.5 ± 0.1 | 7.2 ± 1.5 |
| 2007 May 10 | 68000 | 0.42 ±0.08 | 6.5 ± 1.5 |
| 2008 Jun 25 | 68000 | 0.42 ±0.08 | 6.5 ± 1.5 |
| 2009 May 07 | 20000 | 1.0 ± 0.1 | 7.5 ± 1.5 |
| 2009 May 08 | 68000 | 0.76 ±0.15 | 8.0 ± 1.5 |
| Date | T* (K) | Rin | Rout |
|---|---|---|---|
| 2007 May 09 | 68000 | 0.5 ± 0.1 | 7.2 ± 1.5 |
| 2007 May 10 | 68000 | 0.42 ±0.08 | 6.5 ± 1.5 |
| 2008 Jun 25 | 68000 | 0.42 ±0.08 | 6.5 ± 1.5 |
| 2009 May 07 | 20000 | 1.0 ± 0.1 | 7.5 ± 1.5 |
| 2009 May 08 | 68000 | 0.76 ±0.15 | 8.0 ± 1.5 |
3.3.2 A two-component model for the hot source
Our modelling suggests that the spectrum for 2009 May 7 seems not to have any BL contribution, or this contribution is very weak. For the other spectra we adopt the same T* as for 2009 May 7, namely 20 000 K, which corresponds to lower accretion rate. Following Frank et al. (2003), TBL = 5 ÷ 10 T*; for all our cases we found best fits for TBL = 10T* = 200 000 K. In this case all the other spectra can be fitted by varying only the contribution of the BL, but with reducing k by the factor ∼3. For the AD2 model this can be accounted for by changes in column density of the emitting material. Note that f seems to change by a factor 2.5 on a time-scale of 1 d (see Table 3), if the changes in the observed SEDs are real. Of course other solutions with higher T* and lower BL contribution may also be possible.
Parameters Rin and Rout of the AD2 model, in R⊙, here |$\dot{M} = \sim \!2\times 10^{-8}$|. We adopted for all dates T* = 20000 K, Rin = 1.0 ± 0.2, Rout = 7.5 ± 1.5.
| Date | TBL (K) | f × 10−9 |
|---|---|---|
| 2007 May 09 | 200 000 | 10 |
| 2007 May 10 | 200 000 | 4 |
| 2008 Jun 25 | 200 000 | 4 |
| 2009 May 07 | no BL | no BL |
| 2009 May 08 | 200 000 | 6.5 |
| Date | TBL (K) | f × 10−9 |
|---|---|---|
| 2007 May 09 | 200 000 | 10 |
| 2007 May 10 | 200 000 | 4 |
| 2008 Jun 25 | 200 000 | 4 |
| 2009 May 07 | no BL | no BL |
| 2009 May 08 | 200 000 | 6.5 |
In the lower panel of Fig. 4 we compare fits of our theoretical spectra, computed with AD1 and AD2, and different accretion rates to the spectrum observed on 2008 June 25. We find rather marginal differences for fits by models with different accretion rates. The models are similar in their representation of the observed fluxes and provide physically plausible solutions. To provide a more conclusive result, we adopt a more sophisticated approach, modelling the SEDs in a broader spectral range.
4 MODELLING OBSERVED SEDS OF THE SECONDARY
4.1 Fit to the optical spectrum of RS Oph
We found that the observed optical SEDs in 2007–2009, after the extraction of the AD contribution, are very similar to the AD-free spectrum observed in 2006 September, except for the emission lines which change in intensity; see Fig. 4 for the dates in 2008, 2009. This provides strong confirmation of our suggestion that the physical state of the RG atmosphere does not change during 2006–2009. Noting that the removal of AD is highly model-dependent, we use in our further analysis the optical spectrum obtained in 2006, which is minimally affected by AD emission: analysis of the 2006 spectrum should provide the most satisfactory result because the data were obtained at a time when the AD was weak or absent.
We determined the effective temperature of the RG by fitting theoretical fluxes to the observed SEDs in 2006 September. A small grid of classical model atmospheres in the Teff range 3500–4700 K with steps of 100 K, log g = 0, 1, 2, and abundances obtained in Pavlenko et al. (2008) was computed with the SAM|$\scriptstyle{12}$| program (Pavlenko 2003). Details of the atomic and molecular line lists are described in Pavlenko et al. (2008, 2010). Atomic line parameters are from VALD (Kupka et al. 1999), and the molecular lines of TiO, MgH, CN are from the line lists of Plez (1998), Kurucz (1993) and Yakovina et al. (2012), respectively. Abundances of carbon and nitrogen were taken from Pavlenko et al. (2008). We adopted a microturbulent velocity of Vt = 3.0 km s−1. For the model atmospheres we computed synthetic spectra in the local thermodynamic equilibrium approximation using the WITA|$\scriptstyle{618}$| program (Pavlenko 1997).
Our computations were carried out for a wide range of effective temperatures and gravities. Strictly, log g = 1–2, the range of log g for the RG, while log g = 0 relates more to luminosity class II. On the other hand, the physical state of the atmosphere of the RG in RS Oph differs from that of an isolated ‘normal’ M-giant as the RG in this case is the secondary in an interacting binary system, with the resultant effects of irradiation, tidal distortion, strong stellar wind etc. The parameter log g should be regarded as an ‘effective’ gravity, averaged over the time of observations; ‘gravity’ in the conventional sense cannot be used to describe gravitational properties in dynamically changing system. Fortunately, the orbital period of RS Oph is sufficiently long that quasi-stationary equilibrium is established in the RG atmosphere, at least at the level of its photosphere.
The results of fitting our theoretical spectra to the spectrum of RS Oph in 2006 are unexpected. Formally the best solution is for model atmospheres with log g = 0.0 and 1.0, which provide well marked minimum S = 1.836 ± 0.002 and S = 2.004 ± 0.002 at Teff = 4600 K and 4500 K, respectively. In general, these results agree with those we obtained from comparison of the observed SEDs of RS Oph with template stars (see Section 3.1). On the other hand, the best solution for model atmospheres having log g = 2.0 leads to a much lower Teff, 3900 K with S = 1.731 ± 0.002. Furthermore, a local minimum for S at 3800 K is seen in the S–Teff plot computed for model atmospheres with log g = 1.
Nevertheless, the formal fits to the observed SEDs (Fig. 5) and comparison with the optical spectra of template stars (see Fig. 2) provide a wide range of the effective temperature for the photosphere of the RG in RS Oph, Teff = 3900-4700 K, with uncertainties ±100 K. Our fits show that, by lowering log g, we obtain higher Teff due to the decreased strength of TiO bands in the models having lower log g.
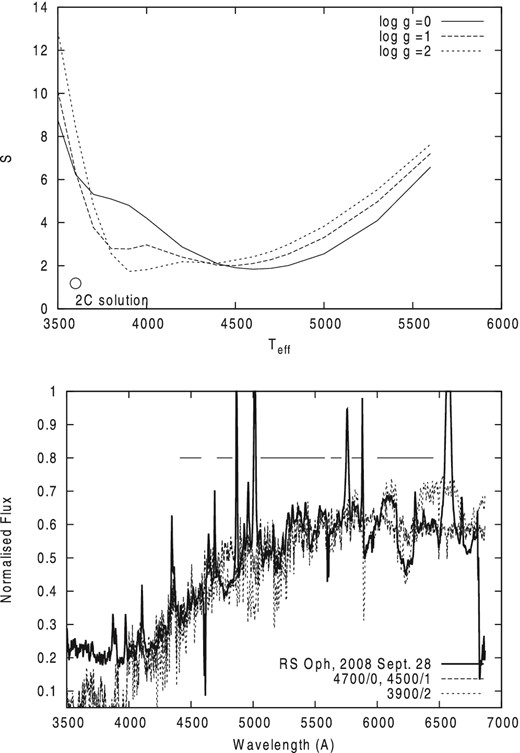
Top: minimization parameter S derived in the fitting of our synthetic spectra with model atmospheres of different Teff and log g to the SED of RS Oph observed in 2006. Circle on top panel shows solution (3600/0.0) found with 2C model (see Section 4.3). Bottom: the best fit of synthetic spectra, computed with a 4700/0.0, 4500/1.0 and 3900/2.0 model atmospheres to the SED of RS Oph observed in 2006. Horizontal lines show the spectral regions used to compute S. Vertical scale arbitrary.
By using optical spectra, we have obtained a noticeably different effective temperature for the RS Oph secondary to that obtained from modelling the IR spectra (4100 ± 100 K; Pavlenko et al. 2008).
4.2 Fit to the IR spectrum of RS Oph
In this section we analyse the IR spectrum of the RG, as observed 2 yr after the 2006 eruption, on 2008 July 15 (see Section 2.2). Within 2 yr of the eruption, the photosphere and the structure of the convective envelope of the secondary had recovered, and the AD had reformed into a quasi-stable state.
Consequently, for the 2008 data, we can expect a noticeable contribution from the AD to the entire RS Oph spectrum, even in the IR. To remove the contribution of the AD from the IR spectrum of RS Oph observed in 2008 July 15, we use the procedure already described in Section 3.3; these data will again be referred to as ‘AD-extracted’.
As before, synthetic spectra for 1.2 < λ( μm ) < 2.5 were computed, including absorption from TiO, H2O, CO, CN for the grid of atmospheres. These spectra were then fitted to the AD-extracted IR spectrum of RS Oph on 2008 July 15.
The dependence of the parameter S on Teff, obtained by fitting our synthetic spectra to the AD-extracted IR spectrum of RS Oph on 2008 July 15 is shown in the upper panel of Fig. 6. In the middle panel, we show the best fit to the observed spectrum of RS Oph. Our new fit to the observed and extracted IR spectrum was carried out over a broader wavelength region, at 1.2 < λ( μm ) < 2.3, than in Pavlenko et al. (2008). As before, the strong spectral features (such as emission lines or strong telluric bands) were excluded from consideration. The best fit to the AD-extracted IR spectrum results in lower temperatures, 3700–3800 K, for our adopted log g, than was obtained by Pavlenko et al. (2008); see Fig. 6.
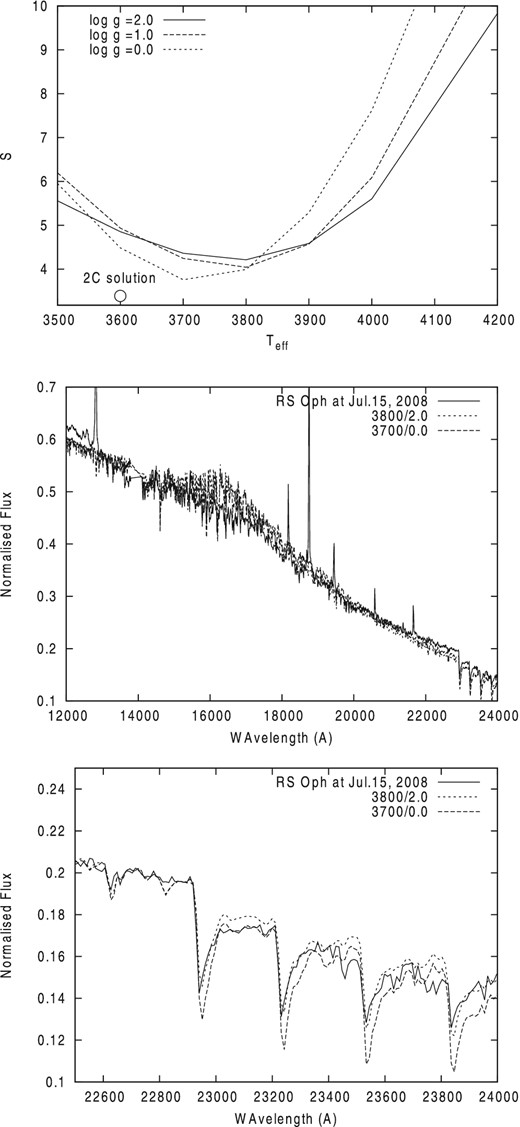
Top: dependence of S on Teff obtained by fitting synthetic spectra to the AD-extracted IR spectrum of RS Oph from 2008 July, 15. Circle on top panel shows solution (3600/0.0) found with two-component model (see Section 4.3). Middle: the best-fitting synthetic spectrum computed for a Teff/log g 3800/2.0 and 3700/0.0 model atmosphere to the non-extracted spectrum from 2008 July 15. Bottom: fit of synthetic spectra computed for 3800/2.0 and 3700/0.0 model atmospheres to CO molecular bands in the same observed spectra.
The effective temperature of the secondary in RS Oph, obtained by fitting the IR spectral region, is consistent with the lower end of the temperature range determined from the optical spectra. Moreover, a comparison of the observed and computed IR spectra for Teff/log g = 3800/2.0 in the spectral range containing the CO first overtone bands (λλ2.28–2.4 μm) shows good agreement (see the bottom panel of Fig. 6). This spectral range is severely affected by telluric absorption, and usually only the first two bands with heads at 2.29 and 2.32 μm can be used for analysis (see Pavlenko, Jones & Longmore 2003; Pavlenko et al. 2010). Nevertheless, despite the comparatively low resolution of our observed spectrum at these wavelengths, these results correspond well enough with Teff/log g = 3900/2.0 obtained from the fit to the SED in the optical spectral region (Fig. 3). We note that Teff= 3900 K does not agree with a higher effective temperature for the RG obtained from comparison of the observed optical spectra with template stars (see Fig. 2).
On the other hand, our low-temperature model cannot fit the broad feature around 1.6 μm, commonly attributed to the H− ion opacity at these wavelength; this is more prevalent in the spectra of cooler stars: in K–G giants it is much weaker or absent. In a sense the absence or weakness of this feature in the observed IR spectrum of RS Oph supports the choice of a higher Teff for the RG (see fits in Pavlenko et al. 2008, where a higher Teff was adopted). This is discussed further in the next section.
4.3 A two-component model atmosphere of RG
We have derived the effective temperature of the secondary star in RS Oph from IR data, and noted discrepancies in our results obtained from the optical spectra. Although the shape of the continuum indicates a relatively high effective temperature, the TiO bands in the same data set suggest a lower effective temperature. It is clearly desirable to reproduce the observed optical continuum and absorption spectrum by a single model.
First, we consider a hotter pseudo-photosphere to account for the higher temperature implied by the optical continuum. This could be due to heating of the outermost layers of the RG atmosphere by irradiation from the primary. However, such a one-component model cannot account for the presence of the TiO bands in the observed optical spectrum. A possible explanation is that these bands might form in a cool envelope outside the RS Oph system, such as the torus harbouring the dust reported by Evans et al. (2007). However, the inclination of the RS Oph system is unlikely to lead to the TiO absorption observed. Also, the presence in the observed spectrum of strong emission lines provide some evidence that the outermost layers of the envelope consists of hot ionized plasma. We conclude that model atmospheres with cool outer layers are not realistic and we explore a two-component model such as might arise from irradiation of the RG by the WD.
Irradiation affects only the hemisphere facing the primary. Therefore, we would expect to see at least two temperature components in the RG atmosphere: a low-temperature region, in which the IR emission and TiO absorption arise, and an irradiated, hotter region, where at least a part of the continuum flux in the optical is formed. The hot region of the RG atmosphere is most likely located in a spot facing the primary. In this region, the TiO bands will be veiled by the hotter continuum, as seen in the spectrum of RS Oph. Multicomponent model atmospheres have been invoked to account for stellar spectra where there are both hot and cool regions on the photosphere (see Strassmeier et al. 1997).
The procedure is as follows:
fit synthetic spectra to the IR AD-extracted spectra of RS Oph and determine the best solution;
then
fit the AD-extracted optical spectrum observed for 2006 September, using the best-fitting parameters in the IR as the starting point.
Ideally we would have obtained spectra in the IR and optical spectral regions at the same time. However, the dates of observations of the optical and IR spectra differ by about 20 d. We note that this period is not significant compared to the orbital period of the system in 453.6 d (e.g. Brandi at al. 2009), but short period variations are seen on occasion, as noted in Section 2.1. Nevertheless, the optical spectrum of 2008 July 15 is similar to that of 2006 September 9, after the AD has been extracted (see the middle panel Fig. 4).
Initial numerical experiments clearly excluded the presence of regions with |$T_{\rm eff}^{\ast }$|>5800 K in the RG atmosphere. An example of our fits to the AD-extracted spectra of RS Oph, with a two-component model having |${T_{\rm eff}}= 3600$| K and |${T_{\rm eff}^{\ast }}= 8000$| K, is shown in the lower panel of Fig. 7. Fits to the IR part of the spectrum seem satisfactory, with a = 98 per cent, but the fit to the optical part of spectrum is very poor (see bottom panel of Fig. 7).
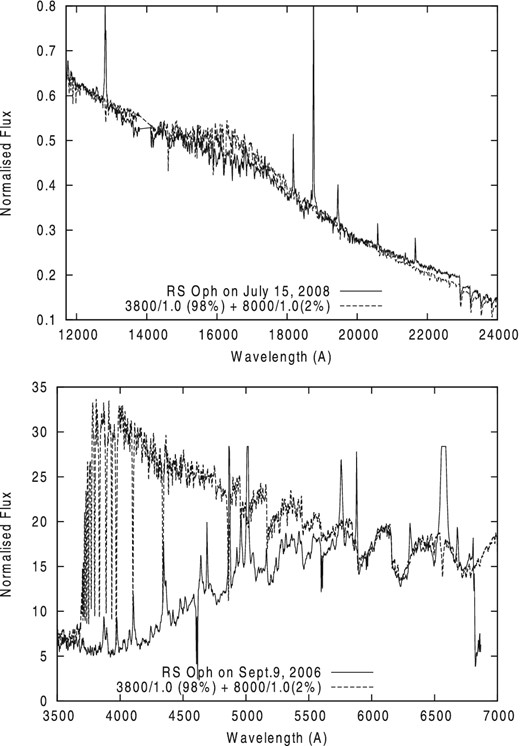
Top: best fits to the AD-extracted IR spectrum of RS Oph on 2008 July 15 with the two-component model: (98 per cent with |${T_{\rm eff}}/\log {g} = 3700/1.0$| and 2 per cent with 8000/1.0). Bottom: fits of the AD-extracted optical spectrum on 2006 September 9 with the same model.
Numerical modelling of our spectra using the two-temperature model allows us to determine a range of Teff in the hotter part of photosphere, |$4400 \lt {T_{\rm eff}^{\ast }}\mbox{(K)} \lt 5600$|. Within this |$T_{\rm eff}^{\ast }$| range for the hotter atmospheric region, we obtain reasonable fits to both optical and IR spectra, with the inclusion of the cooler component. For all two-temperature synthetic spectra, we compute the parameter S, with minimum S as usual giving the best fit to the AD-extracted fluxes in the IR spectra.
The best fit to the secondary optical spectrum of 2006 September 26 was obtained with |${T_{\rm eff}}/\log {g}= 3600/0.0$| for 90 per cent of the RG surface, and |$T_{\rm eff}^{\ast }$|/log g = 5000/0.0 with S = 3.131 ± 0.002 for 10 per cent (see Table 4). In general the optical spectrum is much more sensitive to the adopted Teff; therefore we should regard this result with more confidence in comparison with that obtained from the fits to IR spectrum. Nevertheless, the same model provides one of the best fits to the RS Oph IR spectrum with S = 3.39 ± 0.002. We see better solutions for the IR spectrum with lower Teff for all |$T_{\rm eff}^{\ast }$|, in comparison with that found from the fits to optical spectrum. Interestingly, most of our best solutions of fits to optical and IR spectra were found for a = 0.8 ÷ 0.98 (see Table 4).
Parameters of two-component model atmospheres determined for the best fits to the observed optical and IR spectrum in the format (Teff/log g: a) followed by the computed S for the corresponding fits. Here |$T_{\rm eff}^{\ast }$| is the effective temperature of the heated part of RS Oph photosphere. Only three first the ‘best’ solutions are given in the ascending order of S.
| Fits to the optical spectrum | |||
|---|---|---|---|
| |$T_{\rm eff}^{\ast }$|: 4400 K | 5000 K | 5300 K | 5600 K |
| 3800/2.0: 0.7 | 3600/0.0: 0.9 | 3800/1.0: 0.95 | 3800/1.0: 0.95 |
| 1.273 ± 0.002 | 1.186 ± 0.002 | 1.221 ± 0.002 | 1.328 ± 0.002 |
| 3800/2.0: 0.8 | 3800/1.0: 0.9 | 3700/0.0:0.95 | 3700/0.0: 0.95 |
| 1.297 ± 0.002 | 1.193 ± 0.002 | 1.321 ± 0.002 | 1.344 ± 0.002 |
| 3700/2.0:0.7 | 3700/1.0:1.20 | 3700/1.0:.95 | 3800/1.0: 0.98 |
| 1.315 ± 0.002 | 1.202 ± 0.002 | 1.378 ± 0.002 | 1.419 ± 0.002 |
| Fits to the IR spectrum | |||
| |$T_{\rm eff}^{\ast }$|: 4400 K | 5000 K | 5300 K | 5600 K |
| 3500/0.0: 0.8 | 3500/0.0: 0.9 | 3500/0.0: 0.9 | 3500/0.0: 0.9 |
| 3.413 ± 0.002 | 3.131 ± 0.002 | 2.945 ± 0.002 | 3.086 ± 0.002 |
| 3500/1.0: 0.8 | 3500/1.0: 0.9 | 3600/0.0: 0.95 | 3600/0.0: 0.95 |
| 3.588 ± 0.002 | 3.364 ± 0.002 | 3.217 ± 0.002 | 3.150 ± 0.002 |
| 3600/0.0: 0.9 | 3600/0.0: 0.9 | 3500/1.0: 0.9 | 3500/0.0: 0.95 |
| 3.586 ± 0.002 | 3.390 ± 0.002 | 3.231 ± 0.002 | 3.167 ± 0.002 |
We recall that both best fits to the optical and IR spectra of RS Oph for the two-component model atmosphere were obtained with lower S than for the classical model atmospheres (see Figs 5 and 6).
On the other hand, we obtained these results by modelling optical and IR spectra from 2008 separated by 20 d; we believe that RS Oph was in a quiescent state over this period. Indeed the optical spectrum on 2008 June 25 seems, after extraction of the AD, very similar to its state in 2006, when there was no disc contribution.
In the lower panel of Fig. 8, we show the fit to the observed CO bands. We see a qualitative agreement between theory and observations. In this case, we obtain the result with a model atmosphere having lower Teff and log g. The results in Fig. 8 show rather a weak dependence on the adopted value log g. We choose the fit with log g = 0 because this value provides a better fit to some of the spectral detail in the optical region. However, the resolution of our spectra restricts our ability to draw any definitive conclusions: to determine log g we require echelle spectra. In general the satisfactory reproduction of the CO bands provides independent evidence that, for the 2008 dates for which we have data, RS Oph was in quiescent mode. Any reduction in the intensity of the CO bands would imply changes in the temperature structure of the line-forming region rather than the presence of chemical peculiarities.
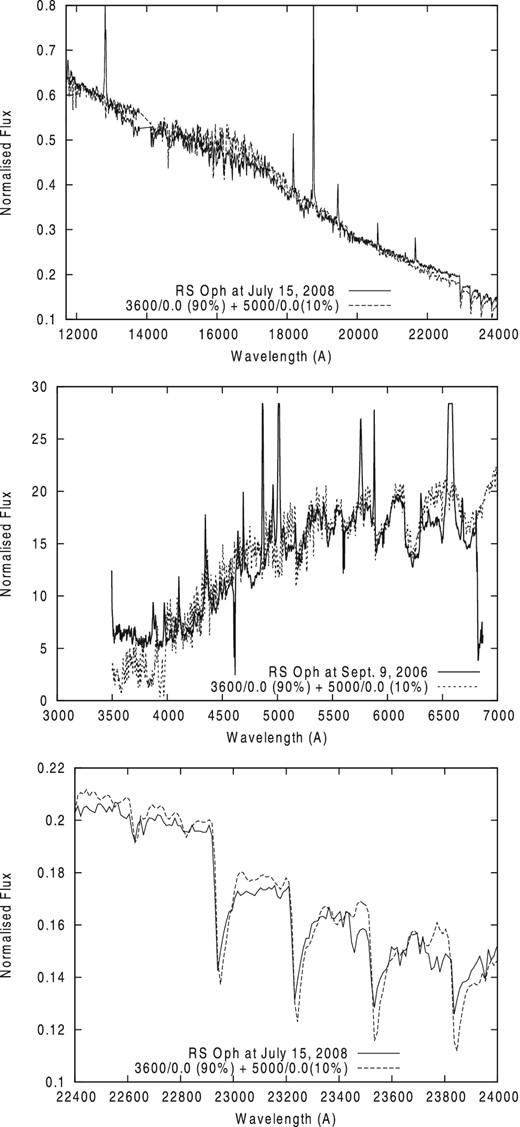
Top: best fit to the AD-extracted IR spectrum observed on 2008 July 15. with the two-component model: (90 per cent of 3600/0.0 and 10 per cent of 5000/0.0). Middle: the fit of the optical spectrum from 2006 with the same model. Bottom: the fit of two-temperature model spectrum to the CO bands observed on 2008 July 15.
Problems with reproducing the H− feature at 1.6 μm persist in our two-component model. The weakness of the feature in RS Oph provides an argument in favour of the high-temperature model. It is almost certain that the actual structure of RG atmosphere is more complex than is described by our two-temperature model. We will defer a study of these phenomena to forthcoming papers using more accurate optical and IR data from the same epoch.
5 DISCUSSION AND CONCLUSIONS
We have re-examined the IR spectrum of RS Oph obtained in 2008. To extract the contribution of the AD from the observed SED we developed two models of the AD: one, a single-component model, with accretion rate ∼3.9 × 10⁻⁶ M⊙ yr−1 and a second, two-component model, with a hot BL and accretion rate ∼2 × 10⁻⁸ M⊙ yr−1. These models provide reasonable fits to the optical spectral region for observation dates in 2007–2009.
Our analysis shows that the SED of the RG and the intensities of the emission lines vary on a short (≲1 d) time-scale. We suggest that these changes are due to AD and/or hot BL variability.
The extracted IR spectra provide similar RG parameters for the two AD models. After subtracting the contribution of the AD, the IR spectrum observed on 2008 July 15 yields a lower Teff by comparison with our earlier work. A fit to the observed spectrum in 2008 September confirms our finding of a relatively low Teff. On the other hand, a comparison of the optical data with the spectra of template stars suggests a much higher |${T_{\rm eff}}= 4500\pm 100$| K.
To explain the observed discrepancy we developed a more elaborate model, in which there is a hot region on the surface of the comparatively cool RG. The hot region can most likely be explained by irradiation of the RG by the WD: the hotter part of atmosphere extends to the photospheric layers.
Below we summarize the main results of this paper.
The optical spectrum of RS Oph observed on 2008 June 25, after extraction of contribution of AD, is similar to those obtained in 2006, several months after the RN eruption.
The IR spectrum of RS Oph from 2008 July 15 consists of the RG photosphere, together with a contribution from the AD. To obtain the photospheric fluxes, we used the same procedure to extract the AD flux as for optical spectrum.
Our model is only valid if the physical state of the RG atmosphere is determined mainly by its internal physical state. In this case, the visible variations of the system are determined by the changes in the AD. The good agreement between the optical spectrum from 2006 and AD-extracted spectrum from 2008 provide some indirect confirmation of comparatively stable state of the photosphere of RS Oph. The observed short-time variations are due to disc and/or hot BL variability phenomena, not the processes in photosphere of the RG.
With our comparatively simple two-component model we can account for the main observed phenomena:
the difference between the formal Teff obtained from fits to optical and IR SEDs in the framework of the classical modelling stellar spectra
the presence of strong TiO bands in the spectrum of the RG with formally determined |${T_{\rm eff}}=4500$| K for the classical 1D model atmosphere.
There are of course some remaining issues, yet to be investigated, with the proposed two-component model, for example the dependence of the observed parameters on orbital phase. By chance, our data were obtained near quadrature; further optical–IR spectra, obtained at phase ϕ ≃ 0.75 when the irradiated hemisphere of the RG is not visible, and ϕ ≃ 0.25 with the WD in front of the RG, would be valuable to test our suggestion of an irradiated RG. Such observations would be relatively easy to obtain. Also valuable, but less straight-forward from a scheduling point of view, would be a long series of low-resolution observations at various phases, complemented by high-resolution monitoring.
This work was supported by an International Joint Project Grant from the UK Royal Society. YP's and BK's studies are partially supported by FP7 Project No: 269193 ‘Evolved stars: clues to the chemical evolution of galaxies’. This work was co-funded under the Marie Curie Actions of the European Commission (FP7-COFUND). This research has made use of the SIMBAD data base, operated at CDS, Strasbourg, France. The UKIRT was operated by the Joint Astronomy Centre on behalf of the Science and Technology Facilities Council of the U.K. We thank the anonymous Referee for his/her thorough review and highly appreciate the comments and suggestions, which significantly contributed to improving the quality of the publication.
Present Address: SOFIA Science Center, USRA, NASA Ames Research Center, M.S. 232-12, Moffett Field, CA 94035, USA
iraf is distributed by the National Optical Astronomy Observatory, which is operated by the Association of Universities for Research in Astronomy, Inc., under cooperative agreement with the National Science Foundation.
REFERENCES
