


Abstract
We report deep optical integral-field spectroscopy with the Multi-Unit Spectroscopic Explorer (MUSE) at the Very Large Telescope of the luminous radio-quiet quasi-stellar object (QSO) PG 1307+085 obtained during commissioning. Given the high sensitivity and spatial resolution delivered by MUSE, we are able to resolve the compact (re ∼ 1.3 arcsec) elliptical host galaxy. After spectroscopic deblending of the QSO and host galaxy emission, we infer a stellar velocity dispersion of σ* = 155 ± 19 km s−1. This places PG 1307+085 on the local MBH–σ* relation within its intrinsic scatter but offset towards a higher black hole mass with respect to the mean relation. The MUSE observations reveal a large extended narrow-line region (ENLR) around PG 1307+085 reaching out to ∼30 kpc. In addition, we detect a faint ionized gas bridge towards the most massive galaxy of the galaxy group at 50 kpc distance. The ionized gas kinematics does not show any evidence for gas outflows on kpc scales despite the high QSO luminosity of Lbol > 1046 erg s−1. Based on the ionized gas distribution, kinematics and metallicity we discuss the origin of the ENLR with respect to its group environments including minor mergers, ram-pressure stripping or gas accretion as the likely scenarios. We conclude that PG 1307+085 is a normal elliptical host in terms of the scaling relations, but that the gas is likely affected by the environment through gravity or ambient pressure. It is possible that the interaction with the environment, seen in the ionized gas, might be responsible for driving sufficient gas to the black hole.
1 INTRODUCTION
1.1 Black hole–spheroid relations
An important question in the study of galaxy evolution is the origin of the relations between the mass of the central super-massive black hole (BH) and the properties of the host galaxy spheroid, discovered nearly two decades ago (Kormendy & Richstone 1995; Magorrian et al. 1998; Ferrarese & Merritt 2000; Gebhardt et al. 2000). Mergers or feedback from BHs growing through accretion in active galaxies have been suggested as potential driving forces of the implied BH–galaxy co-evolution (for a recent review see Kormendy & Ho 2013).
Galaxies hosting active galactic nuclei (AGN) are not only promising candidates for providing direct evidence for such a co-evolution, they can also be used to study the scaling relations over cosmic times. Many studies suggest that BH growth precedes spheroid assembly (Treu, Malkan & Blandford 2004; McLure et al. 2006; Peng et al. 2006a,b; Shields et al. 2006; Woo et al. 2006, 2008; Salviander et al. 2007; Treu et al. 2007; Gu, Chen & Cao 2009; Jahnke et al. 2009; Bennert et al. 2010, 2011; Decarli et al. 2010; Merloni et al. 2010; Wang et al. 2010); however, other studies find no significant evolution with redshift (e.g. Shields et al. 2003; Shen et al. 2008a; Salviander & Shields 2013; Schramm & Silverman 2013; Salviander, Shields & Bonning 2015; Shen et al. 2015; Sun et al. 2015). The likely reason for the disagreement is that the studies are differently affected by intrinsic scatter in the relation, selection effects, and observational biases (see e.g. Lauer et al. 2007; Volonteri & Stark 2011; Schulze & Wisotzki 2014). Another issue is that the MBH–σ* relation is not well constrained even for local AGN host galaxies at the high-mass end. Especially for the AGN appearing as quasi-stellar objects (QSOs), the bright nuclear point source often outshines its host galaxy. Measurements of the spheroid properties are therefore difficult, in particular the stellar velocity dispersion for which high signal-to-noise (S/N) spectra are needed. Thus, many studies focus on Seyfert galaxies often using aperture spectra which integrates over the central few kpc of the host galaxy (e.g. Greene & Ho 2006; Woo et al. 2006, 2008; Treu et al. 2007; Shen et al. 2008a; Matsuoka et al. 2015). The side effect is that, if present, a significant disc contribution may be included, questioning the definition of the spheroid stellar velocity dispersion in these cases. Bennert et al. (2015) study the effect of different definitions of σ* in the literature for a sample of 66 local Seyfert-1 galaxies and find that it can vary by up to 40 per cent.
Active early-type or elliptical galaxies are therefore ideal targets to constrain the MBH–σ* relation as they lack a disturbing disc component. The colours of early-type QSOs, however, are still bluer than their quiescent counterparts (e.g. Jahnke, Kuhlbrodt & Wisotzki 2004b; Sánchez et al. 2004; Zakamska et al. 2006; Trump et al. 2013; Matsuoka et al. 2014). This clearly suggests that the phase of BH growth is also accompanied with a significant growth of the spheroid through star formation. Whether AGN feedback is responsible to quench star formation in these systems is still debated. Direct evidence for AGN feedback is provided by the kinematics of the highly ionized gas on kpc scales, the so-called extended narrow-line region (ENLR). In some cases, broad emission lines components with a line width of >500 km s−1 have been found around radio-quiet (e.g. Davis et al. 2012; Liu et al. 2013; Harrison et al. 2014) and radio-loud AGN (e.g. Fu & Stockton 2006; Guillard et al. 2012; Tadhunter et al. 2014), but not all luminous AGN show these prominent kinematic disturbances on kpc scales (e.g. Husemann et al. 2010, 2013). In some cases, the morphology and size of the ENLR rather suggests interactions with neighbouring galaxies (e.g. Villar-Martín et al. 2010; da Silva et al. 2011) or the environmental gas (Husemann et al. 2011) as the origin of the gas reservoir.
In this paper we present, for the first time, deep wide-field optical integral-field spectroscopy for the luminous radio-quiet QSO PG 1307+085 at z ∼ 0.15 hosted by an undisturbed elliptical galaxy. The main aim of this paper is (i) to recover the optical stellar continuum and measure σ* as well as the systemic redshift of the host galaxy, and (ii) to characterize the physical conditions and kinematics of the full 2D distribution of ionized gas around PG 1307+085 to understand the origin of the extended gas.
Throughout the paper, we adopt canonical cosmological parameters H0 = 70 km s−1 Mpc−1, Ωm = 0.3, and |$\Omega _\Lambda =0.7$|.
1.2 Previous work on PG 1307+085
The QSO PG 1307+085 was discovered by the Palomar–Green (PG) survey as a UV-excess source at the coordinates 13h09m47s + 08°19′48″ (J2000). A magnitude of mB = 15.28 and a redshift of z = 0.155 was reported by the Bright Quasar Survey (BQS; Schmidt & Green 1983). Very Large Array (VLA) observations of the BQS sample by Kellermann et al. (1989) detected only weak radio emission (S1.4 GHz = 3.5 mJy), consequently classifying PG 1307+085 as a radio-quiet QSO with an R parameter of 0.1 following the definition and classification of Kellermann et al. (1989). As a bright low-redshift QSO, PG 1307+085 has been studied in detail with follow-up observations from X-ray to radio wavelength.
The underlying host galaxy was first detected by McLeod & Rieke (1994) in the H-band from the ground. They reported a host magnitude of mH = 15.25 mag, a factor of 4 fainter than the QSO. Observations with the Hubble Space Telescope (HST; Bahcall, Kirhakos & Schneider 1994; Bentz et al. 2009; Veilleux et al. 2009) and deep adaptive-optics (AO) ground-based H-band imaging (Guyon, Sanders & Stockton 2006) spatially resolved the underlying host galaxy and consistently classified it as an undisturbed elliptical galaxy. From 2D image modelling, Bahcall et al. (1997) and Veilleux et al. (2009) reported an effective radius of re ∼ 1.3 arcsec (3.5 kpc) and a host galaxy magnitude of mF606W = 17.8 mag and mH = 15.21 mag, respectively, whereas Guyon et al. (2006) inferred a slightly larger (re = 4.7 arcsec) and brighter (mH = 14.71 mag) host galaxy. Spitzer and IRAS satellite observations reveal that PG 1307+085 is far-infrared faint with |$L(60\, \mu \mathrm{m})/L(24\,\mu \mathrm{m})<1$| and weak emission from polycyclic aromatic hydrocarbons (Schweitzer et al. 2006; Netzer et al. 2007). This implies a significantly lower star formation rate compared to other QSOs of similar luminosity.
PG 1307+085 is found to reside in a group environment, based on a spectroscopic survey of galaxies around nearby QSOs (Prochaska et al. 2011). The survey found 10 galaxies brighter than mR < 19.5 mag with a redshift difference of Δz < 0.005 closer than <5 arcmin (<780 kpc) from the QSO. The brightest galaxy of that group with mR = 16.77 mag is just ∼21 arcsec (∼60 kpc) away from the QSO. With an absolute magnitude of MR = −22.56 mag, the galaxy is a massive 4L* galaxy.
The ionized gas around a large sample of QSOs including PG 1307+085 has initially been studied by Stockton & MacKenty (1987). They detected no ENLR around this QSOs in ground-based narrow-band images centred on the [O iii] λ5007 line. Narrow-band images with the HST revealed the first hints of an ENLR on scales of 1.4 arcsec (Bennert et al. 2002). Deeper observations with HST centred on the [O ii], H β, [O iii] and Pa α line basically agree in the apparent extension of ionized gas (Young et al. 2014). Based on the line ratio diagnostics, the authors argue that the gas is mainly ionized by ongoing star formation with an SFR of about ∼20 M⊙ yr−1. However, HST narrow-band images are often too shallow to capture the low surface brightness part of the large-scale ENLRs (e.g. Husemann et al. 2013). Optical long-slit spectroscopy with EMMI at the New Technology Telescope (NTT) and FORS1 at the Very Large Telescope (VLT) reveal indeed a spatially extended [O iii] λ5007 line out to 4 arcsec from the nucleus (Leipski & Bennert 2006; Oh et al. 2013). The slits for both observation were taken at the same position angle and consistently show a spatially asymmetric distribution of a narrow line component with a dispersion of ∼70 km s−1. A distinct broader emission-line component has also been reported by both studies, but it remained unclear whether this originates from the QSO due to the wings of the point spread function (PSF) or true jet–cloud interaction with a candidate low-luminosity radio jet (Leipski et al. 2006).
2 OBSERVATIONS AND DATA REDUCTION
The QSO PG 1307+085 was observed with the Multi-Unit Spectroscopic Explorer (MUSE; Bacon et al. 2010, 2014) at the VLT on 2014 May 6 as part of the instrument commissioning. MUSE is a novel optical integral-field spectrograph mounted to the Nasmyth focus of the UT4 telescope Yepun. In the wide-field mode, MUSE captures a contiguous 1 arcmin × 1 arcmin field-of-view (FoV) with a sampling of 0.2 arcsec. The covered nominal wavelength range is fixed from 4750 to 9350 Å at a spectral resolution of about ∼2.5 Å. The corresponding data set became public in August 2014. The total integration time of 3600 s on source was split into six 600 s long exposure. A small dither and a 90° field rotation was applied between individual exposures to aid removal of cosmics and artefacts as well as to suppress flat-fielding residuals during the final combination of the frames. Observations were performed under good ambient conditions with <30 per cent of moon illumination, clear sky and a seeing ranging between 0.8 and 1.1 arcsec.
Data reduction is carried out using the MUSE pipeline (version 0.18.2) which performs basic reduction steps including bias subtraction, flat fielding, wavelength calibration and geometric calibration of the MUSE field (Weilbacher et al. 2012; Weilbacher et al., in preparation). A master calibration generated during the commissioning run is applied for the geometric solution of the instrument field. All six exposure are combined to create the final data cube with the pipeline using the drizzle resampling method. During this step, the data is also flux calibrated and the sky is subtracted based on the empty regions within the large 1 arcmin FoV of MUSE.
We notice that the sky subtraction of the given pipeline version is not optimal and leaves strong sky line residuals in the data. The residuals appear of systematic nature so that we apply an additional correction. We create an average residual sky spectrum from a 5 × 5 arcsec2 region close to the QSO, but without any signal from the QSO or ENLR itself. Then we subtract the residual sky spectrum from the data which significantly improves the sky subtraction over large parts of the MUSE FoV. In addition, we estimate and correct for telluric absorption bands based on the spectrum of a relatively bright star in the field. The telluric absorption correction is particular important for PG 1307+085 because the broad H α line and the important [N ii] λ6583 line are redshifted into one of the strongest absorption bands. Finally, we correct the spectra for Galactic dust attenuation adopting the Milky-way dust attenuation law by O'Donnell (1994) adopting an extinction of AV = 0.095 mag along the line of sight (Schlafly & Finkbeiner 2011) and assuming RV = 3.1.
Given that the seeing during the observation was only >0.8 arcsec, we binned the final reduced cube by 2 × 2 pixels leading to a sampling of 0.4 arcsec. The binning increases the S/N per spatial pixel while the data remain Nyquist sampled with respect to the intrinsic spatial resolution. Our binned MUSE data cube is publicly available.1
3 ANALYSIS
3.1 Reconstructed narrow-band and broad-band images
We extract a 20 Å wide narrow-band image centred on the redshifted [O iii] λ5007 line and two broad-band images covering the 4750–5250 Å and 8000–8500 Å pass bands, respectively. The corresponding pseudo-RGB image of the field is shown in Fig. 1 (right-hand panel) compared to an archival HST image taken with Wide Field Planetary Camera 2 (WFPC2) camera in the F606W filter (left-hand panel). While the QSO host galaxy has been classified as a round elliptical without any signs of distortion, the MUSE data reveal an extended and complex distribution of ionized gas around the QSO. We identify three prominent structures across the ENLR: (1) a bright knot south-east of the nucleus, (2) a bright knot plus shell-like structure south of the nucleus, and (3) a faint knot about 10 arcsec (26 kpc) south from the nucleus. In addition to PG 1307+085, a few galaxies of the group are also covered by the MUSE FoV. The bright elliptical galaxy is only partially covered at the east edge of the FoV, but we are able to detect a very low surface brightness bridge of ionized gas between this galaxy and the QSO host galaxy.
![Single-band F606W image taken with WFPC2 aboard the HST (left-hand panel) and reconstructed false-colour image of the MUSE field (right-hand panel) targeting the QSO PG 1307+085. Several galaxies are part of rich galaxy group extending beyond the HST image that were spectroscopically identified by Prochaska et al. (2011) are labelled on the HST image. The centre of the group is most likely the luminous (∼4L*) elliptical galaxy to the south-east of PG 1307+085. For the MUSE false-colour image, we choose two broad continuum bands and a narrow band centred on the redshifted [O iii] λ5007 emission line to highlight the ionized gas distribution around the QSO. Besides the bright [O iii] emission of the nucleus, we discovered an extended emission-line region with a size up to ∼10 arcsec from the nucleus. The three main structures of the extended emission-line regions are two bright knots to the east and south, respectively, and a low surface brightness tail extending further south of knot 2, which are labelled in the figure accordingly.](https://oup.silverchair-cdn.com/oup/backfile/Content_public/Journal/mnras/455/2/10.1093_mnras_stv2478/2/m_stv2478fig1.jpeg?Expires=1750411678&Signature=nB~irt8fcIIk9GJ97fX8uNPVLGNpbyyQeec6s8iGGH0bCGw~Ld3thy5Cu-L6KQkTDP5k~iTs2PdS03nDp4Oc7rVu5YHw8Gdq-Cmj8vlqUgpNZr1TN9IjudBXXcCa8mlDQak80r8BeaOZ-g26T8J2skN2Wps~B0LU3tmTD7p7XDzPEeZfICG3zMMc9awrDhGMck-KV16yrf-VPYAdmmkKb2jPdSh5lCfGiKrU3W0sCC0KIS4E6HOK~~JRgrBa~BowCsJCeEj7ogze3H2hxw5hAOvdY4XSX4H99kWvzytKo~bcr-W1JPeKV~fqOdwzEJzFvlYaVQ2nXX4pUECLU4yMiQ__&Key-Pair-Id=APKAIE5G5CRDK6RD3PGA)
Single-band F606W image taken with WFPC2 aboard the HST (left-hand panel) and reconstructed false-colour image of the MUSE field (right-hand panel) targeting the QSO PG 1307+085. Several galaxies are part of rich galaxy group extending beyond the HST image that were spectroscopically identified by Prochaska et al. (2011) are labelled on the HST image. The centre of the group is most likely the luminous (∼4L*) elliptical galaxy to the south-east of PG 1307+085. For the MUSE false-colour image, we choose two broad continuum bands and a narrow band centred on the redshifted [O iii] λ5007 emission line to highlight the ionized gas distribution around the QSO. Besides the bright [O iii] emission of the nucleus, we discovered an extended emission-line region with a size up to ∼10 arcsec from the nucleus. The three main structures of the extended emission-line regions are two bright knots to the east and south, respectively, and a low surface brightness tail extending further south of knot 2, which are labelled in the figure accordingly.
3.2 QSO-host deblending
Even at good seeing conditions, the bright QSO significantly contaminates a large area due to the wings of the PSF and the high contrast ratio between unresolved and extended emission. Here, we take advantage of the broad Balmer lines of the QSO to measure the PSF (e.g. Jahnke et al. 2004a). Our iterative algorithm to deblend the point-like emission of the QSO and the extended host galaxy emission is described in detail in Husemann et al. (2013, 2014), we here just briefly outline the process.
First, we measure a PSF from broad emission lines by mapping the intensity in the line wings above the adjacent continuum flux. Since the PSF is smoothly changing as a function of wavelength, we determine the PSF from the broad H γ, H β, He i, and H α lines. Then, we reconstruct a PSF cube by normalizing all PSFs to one at the brightest pixel and interpolate the intensity maps with a two-order polynomial function along wavelength. An almost pure QSO cube is produced by multiplying the normalized PSF cube with QSO spectrum from the brightest spaxel.2 However, there is some host galaxy contamination even in the QSO spectrum that we need to subtract to avoid significant oversubtraction. Since the radial surface brightness distribution of the host galaxy is necessarily more extended than the PSF, we co-add the residual spectra around the brightest spaxel after the QSO subtraction to obtain a best guess on the host galaxy spectrum. We re-scale this host galaxy spectrum in total flux so that it matches the expected host galaxy surface brightness at that brightest spaxel. In an iterative scheme, we subsequently subtract the re-scaled host spectrum from the original QSO spectrum in each iteration to clean it from the host contamination. The process converges after a few iterations and we stop after 10 in this particular case. To estimate the radial surface brightness profile of the host galaxy, we extracted rest-frame g- and r-band images from the initial data as well as the corresponding PSFs from the PSF cube. Then, we used galfit (Peng et al. 2002, 2010) to model the 2D surface brightness as a superposition of a point source and a Sersić profile. We fixed the Sersić index to n = 4 because the host galaxy is known to be an elliptical galaxy from higher resolution HST observations (Bahcall et al. 1994; Veilleux et al. 2009). In Fig. 2, we show the model and residual of a PSF model only and a PSF+Sersić model for the g-band (left-hand panel) and r-band (right-hand panel) images, respectively. Our best-fitting parameters for both bands are given in Table 1.
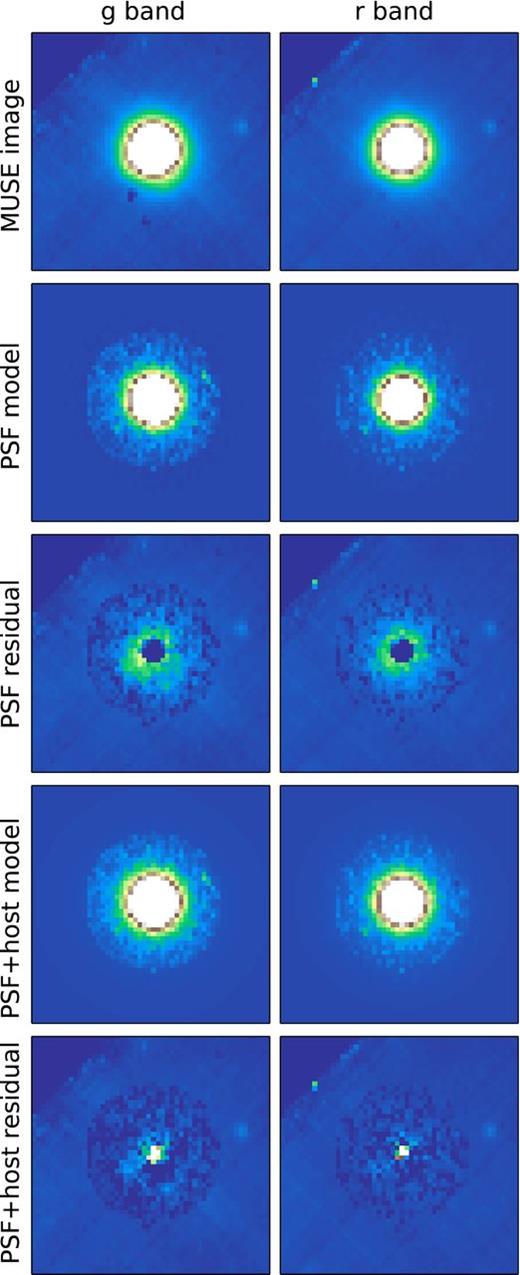
Rest-frame g and r broad-band images and corresponding PSF and PSF+host galaxy models with residuals. All images are displayed with a common linear scaling. Despite the flat-fielding residuals, the light is significantly more extended compared to a pure point source. Parameters from the best-fitting PSF+host model are given in Table 1.
Best-fitting 2D image decomposition parameters.
| Parameter | g band | r band |
|---|---|---|
| QSO | 15.5 mag | 15.2 mag |
| host | 17.9 mag | 17.4 mag |
| n | 4 (fixed) | 4 (fixed) |
| re | 1.3 arcsec (3.5 kpc) | 1.2 arcsec (3.2 kpc) |
| b/a | 0.98 | 0.97 |
| PA | 67° | 64° |
| Parameter | g band | r band |
|---|---|---|
| QSO | 15.5 mag | 15.2 mag |
| host | 17.9 mag | 17.4 mag |
| n | 4 (fixed) | 4 (fixed) |
| re | 1.3 arcsec (3.5 kpc) | 1.2 arcsec (3.2 kpc) |
| b/a | 0.98 | 0.97 |
| PA | 67° | 64° |
MUSE is not designed to be a broad-band imager and the systematic uncertainty of the flat-fielding across the field is strongly limited by the preliminary calibration plan during the commissioning run. Thus, it is not possible to obtain very precise measurements on the host galaxy morphological parameter. However, the residuals of the PSF-only model are significant and highlight that the underlying host galaxy of PG 1307+085 is well resolved, even in the seeing-limited MUSE data. The model for the g and r bands leads to an effective radius of ∼1.3 arcsec which is in perfect agreement with the measurements with HST reported by Bahcall et al. (1997) and Veilleux et al. (2009).
After combining the information on the host galaxy 2D profile with the wavelength-dependent PSF measurements, we successfully decompose the spatially unresolved QSO emission from the spatially resolved emission. We show the original and decomposed spectra within a radius of 16 pixels (3.2 arcsec) around the QSO in Fig. 3. The QSO clearly dominates the continuum emission by a factor of ∼10 at 5250 Å (rest frame) close to the wavelength of the Mg ib λ5175 Å stellar absorption line. We recover prominent narrow emission lines even in this circumnuclear region which we already know extends much further as seen in the narrow-band image (Fig. 1) even before applying the QSO-host debelending.
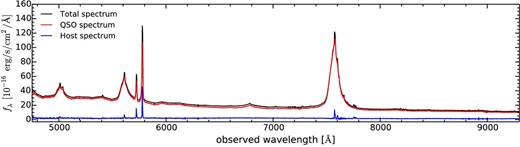
The total, pure QSO and the host galaxy spectrum containing spatially resolved emission within an aperture of 3.2 arcsec radius. The QSO exceeds the host galaxy light by a factor ∼10 at 5250 Å (rest frame). No significant broad emission-line residuals appear in the host galaxy spectra, but strong narrow-emission lines are clearly present from the surrounding kpc-scale ENLR as seen in the narrow-band image shown in Fig. 1.
3.3 Stellar continuum and velocity dispersion
In Fig. 4, we show the host galaxy spectrum extracted from an aperture of 2 arcsec in radius to capture all the light within the effective radius given a 1 arcsec seeing. We slightly degrade the spectral resolution from 2.5 Å full width at half-maximum (FWHM), estimated from the width of the sky lines, to 3.0 Å FWHM. This allows us to model the spectrum with stellar population synthesis spectra from the Medium-resolution Isaac Newton telescope Library of Empirical Spectra (MILES; Sánchez-Blázquez et al. 2006). The intrinsic rest-frame spectral resolution of the spectra is 2.51 Å (Falcón-Barroso et al. 2011) corresponding to 2.89 Å at the redshift of the QSO. The slight spectral smoothing also increased the S/N of the spectrum from S/N ∼ 8 to S/N ∼ 10 per pixel. Strong stellar absorption features are visible in the spectrum in particular the prominent G band at 4300 Å, Mg ib triplet at 5175 Å, various adjacent Fe lines as well as the NaD line at 5892 Å. The continuum shows a small low-frequency spectral shape deviation due to systematic uncertainties in the QSO host deblending. Those systematics are caused by (1) uncertainties to correct the positional shifts due to differential atmospheric refraction, and (2) the uncertainties in the broad-line PSF measurements and subsequent interpolation with wavelength.
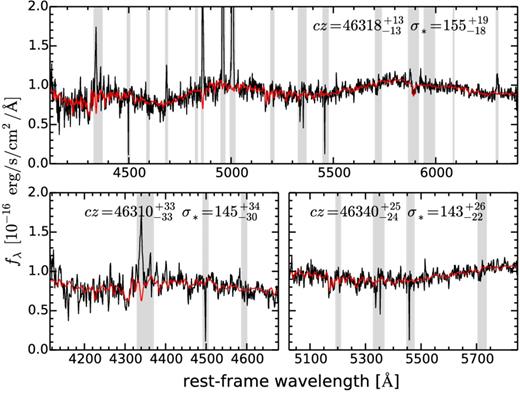
Host galaxy continuum spectrum within an aperture of 2 arcsec in radius. The spectrum is slightly smoothed from a spectral resolution of 2.5 to 3.0 Å with a Gaussian kernel. We model the spectrum as a superposition of single-stellar population spectra (Vazdekis et al. 2010) generated from the MILES stellar library (Sánchez-Blázquez et al. 2006), adopting a Gaussian kernel for the LOSVD which is shown as the red line. The modelling was performed independently on the entire spectrum up to the wavelength of H α (upper panel), covering a wavelength region centred around the G-band stellar absorption feature (lower-left panel) and the Mg ib+Fe stellar absorption features (lower-right panel). All measurements agree within the error bars, but the full spectral fitting is considered more robust as template mismatches are minimized.
Here, we use our own software pyparadise (Husemann, Choudhury & Walcher, in preparation) which is an extended python version of paradise (Walcher et al. 2015) to perform stellar population spectral synthesis to fit the stellar continuum. The algorithm is insensitive to the global continuum shape as it first divides the spectrum and all template spectra by a running mean after linearly interpolating masked wavelength regions. A detailed description of the algorithm is presented in Walcher et al. (2015) which we summarize below. The main improvements for pyparadise are that (1) a Markov-Chain-Monte Carlo (MCMC) algorithm is used to find the parameters and associated errors for the line-of-sight velocity distribution (LOSVD), and (2) that only the high S/N template library spectra are resampled during the fitting while the input spectrum remains unchanged to preserve its noise properties.
In the initial iteration, a single stellar population spectrum is drawn from the library and the best-fitting LOSVD, in terms of redshift z and velocity dispersion σ*, is estimated by means of a MCMC algorithm (pymc; Patil, Huard & Fonnesbeck 2010) in which the spectrum is smoothed with a corresponding Gaussian kernels. Here, we parametrize the LOSVD only by a simple Gaussian and avoid to model higher moments given the relatively low S/N of the stellar continuum. In order to match the spectral resolution of the data and the template spectra, we smooth the template spectra, after redshifting to the initial redshift guess zguess, to match the spectral resolution of the data. For the priors, we assume a flat probability distribution within ‖c(z − zguess)‖ < 500 km s−1 and 50 < σ* < 400 km s−1. From the posterior distribution, we select the most likely LOSVD and apply it to all normalized spectra of the template library and use a non-negative linear least square algorithm to determine the best-fitting linear coefficients. In all following iterations, this two-step process is repeated but the initial spectrum is replaced by a linear combination of the template library based on best-fitting linear coefficients of the previous iteration without applying the LOSVD. The LOSVD parameters and linear coefficient of the templates converge quickly and here we stop after five iterations.
The best-fitting spectra are shown in Fig. 4 based on the library of single stellar population models presented by Vazdekis et al. (2010) from the MILES stellar library for a universal Kroupa initial mass function. We perform an independent modelling of three different wavelength regions; (i) the entire spectrum up to H α (upper panel), (ii) the wavelength region centred on the G band (lower-left panel) and (iii) the wavelength region centred on Mg ib+Fe absorption lines (lower-right panel). The best-fitting parameters for the z and σ* agree within the 1σ error bars inferred from the almost symmetric posterior distribution as the 16 and 83 per cent percentiles. We consider the model of the full wavelength range to be more robust as the simultaneous fitting of significantly more feature reduces the systematic errors caused by template mismatch. Our best-fitting parameters for the LOSVD are |$cz=46\,318_{-13}^{+13}$| km s−1 (z = 0.1544 ± 0.0001) and |$\sigma _*=155_{-18}^{+19}$| km s−1. Thus, we obtain a very reliable measurement of the systemic redshift which is important to interpret the ionized gas kinematics.
3.4 QSO spectrum and BH mass estimate
The QSO spectrum is shown in Fig. 5 after subtracting the host galaxy contribution. We model the spectrum as a superposition of a continuum and emission lines components following the scheme of Shen et al. (2008b). We assume a power-law function as the primary continuum with two different slopes in the blue and red part of the rest-frame optical spectrum (e.g. Vanden Berk et al. 2001). Due to the various broad lines and Fe ii bands, we can only infer the continuum flux at three rest-frame wavelengths: 4200, 5650, and 7400 Å. Based on the best-fitting power law, we infer a continuum flux density at 5100 Å (rest frame) of f5100 = 21.5 × 10⁻¹⁶ erg s−1 cm−2 Å−1 which corresponds to a continuum luminosity of L5100 = 8 × 1044 erg s−1. An additional pseudo-continuum is produced by the Fe ii bands that we model with the broadened Fe ii template spectrum of I Zw 1 provided by Boroson & Green (1992). The width of the smoothing kernel is empirically constrained to minimize the residuals for the prominent Fe ii band at 5100–5450 Å.
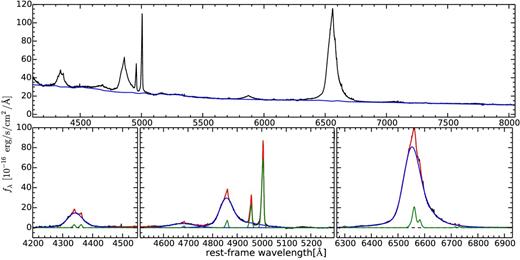
Upper panel: integrated QSO spectrum for PG1307+085 after the debelending process. The reconstructed pseudo-continuum is shown as blue line which is a superposition of a power law, with two different slopes blueward and redward of 5650 Å (rest frame), and the smoothed Fe ii template from Boroson & Green (1992). Lower panels: emission-line spectra after continuum subtraction centred on the broad H γ (left-hand panel), Hβ (middle panel) and the Hα line (right-hand panel). The best-fitting model is shown as red solid line which are composed of several Gaussians for the broad-line components (blue line) and the spectrum of all narrow lines (green line). See the text for details about the emission-line model, parameters and constraints.
We model all the emission lines above the continuum with multiple Gaussian components (see Fig. 5). Two broad Gaussian components are necessary to model the broad H γ and H β and H α line shape, respectively, whereas one broad component is sufficient for the broad He ii λ4685 Å line. Prominent narrow lines are also seen in H γ, [O iii] λ4363 Å, He ii λ4685 Å, H β, [O iii] λλ4960, 5007, [O i] λ6300 Å, H α, [N ii] λλ6548, 6583Å, and [S ii] λλ6717, 6730 Å. All of the narrow lines except [O i] and [S ii] appear asymmetric with a blue wing, so that we model those narrow lines with two Gaussian components. Such a broad asymmetric wing is a common feature in the spectra of luminous QSOs (e.g. Mullaney et al. 2013) and considered to be a genuine signature of AGN-driven outflows at least in the circumnuclear region. The best-fitting parameters for these two narrow-line components are listed in Table 2. In contrast to the broad lines, we force the redshift and intrinsic velocity dispersion of the two narrow-line kinematic components to be the same. This greatly reduces the number of free parameters and leads to a more robust fit.
Emission-line fluxes and physical conditions for the narrow-emission lines in the QSO and extended region spectra.
| QSO | ||||||||
|---|---|---|---|---|---|---|---|---|
| 1st component | 2nd component | Host | knot 1 | knot 2 | knot 3 | bridge 1 | bridge 2 | |
| Δvhost [km s−1] | 120 ± 12 | 59 ± 12 | 67 ± 13 | −84 ± 12 | −17 ± 12 | −101 ± 13 | −38 ± 27 | −246 ± 28 |
| σ [km s−1] | 110 ± 7 | 285 ± 7 | 122 ± 7 | 31 ± 15 | 74 ± 7 | 46 ± 9 | 106 ± 26 | 100 ± 19 |
| H γ a | 13.72 ± 0.00 | 17.83 ± 0.73 | <2.53 | 3.39 ± 0.13 | 2.96 ± 0.08 | <0.23 | <0.25 | <0.49 |
| |$[\mathrm{O\,{\small {III}}}]\,\lambda 4364$| a | 14.78 ± 0.74 | 17.60 ± 1.73 | <2.15 | 1.25 ± 0.12 | 1.02 ± 0.08 | <0.28 | <0.27 | <0.58 |
| He ii λ4685 a | 6.31 ± 0.21 | 13.15 ± 0.48 | <1.93 | 2.10 ± 0.11 | 2.84 ± 0.07 | <0.19 | <0.22 | <0.45 |
| H β a | 32.39 ± 1.12 | 41.42 ± 2.30 | 9.20 ± 0.72 | 8.02 ± 0.10 | 6.72 ± 0.07 | 0.50 ± 0.07 | <0.21 | <0.47 |
| |$[\mathrm{O\,{\small {III}}}]\,\lambda 5007$| a | 334.08 ± 8.12 | 414.68 ± 9.92 | 55.38 ± 0.90 | 85.02 ± 0.24 | 63.92 ± 0.08 | 3.45 ± 0.10 | 1.21 ± 0.10 | 1.04 ± 0.16 |
| O i λ6300 a | 7.94 ± 0.25 | – | <2.59 | 0.89 ± 0.08 | 0.69 ± 0.06 | <0.15 | <0.21 | <0.31 |
| H α a | 28.94 ± 0.72 | 333.72 ± 1.07 | 31.12 ± 0.64 | 24.28 ± 0.12 | 20.82 ± 0.08 | 1.47 ± 0.08 | 0.56 ± 0.10 | 0.97 ± 0.18 |
| |$[\mathrm{N\,{\small {II}}}]\,\lambda 6583$| a | 23.04 ± 0.81 | 98.71 ± 1.57 | 10.20 ± 1.14 | 5.54 ± 0.16 | 4.13 ± 0.13 | 0.64 ± 0.08 | 0.17 ± 0.16 | 0.60 ± 0.12 |
| |$[\mathrm{S\,{\small {II}}}]\,\lambda 6717$| a | 10.03 ± 0.35 | – | <2.22 | 3.39 ± 0.28 | 2.92 ± 0.08 | <0.47 | <0.35 | <0.37 |
| |$[\mathrm{S\,{\small {II}}}]\,\lambda 6730$| a | 10.17 ± 0.07 | – | <2.45 | 2.55 ± 0.07 | 2.15 ± 0.06 | <0.14 | <0.20 | <0.41 |
| Ar iii λ7135 a | 8.21 ± 0.31 | – | <1.68 | 1.04 ± 0.06 | 0.85 ± 0.05 | <0.14 | <0.17 | <0.30 |
| |$\langle \Sigma _{\mathrm{[O\,{\small {III}}]}\lambda 5007}\rangle$| b | – | – | 12.8 | 9.0 | 3.8 | 0.2 | 0.1 | 0.2 |
| E(B − V) | – | – | 0.17 ± 0.04 | 0.06 ± 0.01 | 0.08 ± 0.01 | 0.04 ± 0.12 | – | – |
| ne [cm−2] | 748 ± 98 | – | – | 85 ± 133 | 60 ± 20 | – | – | – |
| Te [K] | 26118 ± 1467 | – | – | 13437 ± 578 | 13959 ± 259 | – | – | – |
| log (Mion/[M⊙]) | 7.1 | 7.0 | 6.8 | 6.9 | 5.7 | 5.3 | 5.5 | |
Notes.aEmission-line fluxes are given in units of 10−16 erg s−1 cm−2.
bEmission-line surface brightness is given in units of 10−19 erg s−1 cm−2 arcsec−2.
The broader component of the narrow lines has a velocity dispersion of about ∼300 km s−1 compared to ∼100 km s−1 for the other components. The broader component is blue-shifted by about 60 km s−1. The velocity dispersion of the bluer component and its blue-shift with respect to the narrower component are smaller than the average value of luminous AGN as inferred by Mullaney et al. (2013). We discuss the physical conditions of this ionized gas together with the extended emission in the next section. One difficulty in their interpretation is that the fluxes of the narrow H β and H α line are unreliable due to the systematic error in the model of the complex broad Balmer line shapes that are compensated by a skewed flux ratio of the two narrow line components.
We measure a broad H β line width of FWHMH β = 4250 ± 30 km s−1and σH β = 2347 ± 21 km s−1. Those errors correspond only to the random uncertainties given the S/N of the spectrum, but not the systematic uncertainties due to line blending. The FWHM is in good agreement with the measurements of Kaspi et al. (2000) and Shen et al. (2011), but 1000 km s−1 narrower than reported by Marziani et al. (2003) and Peterson et al. (2004). Oh et al. (2013) reported a line dispersion of σH β = 1885 ± 10 km s−1 which is 460 km s−1 narrower than our measurements. It is unclear whether this is attributed to time variability in the line shape or systematic uncertainties of the H β deblending into a narrow and broad component since Kaspi et al. (2000) and Peterson et al. (2004) obtain very different results based on the same spectra.
A reverberation time-lag of |$\tau =105_{-36}^{+46}$| light days for PG 1307+085 was initially reported by Peterson et al. (2004) for the broad H β line, but significantly revised to |$\tau =188_{-3.7}^{+5.3}$| light days by Zu, Kochanek & Peterson (2011). The corresponding virial product |$VP=c\tau \sigma _\mathrm{line}^2/G=120_{-14}^{+21}\times 10^{6}\,\mathrm{M}_{{\odot }}$| for the broad H β line dispersion as measured by Peterson et al. (2004) combined with a virial factor of |$f=4.47_{-1.2}^{+1.4}$| (Woo et al. 2015) leads to a reverberation-based BH mass of |$M_\mathrm{BH}=5.3_{-1.9}^{+2.0}\times 10^{8}\,\mathrm{M}_{{\odot }}$|. Since we infer a broader H β line dispersion from the analysis of the MUSE spectrum, we also compute a single-epoch virial BH mass replacing the reverberation-mapped BLR size with the size–luminosity relation of Bentz et al. (2013). This yields a BH mass of MBH = 4.9 × 10⁸ M⊙ which is well within the uncertainties of the reverberation-based BH mass. We therefore refer to the reverberation-mapped BH mass throughout the paper.
Assuming a mean bolometric correction factor of 10 for the continuum luminosity at 5100 Å following Richards et al. (2006), we obtain a bolometric luminosity of log (Lbol/[erg s−1]) = 45.9. This corresponds to an Eddington ratio of λ = Lbol/LEdd = 0.3 for PG 1307+085.
3.5 Physical conditions across the ENLR
In Fig. 6, we present the co-added QSO-subtracted spectra for the host galaxy, the three knots across the ENLR, and the bridge split up into two regions. Several narrow emission lines are visible in the spectra. Besides the strong lines [O iii] λλ4960,5007, H β, [N ii] λλ6548,6583, and H α, we detect fainter lines such as the [O iii] λ4363, H γ, He ii λ4635, [S ii] λλ6713, 6730, and [Ar iii] λ7135 only in the two brightest knots. We model the lines above a local continuum level with Gaussians profiles that are all coupled in their radial velocity and intrinsic velocity dispersion. The obtained line fluxes and kinematic parameters are listed in Table 2; 3σ upper limits are given for the undetected lines based on the noise in the continuum.
![Co-added spectra and best-fitting emission-line models for several prominent emission-line regions indicated in the narrow-band [O iii] image on the top. Two spectral windows covering the H β and [O iii] λλ4960, 5007 (left-hand panels) and the H α, [N ii] λλ6548, 6583, and [S ii] λλ6717, 6730 (right-hand panels) are shown. The two ‘bridge’ spectra suffer more strongly from the sky line residuals given the low surface brightness of the emission lines.](https://oup.silverchair-cdn.com/oup/backfile/Content_public/Journal/mnras/455/2/10.1093_mnras_stv2478/2/m_stv2478fig6.jpeg?Expires=1750411678&Signature=prJSf53SMGle~mH2cmB6dJMuGZcTsCQndNKiRNHAtbWutYJ3YoboebHZNY4nGDZrhLr6NBWb-o3pF~S9vwhxdtzzFEZjXURl-KFFFlNfGZcHo7ePjltxpmDZDJ4dglchuH806lvTnVyRVs8zyk2MG~HZOEk5lK5D8DrziZwnLFD-hwk3vAjile0IXtMregELkayM5cJfPvBXNx731R3mkiyOYpvfdJ7hLrEdwWHaeM8Q1B5wlrOLbD3dHUdPbGNud0l4iQiwEdlFSPa9iC26Sr4ehnkkXmGuo-37uvBTO466eLbaPVw5fQrjVWHtuSjuZamQLXqslZ-A3UtuWA24Lg__&Key-Pair-Id=APKAIE5G5CRDK6RD3PGA)
Co-added spectra and best-fitting emission-line models for several prominent emission-line regions indicated in the narrow-band [O iii] image on the top. Two spectral windows covering the H β and [O iii] λλ4960, 5007 (left-hand panels) and the H α, [N ii] λλ6548, 6583, and [S ii] λλ6717, 6730 (right-hand panels) are shown. The two ‘bridge’ spectra suffer more strongly from the sky line residuals given the low surface brightness of the emission lines.
From the H α/H β line ratio, we infer the line-of-sight extinction E(B − V) adopting a theoretical Balmer decrement of H α/H β = 2.85 for case B recombination and a Milky Way like extinction curve (Cardelli, Clayton & Mathis 1989). Subsequently, we correct the observed line fluxes for extinction and use the [S ii] λ6730/[S ii] λ6716 line ratio to measure the electron density (ne) and the ([O iii] λ5007+[O iii] λ4960)/[O iii] λ4636 ratio to estimate the electron temperature (Te) following the prescription of Osterbrock & Ferland (2006) as implemented in the pyneb package (Luridiana, Morisset & Shaw 2015). We obtain values of ne ∼ 100 cm−2 and Te ∼ 14 000 K for the two brightest knots of the ENLR as well as ne ∼ 1000 cm−2 and Te ∼ 25 000 K for the unresolved emission of the QSO. Our measurements for knot 1 are consistent with the results from the long-slit spectrum aligned along that region as reported by Oh et al. (2013), but with significantly smaller error bars. The measured temperatures and densities are typical conditions for the nucleus (e.g. Vaona et al. 2012) and for the ENLR on kpc scales (e.g. Bennert et al. 2006a,b), respectively.
The two brightest knots of the ENLR show a large number of lines that we can detect with high confidence. In Fig. 7, we show 12 different line ratio plots including the well-known [O iii] λ5007/H β versus [N ii] λ6583/H α BPT diagram (Baldwin, Phillips & Terlevich 1981; Veilleux & Osterbrock 1987). Except for the line ratios in the bridge, all regions clearly indicate photoionization by the AGN (e.g. Kewley et al. 2006; Stasińska et al. 2006). However, the [N ii] λ6583/H α, [S ii] λ6713, 30/H α, [O i] λ6300/H α and [Ar iii] λ7135/H α ratios in those regions are much smaller than the typical line ratio of obscured AGN. This is also the case for the line ratios in the spatially unresolved NLR of the QSO. Only a very small fraction of obscured AGN in SDSS occupy this line ratio space as reported by Groves, Heckman & Kauffmann (2006). They suggest that this is caused by a lower metallicity of the ionized gas compared to the majority of AGN. On the other hand, Stern & Laor (2013) studied the line ratio for a sample of unobscured AGN, such as PG 1307+085, and found a significant trend with AGN luminosity for most of the line ratios, arguing for selection effects rather than a metallicity difference. Here, we note that in particular the low log ([O i]/H α) ∼ −1.5 line ratio is also at the very extreme end of the high-luminosity unobscured AGN population studied by Stern & Laor (2013).
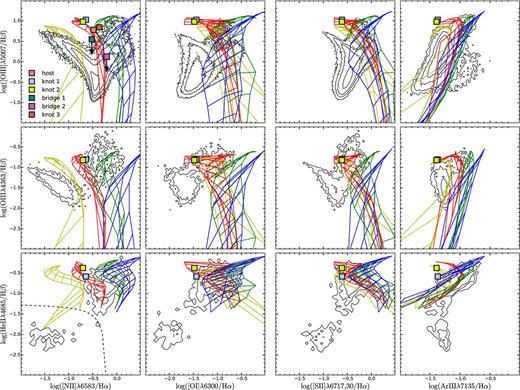
Various emission-line diagnostic diagrams for the extended emission-line region. The contours correspond to emission-line galaxies from the SDSS DR7 catalogue (Brinchmann et al. 2004), including 2000 galaxies with He ii line measurements (Shirazi & Brinchmann 2012) as a reference for typical line ratios among galaxies. We only consider galaxies with an S/N>5 in each line for a given diagnostic plot. We compare the corresponding line ratios for the ENLR around PG 1307+085 (squared symbols) with a grid of dusty radiation pressure-dominated photoionization models (Groves, Dopita & Sutherland 2004). We show models with four different metallicties 0.5 Z⊙ (yellow lines), 1 Z⊙ (red lines), 2 Z⊙ (green lines), 4 Z⊙ (blue lines) and three power-law slopes for the ionizing continuum α = −1.2, −1.4, −1.7 covering a large range in ionization parameters 0 < log (U) < −4.
To roughly quantify the ionization properties of the gas, we compare all line ratios for knots 1 and 2 with dusty radiation pressure-dominated photoionization model (Groves et al. 2004) in Fig. 7 for four metallicites (0.5 Z⊙, 1 Z⊙, 2 Z⊙ and 4 Z⊙), three power-law slopes of the ionizing AGN continuum (α = 1.2, 1.4, 1.7), and a single gas density of n = 100 cm−3 as implied by the [S ii] doublet ratio. Except for the [Ar iii] λ7135/H α ratio, the model with Z = 1Z⊙, α = −1.2 and log U = −1.3 is closest to all line ratios within <0.2 dex. It is interesting that the [Ar iii] λ7135/H α line ratio is even lower than predicted by this ‘best-fitting’ model. Since Argon and helium are not depleted on to dust, Argon is a good metallicity indicator independent of the assumed dust composition but depends on ionization parameter. In our case, He ii λ4685 implies a high-ionization parameter independent of metallicity while the low [Ar iii] λ7135/H γ line ratio indicates significantly lower metallicites than in the majority of AGN.
We can definitely rule out shock or shock+precursor ionization because the high [O iii]/H β line ratio would require high excitation by fast shocks with vs > 500 km s−1 (Allen et al. 2008). This is inconsistent with the observed quiescent kinematics of the gas (see next section) across the ENLR.
3.6 Ionized gas kinematics
In addition to the line measurements from the co-added spectra for the specific regions, we reconstruct the kinematics of the ENLR from the bright [O iii] λλ4960, 5007 Å lines across the field. We model the doublet line independently for each spaxel as a single pair of Gaussians that are coupled in redshift and velocity dispersion with a fixed flux ratio of [O iii] λ5007/[O iii] λ4960 = 3 in the QSO-subtracted data cube. The best-fitting [O iii] λ5007 surface brightness, radial velocity (systemic velocity subtracted) and velocity dispersion maps are shown in Fig. 8. Although the [O iii] λ5007 in the QSO spectrum exhibits a strong blue-shifted component with a line width of ∼650 km s−1 (FWHM), we detect mainly narrow lines with <120 km s−1(FWHM) across the entire region.
![Results from the spaxel-by-spaxel fitting of the [O iii] λλ4960, 5007 emission lines after subtracting the bright QSO emission. Left-hand panel: [O iii] λ5007 surface brightness map with a logarithmic colour scaling. The 5 GHz VLA radio map with a beam size of 0.4 arcsec is overplotted as blue contours. Apart from the compact radio source at the nucleus, some weak extended radio emission is detected ∼1 arcsec towards the south-west in the direction of knot 2. All the other radio peaks are consistent with noise. Middle panel: radial velocity maps of the ionized gas with respect to the systemic redshift of the host galaxy. Right-hand panel: intrinsic velocity dispersion map of the ionized gas corrected for instrumental resolution and redshift broadening. The peak position of the subtracted QSO is denoted by the red cross in all three panels.](https://oup.silverchair-cdn.com/oup/backfile/Content_public/Journal/mnras/455/2/10.1093_mnras_stv2478/2/m_stv2478fig8.jpeg?Expires=1750411678&Signature=GvPhyO~dZjLQKUsIRVcsfdcuGjjTEIeYrpUaXlW~Fk7gwwMRkwHP7HBsAdVdL1ItB3koFglL~suSSKTp18yv4GHGAtEw3oCylFD3Wzqd~lyUl4clM-YL-mubIbyU7X19UE~IuciPl6k9WwJaWlo~SSz6~dunjxzpHbyFbSSb41Tdv-PkyFQJz9LSNdrg~4rQ8tLZaKNKieDrZdZ~HlGTDSUBuhULT-psqzkRuz6GawJ1AQGpg1S17-nJANFMKIJzQd9~gC5BffJ9CjyuRHgmsNq1RxCAI-L~eLw5cskHNX8CGCMeLQ~c6LgByPtRKx9D-0wgEH58E9KTPn0bg32iqw__&Key-Pair-Id=APKAIE5G5CRDK6RD3PGA)
Results from the spaxel-by-spaxel fitting of the [O iii] λλ4960, 5007 emission lines after subtracting the bright QSO emission. Left-hand panel: [O iii] λ5007 surface brightness map with a logarithmic colour scaling. The 5 GHz VLA radio map with a beam size of 0.4 arcsec is overplotted as blue contours. Apart from the compact radio source at the nucleus, some weak extended radio emission is detected ∼1 arcsec towards the south-west in the direction of knot 2. All the other radio peaks are consistent with noise. Middle panel: radial velocity maps of the ionized gas with respect to the systemic redshift of the host galaxy. Right-hand panel: intrinsic velocity dispersion map of the ionized gas corrected for instrumental resolution and redshift broadening. The peak position of the subtracted QSO is denoted by the red cross in all three panels.
An increased line dispersion is apparently seen in the region between knot 1 and knot 2. The increase in velocity dispersion is not physical, but rather a combined artefact of beam smearing and fitting only a single Gaussian component. We noticed that the spectra in this region appear double peaked because the emission lines of knot 1 and knot 2 are offset by about 50 km s−1 in velocity space and both components contribute with an almost equal surface brightness to the overall line shape. The same superposition also happens in the host galaxy region which is contaminated by emission from knot 1 due to beam smearing. The spectral resolution of MUSE is not sufficient to reliably decompose those lines in their respective components. Whether the same mechanism also leads to the higher velocity dispersion ∼70 km s−1 in the region between the host galaxy and knot 2 is less clear. The higher than average dispersion may also be caused by weak shocks or dispersion-dominated motion in the gravitational potential of the host galaxy.
The line-of-sight radial velocity variation shows a low amplitude of <±200 km s−1 in general. Interestingly, we find a smooth velocity gradient from red-shifted to significantly blue-shifted with respect to the systemic velocity from the location of the host galaxy through knot 2 towards knot 3. This velocity gradient has the largest velocity amplitude of 200 km s−1. We consider this gradient physical and unrelated to instrumental effects as beam smearing would only smooth out the gradient. From the data alone, we cannot distinguish between gas approaching and escaping from the host galaxy.
The S/N in the bridge between PG 1307+085 and the massive galaxy at the group centre is too low for analysing individual spaxels. However, the radial velocity measured from the two binned regions along the bridge (see Table 2) reveals that the gas is more blue-shifted closer to the massive companion by ∼260 km s−1. This is consistent in sign and amplitude with the redshift difference between two galaxies. It confirms that the ionized gas bridge is not just a superposition, but physically connects the ionized gas between the two galaxies.
4 DISCUSSION
4.1 The BH mass–σ* relation
With the unique sensitivity, spatial resolution and image quality of MUSE, we are able to measure a robust σ* for the faint host galaxy underneath the luminous QSO PG 1307+085. Here, we compare our measurements with the MBH–σ* relation of local quiescent galaxies (McConnell & Ma 2013, 72 objects), where BH masses are derived directly from dynamical measurements, as well as reverberation-mapped AGN (Woo et al. 2015, 29 objects). We also show the best-fitting relation derived by Kormendy & Ho (2013, 51 objects; pseudo-bulges and mergers excluded) and by Graham et al. (2011, 64 objects; all morphologies). As can be seen from Fig. 9, PG 1307+085 is consistent with the local relation within its intrinsic scatter taking the errors of our measurements into account. However, it is slightly offset towards a higher BH mass with respect to the mean relation.
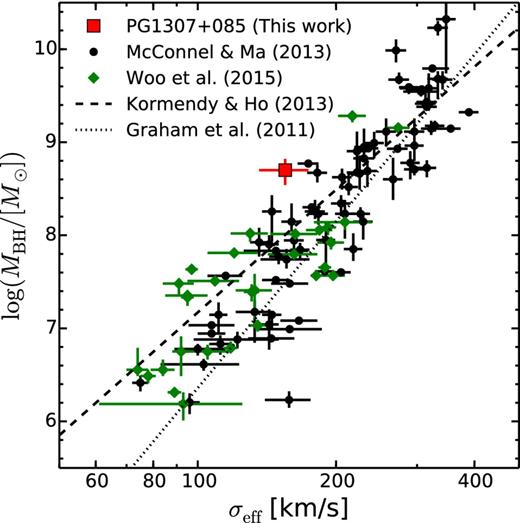
MBH–σ* relation for a sample of quiescent local galaxies (black points; McConnell & Ma 2013) and reverberation-mapped AGN (green symbols; Woo et al. 2015). For comparison, we also plot the relation of Kormendy & Ho (2013) as a dashed line and Graham et al. (2011) as a dotted line. The position of PG1307+085 is shown as a red squared point adopting the reverberation-mapped BH mass inferred by Peterson et al. (2004).
An offset of ΔMBH(@z = 0.15) = 0.24 dex is suggested by the reported redshift evolution of Woo et al. (2006). The nominal offset from the mean relation we measure for PG 1307+085 is about 0.3 dex and would be in line with the predicted offset. For a single object it is, however, still within the intrinsic scatter of the relation. Certainly, the offset from the relation of quiescent galaxies is smaller than in some extreme AGN host galaxies (Husemann et al. 2011; Trakhtenbrot et al. 2015) and can be accounted for by the uncertainties in the MBH and σ* estimation. Thus, we consider the offset insignificant for a single object given the various systematic uncertainties. In case that the offset is real, it is possible that either PG 1307+085 is moving further away from the relation given the substantial BH growth compared to the low star formation in the spheroid implied by the FIR colours, or that the spheroid growth will eventually catch up the BH growth to move it back towards the relations.
Given that we only consider a measurement for a single object, we refrain from discussing any further physical interpretation here. Instead, we highlight the efficiency and potential of measuring σ* of luminous QSOs with MUSE in the context of previous studies. PG 1307+085 is the third most massive BH and most luminous AGN among the reverberation-mapped AGN with σ* measurements discussed by Woo et al. (2015). Measurements of σ* for luminous QSOs are difficult because of the high AGN-to-host/spheroid contrast ratio. Different techniques have been used to tackle this problem. Since the contrast ratio is much weaker in the NIR, NIR observations, in particular with AO, can much better resolve the stellar continuum against AGN contribution. Stellar velocity dispersions have been obtained for about a dozen QSOs at z < 0.1 (Dasyra et al. 2007; Watson et al. 2008; Woo et al. 2010, 2013). However, AO-assisted NIR observations for higher redshift QSOs (z > 0.1) are time consuming and may suffer from a low S/N (Grier et al. 2013) caused by the combination of weak absorption lines, surface brightness dimming, instrument sensitivity and atmospheric transmission.
In the rest-frame optical regime, the QSO and host galaxy contribution can be separated in high S/N single-aperture spectra by directly modelling them with template spectra for each component (Shen et al. 2008a, 2015). While a large sample can be studied with this technique, the fixed aperture size prevents such studies from measuring σ* at a physical size matched to the spheroid component. Furthermore, the reliability of the measurements decreases with increasing AGN luminosity and contrast ratio, thus limiting this technique to AGN with L5100 ≲ 1045 erg s−1. To probe more luminous AGN, deep off-axis spectroscopy a few arcsec away from the QSO has been obtained to reduce the contrast between QSO and host galaxy emission (Wolf & Sheinis 2008; Hughes et al. 2000; Wold et al. 2010). While σ* can be reliably derived from these off-axis spectra (Wolf & Sheinis 2008), an uncertain aperture correction needs to be applied to infer comparable measurements representative for the spheroidal component.
A direct decomposition the stellar continuum of the host galaxy underneath very luminous QSOs with deep optical integral-field unit observations was previously attempted with VIMOS for HE 1029−1401 (Husemann et al. 2010). Although HE 1029−1401 is much closer with a redshift of z = 0.086 but has a similar luminosity as PG 1307+085, the achieved S/N in the host spectrum was significantly lower than what we obtained with MUSE for PG 1307+085. This can be clearly attributed to the superior sensitivity, spatial resolution/sampling, and image quality of MUSE compared to VIMOS. These capabilities allow direct measurements of σ* with MUSE even in a high contrast regime that has not been accessible to any other techniques so far.
4.2 The nature of the large extended emission line region
4.2.1 Ionized gas shells driven by AGN outflows?
A number of recent studies report kpc-scale high-velocity outflows to be common around luminous AGN with line widths of about 1000 km s−1 (e.g. Cano-Díaz et al. 2012; Liu et al. 2013; Harrison et al. 2014; Liu, Zakamska & Greene 2014). Those outflows have been interpreted as spherically symmetric radiation pressure-dominated winds (Liu et al. 2013) and are possibly common for AGN with Lbol > 2 × 1045 erg s−1 (Zakamska & Greene 2014). However, not all QSOs above this luminosity threshold exhibit such powerful superbubble-like outflows (e.g. Husemann et al. 2010, 2013). The ionized gas kinematics of the ENLR around PG 1307+085 exhibits only small line widths with a velocity dispersion of <50 km s−1 in all the bright extended knots without any asymmetric component. This confidently rules out the AGN-driven superbubble scenario at least for this particular QSO.
Although PG 1307+085 is classified as radio-quiet QSO with R < 0.1 (Kellermann et al. 1989) and a relatively low radio-power (Lradio < 2 × 10²³ W Hz−1), it is still possible that a small-scale (<1 kpc) radio jet is accelerating gas through jet–cloud interactions. Some evidence that there is an outflow at least in the circumnuclear region of PG 1307+085 comes from the asymmetric [O iii] line (e.g. Mullaney et al. 2013). A deep 4.8 GHz high-resolution map obtained with the VLA was presented by Leipski et al. (2006). They reported tentative but inconclusive evidence for a small-scale one-sided radio jet with a size of 1 arcsec towards the south-west direction. The jet is certainly much smaller than the ENLR in size and cannot be the driver of its morphology. Especially, it would not be able to explain the bright ENLR knot to the east almost 90° away from the putative jet axis. On the other hand, the direction of the radio jet is consistent with the orientation of the velocity gradient close to the QSO position where we also find a peak in ionized gas velocity dispersion.
To summarize, we cannot rule out that there is an AGN outflow on scales of ≪1 arcsec, potentially driven by a radio jet of the same size. This picture is in agreement with the correlation between [O iii] asymmetry and radio luminosity discussed by Mullaney et al. (2013), because the low-velocity dispersion of the blue-shifted [O iii] component is consistent with the low R parameter and radio power. Another possibility is that there was a past outflow event, either driven by the AGN or radio jet. Such an event could have lifted gas further out in the halo of the galaxy (without accelerating the gas to escape velocity) from which the ENLR has formed.
4.2.2 Galaxy interactions and tidal debris?
Galaxy interactions, in particular major mergers, have been thought as a common channel to trigger luminous AGN (e.g. Sanders et al. 1988; Hopkins et al. 2005). While a fraction of AGN are known to reside in ongoing major mergers, systematic studies of QSO hosts have shown that major mergers cannot be the dominant mechanisms for fuelling AGN (e.g. Cisternas et al. 2011; Villforth et al. 2014) at least for moderate luminosities. However, it is particularly difficult to identify the faint morphological disturbances and tidal features in advanced mergers or major merger remnants, which can only be seen in very deep exposures (e.g. Bennert et al. 2008; Duc et al. 2015). Indeed, large ENLRs have been observed that are clearly associated with ongoing galaxy interaction (e.g. Villar-Martín et al. 2010; da Silva et al. 2011).
In the case of PG 1307+085, neither the HST images (Bahcall et al. 1994; Veilleux et al. 2009), nor the deep AO-assisted ground-based image (Guyon et al. 2006) reveal any detectable substructure at the location of the bright knots in the ENLR. However, the amount of ionized gas in these regions is small (∼107 M⊙) and given the hard radiation field, the total gas mass is not likely to be more than an order of magnitude larger. Thus, we cannot rule out that the ENLR corresponds to tidal features of a merging event. However, the likelihood of a recent major merger is low given that PG1307+085 is known to be FIR faint (Netzer et al. 2007), implying a lower star formation rate – at least in the last 100 Myr (Hayward et al. 2014) – than in other QSOs of similar luminosity. While the time delay between the peak of star formation and the AGN phase during the merger of a few 100 Myr could provide an explanation (e.g. Schawinski et al. 2007; Wild, Heckman & Charlot 2010), a minor merger scenario is more likely, considering the low gas mass and the lower metallicity gas. In particular, knot 2 and the diffuse extension towards knot 3 with the strong velocity gradient may be a kinematic signature of the tidal debris from a minor companion.
Such a minor merger scenario cannot explain the bright knots 1 and 2 in the ENLR morphology at the same time because they are oriented almost exactly 90° with respect to their specific QSO line of sights. It is notable that knot 1 is positioned along the axis between the massive galaxy at the galaxy group's centre and the QSO which are connected by a very faint bridge of ionized gas. Thus, the ENLR may be linked to the vivid group environment leading to gravitational interaction with several major or minor galaxies over short periods of time.
4.2.3 Illumination or interactions with the intergroup medium?
Another possibility for the origin of the ENLR morphology around PG 1307+085 is an ongoing interaction of the host galaxy with the diffuse intergroup medium (IGM). The systemic redshift of the host galaxy differs from the redshift of the central group galaxy by ∼350 km s−1 implying that it moves with significant speed through the IGM. Ionized gas tails behind galaxies due to ram-pressure stripping of their gas are well-known phenomena in groups and clusters (e.g. Chung et al. 2007; Fumagalli et al. 2014) and large filamentary structures of gas have been observed in cool-core clusters (e.g. Tremblay et al. 2015, and reference therein). Thus, it is possible that either ram pressure is pushing the remaining gas out of the QSO host or that the galaxy has hit a higher density IGM cloud/filament and is piling up the gas.
In particular, the (likely) low gas–phase metallicity together with the strong velocity gradient towards the south-west direction suggest an ongoing mixing of the gas with the surrounding IGM. The velocity gradient shows that the radial velocity of the most distant ionized gas clouds converges to the systematic velocity of the group. This would be common for both gas inflow and outflow scenarios because the gas will be confined by the ambient gas pressure anyway at large distances from the QSO. The gas–phase metallicity cannot be used to discriminate between the two scenarios as it will be mixed with the IGM in both cases. Such a mixing is observed in the large ENLRs around powerful radio-loud AGN (e.g. Fu & Stockton 2006) where the radio jet is likely driving a shock front through the IGM.
While luminous AGN with low NLR gas–phase metallicites are rare (e.g. Groves et al. 2006), another QSO, HE 2158−0107, with very similar characteristics has been studied by Husemann et al. (2011). Similar to PG 1307+085, the ionized gas around that QSO exhibits a low [N ii]/H α ratio, implying low metallicities, and a large ENLR extending >30 kpc beyond the host galaxy. It is unclear whether the QSO is linked to a galaxy group such as PG 1307+085, but it is possible that the origin of the ENLR for both objects is the same. HE 2158−0107 appears to be more strongly offset from the MBH–spheroid relations towards higher BH masses. This may point either to a different formation mechanism or a different evolutionary phase in the process that is also responsible for producing their large ENLR. Currently, a detailed systematic study of ENLR around early-type/elliptical QSOs hosts is missing to test how common group interactions are among this specific population and what role those interactions have for the overall evolution of those galaxies.
5 SUMMARY
In this article, we present deep optical integral-field spectroscopy with MUSE of the luminous radio-quiet QSO PG 1307+085. The combination of high spatial resolution and a wide FoV obtained with MUSE is essential to simultaneously characterize the large-scale distribution and properties of the warm ionized gas and the compact elliptical host galaxy underneath the bright QSO. We study the properties of this luminous QSO in unprecedented detail. Our findings can be summarized as follows.
We resolve the underlying host galaxy and measure a stellar velocity dispersion of σ* = 155 ± 19 km s−1. This places PG 1307+085 still within the scatter of the local MBH–σ* relation based on the reverberation-mapped BH mass, but slightly offset by ∼0.3 dex towards a higher BH with respect to the mean relation. It is unclear whether PG 1307+085 continues to move away from the mean relation or that the spheroid growth will eventually overtake the BH growth again moving the system back towards the relation.
We detect an ENLR with a complex morphology that extends at least out to ≳30 kpc from the QSO. In addition, we also reach a very low surface brightness detection limit to identify an ionized gas bridge between PG 1307+085 and a more massive companion galaxy just about 50 kpc away, presumably at the centre of a galaxy group.
The kinematics of the ENLR reveals no obvious signatures of broad emission lines on kpc scales which would be a genuine signature for large-scale AGN-driven outflow. Such a quiescent kinematic does not agree with the expectation that luminous AGN with Lbol > 1045.3 erg s−1 develop a radiatively driven galactic scale outflow (Zakamska & Greene 2014). Since PG 1307+085 has a low radio power even compared to the radio-quiet QSO population, our data are more consistent with the scenario drawn by Mullaney et al. (2013) in which galactic size radio jets are required and responsible for developing kpc-scale outflows.
A detailed comparison of line ratios across the ENLR with photoionization models indicates that the metallicity of the gas is likely lower compared to the bulk of the AGN population. Considering also the ENLR morphology and kinematics of the gas, we argue that PG 1307+085 is possibly in a phase of significant interaction with the group environment during which either the gas is stripped from the host galaxy by ram pressure or the host galaxy is replenished with external gas by minor mergers or intragroup gas filaments.
Although we cannot draw conclusions for the overall QSO population, the MUSE observations of PG 1307+085 provide unprecedented insights regarding the current state and evolution of its host galaxy. This demonstrates the great potential of MUSE for studying QSO host galaxies simultaneously with their immediate environments. The on-axis measurements of σ* for such a luminous QSO with a very compact host galaxy opens new perspectives for understanding the MBH–spheroid relation for AGN at the high BH mass end. In the future, observations of QSO host galaxies will greatly benefit in particular from the optical wide-field ground-layer AO mode of MUSE with which QSO studies can be extended to even higher redshifts and QSO luminosities.
We thank the referee for very instructive comments and suggestions that improved the clarity of the manuscript. We would like to thank Brent Groves and Stefanie Komossa for their help and valuable discussions about AGN photoionization models and their interpretation. These observations would not have been possible with enthusiasm and support of the staff at Paranal and the entire MUSE team, in particular Roland Bacon as the PI of the instrument. We thank Jakob Walcher for the continuous support for the development of pyparadise. The AGN Fe template spectrum of I Zw 1 was kindly provided by Todd Boroson. VNB acknowledges assistance from the National Science Foundation (NSF) Research at Undergraduate Institutions (RUI) grant AST-1312296 and support for programme number HST-AR-12625.11-A, provided by NASA through a grant from the Space Telescope Science Institute, which is operated by the Association of Universities for Research in Astronomy, Incorporated, under NASA contract NAS5-26555. JS acknowledges the European Research Council for the Advanced Grant Programme number 267399-Momentum. JHW acknowledges support by the National Research Foundation of Korea to the Center for Galaxy Evolution Research (2010-0027910).
This research has made use of the NASA/IPAC Extragalactic Database (NED) which is operated by the Jet Propulsion Laboratory, California Institute of Technology, under contract with the National Aeronautics and Space Administration. All figures have been created using Matplotlib library for python (Hunter 2007). This research made use of APLpy, an open-source plotting package for python hosted at http://aplpy.github.com. We used the online software CosmoCalc (Wright 2006) for the computation of cosmological parameters. Based on observations made with MUSE integral field spectrograph mounted to the Yepun Very Large Telescope at ESO-Paranal Observatory under the programme 60.A-9100(B).
Denotes a single spatial pixel in the data cube and consists of an entire spectrum.
REFERENCES
