


Abstract
Population III (Pop III) stars can regulate star formation in the primordial Universe in several ways. They can ionize nearby haloes, and even if their ionizing photons are trapped by their own haloes, their Lyman–Werner (LW) photons can still escape and destroy H2 in other haloes, preventing them from cooling and forming stars. LW escape fractions are thus a key parameter in cosmological simulations of early reionization and star formation but have not yet been parametrized for realistic haloes by halo or stellar mass. To do so, we perform radiation hydrodynamical simulations of LW UV escape from 9–120 M⊙ Pop III stars in 105–107 M⊙ haloes with zeus-mp. We find that photons in the LW lines (i.e. those responsible for destroying H2 in nearby systems) have escape fractions ranging from 0 to 85 per cent. No LW photons escape the most massive halo in our sample, even from the most massive star. Escape fractions for photons elsewhere in the 11.18–13.6 eV energy range, which can be redshifted into the LW lines at cosmological distances, are generally much higher, being above 60 per cent for all but the least massive stars in the most massive haloes. We find that shielding of H2 by neutral hydrogen, which has been neglected in most studies to date, produces escape fractions that are up to a factor of 3 smaller than those predicted by H2 self-shielding alone.
1 INTRODUCTION
The first stars form at z ∼ 20–30, or about 200 Myr after the big bang. Early numerical simulations suggested that Population III (Pop III) stars are very massive, 100–500 M⊙, and form in isolation, one per halo (Bromm, Coppi & Larson 1999, 2002; Abel, Bryan & Norman 2000, 2002; Nakamura & Umemura 2001; Glover 2005). More recent models indicate that most Pop III stars form in binaries (Turk, Abel & O'Shea 2009) or in small clusters (Stacy, Greif & Bromm 2010; Clark et al. 2011a,b; Greif et al. 2011, 2012; Smith et al. 2011; Dopcke et al. 2013; Glover 2013; Stacy & Bromm 2014) with a wide range of masses, all the way from the sub-solar regime to ∼103 M⊙. These calculations suggest that the final mass of a star is either limited by dynamical processes (Clark et al. 2011a; Greif et al. 2012; Smith et al. 2012) or by radiative feedback (McKee & Tan 2008; Hosokawa et al. 2011, 2012; Stacy, Greif & Bromm 2012; Hirano et al. 2014).
If any Pop III stars formed with masses below ∼0.8 M⊙, they will have survived until the present day, and they may therefore be detectable in surveys targeting extremely metal-poor stars in the Galactic bulge and halo as well as in nearby satellite galaxies (see the reviews by Beers & Christlieb 2005, or Frebel 2010). This could potentially allow us to set limits on the low-mass end of the primordial stellar initial mass function (IMF; see e.g. Tumlinson 2006; Salvadori, Schneider & Ferrara 2007; Hartwig et al. 2015). Unfortunately, the direct detection of Pop III stars in the high-redshift Universe is unlikely even with future 30 metre telescopes (although see Rydberg, Zackrisson & Scott 2010). As massive stars are very short lived, the upper end of the Pop III IMF is thus more difficult to constrain. This can only be done indirectly, for example by observing and analysing the supernovae (SNe) that mark the end of the lives of very massive stars. These may indeed be visible to the James Webb Space Telescope, the Thirty Meter Telescope, the Extremely Large Telescope and the Giant Magellan Telescope (e.g. Whalen et al. 2013a,b, 2014; Smidt et al. 2014). Another promising possibility is again Galactic archaeology. The comparison of the nucleosynthetic yields of Pop III SNe to the chemical abundances of extremely metal-poor stars observed in our Milky Way suggests that many Pop III stars may have masses in the range 15–40 M⊙ (e.g. Beers & Christlieb 2005; Frebel et al. 2005; Frebel, Johnson & Bromm 2008; Joggerst et al. 2010).
In this paper, we focus on the high-mass end of the Pop III IMF. Massive Pop III stars had the capability to profoundly transform their environment due to the strong radiative, chemical, and mechanical feedback they provide. They can evaporate the gas from their dark matter (DM) haloes, engulf nearby haloes with both ionizing and Lyman–Werner (LW) band UV radiation (Whalen, Abel & Norman 2004; Alvarez, Bromm & Shapiro 2006; Abel, Wise & Bryan 2007; Whalen et al. 2008), and alter their composition with the metal they produced and expelled. LW photons lie in a series of discrete lines located in the energy range 11.18–13.6 eV (corresponding to a wavelength range of 1110 –912 Å) and can travel great distances in the primeval universe because they lie below the ionization threshold of atomic hydrogen. They can delay or suppress star formation in nearby haloes because they photodissociate H2 and prevent the gas from cooling (see e.g. Haiman, Rees & Loeb 1997; Haiman, Abel & Rees 2000; Glover & Brand 2001, 2003; Machacek, Bryan & Abel 2001; Susa & Umemura 2006; O'Shea & Norman 2007; Susa 2007; Wise & Abel 2008). How Pop III stars regulate subsequent star formation is central to the rise of stellar populations in the first galaxies (Ciardi & Ferrara 2005; Johnson et al. 2009; Greif et al. 2010; Jeon et al. 2012; Wise et al. 2012; Pawlik, Milosavljević & Bromm 2013). This begins with understanding how the strength of the LW background changes over time, which depends on the masses of Pop III stars and the haloes in which they reside.
Over the past two decades, many studies have examined the influence of LW and ionizing radiation on the formation of stars at high redshift. They found that a photodissociating background cannot halt Pop III star formation but can delay it (e.g. Machacek et al. 2001; O'Shea & Norman 2007; Wise & Abel 2007; Safranek-Shrader et al. 2012). An early X-ray background created by accretion on to stellar remnants and by emission from SNe can catalyse additional H2 formation that offsets the effects of LW radiation to some extent, but radiative feedback overall is dominated by the LW background (Glover & Brand 2003; Machacek, Bryan & Abel 2003). The evolution of this background over time in general seems to play only a minor role if it changes less rapidly with redshift z than 10−z/5 (Visbal et al. 2014). Simulations suggest that Pop III stars forming in haloes illuminated by significant LW backgrounds will be more massive because their host haloes must grow to larger masses before beginning to cool (O'Shea & Norman 2007; Latif et al. 2014; Hirano et al. 2015). When they do begin to cool, collapse rates at their centres are higher and lead to more massive stars.
The effect of a single Pop III star on a nearby halo has been examined in much greater detail than in large cosmological boxes. Radiation hydrodynamical simulations by Susa & Umemura (2006) find that star formation in the vicinity of a source star is possible if the star-forming region exceeds a density threshold (see also Glover & Brand 2001). Other studies in this vein show that star formation can be either promoted or suppressed depending on the mass of the halo, the mass of the star, and the proximity of the halo to the star (Susa 2007; Whalen et al. 2008; Whalen, Hueckstaedt & McConkie 2010, see also Shapiro, Iliev & Raga 2004, Iliev, Shapiro & Raga 2005, Hasegawa, Umemura & Susa 2009 and Susa, Umemura & Hasegawa 2009).
In some cases, the H ii region of a Pop III star may fail to break out from a halo because of large central gas densities. In such cases, LW photons might still exit the halo because their energies lie below the ionization limit of hydrogen, even if H2 self-shields against this flux to some degree. Most simulations of radiative feedback with Pop III stars in cosmological boxes simply assume uniform LW backgrounds. A parametrization of LW escape fractions from primordial haloes as a function of halo and stellar mass could provide the strength of this background from first principles in future simulations. However, almost no work has been done to produce such a parametrization. In the only previous study on this topic of which we are aware, Kitayama et al. (2004) examined LW escape fractions from Pop III star-forming haloes with a Navarro, Frenk & White (1997) radial density profile, varying the mass of the halo and central star.
In an effort to improve on this previous study, we perform radiation hydrodynamical calculations of LW escape from Pop III minihaloes with the zeus-mp code. We then post-process the simulations with semi-analytical methods and calculate escape fractions in two limits, the near-field and the far-field. In the near-field case – the only scenario considered by Kitayama et al. (2004) – we compute the escape fraction of photons in the LW lines themselves. This is the value that is relevant if we are interested in the effect of radiation from the halo on H2 in its immediate vicinity. In the far-field case, on the other hand, we are interested in the total fraction of the photons lying between 13.6 and 11.2 eV that can escape from the halo. This is the important quantity if we are interested in the effect of radiation from the halo on H2 located at cosmological distances.
In both cases, we account not only for H2 self-shielding but also for shielding from the Lyman series lines of atomic hydrogen, which were not considered by Kitayama et al. (2004). In some circumstances, this can significantly affect the LW escape fraction.
Our paper is structured as follows. In Section 2, we describe our numerical models. In Section 3, we tabulate LW escape fractions by halo and stellar masses and we conclude in Section 4.
2 METHOD
To calculate LW escape fractions for a given star and halo, we first evolve the H ii region of the star with the radiation hydrodynamics simulation code zeus-mp. We then post-process the profiles for the ionization front (I-front) and the surrounding halo with semi-analytic calculations to determine how many LW photons exit the halo. LW escape fractions in both the near-field and far-field approximations are considered, as described below.
2.1 zeus-mp
zeus-mp is an astrophysical radiation-hydrodynamics code that self-consistently couples photon-conserving ray tracing UV transport and non-equilibrium primordial gas chemistry to gas dynamics to evolve cosmological I-fronts (Whalen & Norman 2006, 2008a,b). We evolve mass fractions for H, H+, He, He+, He2+, H−, H|$^{+}_{2}$|, H2, and e− with nine additional continuity equations and the non-equilibrium rate equations of Anninos et al. (1997) in which the species are assumed to share a common velocity distribution. Mass and charge conservation, which are not formally guaranteed by either the network or advection steps, are enforced at every update of the reaction network. Heating and cooling due to photoionization and chemistry are coupled to the gas energy density with an isochoric update that is operator-split from the fluid equations. Cooling due to collisional ionization and excitation of H and He, recombinations of H and He, inverse Compton scattering from the cosmic microwave background, bremsstrahlung emission, and H2 cooling are all included in our models. The chemical and cooling rate coefficients are the same as those used in Anninos et al. (1997), with one important exception: we use case B rates to describe the recombination of hydrogen and helium, rather than case A as used in Anninos et al. (1997).
We use 120 energy bins in our photon-conserving UV transport scheme, 40 bins that are uniform in energy from 0.755 to 13.6 eV and 80 bins that are logarithmically spaced from 13.6 to 90 eV. We normalize photon rates in each bin by the time-averaged ionizing photon rates and surface temperatures for Pop III stars from tables 3 and 4 of Schaerer (2002). The radiative reactions in our simulations are listed in table 1 of Whalen & Norman (2008b), and the momentum imparted to the gas by ionizations of H and He is included in the photon transport. Photon conservation is not used to calculate H2 photodissociation rates. They are derived along radial rays from the star with the self-shielding functions of Draine & Bertoldi (1996, hereafter DB96) modified for thermal broadening as a proxy for the effects of gas motion (equations 9 and 10 in Whalen & Norman 2008b), with r−2 attenuation taken into account.
Two-photon emission from recombining He+ and He2+ can produce photons capable of photodissociating H2. However, we do not account for the effects of this nebular emission, as it is unimportant in comparison to the effects of the direct stellar emission.
2.2 Halo models
We adopt the one-dimensional (1D) spherically averaged halo profiles used in Whalen et al. (2010), which were based on the results of cosmological simulations carried out with the enzo adaptive mesh refinement code (Bryan et al. 2014). Their masses are 6.9 × 10⁵, 2.1 × 10⁶ and 1.2 × 10⁷ M⊙. This corresponds to the range of halo masses in which Pop III stars are expected to form via H2 cooling, and all three haloes form at z ∼ 20. Densities, velocities, temperatures and mass fractions for all nine primordial species are mapped from these profiles on to a 1D spherical grid in zeus-mp. We summarize the properties of these haloes in Table 1 and plot their initial densities, velocities, temperatures, and species mass fractions in Fig. 1.
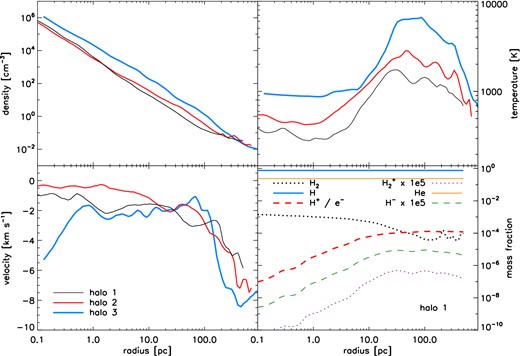
Initial densities (upper left), temperatures (upper right), radial velocities (lower left) and species mass fractions (lower right) for the three haloes.
Virial radii and total (DM + baryon) masses of the three haloes.
| Halo | R200 (pc) | Mass (M⊙) |
| 1 | 256.8 | 6.9 × 10⁵ |
| 2 | 339.6 | 2.1 × 10⁶ |
| 3 | 495.2 | 1.2 × 10⁷ |
| Halo | R200 (pc) | Mass (M⊙) |
| 1 | 256.8 | 6.9 × 10⁵ |
| 2 | 339.6 | 2.1 × 10⁶ |
| 3 | 495.2 | 1.2 × 10⁷ |
Virial radii and total (DM + baryon) masses of the three haloes.
| Halo | R200 (pc) | Mass (M⊙) |
| 1 | 256.8 | 6.9 × 10⁵ |
| 2 | 339.6 | 2.1 × 10⁶ |
| 3 | 495.2 | 1.2 × 10⁷ |
| Halo | R200 (pc) | Mass (M⊙) |
| 1 | 256.8 | 6.9 × 10⁵ |
| 2 | 339.6 | 2.1 × 10⁶ |
| 3 | 495.2 | 1.2 × 10⁷ |
The gas densities have nearly a power-law profile with slopes around −2.1, with the most massive halo having the highest densities. Temperatures vary from a few hundred K to several thousand K and generally increase with halo mass. This is to be expected since the virial temperature of a halo scales with the halo mass as Tvir ∝ M2/3. Virial shocks are visible in all three profiles at ∼100 pc, where infall velocities abruptly decrease as accretion flows crash into increasingly dense regions of the halo. Shock heating at these radii is also evident in the temperature profiles, and is almost strong enough to collisionally ionize atomic hydrogen in halo 3.
zeus-mp does not evolve DM particles as in cosmological codes such as enzo or gadget; instead, an additional gravitational potential is implemented as a proxy for the DM potential of the halo. We take its potential to be that required to keep the baryons in hydrostatic equilibrium on the grid. The mass associated with this potential is nearly the same as that of the halo. We interpolate this pre-computed potential on to the grid at the beginning of the run but it does not evolve thereafter. Taking the potential to be static is a reasonable approximation because merger and accretion time-scales at z ∼ 20 are of the order of 20 Myr, significantly longer than the lifetimes of most of the stars that we consider in this study (see Table 2). We therefore do not expect the DM distribution to evolve much over the lifetime of the star.
2.3 H ii region simulation setup
We centre the Pop III star at the origin of a 1D spherically symmetric grid that has 500 ratioed zones in radius. The inner boundaries are at 2.0 × 1017 cm (haloes 1 and 2) or 4.0 × 1017 cm (halo 3) and the outer boundaries are at slightly more than twice the virial radius of the halo. Reflecting and outflow conditions are imposed on the inner and outer boundaries, respectively. Densities, energies, velocities and species mass fractions from our enzo profiles are mapped on to the zeus-mp grid with a simple linear interpolation of the logarithm of the given variable. We consider Pop III stars with masses 9, 15, 25, 40, 60, 80 and 120 M⊙ in all three haloes, leading to a total of 21 models. The properties of these stars are listed in Table 2 (Schaerer 2002). Each simulation is run out to the end of the life of the star.
Pop III stellar properties (Schaerer 2002).
| M (M⊙) | Lifetime (Myr) | log L (L⊙) | log Teff (K) |
| 9 | 20.2 | 3.709 | 4.622 |
| 15 | 10.4 | 4.324 | 4.759 |
| 25 | 6.46 | 4.890 | 4.850 |
| 40 | 3.86 | 5.420 | 4.900 |
| 60 | 3.46 | 5.715 | 4.943 |
| 80 | 3.01 | 5.947 | 4.970 |
| 120 | 2.52 | 6.243 | 4.981 |
| M (M⊙) | Lifetime (Myr) | log L (L⊙) | log Teff (K) |
| 9 | 20.2 | 3.709 | 4.622 |
| 15 | 10.4 | 4.324 | 4.759 |
| 25 | 6.46 | 4.890 | 4.850 |
| 40 | 3.86 | 5.420 | 4.900 |
| 60 | 3.46 | 5.715 | 4.943 |
| 80 | 3.01 | 5.947 | 4.970 |
| 120 | 2.52 | 6.243 | 4.981 |
In two of the 21 simulations (the 15 M⊙ star in haloes 1 and 2), the I-front is confined to small radii that require a finer grid in order to be resolved. We therefore use a grid of 1000 zones with two contiguous blocks: a very finely spaced uniform grid with 600 cells to resolve the I-front followed by a ratioed grid with 400 cells that again extends to twice the virial radius of the halo. We ensure that the length of the innermost zone of the outer block is within 20 per cent of that of the outermost zone of the inner block to avoid spurious reflections of shocks at the interface of the two blocks.
2.4 LW escape fractions
Molecular hydrogen has no dipole moment and is therefore destroyed in a two-step photodissociation process, the Solomon process (Stecher & Williams 1967): |$\mathrm{H}_2 + \gamma \rightarrow \mathrm{H}_2^\star \rightarrow 2 \mathrm{H}$|. Incident radiation can excite the molecule from the ground state to an electronically excited state. Two of these excited states, |$\mathrm{B}^1\Sigma ^+_\mathrm{u}$| (known as the Lyman state) and C1Πu (the Werner state), are separated from the electronic ground state by less than 13.6 eV, and transitions to these states can therefore be brought about by photons with energies below the Lyman limit of atomic hydrogen. Within the Lyman and Werner states, a variety of bound rotational or vibrational levels are accessible, and so transitions from the ground state to the Lyman or Werner states occur through a series of discrete lines, known as the Lyman–Werner band system, or simply as the Lyman–Werner lines. Once excited by a photon in one of these lines (an LW photon), the H2 molecule remains in the Lyman or Werner state for only a very short time Δt ∼ 10−8 s, before decaying back to the electronic ground state. Most of the time, the H2 molecule decays to a bound ro-vibrational level in the ground state. However, a small fraction of the time, the decay occurs to the vibrational continuum, resulting in the dissociation of the H2 molecule. The dissociation probability depends on the details of the incident spectrum and the density and temperature of the gas (which fix the initial rotational and vibrational level populations), but is typically around 15 per cent (DB96). The remaining 85 per cent of LW photon absorptions result in decay back to a bound state. In a small fraction of cases, this results in a photon with the same energy as the original LW photon (albeit with a random direction). However, the majority of the time, the re-emitted photon has too small an energy to bring about photodissociation (for more details, see the discussion in section 3.4 of Glover & Brand 2001).
When the H2 column density is large, the gas becomes optically thick in the LW lines. This can prevent radiation from an external source from reaching the centre of a halo or LW flux from the centre of a halo from escaping it. The gas therefore self-shields against LW radiation. In addition, LW photons can also be absorbed by most of the Lyman series lines of atomic hydrogen.1 However, because the frequencies of the LW lines of H2 do not coincide particularly closely with those of the Lyman series lines of H, this effect only becomes important when the atomic hydrogen column density is very high, NH ≃ 1023 cm−2 or above, so that the Lyman series lines are strongly Lorentz-broadened (Wolcott-Green & Haiman 2011).
In the immediate vicinity of a halo, the photons responsible for photodissociating H2 are those emitted in the LW lines in the rest frame of the halo. The absorption of these photons by H2 and H within the halo can be conveniently parametrized by a simple self-shielding function (see e.g. DB96; Wolcott-Green & Haiman 2011, hereafter simply WH11). The escape fraction of photons in this limit, which we term the near-field limit, is then simply given by the value of this self-shielding function evaluated at the virial radius of the halo. At larger, cosmological distances, the LW flux is redshifted by the expanding Universe or Doppler-shifted due to relative velocities between haloes. As a consequence, the LW lines in the source frame may not coincide with LW absorption lines in the local frame of a halo. A simple estimate of the escape fraction in this limit, which we term the far-field limit, is given by the fraction of the LW range 11.2–13.6 eV not lying inside the combined equivalent width of the absorption lines. In the sections below, we describe in more detail how we compute the LW escape fractions in both limits.
2.4.1 Near-field limit
2.4.2 Far-field limit
In the far-field approximation, we begin by calculating the dimensionless equivalent width of all the LW lines, |$\widetilde{W}^{\prime }$|. It cannot exceed the total dimensionless width of the LW range 11.2–13.6 eV: |$W^\prime _\mathrm{ max} = \ln (1110/912)\simeq 0.2$|. The escape fraction in the far-field limit is then one minus the fraction of these two quantities, |$f_\mathrm{esc} = 1{-}\widetilde{W}^{\prime }/W^\prime _ \mathrm{max}$|.
Lorentz broadening, also known as natural broadening, is intrinsic to the line and is a consequence of the uncertainty principle: a quantum state with a lifetime Δt has an uncertainty associated with its energy ΔE such that ΔEΔt ≥ ℏ/2. Consequently, radiative transitions to or from this state do not have a precise energy but instead occur with a range of energies with a distribution with a width ∼ΔE. Doppler broadening, also known as thermal broadening, is a consequence of the thermal motion of molecules and atoms. The Doppler shifts associated with this motion again lead to a spread in the frequency of the transition in the laboratory frame. If the gas particles have a Maxwell–Boltzmann velocity distribution, the line profile is a simple Gaussian when Doppler broadening dominates.
Doppler broadening usually dominates near the centre of the line ν0. However, the Doppler line profile function falls off exponentially away from the line centre while the Lorentz profile falls off only as (ν–ν0)−2. Lorentz broadening therefore always dominates far enough from the centre of the line. Lorentz broadening can often be ignored far from the centre of the line because the line is so weak there that the optical depth due to that region of the line profile is ≪1. However, if Nl is very large this may no longer be true and we need to account for both Lorentz and Doppler broadening.
For each transition, we take the molecular data required to compute the dimensionless equivalent width – the oscillator strength and frequency of the transition, and the total radiative de-excitation rate of the excited state – from the papers by Abgrall & Roueff (1989) and Abgrall et al. (1992).
3 RESULTS
We first examine the evolution of the I-front and H ii region in a halo and then present our results for fesc in the near-field and far-field limits.
3.1 Evolution of the H ii region
The evolution of the I-front and H ii region depends on the mass of the star and its host halo. At early times the I-front propagates very rapidly, leaving the gas behind it essentially undisturbed (an R-type front). It then decelerates as it approaches the Strömgren radius of the halo. If the halo is massive and the star is not very luminous, the I-front stalls at the Strömgren radius and advances no further. If the star is bright, the front may briefly loiter at the Strömgren radius, but it then resumes its expansion driving a shock in front of it (a D-type front). As it descends the steep density gradient of the halo, the front can break through the shell and revert to R-type, flash ionizing the halo out to radii of 2.5–5 kpc. The I-front may be preceded by an H2 photodissociation front driven by LW photons (see e.g. studies by Ricotti, Gnedin & Shull 2001, 2002). This second radiation front is often at first confined to the halo because the rate of H2 formation in the photodissociation region (PDR) exceeds the rate at which LW photons are emitted by the star.
We show in Fig. 2 profiles for the I-front, H ii region and PDR for the 60 M⊙ star in halo 1 at 0.175, 0.35, 0.875 and 3.5 Myr, the lifetime of the star. At 0.175 Myr, it is evident from the temperature plot that the I-front has become D-type: an ionized region with a temperature of 4.5 × 10⁴ K extends out to the position of the front at 1.2 pc, after which the temperature drops to 1400 K, rises to 4000 K at 1.5 pc and then falls to below 500 K at 1.7 pc. The 4000 K gas is the plowed up, shocked material. The temperature falls to 1400 K in the region between the fully ionized gas and the dense shell because of H2 cooling in the outer layers of the I-front. The shock has fully detached from the front and is at ∼1.7 pc. The density spike at 1.3 pc marks the centre of the plowed up shell, which has 10 times the density of the ambient halo. H2 mass fractions reach 10−4 between the I-front and the dense shell and then fall to 10−7 just beyond it, marking the beginning of the PDR. The latter extends out to ∼100 pc, beyond which the H2 mass fractions gradually rise to ∼10−4, those that were in the halo prior to the birth of the star. Note the extremely low H2 mass fractions within the H ii region that are due to collisional dissociation.

Evolution of the I-front of the 60 M⊙ star in halo 1. The times are 0.175 Myr (black solid line), 0.35 Myr (blue dotted line), 0.875 Myr (green dashed line) and 3.5 Myr, the end of the life of the star (red dash–dotted line).
At 0.35 Myr, the I-front has advanced to ∼4 pc, but remains D-type and continues to move behind the shock front. The structures of the PDR beyond the I-front are virtually identical to the ones at 0.175 Myr, as shown in the H2 mass fractions. Note that at each stage the rise of the H2 column density to its peak value coincides with the position of the H2 layer just ahead of the front. The thin layer in which most of the H2 forms has a peak H2 abundance of over 10−4, slightly higher than at 0.175 Myr. It is also somewhat wider, but the peak density in the layer is roughly an order of magnitude lower than at 0.175 Myr. Together, these factors lead to the H2 column density at 0.35 Myr being little changed from its value at 0.175 Myr.
The H ii region remains D-type until about 0.875 Myr, when the dense shell is barely visible in the temperature profile at ∼20 pc. The peak H2 abundance in the shell at this point has fallen to 10−5 because of the smaller densities there, resulting in a substantially lower H2 column density. As the halo becomes more and more ionized, more LW photons pass through the I-front and decrease the H2 abundance in the PDR. This also increases the radius of the PDR, from 100 pc at 0.375 Myr to 250 pc at 0.875 Myr. The peak density behind the shock front has fallen to ∼75 cm−3, but this is still 10 times higher than the density immediately ahead of the shock.
Later on, the I-front becomes R-type, overruns the PDR and breaks out of the halo. As the density of the H2 layer falls with the expansion of the I-front, the H2 column density decreases.
At the end of the lifetime of the star, 3.5 Myr, the whole halo is ionized, while the shock front is still moving outwards. Nearly all molecular hydrogen is destroyed in the H ii region due to collisional dissociations, resulting is a very low H2 column density which is not able to shield against LW radiation.
This case is an example of delayed breakout, in which the star eventually ionizes the halo, but only after a large fraction of its lifetime. In our grid of models some I-fronts loiter at the Strömgren radius until the death of the star. For the 9 M⊙ star in the 1.7 × 10⁷ M⊙ halo, the Strömgren radius is below the grid resolution and the H ii region remains hypercompact until the death of the star. In these models the halo is essentially undisturbed by UV radiation from the star.
3.2 LW escape fractions in the near-field limit
The escape fraction evolves as the H ii region of the star expands in the halo and the H2 column density and neutral H fraction change. In Fig. 3, we show how fesc evolves over time with H2 self-shielding alone (dotted lines) and with both H2 and H shielding (solid lines) for the 9 M⊙ and 80 M⊙ stars in halo 1. With the 9 M⊙ star, the I-front is trapped and ionizing UV photons never break out of the halo. With the 80 M⊙ star, the I-front breaks out of the halo and fully ionizes it. Here, the escape fraction is essentially zero until the I-front changes to R-type at 0.6 Myr. Before this transition, the H2 column density is high enough to prevent most LW photons from escaping the halo, due to the dense shell driven by the I-front. After the front breaks through the dense shell and accelerates down the steep density gradient of the halo, the column density of H2 rapidly decreases, owing to the rapid decrease in the post-shock density. Because the density decreases so rapidly with radius, most of the H2 is destroyed by the front well before it reaches the virial radius of the halo at a time ∼0.9 Myr.
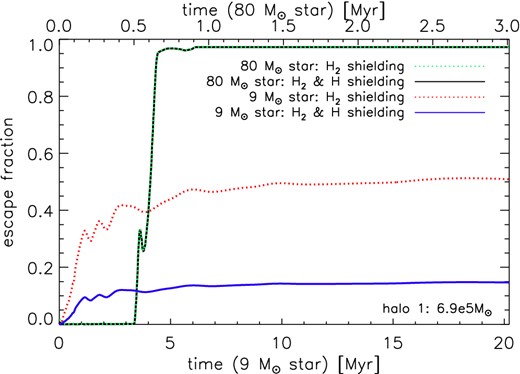
Smoothed escape fractions for a 9 M⊙ star (black solid and green dotted lines, overlying) and an 80 M⊙ star (blue solid and red dotted lines) in halo 1 as a function of time. Escape fractions with shielding by H2 only (dotted lines) and by H2 and neutral hydrogen (solid lines) are shown.
The rapid initial increase in fesc with the 9 M⊙ star is due to the lower luminosity of the star, which creates less H2 in the dense shell plowed up by the I-front. The dense shell therefore has a lower H2 column density and hence traps LW photons less effectively than in the case of the 80 M⊙ star. However, the smaller UV flux also prevents the I-front from overrunning the entire halo, leading to it remaining trapped for the lifetime of the star. Consequently, the H2 column density in the post-shock shell varies only slightly over the lifetime of the star, and the LW escape fraction tends towards a roughly constant value. If we account only for H2 self-shielding, then the LW escape fraction at late times is around 51 per cent . On the other hand, if we also account for absorption in the Lyman series lines of atomic hydrogen, we recover instead an escape fraction of around 15 per cent at late times. We see therefore that shielding due to neutral H is especially important in this case. This is because most of the halo is not ionized, and the presence of atomic hydrogen reduces fesc by more than two thirds compared to the value based on H2 alone. We conclude that shielding by neutral hydrogen cannot be neglected for stars with M ∼ 10 M⊙ in cosmological haloes.
We list near-field escape fractions that are averaged over the lifetime of the star in Tables 3 and 4. Table 3 shows the values that we obtain if we only account for H2 self-shielding, while Table 4 shows the corresponding values for the case where we account for shielding by both H and H2. We see that on the whole, we recover similar values in both cases, unless the mass of the star is low, or the mass of the halo is large.
Near-field escape fractions (in per cent) averaged over the lifetime of the stars, accounting only for H2 self-shielding.
| M [M⊙] | 9 | 15 | 25 | 40 | 60 | 80 | 120 |
| Halo 1 | 45 | 13 | 34 | 58 | 72 | 78 | 83 |
| Halo 2 | 34 | 8 | <1 | <1 | 18 | 49 | 74 |
| Halo 3 | <1 | 10 | 34 | 3 | <1 | <1 | <1 |
| M [M⊙] | 9 | 15 | 25 | 40 | 60 | 80 | 120 |
| Halo 1 | 45 | 13 | 34 | 58 | 72 | 78 | 83 |
| Halo 2 | 34 | 8 | <1 | <1 | 18 | 49 | 74 |
| Halo 3 | <1 | 10 | 34 | 3 | <1 | <1 | <1 |
Near-field escape fractions (in per cent) averaged over the lifetime of the stars, accounting for shielding by both H2 and H.
| M [M⊙] | 9 | 15 | 25 | 40 | 60 | 80 | 120 |
| Halo 1 | 13 | 12 | 34 | 58 | 72 | 78 | 83 |
| Halo 2 | 12 | 8 | <1 | <1 | 18 | 49 | 74 |
| Halo 3 | <1 | 2 | 8 | <1 | <1 | <1 | <1 |
| M [M⊙] | 9 | 15 | 25 | 40 | 60 | 80 | 120 |
| Halo 1 | 13 | 12 | 34 | 58 | 72 | 78 | 83 |
| Halo 2 | 12 | 8 | <1 | <1 | 18 | 49 | 74 |
| Halo 3 | <1 | 2 | 8 | <1 | <1 | <1 | <1 |
Our time-averaged values for the near-field escape fraction are also plotted for all three haloes as a function of stellar mass in Fig. 4. For a given star, fesc falls with increasing halo mass because a smaller fraction of the halo becomes ionized. In haloes 1 and 2, fesc increases with stellar mass, because the higher luminosities of the more massive stars ionize more of the halo. None of the stars in our study can ionize halo 3, which is not only the most massive halo but is also the densest (see Fig. 1). All LW photons are also trapped, even for the 120 M⊙ star. With more massive stars in halo 3, the H ii region does expand, but the star dies before the I-front can reach the virial radius.

Time-averaged escape fractions for all our models as a function of stellar mass for halo 1 (black thin line), halo 2 (red normal line), and halo 3 (blue thick line). Escape fractions with just shielding by H2 (dotted lines) and by H2 and neutral hydrogen (solid lines) are shown, together with some values from Kitayama et al. (2004, purple stars).
Note that escape fractions for small stars (the 9 M⊙ star in halo, the 9 and 15 M⊙ stars in halo 2 and the 25 M⊙ star in halo 3) can actually be larger than for more massive stars in the same halo. The lower luminosities of these less massive stars produce less H2 in the dense shell surrounding the H ii region so more LW photons can escape the halo. We can compare our numbers with the study by Kitayama et al. (2004). However, we note that they are using an earlier self-shielding function from DB96 and the overlap in parameter space is quite limited. They find the escape fraction for a 25 M⊙ star in a 5.5 × 10⁵ M⊙ halo to be about half the value for our 6.9 × 10⁵ M ⊙ halo. As Kitayama et al. (2004) consider their escape fractions to be lower limits, and given the differences in halo structure between our models and theirs, we conclude that the two approaches yield consistent results.
3.3 Far-field limit
As expected, escape fractions in the far-field limit are generally much higher than in the near-field. We show time-averaged escape fractions with self-shielding due to H2 only for all our runs in Table 5 and the upper panel of Fig. 5, and for shielding by H2 and H in Table 6 and the lower panel of Fig. 5, respectively.
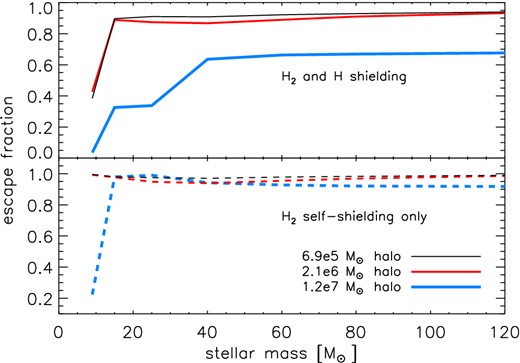
Time-averaged escape fractions in the far field limit for all the models in our study, plotted as a function of stellar mass (halo 1: black thin line; halo 2: red normal line; halo 3: blue thick line). In the lower panel, escape fractions for self-shielding by H2 alone are shown (dashed lines). In the upper panel, escape fractions that account for shielding by H and H2 (solid lines).
Far-field escape fractions (in per cent) averaged over the lifetime of the star, accounting only for H2 self-shielding.
| M [M⊙] | 9 | 15 | 25 | 40 | 60 | 80 | 120 |
| Halo 1 | 99 | 98 | 97 | 97 | 98 | 98 | 99 |
| Halo 2 | 99 | 98 | 95 | 94 | 95 | 97 | 99 |
| Halo 3 | 22 | 98 | 99 | 94 | 93 | 92 | 92 |
| M [M⊙] | 9 | 15 | 25 | 40 | 60 | 80 | 120 |
| Halo 1 | 99 | 98 | 97 | 97 | 98 | 98 | 99 |
| Halo 2 | 99 | 98 | 95 | 94 | 95 | 97 | 99 |
| Halo 3 | 22 | 98 | 99 | 94 | 93 | 92 | 92 |
Far-field escape fractions averaged over the lifetime of the stars, accounting for shielding by both H2 and H.
| M [M⊙] | 9 | 15 | 25 | 40 | 60 | 80 | 120 |
| Halo 1 | 38 | 90 | 91 | 91 | 92 | 93 | 94 |
| Halo 2 | 43 | 89 | 87 | 87 | 89 | 91 | 93 |
| Halo 3 | 4 | 33 | 34 | 64 | 66 | 67 | 68 |
| M [M⊙] | 9 | 15 | 25 | 40 | 60 | 80 | 120 |
| Halo 1 | 38 | 90 | 91 | 91 | 92 | 93 | 94 |
| Halo 2 | 43 | 89 | 87 | 87 | 89 | 91 | 93 |
| Halo 3 | 4 | 33 | 34 | 64 | 66 | 67 | 68 |
When considering only shielding by H2, for haloes 1 and 2, the escape fraction is always higher than 90 per cent and nearly all LW photons escape the halo. In halo 3, most of the LW radiation from the 9 M⊙ star is trapped in the halo, and only a quarter of the photons can escape. The higher mass stars all have larger luminosities so their radiation eventually escapes halo 3.
As in the near-field limit, including shielding by atomic hydrogen reduces the escape fraction. Less than half of the LW photons from the 9 M⊙ star escape any halo. In particular the escape fraction in halo 3 is only fesc ≈ 4 per cent . LW escape fractions in haloes 1 and 2 for more massive stars are above 85 per cent , and they rise slightly with halo mass. In halo 3, the picture is different: for the 9, 15 and 25 M⊙ stars, the I-front is static and ionizing photons are trapped in the halo. The Strömgren radii of the I-fronts of the 15 and 25 M⊙ stars are similar, 0.13 and 0.14 pc, respectively, which explains the step in escape fraction over that mass range. With more massive stars the I-front eventually advances beyond the Strömgren radius, but the star dies before it can reach the virial radius. The final radii of the H ii regions increase only slightly with the mass of the star, because although they are more luminous these stars also have shorter lives. The radii vary from 12 to 20 pc for 40–120 M⊙ stars, resulting in escape fractions of 64 to 68 per cent .
4 CONCLUSION
We have calculated LW escape fractions for 9–120 M⊙ Pop III stars in three different primordial haloes ranging in mass from 6.9 × 10⁵ to 1.2 × 10⁷ M⊙. We have considered two limiting cases. The near-field limit is relevant for objects close to the halo that do not have a significant velocity relative to it, so that the LW absorption lines in the rest frame of the object coincide with those in the rest frame of the halo. In this limit, the escape fraction can be approximated by the product of the self-shielding function of H2 and the shielding function of H2 by neutral hydrogen which have been developed by WH11. The far-field limit is valid for objects that are significantly redshifted or blueshifted with respect to the halo, usually at cosmological distances. In this limit, we can estimate the escape fraction by calculating the ratio of the equivalent width of the LW absorption lines to the width of the entire LW frequency range.
In both limits, we consider self-shielding by molecular hydrogen alone as well as the combined effects of molecular and atomic gas together. We find that it is important to consider both types of shielding.
In the near-field, the escape fraction generally rises with increasing mass of the central star. In the 6.9 × 10⁵ M⊙ halo, it grows from about 10 per cent to about 85 per cent and for the 2.1 × 10⁶ M⊙ halo to about 75 per cent . None of the stars in our study are bright enough to fully ionize the 1.2 × 10⁷ M⊙ halo and escape fractions from this halo are nearly zero in the near-field. For some stars with masses close to 10 M⊙, escape fractions can be higher than for slightly more massive stars because their lower luminosities cannot build up as large an H2 column density, e.g. 12 per cent of the LW photons are able to escape the 2.1 × 10⁶ M⊙ halo for a 9 M⊙ star, but only 8 per cent for a 15 M⊙ star.
In the far-field, the escape fractions are generally higher. Only in the case of the 9 M⊙ star do fewer than 50 per cent of its LW photons exit all of our haloes. In the most massive halo, this is also true for the 15 and 25 M⊙ stars. For higher stellar masses, the escape fraction rises to above 90 per cent for the less massive haloes and to above 60 per cent for the 1.2 × 10⁷ M⊙ halo.
If shielding by neutral H is neglected, the escape fractions are overpredicted. Therefore, the additional shielding function of neutral hydrogen from WH11 provides an important improvement to the older model from DB96. This is especially severe for stars with masses up to 25 M⊙ in the near-field, where shielding by neutral H reduces the escape fraction by as much as a factor of 3. In the far-field, less than 50 per cent of the LW radiation from a 9 M⊙ star can exit any halo, but if neutral hydrogen shielding is neglected up to 99 per cent can exit the halo. The 1.2 × 10⁷ M⊙ halo is not ionized by any of the central stars considered, so its large neutral hydrogen column density plays a major role in shielding, reducing the escape fraction from about 90 per cent to about 60 per cent for stars with masses of 40 M⊙ and higher.
Our models assume 1D spherical symmetry. In reality, both ionizing and LW photons can break out of the halo along lines of sight with lower optical depths, so our escape fractions should be taken to be lower limits. We note in particular that shielding by neutral H, which has largely been ignored in studies until now, can play a large role in LW escape fractions, especially those of lower mass Pop III stars. This latter point is important because of the relative contributions of lower mass and higher mass Pop III stars to the LW background. It has recently been found that more realistic stellar spectra that contain a lower mass Pop III star component may be less efficient at photodissociating H2 in primordial haloes than previously thought (Agarwal & Khochfar 2015). Shielding by H in the host haloes of such lower mass Pop III stars may reinforce this trend by allowing fewer LW photons to escape into the cosmos.
Finally, we note that star formation in the vicinity of a halo hosting a low-mass Pop III star may be less influenced by the star than by the global LW background because of low escape fractions from the halo in the near field. Conversely, smaller LW escape fractions from low-mass Pop III stars have less of an effect on the LW background on cosmological scales because escape fractions in the far-field limit are generally much larger.
We thank the anonymous referee for a careful review of our paper. We thank Volker Bromm, Andreas Burkert, Andrea Ferrara, Tilman Hartwig and Jan-Pieter Paardekooper for useful discussions. We acknowledge support from the European Research Council under the European Community's Seventh Framework Programme (FP7/2007 – 2013) via the ERC Advanced Grant ‘STARLIGHT: Formation of the First Stars’ (project number 339177). SCOG and RSK also acknowledge support from the Deutsche Forschungsgemeinschaft via SFB 881, ‘The Milky Way System’ (sub-projects B1, B2 and B8) and SPP 1573, ‘Physics of the Interstellar Medium’ (grant number GL 668/2-1).
The exception is Lyman α, which is located at too low an energy.
REFERENCES
