


 : constraining the time-scale for low-mass satellite quenching with ELVIS
-
 PDF
PDF
-
Cite
Cite
Sean P. Fillingham, Michael C. Cooper, Coral Wheeler, Shea Garrison-Kimmel, Michael Boylan-Kolchin, James S. Bullock, Taking care of business in a flash
: constraining the time-scale for low-mass satellite quenching with ELVIS, Monthly Notices of the Royal Astronomical Society, Volume 454, Issue 2, 01 December 2015, Pages 2039–2049, https://doi.org/10.1093/mnras/stv2058
Close

Abstract
The vast majority of dwarf satellites orbiting the Milky Way and M31 are quenched, while comparable galaxies in the field are gas rich and star forming. Assuming that this dichotomy is driven by environmental quenching, we use the Exploring the Local Volume in Simulations (ELVIS) suite of N-body simulations to constrain the characteristic time-scale upon which satellites must quench following infall into the virial volumes of their hosts. The high satellite quenched fraction observed in the Local Group demands an extremely short quenching time-scale (∼2 Gyr) for dwarf satellites in the mass range M⋆ ∼ 106–108 M⊙. This quenching time-scale is significantly shorter than that required to explain the quenched fraction of more massive satellites (∼8 Gyr), both in the Local Group and in more massive host haloes, suggesting a dramatic change in the dominant satellite quenching mechanism at M⋆ ≲ 108 M⊙. Combining our work with the results of complementary analyses in the literature, we conclude that the suppression of star formation in massive satellites (M⋆ ∼ 108–1011 M⊙) is broadly consistent with being driven by starvation, such that the satellite quenching time-scale corresponds to the cold gas depletion time. Below a critical stellar mass scale of ∼108 M⊙, however, the required quenching times are much shorter than the expected cold gas depletion times. Instead, quenching must act on a time-scale comparable to the dynamical time of the host halo. We posit that ram-pressure stripping can naturally explain this behaviour, with the critical mass (of M⋆ ∼ 108 M⊙) corresponding to haloes with gravitational restoring forces that are too weak to overcome the drag force encountered when moving through an extended, hot circumgalactic medium.
1 INTRODUCTION
Foremost among the results of galaxy surveys over the last decade has been the realization that the galaxy population at z ≲ 2 is bimodal in nature (e.g. Strateva et al. 2001; Baldry et al. 2004; Bell et al. 2004; Cooper et al. 2006). That is, galaxies both locally and out to intermediate redshift are effectively described as one of two distinct types: red, early-type galaxies lacking significant star formation and blue, late-type galaxies with active star formation. In colour–magnitude space, the red galaxies populate a tight relation (often called the red sequence), while the distribution of blue galaxies is more scattered (sometimes referred to as the blue cloud). While the red and blue populations comprise approximately equal portions of the cosmic stellar mass budget at z ∼ 1, galaxies on the red sequence dominate today, following a growth in stellar mass within the red population of roughly a factor of 2 over the past 7 Gyr (Bell et al. 2004; Bundy et al. 2006; Brown et al. 2007; Faber et al. 2007). Despite uncertainty regarding the particular physical process(es) at play, the suppression (or quenching) of star formation in blue galaxies, thereby making them red, is one of the principal drivers of this dramatic growth in the number density of quiescent systems at late cosmic time.
At both low and intermediate redshift, the local environment of a galaxy is known to be well correlated with the suppression of star formation, such that passive or quiescent galaxies preferentially live in higher density environments (Balogh et al. 2004; Kauffmann et al. 2004; Blanton et al. 2005; Cooper et al. 2006, 2007, 2010b). While the stellar mass or surface mass density of a galaxy may be more closely connected to quenching for massive systems (Peng et al. 2010; Cheung et al. 2012; Woo et al. 2013), recent work has shown that environment is likely the dominant driver of quenching at the lowest mass scales (M⋆ < 109 M⊙; Geha et al. 2012). For example, studies comparing satellite galaxies to isolated field systems of similar stellar mass in the local Universe find that satellites tend to exhibit lower star formation rates (SFRs), more bulge-dominated morphologies, and older and more metal-rich stellar populations (Baldry et al. 2006; van den Bosch et al. 2008; Cooper et al. 2010a; Pasquali et al. 2010; Tollerud et al. 2011; Phillips et al. 2014). This observed suppression of star formation in satellite galaxies is commonly referred to as ‘environmental quenching’. At present, galaxy formation models fail to reproduce this environment-dependent effect in detail, with both semi-analytic and hydrodynamical models overpredicting the number of quenched satellites at low masses (Kimm et al. 2009; Weinmann et al. 2011, 2012; Hirschmann et al. 2014; Wang et al. 2014).
Understanding the physics of environmental quenching is complicated by the wide range of physical processes that could be responsible for suppressing star formation in low-mass satellites. For example, various quenching mechanisms preferentially operate on satellite galaxies within overdense environments, including (i) ‘starvation’ or ‘strangulation’ – whereby gas accretion on to a satellite galaxy is halted following infall, thus eventually eliminating the fuel for star formation (Larson, Tinsley & Caldwell 1980; Kawata & Mulchaey 2008), (ii) ‘harassment’ – by which close encounters between densely packed cluster or group members strip gas from around the interacting galaxies (Moore et al. 1996), and (iii) ‘ram-pressure stripping’ – where the cold dense gas at the centre of a satellite (or the hot halo surrounding it) is removed from the galaxy as a result of a high-speed interaction with the hot gas halo of the host (Gunn & Gott 1972; Bekki 2009).
To further complicate matters, each of these processes may be important in different host haloes and at different satellite mass scales. In an attempt to differentiate between these various physical mechanisms, we aim to measure the time-scale upon which satellite quenching occurs across a broad range of satellite stellar mass. Throughout this work, we define this quenching time-scale (τquench) relative to the time at which a satellite was accreted on to its current host system (i.e. relative to the infall time of the satellite). While quenching via starvation will proceed according to the available cold gas reservoir for star formation within an accreted satellite, ram-pressure stripping will largely act on a time-scale set by the density distribution of the host's hot halo and infall velocity of the satellite. As such, constraining the time-scale for satellite quenching may therefore serve as a critical step towards differentiating between various physical mechanisms.
By comparing satellite samples at low and intermediate redshift to galaxy and dark matter-only simulations, several recent analyses of satellites at high stellar mass (>5 × 10⁹ M⊙) point towards relatively long quenching time-scales of several Gyr or more (De Lucia et al. 2012; Wetzel et al. 2013). Remarkably, when pushing this analysis to lower masses (∼108.5–109.5 M⊙), Wheeler et al. (2014) find that quenching remains surprisingly inefficient, such that the average quenching time-scale increases to >7 Gyr. Here, we extend these previous analyses of quenching time-scales to yet lower masses by studying the satellite galaxies of the Local Group. Through comparison to simulations, we aim to establish a coherent picture of the time-scale upon which satellite quenching acts, spanning more than five orders of magnitude in satellite mass. In Section 2, we detail the population of Local Group satellites along with an estimation of the observed quenched fraction. In Sections 3 and 4, we describe the relevant N-body simulations and physically motivated quenching models, respectively, detailing the relevant constraints on the derived quenching time-scale at low masses. Finally, in Sections 5 and 6, we discuss the implications of our analysis, including a ‘back of the envelope’ explanation of the underlying physics operating on low-mass satellites and a summary of our main results.
2 LOCAL GROUP SATELLITES
In assembling our sample of Milky Way and M31 satellites, we utilize the compilation of local dwarf galaxy properties presented by McConnachie (2012). To minimize the potential impact of incompleteness at low masses, we limit our analysis to those dwarfs with measured stellar masses in the range 106–108 M⊙; however, as discussed in more detail below, including systems at lower masses has very little impact on our qualitative or quantitative results. From this population of local dwarfs, satellite systems are selected to be within 300 kpc of the Milky Way or M31 and bound with respect to their host – i.e. |$\sqrt{3} V_{\text{los}}<V_{\rm esc}(r)$|, where Vesc(r) is the escape velocity at a radial distance of r for a Navarro–Frenk–White (NFW) halo with a concentration (c) of 8 and a total halo mass of 2 × 10¹² M⊙.1 To account for potential tangential motion, we multiply all observed line-of-sight velocities from McConnachie (2012) by a factor of |$\sqrt{3}$| in evaluating whether each system is bound. Within the stellar mass range of 106–108 M⊙, Fig. 1 shows the position and velocity of all Local Group dwarfs relative to their host [or nearest massive neighbour in the case of field systems such as the Pegasus Dwarf Irregular Galaxy (Pegasus dIrr)].
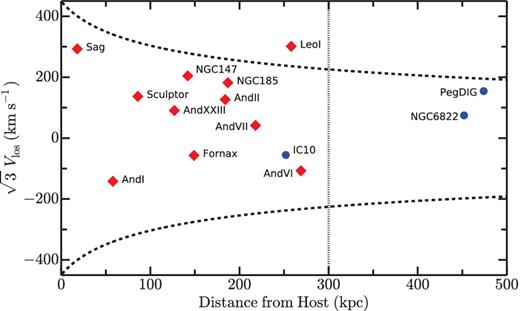
Hostcentric velocity versus distance for all known Local Group galaxies in the stellar mass range of 106–108 M⊙. To account for unknown tangential velocities, the observed line-of-sight velocities have been multiplied by a factor of |$\sqrt{3}$|. The dotted vertical line at 300 kpc corresponds to the expected virial radius of the Milky Way and M31 and represents the radial limit for our satellite selection. The dashed lines show the escape velocity for an NFW halo with a concentration (c) of 8 and a total mass of 2 × 10¹² M⊙. Satellites are colour coded as star forming (blue circles) or quenched (red diamonds) according to their observed H i gas fraction (see Fig. 2).
We identify 12 satellite systems meeting our selection criteria (see Table 1), with the final set of satellites and corresponding quenched fraction relatively independent of the adopted selection criteria. For instance, field dwarfs such as NGC 6822, Leo T, and Phoenix, which are nearly in our stellar mass limits, are located significantly beyond our radial selection limit (i.e. >400 kpc from the Milky Way). Moreover, while the observed line-of-sight velocity of Leo I suggests that it may be unbound (see Fig. 1), recent proper motion observations conclude that the system is very likely bound to the Milky Way even at a distance of more than 250 kpc (Boylan-Kolchin et al. 2013; Sohn et al. 2013). Finally, given the high metallicity and lack of overdensity in RR Lyrae stars, we categorize Canis Major as an overdensity in the Milky Way and not a satellite (Momany et al. 2004; Butler et al. 2007; Mateu et al. 2009, but see also Martínez-Delgado et al. 2005).
Observed properties of satellite galaxies in the Local Group with measured stellar masses in the range 106–108 M⊙ and located within 300 kpc of either the Milky Way or M31 (separated according to host system). Column (1): galaxy name; column (2): morphological classification; column (3): stellar mass from McConnachie (2012); column (4): atomic gas mass measurements from McConnachie (2012) and Grcevich & Putman (2009), plus upper limits from the literature (Burton & Lockman 1999; Grcevich & Putman 2009; Huang et al. 2012b; Giovanelli et al. 2013); column (5): distance from the nearest host as given by McConnachie (2012); column (6): line-of-sight velocity with respect to the host from McConnachie (2012), with the exception of And XXIII (Kirby et al. 2014); column (7): identification as quenched versus star forming, according to observed atomic gas fraction (see Fig. 2).
| Galaxy name | Morphology | M⋆ (106 M⊙) | |${M}_{\rm H\,{\small {I}}}\ (10^{6}\,{\rm M}_{{\odot }})$| | Dhost (kpc) | Vlos (km s−1) | Quenched |
|---|---|---|---|---|---|---|
| (1) | (2) | (3) | (4) | (5) | (6) | (7) |
| Milky Way | ||||||
| Sagittarius | dSph | 21 | <0.007 | 18 | 169 | Yes |
| Sculptor | dSph | 2.3 | 0.22 | 86 | 79 | Yes |
| Fornax | dSph | 20 | 0.17 | 149 | −33 | Yes |
| Leo I | dSph | 5.5 | <0.006 | 258 | 174 | Yes |
| M31 | ||||||
| And I | dSph | 3.9 | <0.35 | 58 | −82 | Yes |
| And XXIII | dSph | 1.1 | <0.1 | 127 | 52 | Yes |
| NGC 147 | dE/dSph | 62 | <0.003 | 142 | 118 | Yes |
| And II | dSph | 7.6 | <0.27 | 184 | 73 | Yes |
| NGC 185 | dE/dSph | 68 | 0.13 | 187 | 105 | Yes |
| And VII | dSph | 9.5 | <0.36 | 218 | 24 | Yes |
| IC 10 | dIrr | 86 | 50 | 252 | −32 | No |
| And VI | dSph | 2.8 | <0.015 | 269 | −62 | Yes |
To determine whether a given satellite is quenched, we use the observed H i gas fraction as a proxy for the current star SFR, defining dwarfs with atomic gas fractions less than 10 per cent to be quenched (see Fig. 2). This criterion leads to only one satellite in our sample, IC 10, categorized as currently star forming and yields a quenched fraction of >90 per cent for satellites bound to the Milky Way and M31 in the selected mass range. Alternative definitions of quenched versus star forming – e.g. using star formation histories derived from photometric observations of spatially resolved stellar populations (Weisz et al. 2014a, 2015) or SFRs inferred from Hα emission (Kaisin & Karachentsev 2013; Karachentsev & Kaisina 2013) yield similar results. Moreover, our measurement of the satellite quenched fraction is not strongly dependent on the adopted mass range, as the quenched fraction is largely unchanged if we extend the lower mass limit down to 3 × 10⁵ M⊙ so as to account for potential uncertainties or scatter in the stellar mass measurements. Over this expanded stellar mass range, the sample would then also include Leo II, And XXI, And XXV, and LGS 3. While H i measurements suggest that LGS 3 is likely star forming, a variety of observations, including SFRs inferred from Hα narrow-band imaging, indicate that Leo II, And XXI, and And XXV are quiescent (Grcevich & Putman 2009; Kaisin, Karachentsev & Ravindranath 2012; Kaisin & Karachentsev 2013; Spekkens et al. 2014; Weisz et al. 2014a,b). When including these four lower mass systems in our sample, the resulting quenched fraction remains quite high (∼87 per cent); furthermore, pushing to yet lower masses will similarly yield little variation in the quenched fraction, as the lowest mass satellites in the Local Group are universally quenched (e.g. Okamoto et al. 2008; Sand et al. 2009, 2010; Brown et al. 2014; Weisz et al. 2014a).

Observed H i gas fraction as a function of distance from the nearest host galaxy for local dwarfs included in our mass range of 106–108 M⊙. Systems with an atomic gas fraction less than 10 per cent are classified as quenched (red diamonds), with more gas-rich dwarfs identified as star forming (blue circles). At these low masses, roughly 90 per cent of satellites are quenched in the Local Group.
While our census of satellites in the Local Group is likely incomplete at low masses due to obscuration by or confusion with the disc of both the Milky Way and M31, the focus of our analysis is the relative fraction of star-forming versus quenched systems. Assuming that neither quenched nor star-forming systems preferentially reside in or behind the disc, the quenched fraction should be independent of any such incompleteness. From an analysis of the Palomar and UK Schmidt photographic plates, which cover more than 20 000 deg2 of sky at high Galactic latitude (|b| > 20°), Irwin (1994) finds that the known satellite population for the Milky Way is complete down to below our adopted mass limit (≳ 3 × 10⁵ M⊙). This conclusion is supported by deeper imaging data from the Sloan Digital Sky Survey (SDSS; York et al. 2000), Panoramic Survey Telescope and Rapid Response System (Pan-STARRS; Kaiser et al. 2010), and Dark Energy Survey (DES; Diehl et al. 2014), which cover a significant portion of the northern and southern sky and are complete to beyond the host virial radius (i.e. >300 kpc) at these stellar masses (Koposov et al. 2008, 2015; Tollerud et al. 2008; Laevens et al. 2014; Bechtol et al. 2015).
For M31, our knowledge of satellites is largely based on imaging surveys such as the Pan-Andromeda Archaeological Survey (PAndAS; McConnachie et al. 2009, see also Ferguson et al. 2002; Ibata et al. 2007; McConnachie et al. 2008). As shown by Brasseur et al. (2011), PAndAS is complete down to our mass limit within a survey footprint that covers a radial distance of roughly 150 kpc surrounding M31. While recent analysis of imaging data, including that from Pan-STARRS, has likely uncovered several new satellites of M31 at radial distances of ≳ 150 kpc (And XXX–XXXIV; Conn et al. 2012; Martin et al. 2013a,b, 2014), we exclude these systems from our study given that distances (relative to M31) are poorly constrained and potentially greater than 300 kpc. Early analysis of the stellar populations in Andromeda XXXI and XXXII, however, does suggest passive populations devoid of young stars (Martin et al. 2013a). As likely quenched satellites, we note that inclusion of And XXX–XXXIV would have little impact on the observed quenched fraction in the Local Group and thus on the results of our analysis. Moreover, while the M31 satellite population may be incomplete at radial distances of 150–300 kpc from M31, this should have minimal impact on the observed quenched fraction in the Local Group (even assuming that star-forming satellites are possibly biased towards large radial distances, as our results would imply). In Section 4, we discuss this potential selection effect in more detail.
3 SIMULATIONS
To model the evolution of satellite galaxies in the Local Group, we utilize the Exploring the Local Volume in Simulations (ELVIS) suite of 48 high-resolution, dissipationless simulations of Milky Way-like haloes (Garrison-Kimmel et al. 2014a). The suite includes 24 isolated haloes as well as 12 mass-matched Local Group-like pairs, simulated within high-resolution uncontaminated volumes spanning 2–5 Mpc in size using a particle mass of 1.9 × 10⁵ M⊙ and a Plummer-equivalent force softening of ϵ = 141 physical parsecs. Within the high-resolution volumes, the halo catalogues are complete down to Mhalo > 2 × 10⁷ M⊙, Vmax > 8 km s−1, Mpeak > 6 × 10⁷ M⊙, and Vpeak > 12 km s−1 – thus more than sufficient to track the evolution of haloes hosting Local Group dwarfs with stellar masses of >106 M⊙. ELVIS adopts a cosmological model based on Wilkinson Microwave Anisotropy Probe 7-year data (Komatsu et al. 2011), with the following Λ cold dark matter (ΛCDM) parameters: σ8 = 0.801, Ωm = 0.266, ΩΛ = 0.734, ns = 0.963, and h = 0.71.
As hosts for the Local Group dwarfs in the stellar mass range of 106–108 M⊙, we select haloes in the ELVIS simulations with masses of Mpeak = 5 × 10⁹ − 6 × 10¹⁰ M⊙, following the abundance matching prescription of Garrison-Kimmel et al. (2014a). Abundance matching, a common technique for populating simulated dark matter distributions with galaxies, assumes a one-to-one relation between a galaxy's stellar mass and the mass of its parent dark matter (sub)halo (Behroozi et al. 2013; Moster, Naab & White 2013). While this simple empirical approach to modelling galaxy formation yields great success for massive galaxies, matching a wide range of clustering statistics as a function of cosmic time (e.g. Berrier et al. 2006; Conroy, Wechsler & Kravtsov 2006), it potentially breaks down at low masses, where the most massive subhaloes of Milky Way-like simulations are inconsistent with the observed dynamics of nearby dwarf galaxies (Boylan-Kolchin, Bullock & Kaplinghat 2011, 2012; Garrison-Kimmel et al. 2014b; Kirby et al. 2014; Tollerud, Boylan-Kolchin & Bullock 2014).
While uncertainties remain in the potential efficacy or robustness of abundance matching prescriptions at low masses, our results are largely unaffected by changes in the assumed stellar mass–halo mass relation. As our fiducial model, we adopt the abundance matching relation of Garrison-Kimmel et al. (2014a), which in our stellar mass range (106–108 M⊙) yields nine subhaloes as candidate satellite hosts within a typical ELVIS parent halo (after removing stripped or disrupted subhaloes). When applying the shallower stellar mass–halo mass relation from Behroozi et al. (2013), the number of potential subhalo hosts increases accordingly, but the quantitative and qualitative results with regard to satellite quenching remain unchanged. To account for potential increased scatter in the abundance matching relation at low masses, we also mimic scatter in the Garrison-Kimmel et al. (2014a) relation, by broadening the range of halo masses associated with the observed stellar mass range, randomly selecting nine subhaloes within 2 × 10⁹ < Mpeak/M⊙ < 2 × 10¹¹ as satellite hosts. Again, while this biases the subhalo population to lower masses, our results with regard to satellite quenching remain unaffected.
Independent of the particular abundance matching prescription, we account for satellites that have been tidally stripped or disrupted – and thus not included in our observational sample – by restricting our analysis to subhaloes for which Vmax/Vpeak > 0.3, where Vmax is the current (z = 0) maximum circular velocity for the halo and Vpeak is the value of Vmax when the halo mass is at its maximum. While a halo's maximum halo mass generally occurs prior to infall (typically at >1.5Rvir), Vpeak is a good approximation for Vinfall since a halo's mass, in general, does not change appreciably prior to infall (Behroozi et al. 2014). By restricting our analysis to present-day haloes with Vmax/Vpeak > 0.3, we eliminate all subhaloes (i.e. satellites) that have lost greater than 90 per cent of their mass since infall, thereby selecting those subhaloes that are within the desired mass range and are highly likely to currently host dwarf galaxies (i.e. not disrupted or significantly stripped). Finally, we note that our results are not strongly dependent upon the adopted Vmax/Vpeak cut; applying a more conservative selection criterion (e.g. Vmax/Vpeak > 0.5) does not significantly change our results.
The ELVIS merger trees include 75 snapshots from z = 125 to 0, providing time resolution of roughly 200 Myr. As discussed in more detail in Section 4, we are interested in using ELVIS to explore models where satellite quenching occurs at a fixed physical radius from the host (e.g. within 50 kpc radially). The crossing time on such scales (∼100 kpc), however, is typically greater than the median time resolution of the snapshots, such that subhaloes would potentially pass into and back out of the quenching radius between two successive snapshots. To more precisely determine subhalo orbits within ELVIS, we map the spatial position of each subhalo (relative to its host) at 20 Myr intervals by spline interpolating the position of each subhalo and corresponding host halo across each of the 75 snapshots. This interpolation also allows us to determine the time at which each subhalo was accreted on to its host halo (i.e. the infall time or tinfall) at greater precision. Because of the linear spacing of the ELVIS snapshots with scale factor (i.e. non-linear spacing with lookback time), the difference in the measured infall time between our interpolated data and that inferred from the standard ELVIS merger trees depends upon the lookback time at which a subhalo is accreted. For systems with tinfall < 3 Gyr, which place the strongest constraints on the satellite quenching time-scale, the difference in tinfall is relatively modest, with a median offset of less than 0.5 Gyr for our fiducial sample of subhaloes.
4 QUENCHING MODELS
As highlighted in Section 1, observations of low-mass galaxies in the local Universe suggest that all isolated (or ‘field’) systems at ≲109 M⊙ are star forming. Thus, all quenching at these low masses is likely driven by environmental effects associated with dwarf galaxies being accreted on to more massive haloes, such as that of the Milky Way or M31. Two likely quenching mechanisms operating on satellite systems are starvation, where future gas accretion on to the satellite is halted following infall into a more massive host halo, and ram-pressure stripping, where the cold gas in a satellite galaxy is violently removed via interaction with the hot gas halo of the host. To mimic these respective processes, we implement two quenching models in the ELVIS simulations: (i) a ‘starvation’ model in which quenching depends only on time since infall into the host halo and (ii) a ‘stripping’ model in which quenching occurs once a satellite reaches a fixed physical distance from the host.
4.1 Starvation model
When quenching occurs via starvation, the satellite galaxy is deprived of any additional supply of cold gas after infall, such that star formation is halted following the consumption of its current gas reservoir – i.e. quenching occurs within the gas depletion time-scale (τdepl = Mgas/SFR). While observations suggest that atomic and/or molecular depletion time-scales may vary with galaxy mass (Leroy et al. 2008; Bigiel et al. 2011; Boselli et al. 2014; Somerville, Popping & Trager 2015), we adopt a fixed quenching time-scale (following infall) over the limited stellar mass range probed in our analysis (106–108 M⊙).
In the models, we define the infall time as the lookback time at which a halo first crosses the virial radius, Rvir(z), of the host. For the ∼23 per cent of subhaloes that cross the host virial radius more than once, we are likely overestimating the infall time. However, 90 per cent of these subhaloes are accreted for a final time ≳ 6 Gyr ago, thereby contributing little to no effect on the final inferred quenching time-scale. Fig. 3 shows the cumulative distribution of infall times for subhaloes selected as hosts of Local Group satellites in the simulations following various abundance matching prescriptions. Universally, we find that subhaloes are accreted relatively uniformly over cosmic time, with the vast majority infalling into their host halo >2 Gyr ago.
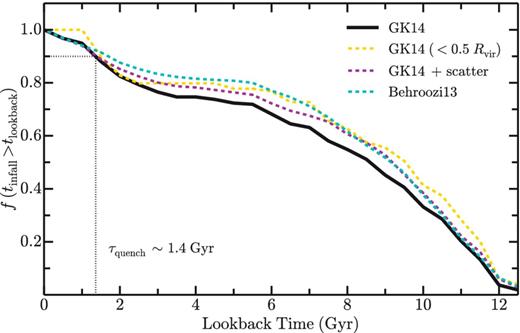
The cumulative distribution of infall times (tinfall) as a function of lookback time for those subhaloes in the ELVIS simulations identified as hosts of the Local Group satellites at 106 < M⋆/M⊙ < 108. The solid black line corresponds to our default selection criteria, where subhaloes are selected according to the abundance matching relation of Garrison-Kimmel et al. (2014a), restricting to those subhaloes with Vmax/Vpeak > 0.3 and within the host virial radius at z = 0. The dashed cyan and magenta lines show the corresponding distribution of infall times when applying alternative abundance matching prescriptions (see Section 3), while the dashed gold line traces the accretion history of only those subhaloes within 0.5Rvir at z = 0 following the Garrison-Kimmel et al. (2014a) abundance matching relation. A quenched fraction of 90 per cent today, as observed for the Local Group at these masses, corresponds to a quenching time-scale (τquench) of ∼1.4 Gyr.
As shown in Fig. 3, to match the observed satellite quenched fraction of ∼90 per cent in the Local Group, the starvation model – independent of the adopted abundance matching prescription – favours a quenching time-scale (τquench) of roughly |$1.4^{+0.9}_{-0.7}$| Gyr, including the error associated with the uncertainty in the observed Local Group quenched fraction (according to binomial statistics). Thus, on average, satellites of the Milky Way and M31 (at M⋆ ∼ 106–108 M⊙) must quench within 1.4 Gyr of infalling on to their respective host halo. Within the individual ELVIS simulations there is non-negligible scatter in the derived quenching time-scale, given the stochasticity of subhalo accretion events; assuming a quenched fraction of 90 per cent, the 1σ scatter in τquench across the 12 Local Group-like host pairs in ELVIS is approximately 0.7 Gyr.
A quenched fraction of 90 per cent in the Local Group could be dependent on completeness of the dwarf sample in this mass range, as discussed in the Introduction. This is particularly true around M31, where PAndAS imaging only surveys the volume within a radius of ∼150 kpc. To test the impact of this potential selection effect on our results, we also compute the distribution of infall times for those subhaloes that reside within 0.5Rvir today. While simulated subhaloes with earlier infall times are slightly biased towards smaller hostcentric distances (e.g. Diemand & Kuhlen 2008; Rocha, Peter & Bullock 2012; Wetzel, Deason & Garrison-Kimmel 2015a), the correlation between radial distance from the host and infall time exhibits significant scatter, such that the quenching time-scale derived from subhaloes within 0.5Rvir today is fully consistent with that based on the full sample of subhaloes within 1Rvir (see Fig. 3).
In our starvation model, it is assumed that the quenching time-scale (i.e. depletion time-scale) is independent of cosmic time. While studies at higher redshift are limited to significantly more massive systems, current work suggests that molecular depletion time-scales are relatively weakly dependent on redshift (Geach et al. 2011; Magdis et al. 2012; Bauermeister et al. 2013; Saintonge et al. 2013), favouring shorter time-scales at higher z. This conclusion is echoed in analysis of the satellite quenching time-scale across a broad range of halo masses at intermediate redshift (McGee et al. 2011; McGee, Bower & Balogh 2014; Mok et al. 2014; Muzzin et al. 2014; Bahé & McCarthy 2015). Altogether, a modest variation in the quenching time-scale with redshift would yield no significant impact on our results, as our analysis is focused on the cumulative quenched fraction today and not on the detailed quenching times of individual satellites.
4.2 Stripping model
To mimic quenching via ram-pressure stripping, we implement a model in which satellites are quenched at a fixed radial distance (Rquench) from their host. In a stripping scenario, this radial quenching scale would be set by the volume over which the host's hot halo reaches a density capable of stripping an infalling dwarf. To account for growth of the hot halo over cosmic time, we define our quenching radius, Rquench, in terms of the host's virial radius as a function of redshift (i.e. Rquench∝Rvir(z)) and require that a subhalo cross within the quenching radius at z < 3, allowing the host's hot halo time to form (Birnboim & Dekel 2003; Kereš et al. 2005; Dekel & Birnboim 2006). For subhaloes in ELVIS that have crossed within the quenching radius at z < 3, we classify the corresponding satellite as quenched; all other systems remain star forming, independent of the time spent in the host halo (i.e. independent of infall time).
Fig. 4(a) shows the dependence of the satellite quenched fraction on the adopted quenching radius (from 0.2Rvir to 1Rvir). We find that to reproduce the observed quenched fraction in the Local Group (90 per cent) requires a quenching radius of roughly 0.6Rvir, again with little dependence on the assumed abundance matching relation. Adopting this value for the quenching radius (Rquench = 0.6Rvir), we are able to determine the time at which each subhalo in the simulation (i.e. satellite) quenched following infall – and thus the quenching time-scale (measured relative to infall). In Fig. 4(b), we show the mean quenching time-scale as a function of the chosen quenching radius (Rquench) within the 48 ELVIS simulations. For large values of Rquench, each satellite – largely independent of orbit – spends little time in the host halo prior to being quenched, such that the effective quenching time-scale (τquench) is short. Adopting a quenching radius of Rquench = 0.6Rvir, we find an average quenching time-scale of 1.1 Gyr, in very good agreement with that derived from our starvation model (see Section 4.1). Finally, a complementary analysis by Slater & Bell (2014), in which quenching commences at pericentre passage, finds very similar results (τquench ∼ 1–2 Gyr; see also Weisz et al. 2015; Wetzel, Tollerud & Weisz 2015b).
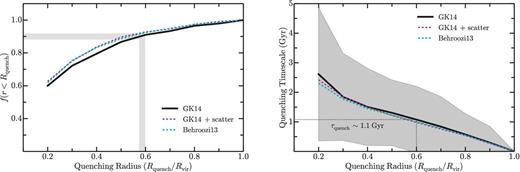
Left: the dependence of the satellite quenched fraction on the assumed quenching radius, Rquench, for our ram-pressure stripping model (see Section 4.2). The solid black and dashed cyan and magenta lines correspond to subhalo populations selected according to different abundance matching prescriptions (see Section 3). In all cases, a quenching radius of 0.6Rvir is required to reproduce a quenched fraction of 90 per cent as observed in the Local Group. Right: the dependence of the mean quenching time-scale (τquench) on the assumed quenching radius (Rquench) for the same set of abundance matching relations. For our fiducial subhalo sample, the grey shaded region illustrates the 1σ scatter in the quenching time-scale across the 48 ELVIS hosts. As for the starvation model, the high observed quenched fraction in the Local Group implies a short quenching time-scale (∼1.1 Gyr) in our ram-pressure stripping model. The typical Rvir (at z = 0) for ELVIS hosts is ∼300 kpc.
5 DISCUSSION
Given that nearly all field dwarfs are star forming at stellar masses of ≲ 109 M⊙ (Grebel 1997; Mateo 1998; Geha et al. 2012), environment-dependent processes are the dominant driver of quenching at low masses and must act on a time-scale so as to avoid over- or underproducing the number of star-forming satellite galaxies in the Local Group. Independent of the particular physical mechanism(s) at play, the high quenched fraction (∼90 per cent) observed for low-mass Local Group satellites thereby dictates a remarkably short quenching time-scale, measured relative to infall. Through a detailed comparison of the observed Milky Way and M31 satellites to the ELVIS suite of simulations, we show that this quenching time-scale (τquench) is ∼2 Gyr at stellar masses of 106–108 M⊙ in the Local Group.
A very similar analysis by Wheeler et al. (2014), in which the properties of nearby dwarfs in the SDSS are compared to the Millennium-II simulation (Boylan-Kolchin et al. 2009), finds that the quenching time-scale must be much longer (>7.5 Gyr) at slightly higher stellar masses (∼109 M⊙). This longer quenching time-scale is dictated by the relatively low quenched fractions observed in nearby groups (Geha et al. 2012). While Wheeler et al. (2014) preferentially study higher mass host haloes than that of the Milky Way and M31, analysis of the Local Group is in broad agreement. At M⋆ ∼ 108–1010 M⊙, the satellite quenched fraction in the Local Group is only ∼40 per cent (Slater & Bell 2014; Wheeler et al. 2014; Phillips et al. 2015), which requires a quenching time-scale of ∼7.8 Gyr when comparing the infall times of ELVIS subhaloes selected to have M⋆ ∼ 108.5–109.5 M⊙ according to the abundance matching relation of Garrison-Kimmel et al. (2014a).
In an effort to study quenching for the most massive satellite systems, Wetzel et al. (2013) and De Lucia et al. (2012) compare group and cluster populations from the SDSS (Yang et al. 2007) to N-body and semi-analytic models, respectively. While analysis at these masses is complicated by the fact that some isolated or field systems are quenched independent of any environment-related effects, these independent analyses conclude that the quenching time-scale at ∼1010–1011 M⊙ increases with decreasing satellite stellar mass, reaching as long as ∼5–6 Gyr (see also Hirschmann et al. 2014). Interestingly, for these most massive satellites, no evidence is found for variation in the quenching time-scale with host halo mass (Wetzel et al. 2013, but see also Phillips et al. 2015).
In Fig. 5, we combine our estimate of the quenching time-scale for low-mass satellites in the Local Group (M⋆ ∼ 107 M⊙) with the complementary constraints from Wheeler et al. (2014) and Wetzel et al. (2013) at higher stellar masses. Because of differences in the adopted definition of infall time (see discussion in Wheeler et al. 2014), we assume a quenching time-scale of 8 Gyr at 109 M⊙. This value for τquench is fully consistent with the results from Wheeler et al. (2014, τquench ∼ 7.5–9 Gyr); as previously highlighted, analysis of higher mass subhaloes in the ELVIS simulations – systems corresponding to 108.5–109.5 M⊙ following the Garrison-Kimmel et al. (2014a) abundance matching relation – yields a very similar result (τquench ∼ 7.8 Gyr; see also De Lucia et al. 2012). Altogether, we find that the quenching time-scale increases with decreasing mass at ≳ 108 M⊙, such that environmental processes are relatively inefficient in suppressing star formation at ∼109 M⊙. At lower stellar masses (≲ 108 M⊙), however, the quenching time-scale decreases dramatically, indicating a stark increase in the satellite quenching efficiency for low-mass systems. Given that all known satellites of the Milky Way and M31 are quenched below stellar masses of ∼a few × 105 M⊙, the quenching time-scale is expected to remain short to even lower masses. For the lowest mass systems (i.e. ultrafaint dwarfs) environmental quenching is likely irrelevant, as the smallest dark matter haloes may have their star formation suppressed significantly by non-environmental mechanisms like cosmic reionization (e.g. Rees 1986; Efstathiou 1992; Wyithe & Loeb 2006; Oñorbe et al. 2015).
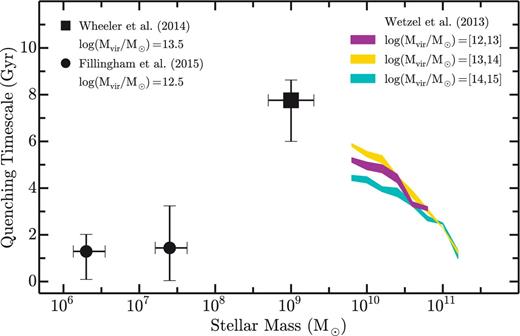
The dependence of the satellite quenching time-scale (τquench) on satellite stellar mass at M⋆ ∼ 106–1011 M⊙. The inset legend lists the typical host halo mass for each data set. The magenta, gold, and cyan coloured bands show the constraints for satellites in different mass host haloes derived from analysis of galaxy groups and clusters in the SDSS by Wetzel et al. (2013). The black square denotes the typical quenching time-scale for slightly lower mass satellites (∼109 M⊙) from Wheeler et al. (2014), with the horizontal error bars denoting the 25–75 per cent range in stellar mass probed by that work and the vertical error bars giving the variation in τquench corresponding to satellite quenched fractions of 25–55 per cent (as derived from analysis of subhalo populations in ELVIS, see Section 5). Our estimate for the low-mass satellite quenching time-scale in the Local Group is given by the black circles (τquench ∼ 1.4 Gyr, see Section 4.1), where our sample of subhaloes is divided into two stellar mass bins of 106–107 and 107–108 M⊙. Each point gives the quenching time-scale for subhaloes in that mass bin assuming a satellite quenched fraction of 90 per cent, while the vertical error bars illustrate the variation in τquench corresponding to satellite quenched fractions of 80–100 per cent. Our results are largely independent of mass, with increased scatter at higher masses due to the smaller number (and thus increased stochasticity in the infall times) of massive subhaloes. The horizontal error bars show the quartiles of the subhalo mass distribution within each bin. At high masses, the quenching time-scale increases with decreasing stellar mass. Below M⋆ ∼ 108 M⊙, we find that satellite quenching becomes dramatically more efficient, suggesting a likely change in the physical mechanisms at play.
For an infalling satellite of any mass, assumed to be isolated from subsequent gas accretion, an upper limit on the longevity of any star formation activity is set by the gas supply within the satellite upon infall – including the satellite's hot halo from which gas may cool. Processes such as ram-pressure stripping, tidal effects, and harassment would then work to diminish this gas supply, so as to accelerate the quenching process. The long quenching time-scales observed for higher mass satellites (∼108–1010 M⊙) thus favour starvation as the dominant quenching mechanism. Ignoring future accretion, recycling, or gas cooling, the duration of star formation should follow the gas depletion time-scale (τdepl = Mgas/SFR, where Mgas is the mass of a satellite's cold gas reservoir upon infall). While studies of nearby star-forming galaxies suggest that the surface density of on-going star formation is most closely tied to the dense H2 gas (Bigiel et al. 2008, 2011; Leroy et al. 2008), observed molecular depletion time-scales are much shorter than the inferred quenching time-scales. For relatively massive galaxies (M⋆ ≳ 1010 M⊙), spanning a broad range of redshift, current observations point towards molecular depletion time-scales of roughly 1–2 Gyr (Genzel et al. 2010, 2015; Tacconi et al. 2010, 2013; Bigiel et al. 2011; Saintonge et al. 2011; Leroy et al. 2013). Moreover, recent work targeting larger samples of lower mass galaxies conclude that the molecular depletion time-scale decreases with decreasing stellar mass, such that infalling satellites at 109 M⊙ should, on average, exhaust their molecular reservoirs in less than 1 Gyr (Saintonge et al. 2011; Boselli et al. 2014).
These relatively short molecular depletion time-scales are in direct conflict with the derived quenching time-scales for satellites at ∼109–1010 M⊙, which indicate that star formation typically continues for >4 Gyr after infall. Given that strong variation in star formation efficiency for H2 is disfavoured by both observations of the Kennicutt–Schmidt relation (Bigiel et al. 2008; Leroy et al. 2008; Krumholz & McKee 2005) and the bimodality of rest-frame galaxy colours (or specific SFRs; Balogh et al. 2009; Weinmann et al. 2010),2 the extended star formation in satellite galaxies seemingly must be driven by a fuel supply beyond the molecular reservoir. While gas cooling from a satellite's hot halo could replenish the fuel supply for star formation, there is little observational evidence for significant hot gas coronae around star-forming galaxies, even at the high-mass regime and especially when restricting to gas with a sufficiently short cooling time (Sun et al. 2007; Rasmussen et al. 2009; Crain et al. 2010; Miller & Bregman 2015).
On the other hand, if atomic gas is included as a potential fuel source for star formation, there may be better agreement between the expected gas depletion and satellite quenching time-scales. As previously stated, star formation is observed to follow molecular gas density more closely than atomic gas density, although the weaker correlation with H i surface density could be largely due to atomic gas spanning a broader range of densities, thus on average tracing dense star-forming clouds more poorly (Clark et al. 2012; Glover & Clark 2012a,b). As shown in Fig. 6(a), when including the atomic gas component, the inferred quenching time-scales at high stellar masses (M⋆ ≳ 108 M⊙) are in broad agreement with the measured and predicted (atomic plus molecular) gas depletion time-scales and thus consistent with a picture where satellite quenching is driven by starvation at high masses.
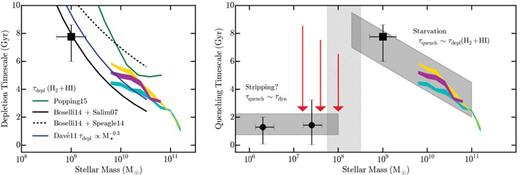
Left: the dependence of the satellite quenching time-scale (τquench) and gas depletion time-scale (τdepl) on satellite stellar mass at M⋆ ≳ 108 M⊙. The magenta, gold, and cyan coloured bands show the constraints for satellites in different mass host haloes derived from analysis of galaxy groups and clusters in the SDSS by Wetzel et al. (2013). The black square gives the typical quenching time-scale for lower mass satellites (∼108.5–109.5 M⊙) from Wheeler et al. (2014). The solid and dashed black lines show the mass dependence of the gas depletion time-scale (H2 + H i) derived from combining the observed gas fractions of Boselli et al. (2014) with the SFR–stellar mass relation of Salim et al. (2007) and Speagle et al. (2014), respectively. The solid blue and solid green lines give the corresponding predictions from the hydrodynamical and semi-empirical models of Davé, Oppenheimer & Finlator (2011) and Popping, Behroozi & Peeples (2015), respectively. The inferred satellite quenching time-scales at ≳ 108 M⊙ show broad agreement with the observed gas depletion time-scales for field systems, suggesting that starvation is the main driver of satellite quenching at these masses. Right: the dependence of the satellite quenching time-scale on satellite stellar mass at 106 < M⋆/M⊙ < 1011, including the estimates of τquench from Fig. 5. The light grey shaded regions highlight the expected dominant quenching mechanism and projected mass dependence of τquench, while the vertical hashed grey region demarcates the critical mass scale below which a more efficient physical process (e.g. ram-pressure stripping) drives relatively rapid quenching in the Local Group. At high masses (≳ 108 M⊙), satellite quenching is consistent with being driven by starvation; below ∼108 M⊙, however, we posit that ram-pressure stripping becomes increasingly effective, such that depletion (and thus quenching) time-scales are significantly shorter.
In the low-mass regime (≲ 108 M⊙), the atomic component becomes increasingly important, with observations of nearby star-forming systems finding that the typical H i gas fraction increases steadily towards lower mass (Skillman, Côté & Miller 2003; Geha et al. 2006; Leroy et al. 2008; Catinella et al. 2010; Schiminovich et al. 2010; Huang et al. 2012a). More importantly, this relative growth in atomic gas outpaces the corresponding increase in the average specific SFR (e.g. Noeske et al. 2007; Salim et al. 2007; Speagle et al. 2014), such that the gas depletion time-scale is generally long (≳ 10 Gyr) for low-mass star-forming galaxies – a result that is fully consistent with the dearth of quiescent field galaxies at <109 M⊙ (Geha et al. 2012; Oñorbe et al. 2015). In comparison to the typical quenching time-scales at low masses, however, the overabundance of atomic gas in these systems suggests that starvation alone cannot drive satellite quenching at ≲ 108 M⊙. Instead, a secondary process, such as ram-pressure stripping, is needed to remove cool gas from infalling systems, thereby decreasing the gas depletion time-scale significantly.
As observations of systems such as Leo I suggest (Sohn et al. 2013), we would expect stripping to occur as a satellite infalls from Rvir towards pericentre, such that quenching at low masses would proceed according to the dynamical time (τdyn), which is roughly 1–2 Gyr for a Milky Way-like halo today (e.g. Stewart et al. 2009). While a detailed analysis of the efficacy of ram-pressure stripping (or other quenching mechanisms such as tidal forces) is beyond the scope of this work (see Fillingham et al., in preparation), Fig. 6(b) presents a qualitative depiction of the potential physical processes at play, where satellite quenching is primarily driven by starvation at higher masses (≳ 108 M⊙ for the Local Group) while ram-pressure stripping becomes increasingly effective below a critical mass scale of ∼108 M⊙, yielding shorter quenching time-scales and high observed quenched fractions. In this qualitative picture, we expect that ram-pressure stripping (or some other efficient quenching mechanism) plays a critical role in suppressing star formation down to the mass scales at which reionization inhibits gas accretion and therefore star formation (perhaps, M⋆ ∼ 104 M⊙; Brown et al. 2014; Oñorbe et al. 2015; Wheeler et al. 2015). Applying this qualitative picture to higher mass host haloes (e.g. rich groups and clusters), the critical scale at which ram-pressure stripping becomes effective should move to higher satellite masses due to the increased density of the host's hot halo in concert with higher infall velocities for the satellites.
6 SUMMARY
Comparing observations of the Local Group satellite population to corresponding high-resolution N-body simulations from the ELVIS suite, we investigate the typical time-scale (following infall) upon which star formation is suppressed in low-mass (<108 M⊙) satellite galaxies. When combining our work with complementary analyses of higher mass satellite populations, we present a comprehensive picture of satellite quenching spanning roughly five orders of magnitude in stellar mass. Our principal results are as follows.
To reproduce the high fraction of quenched low-mass satellites in the Local Group, the typical quenching time-scale at M⋆ ∼ 106–108 M⊙ must be relatively short (τquench ∼ 2 Gyr).
The longer quenching time-scales inferred for higher mass satellites are roughly consistent with the observed cold gas (H2 plus H i) depletion time-scales in corresponding field systems; this suggests that satellite quenching is largely driven by starvation at M⋆ ≳ 108 M⊙.
At low masses (M⋆ ≲ 108 M⊙), the much shorter satellite quenching time-scales are potentially set by ram-pressure stripping or some other process that removes the cold gas reservoirs in infalling systems, such that nearly all low-mass satellites in the Local Group (or more massive host haloes) are quenched.
If ram-pressure stripping is responsible for increasing the satellite quenching efficiency at low masses (M⋆ ≲ 108 M⊙) within the Local Group, we expect that this critical quenching scale will shift to higher satellite masses in higher mass host haloes (e.g. rich groups and clusters) due to the increased density of the host's hot halo in concert with higher infall velocities for the satellites.
We have suggested here that the transition to rapid quenching in the smallest satellites (M⋆ ≲ 108 M⊙) is potentially explained as a ram-pressure scale (see Fig. 6 and Fillingham et al., in preparation). Above this scale, satellite quenching occurs on a gas depletion time, as accreted galaxies are starved of fresh fuel for star formation. Below this scale, a more rapid, drag-induced stripping becomes dominant, such that the gravitational restoring force of lower mass dark matter haloes can no longer retain cool gas against the fluid pressure they experience while in orbit around a larger host.
The idea that Local Group dwarfs are quenched via ram pressure has been around for some time (e.g. Einasto et al. 1974; Lin & Faber 1983; Blitz & Robishaw 2000) but the evidence for very rapid quenching provided here adds further argument in its favour, and identifies a characteristic mass scale where it may become dominant. Underlying this hypothesis is the notion that the Milky Way and M31 both harbour extended (∼150 kpc) reservoirs of hot baryons with sufficient density to strip small galaxies of their gas. There is evidence that M31 does indeed host an extended circumgalactic medium (Lehner, Howk & Wakker 2015), and X-ray studies are consistent with this possibility around the Milky Way (Fang, Bullock & Boylan-Kolchin 2013; Fang et al. 2015; Miller & Bregman 2015). If extended low-density coronae of this kind are common around ∼L★ galaxies, then they may prove important for understanding the baryon cycle and the global census of baryons in the Universe.
Of course, one shortcoming of our analysis is that we have restricted ourselves to satellites of M31 and the Milky Way. Given completeness issues, the Local Group is a reasonable starting point, but it remains possible that satellites in our vicinity are unusually quenched, perhaps owing to an uncommonly dense distribution of hot baryons in our vicinity, or atypically early infall times for the Local Group satellite population. On-going efforts to discover and characterize dwarf satellite systems around other massive hosts will be important for solidifying the existence of a sharp transition scale at M⋆ ≲ 108 M⊙, where satellite quenching appears to become extremely efficient in the Local Group. If future studies reveal that the Local Group is indeed typical, then pinpointing the origin of this quenching scale and testing the ram-pressure hypothesis will be of utmost importance.
We thank Nicolas Martin and Andrew Wetzel for helpful discussions regarding this work. We also thank the anonymous referee for useful comments which helped clarify our work. CW and JSB were supported by NSF grants AST-1009973 and AST-1009999. Support for this work was provided by NASA through a Hubble Space Telescope theory grant (program AR-12836) from the Space Telescope Science Institute (STScI), which is operated by the Association of Universities for Research in Astronomy (AURA), Inc., under NASA contract NAS5-26555. This research made use of astropy, a community-developed core python package for astronomy (Astropy Collaboration et al. 2013). Additionally, the python packages NumPy (van der Walt, Colbert & Varoquaux 2011), iPython (Pérez & Granger 2007), SciPy (Jones et al. 2001), and matplotlib (Hunter 2007) were utilized for the majority of our data analysis and presentation.
Varying the adopted host halo mass and concentration (and thus our satellite selection limits) does not have a significant effect on our final sample of Local Group satellites.
While a reduction in the star formation efficiency for satellites would yield longer depletion (and thus quenching) time-scales, it would also lead to overproducing galaxies in the ‘green valley’.
REFERENCES
