


Abstract
SN 2013dy is a Type Ia supernova (SN Ia) for which we have compiled an extraordinary data set spanning from 0.1 to ∼ 500 d after explosion. We present 10 epochs of ultraviolet (UV) through near-infrared (NIR) spectra with Hubble Space Telescope/Space Telescope Imaging Spectrograph, 47 epochs of optical spectra (15 of them having high resolution), and more than 500 photometric observations in the BVrRiIZYJH bands. SN 2013dy has a broad and slowly declining light curve (Δm15(B) = 0.92 mag), shallow |$\mathrm{Si}\,\small {II}\,\lambda 6355$| absorption, and a low velocity gradient. We detect strong C ii in our earliest spectra, probing unburned progenitor material in the outermost layers of the SN ejecta, but this feature fades within a few days. The UV continuum of SN 2013dy, which is strongly affected by the metal abundance of the progenitor star, suggests that SN 2013dy had a relatively high-metallicity progenitor. Examining one of the largest single set of high-resolution spectra for an SN Ia, we find no evidence of variable absorption from circumstellar material. Combining our UV spectra, NIR photometry, and high-cadence optical photometry, we construct a bolometric light curve, showing that SN 2013dy had a maximum luminosity of |$10.0^{+4.8}_{-3.8} \times 10^{42}$| erg s−1. We compare the synthetic light curves and spectra of several models to SN 2013dy, finding that SN 2013dy is in good agreement with a solar-metallicity W7 model.
INTRODUCTION
Type Ia supernovae (SNe Ia) are important distance indicators. Observations of SNe Ia provided the first evidence of the accelerating expansion of the universe (Riess et al. 1998; Perlmutter et al. 1999). Observational evidence indicates that they are the result of the thermonuclear explosion of an accreting carbon–oxygen white dwarf star in a close binary system (e.g. Hillebrandt & Niemeyer 2000; Hillebrandt et al. 2013; Maoz, Mannucci & Nelemans 2014). Although recent observations have constrained the exploding star to be consistent with a compact object (Nugent et al. 2011; Bloom et al. 2012), the nature of the presumed companion star is not yet clear.
Some explosion mechanisms have been proposed to explain the observations of SNe Ia. For a review of explosion models, see Hillebrandt & Niemeyer (2000) and Hillebrandt et al. (2013). A pure deflagration model that results from a subsonic deflagration flame can produce intermediate-mass elements, but it fails to synthesize enough iron-group elements (IGEs) to meet the constraints of normal SNe Ia. However, a pure deflagration may explain some subclasses of thermonuclear explosions (Phillips et al. 2007; Foley et al. 2013; Kromer et al. 2013; Fink et al. 2014). To create more IGEs, a model in which a supersonic detonation follows the deflagration (the so-called delayed-detonation model) is proposed. This model produces more IGEs and better explains normal SNe Ia than the pure deflagration model (e.g. Sim et al. 2013).
Statistical studies using a large sample of SNe Ia can be useful in understanding the physical properties of SN Ia explosions and progenitor systems. However, a well-studied single SN Ia with complete and high-quality observations can provide highly constraining information as well. Recent SNe Ia with extensive data sets include SNe 2009ig (Foley et al. 2012a; Marion et al. 2013), 2011fe (e.g. Li et al. 2011; Nugent et al. 2011; Bloom et al. 2012), 2012cg (Silverman et al. 2012b), 2012fr (Childress et al. 2013a), and 2014J (e.g. Amanullah et al. 2014; Foley et al. 2014; Goobar et al. 2014; Zheng et al. 2014; Marion et al. 2015). These SNe Ia are all very close (D ≤ 20 Mpc), which allows for comprehensive data sets including observations at non-optical wavelengths and extremely late time data, and discovered soon after explosion, which provides information about the outermost layers of the ejecta. For each of these nearby SNe Ia, large follow-up campaigns were initiated. These high-quality data sets have resulted in some of the most important constraints for the progenitor systems and explosions of SNe Ia (e.g. progenitor metallicity; Mazzali et al. 2014).
One of the most critical pieces of information one can obtain for an SN Ia is a series of ultraviolet (UV) spectra. Theoretical studies show that the metallicity of the progenitor can significantly impact both the photometric and spectroscopic properties of SNe Ia (Hoeflich, Wheeler & Thielemann 1998; Lentz et al. 2000; Timmes, Brown & Truran 2003; Kasen, Röpke & Woosley 2009; Walker et al. 2012), but has little effect on optical and near-infrared (NIR) spectral properties. While progenitor metallicity does not affect the shape of the optical spectral energy distribution (SED), the optical spectral features, or the light-curve shape (Hoeflich et al. 1998; Lentz et al. 2000; Podsiadlowski et al. 2006), it is expected to affect the amount of 56Ni generated in the explosion and thus the peak luminosity (Timmes et al. 2003). A different peak luminosity for SNe Ia with the same light-curve shape could introduce a large systematic bias in cosmological distance estimates, especially if the average progenitor metallicity evolves with redshift.
While observations of SN environments indicate that metallicity could subtly affect observables (Gallagher et al. 2005; D'Andrea et al. 2011; Stanishev et al. 2012; Childress et al. 2013b; Johansson et al. 2013; Pan et al. 2014), the most powerful and indicative constraints have come from analyses of UV spectra. Foley & Kirshner (2013) examined the UV spectra of the ‘twin’ SNe 2011by and 2011fe, which had nearly identical optical SEDs, optical colours, and optical light-curve shapes. However, their UV spectra differed significantly, such that the progenitor of SN 2011by had a higher metallicity than that of SN 2011fe. Intriguingly, their peak luminosities differed in a way that one would predict based on the progenitor metallicity differences; however, some or all of this difference may be caused by an incorrect distance to SN 2011by (Graham et al. 2015a). Regardless of the distance to SN 2011by, this represents the first robust detection of different metallicities for SN Ia progenitors. Additional direct analyses of UV spectral time series have placed constraints on SN Ia progenitor metallicity (Hachinger et al. 2013; Mazzali et al. 2014).
In this work, we present a multiwavelength analysis of SN 2013dy, an SN Ia known to have the earliest detection (∼2.4 h after the first light; Zheng et al. 2013). In addition to high-cadence optical and NIR light curves, over 30 low-resolution optical spectra, and one of the largest set of high-resolution optical spectra of an SN Ia, our data set includes 10 UV spectra observed with the Hubble Space Telescope (HST). We use this high-quality data set that spans epochs from ∼ 0.1 to 500 d after the explosion to constrain the properties of the explosion and progenitor system for SN 2013dy.
This paper is organized as follows. In Section 2, we present the photometric and spectroscopic observations of SN 2013dy. In Sections 3 and 4, we present the photometric and spectroscopic properties of SN 2013dy, respectively. We compare models to our data in Section 5 and summarize our findings in Section 6. Throughout this paper, we assume H0 = 70 km s−1 Mpc−1 and a flat universe with ΩM = 0.3.
OBSERVATIONS
SN 2013dy was discovered in NGC 7250 (D = 13.7 Mpc; Tully et al. 2009) on 2013 July 10.46 (ut dates are used throughout this paper) and classified as a young SN Ia (Casper et al. 2013). Radio observations taken ∼ 1 week after maximum brightness resulted in non-detections (Perez-Torres et al. 2013).
Zheng et al. (2013) obtained early-time photometry of SN 2013dy starting ∼ 0.1 d after explosion. These data constrained the progenitor star to be a compact object (R0 ≤ 0.25 R⊙). Their earliest spectrum had very strong C ii lines, tracing the unburned material in the outer ejecta. We combine the photometric and spectroscopic data from Zheng et al. (2013) with our own data presented below. All of the data will be made available in the WISeREP archive (Yaron & Gal-Yam 2012).
Photometry
We obtained broad-band BVRI photometry of SN 2013dy with the 0.76 m Katzman Automatic Imaging Telescope (KAIT; Filippenko et al. 2001). The multiband images were observed with the KAIT4 filter set from −16 d to +337 d relative to B-band maximum (MJD = 56501.105). The data were reduced using our image-reduction pipeline (Ganeshalingam et al. 2010). The point spread function photometry was performed using doaphot (Stetson 1987). The SN instrumental magnitudes were calibrated to nearby Sloan Digital Sky Survey (SDSS) standard stars and transformed into the Landolt system. Details about the KAIT photometry are provided by Zheng et al. (2013). In Table 1, we list the KAIT photometry used in this work.
KAIT photometry of SN 2013dy.
| MJD | B | V | R | I |
|---|---|---|---|---|
| (mag) | (mag) | (mag) | (mag) | |
| 56484.42 | 16.76 ± 0.04 | 16.41 ± 0.03 | 16.17 ± 0.03 | 16.07 ± 0.04 |
| 56485.46 | 16.21 ± 0.03 | 15.84 ± 0.03 | 15.60 ± 0.03 | 15.46 ± 0.03 |
| 56486.45 | 15.77 ± 0.07 | 15.37 ± 0.05 | 15.17 ± 0.03 | 15.03 ± 0.03 |
| 56487.38 | 15.33 ± 0.03 | 14.96 ± 0.02 | 14.74 ± 0.02 | 14.62 ± 0.02 |
| 56488.40 | 14.88 ± 0.03 | 14.56 ± 0.03 | 14.34 ± 0.03 | 14.23 ± 0.04 |
| 56489.37 | 14.55 ± 0.03 | 14.24 ± 0.03 | 14.02 ± 0.03 | 13.91 ± 0.04 |
| 56490.43 | 14.24 ± 0.02 | 13.95 ± 0.02 | 13.72 ± 0.02 | 13.63 ± 0.02 |
| 56491.40 | 14.04 ± 0.03 | 13.74 ± 0.02 | 13.53 ± 0.03 | 13.44 ± 0.04 |
| 56492.39 | 13.86 ± 0.03 | 13.57 ± 0.03 | 13.35 ± 0.03 | 13.29 ± 0.03 |
| 56493.40 | 13.73 ± 0.06 | 13.42 ± 0.04 | 13.22 ± 0.03 | 13.17 ± 0.04 |
| 56494.41 | 13.61 ± 0.03 | 13.31 ± 0.03 | 13.11 ± 0.03 | 13.07 ± 0.03 |
| 56496.32 | 13.46 ± 0.05 | 13.15 ± 0.03 | 12.98 ± 0.02 | 12.97 ± 0.02 |
| 56497.41 | 13.37 ± 0.03 | 13.06 ± 0.02 | 12.93 ± 0.02 | 12.95 ± 0.03 |
| 56498.38 | 13.33 ± 0.03 | 13.03 ± 0.02 | 12.90 ± 0.02 | 12.96 ± 0.02 |
| 56499.38 | 13.33 ± 0.07 | 12.99 ± 0.05 | 12.87 ± 0.06 | 12.96 ± 0.06 |
| 56500.45 | 13.28 ± 0.03 | 12.96 ± 0.03 | 12.83 ± 0.03 | 12.97 ± 0.03 |
| 56501.39 | 13.30 ± 0.03 | 12.96 ± 0.03 | 12.84 ± 0.03 | 13.00 ± 0.04 |
| 56502.35 | 13.30 ± 0.03 | 12.96 ± 0.03 | 12.83 ± 0.03 | 13.02 ± 0.03 |
| 56503.30 | 13.33 ± 0.03 | 12.96 ± 0.03 | 12.84 ± 0.03 | 13.06 ± 0.03 |
| 56504.35 | 13.37 ± 0.03 | 12.98 ± 0.03 | 12.84 ± 0.03 | 13.09 ± 0.03 |
| 56505.34 | 13.40 ± 0.03 | 13.00 ± 0.02 | 12.88 ± 0.02 | 13.14 ± 0.02 |
| 56506.35 | 13.44 ± 0.02 | 13.03 ± 0.02 | 12.90 ± 0.02 | 13.19 ± 0.02 |
| 56507.33 | 13.50 ± 0.04 | 13.07 ± 0.03 | 12.93 ± 0.04 | 13.24 ± 0.04 |
| 56508.33 | 13.54 ± 0.02 | 13.09 ± 0.02 | 12.99 ± 0.02 | 13.30 ± 0.03 |
| 56509.34 | 13.59 ± 0.03 | 13.13 ± 0.03 | 13.05 ± 0.03 | 13.38 ± 0.03 |
| 56510.34 | 13.66 ± 0.03 | 13.18 ± 0.02 | 13.11 ± 0.03 | 13.43 ± 0.03 |
| 56511.31 | 13.73 ± 0.03 | 13.21 ± 0.02 | 13.15 ± 0.02 | 13.48 ± 0.02 |
| 56512.31 | 13.82 ± 0.03 | 13.30 ± 0.02 | 13.26 ± 0.03 | 13.59 ± 0.03 |
| 56513.32 | 13.90 ± 0.03 | 13.34 ± 0.03 | 13.33 ± 0.02 | 13.64 ± 0.03 |
| 56514.32 | 14.01 ± 0.03 | 13.42 ± 0.03 | 13.39 ± 0.03 | 13.69 ± 0.04 |
| 56516.33 | 14.19 ± 0.03 | 13.54 ± 0.03 | 13.50 ± 0.03 | 13.73 ± 0.03 |
| 56517.32 | 14.30 ± 0.04 | 13.60 ± 0.03 | 13.54 ± 0.03 | 13.72 ± 0.03 |
| 56518.36 | 14.39 ± 0.03 | 13.65 ± 0.02 | 13.56 ± 0.02 | 13.72 ± 0.02 |
| 56519.31 | 14.51 ± 0.03 | 13.72 ± 0.03 | 13.60 ± 0.02 | 13.72 ± 0.02 |
| 56520.34 | 14.60 ± 0.03 | 13.75 ± 0.03 | 13.59 ± 0.02 | 13.66 ± 0.03 |
| 56521.41 | 14.74 ± 0.15 | 13.80 ± 0.11 | 13.60 ± 0.06 | 13.62 ± 0.08 |
| 56522.33 | 14.80 ± 0.03 | 13.86 ± 0.02 | 13.63 ± 0.02 | 13.64 ± 0.02 |
| 56523.25 | 14.90 ± 0.03 | 13.89 ± 0.02 | 13.64 ± 0.02 | 13.62 ± 0.02 |
| 56524.31 | 14.96 ± 0.07 | 13.95 ± 0.05 | 13.64 ± 0.05 | 13.57 ± 0.04 |
| 56525.29 | 15.07 ± 0.04 | 13.99 ± 0.03 | 13.68 ± 0.03 | 13.58 ± 0.03 |
| 56527.35 | 15.24 ± 0.04 | 14.09 ± 0.03 | 13.71 ± 0.03 | 13.56 ± 0.03 |
| 56528.36 | 15.32 ± 0.03 | 14.12 ± 0.02 | 13.72 ± 0.03 | 13.54 ± 0.03 |
| 56529.33 | 15.40 ± 0.03 | 14.15 ± 0.03 | 13.74 ± 0.03 | 13.51 ± 0.03 |
| 56530.33 | 15.48 ± 0.03 | 14.22 ± 0.02 | 13.78 ± 0.02 | 13.52 ± 0.03 |
| 56531.32 | 15.54 ± 0.03 | 14.25 ± 0.03 | 13.79 ± 0.03 | 13.50 ± 0.03 |
| 56532.35 | 15.62 ± 0.03 | 14.31 ± 0.02 | 13.84 ± 0.02 | 13.51 ± 0.02 |
| 56533.30 | 15.67 ± 0.03 | 14.35 ± 0.03 | 13.87 ± 0.03 | 13.51 ± 0.03 |
| 56534.31 | 15.73 ± 0.03 | 14.41 ± 0.02 | 13.93 ± 0.02 | 13.55 ± 0.02 |
| 56535.28 | 15.80 ± 0.03 | 14.46 ± 0.02 | 13.98 ± 0.02 | 13.57 ± 0.03 |
| 56536.26 | 15.85 ± 0.03 | 14.50 ± 0.02 | 14.02 ± 0.02 | 13.58 ± 0.03 |
| 56537.29 | – | 14.63 ± 0.10 | – | – |
| 56538.28 | – | 14.76 ± 0.12 | 14.09 ± 0.15 | 13.63 ± 0.09 |
| 56539.28 | 16.01 ± 0.03 | 14.69 ± 0.03 | 14.21 ± 0.03 | 13.79 ± 0.03 |
| 56540.29 | 16.00 ± 0.03 | 14.70 ± 0.02 | 14.25 ± 0.02 | 13.85 ± 0.02 |
| 56541.26 | 16.04 ± 0.04 | 14.77 ± 0.03 | 14.34 ± 0.03 | 13.93 ± 0.03 |
| 56542.28 | 16.10 ± 0.03 | 14.83 ± 0.02 | 14.38 ± 0.02 | 13.99 ± 0.02 |
| 56543.26 | 16.13 ± 0.03 | 14.86 ± 0.02 | 14.43 ± 0.02 | 14.04 ± 0.03 |
| 56544.24 | 16.17 ± 0.03 | 14.90 ± 0.03 | 14.47 ± 0.03 | 14.10 ± 0.03 |
| 56545.26 | 16.20 ± 0.04 | 14.94 ± 0.02 | 14.54 ± 0.02 | 14.18 ± 0.02 |
| 56546.26 | 16.19 ± 0.04 | 14.97 ± 0.02 | 14.56 ± 0.03 | 14.22 ± 0.03 |
| 56548.24 | 16.24 ± 0.03 | 15.03 ± 0.02 | 14.64 ± 0.02 | 14.33 ± 0.02 |
| 56551.26 | 16.28 ± 0.04 | 15.13 ± 0.03 | 14.75 ± 0.03 | 14.48 ± 0.03 |
| 56553.24 | 16.38 ± 0.06 | 15.21 ± 0.03 | 14.84 ± 0.02 | 14.60 ± 0.03 |
| 56555.27 | 16.34 ± 0.05 | 15.23 ± 0.03 | 14.88 ± 0.03 | 14.67 ± 0.03 |
| 56558.23 | 16.41 ± 0.04 | 15.32 ± 0.02 | 14.98 ± 0.02 | 14.82 ± 0.03 |
| 56561.23 | 16.49 ± 0.04 | 15.41 ± 0.02 | 15.09 ± 0.02 | 14.98 ± 0.02 |
| 56563.22 | 16.45 ± 0.03 | 15.44 ± 0.02 | 15.14 ± 0.03 | 15.04 ± 0.03 |
| 56565.22 | 16.49 ± 0.03 | 15.50 ± 0.03 | 15.21 ± 0.03 | 15.13 ± 0.03 |
| 56567.23 | 16.54 ± 0.06 | 15.60 ± 0.03 | 15.28 ± 0.03 | 15.23 ± 0.04 |
| 56569.19 | 16.56 ± 0.05 | 15.61 ± 0.03 | 15.37 ± 0.02 | 15.35 ± 0.03 |
| 56571.20 | 16.58 ± 0.04 | 15.67 ± 0.03 | 15.39 ± 0.03 | 15.40 ± 0.03 |
| 56573.20 | 16.59 ± 0.05 | 15.70 ± 0.03 | 15.45 ± 0.03 | 15.49 ± 0.04 |
| 56575.21 | 16.68 ± 0.05 | 15.79 ± 0.02 | 15.52 ± 0.02 | 15.60 ± 0.03 |
| 56577.20 | 16.64 ± 0.04 | 15.81 ± 0.03 | 15.56 ± 0.03 | 15.66 ± 0.03 |
| 56579.18 | 16.69 ± 0.05 | 15.89 ± 0.03 | 15.63 ± 0.03 | 15.73 ± 0.03 |
| 56581.18 | 16.73 ± 0.06 | 15.93 ± 0.03 | 15.71 ± 0.03 | 15.84 ± 0.04 |
| 56583.19 | 16.79 ± 0.07 | 15.96 ± 0.03 | 15.75 ± 0.03 | 15.89 ± 0.04 |
| 56585.19 | 16.81 ± 0.06 | 16.00 ± 0.03 | 15.82 ± 0.03 | 15.98 ± 0.03 |
| 56587.18 | 16.82 ± 0.04 | 16.08 ± 0.04 | 15.88 ± 0.03 | 16.05 ± 0.04 |
| 56589.18 | 16.88 ± 0.04 | 16.11 ± 0.03 | 15.93 ± 0.03 | 16.13 ± 0.04 |
| 56592.16 | 16.91 ± 0.05 | 16.19 ± 0.04 | 16.01 ± 0.03 | 16.24 ± 0.03 |
| 56596.19 | 17.07 ± 0.05 | 16.28 ± 0.03 | 16.15 ± 0.03 | 16.41 ± 0.04 |
| 56598.14 | 17.00 ± 0.04 | 16.32 ± 0.03 | 16.19 ± 0.03 | 16.48 ± 0.04 |
| 56600.14 | 17.02 ± 0.16 | 16.40 ± 0.12 | 16.24 ± 0.21 | 16.88 ± 0.14 |
| 56602.13 | 17.04 ± 0.04 | 16.42 ± 0.03 | 16.32 ± 0.03 | 16.57 ± 0.04 |
| 56604.13 | 17.08 ± 0.05 | 16.49 ± 0.03 | 16.38 ± 0.03 | 16.69 ± 0.05 |
| 56606.13 | 17.14 ± 0.05 | 16.52 ± 0.04 | 16.43 ± 0.04 | 16.73 ± 0.05 |
| 56609.12 | 17.14 ± 0.07 | 16.56 ± 0.04 | 16.49 ± 0.05 | 16.73 ± 0.06 |
| 56614.14 | 17.19 ± 0.09 | 16.65 ± 0.06 | 16.61 ± 0.05 | 16.88 ± 0.10 |
| 56618.09 | 17.29 ± 0.08 | 16.78 ± 0.04 | 16.78 ± 0.04 | 17.11 ± 0.08 |
| 56639.13 | 17.67 ± 0.02 | 17.15 ± 0.02 | 17.33 ± 0.02 | 17.47 ± 0.04 |
| 56642.13 | 17.73 ± 0.06 | 17.24 ± 0.03 | 17.53 ± 0.08 | 17.55 ± 0.09 |
| 56644.10 | – | 17.39 ± 0.12 | 17.46 ± 0.13 | – |
| 56646.07 | – | 17.35 ± 0.10 | 17.45 ± 0.09 | – |
| 56647.10 | 17.84 ± 0.14 | 17.38 ± 0.08 | 17.65 ± 0.11 | – |
| 56656.11 | 17.92 ± 0.10 | 17.58 ± 0.07 | 17.75 ± 0.07 | 18.00 ± 0.13 |
| 56665.11 | 18.13 ± 0.13 | 17.73 ± 0.08 | 17.92 ± 0.13 | 18.20 ± 0.18 |
| 56665.12 | 18.10 ± 0.03 | 17.65 ± 0.04 | 18.02 ± 0.05 | 17.97 ± 0.09 |
| 56667.15 | 18.13 ± 0.10 | 17.69 ± 0.06 | – | – |
| 56675.12 | 18.20 ± 0.02 | 17.77 ± 0.02 | 18.15 ± 0.03 | 18.12 ± 0.05 |
| 56676.10 | 18.29 ± 0.25 | 17.85 ± 0.15 | 18.04 ± 0.18 | 18.43 ± 0.37 |
| 56678.11 | 18.26 ± 0.02 | 17.82 ± 0.02 | 18.24 ± 0.03 | 18.13 ± 0.06 |
| 56789.46 | 20.21 ± 0.28 | – | – | – |
| 56838.39 | 20.84 ± 0.24 | 20.22 ± 0.19 | 21.13 ± 0.59 | 20.03 ± 0.28 |
We also obtained riZYJH photometry of SN 2013dy with the multichannel Reionization And Transients InfraRed camera (RATIR; Butler et al. 2012) mounted on the 1.5 m Johnson telescope at the Mexican Observatorio Astronoḿico Nacional on Sierra San Pedro Mártir in Baja California, México (Watson et al. 2012). Typical observations include a series of 80 s exposures in the ri bands and 60 s exposures in the ZYJH bands, with dithering between exposures. RATIR's fixed IR filters cover half of their respective detectors, automatically providing off-target IR sky exposures while the target is observed in the neighbouring filter. Master IR sky frames are created from a median stack of off-target images in each IR filter. No off-target sky frames were obtained on the optical CCDs, but the small galaxy size and sufficient dithering allowed for a sky frame to be created from a median stack of all the images in each filter. Flat-field frames consist of evening sky exposures. Given the lack of a cold shutter in RATIR's design, IR dark frames are not available. Laboratory testing, however, confirms that the dark current is negligible in both IR detectors (Fox et al. 2012).
The RATIR data were reduced, co-added, and analysed using standard CCD and IR processing techniques in idl and python, utilizing the online astrometry programs SExtractor and swarp1 (see Foley et al. 2014, and references therein). Calibration was performed using field stars with reported fluxes in both 2MASS (Skrutskie et al. 2006) and the SDSS Data Release 9 catalogue (Ahn et al. 2012). Table 2 lists the RATIR photometry. In Fig. 1, we present both the KAIT and RATIR light curves and the best-fitting template light curves (see Section 3.1).
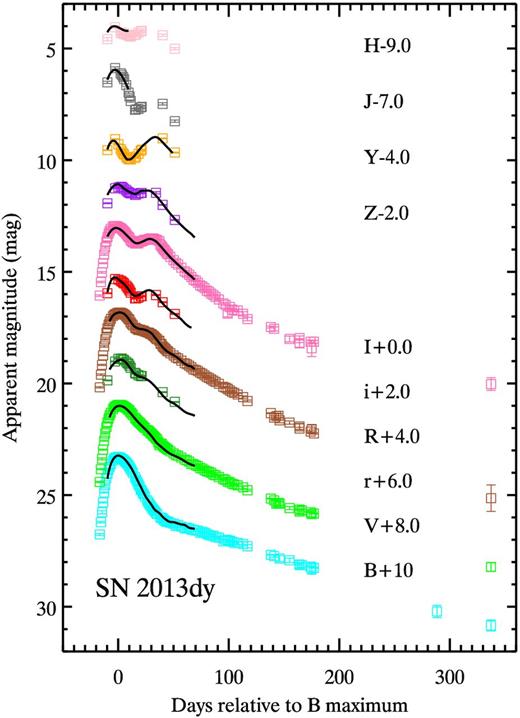
The KAIT BVRI and RATIR riZYJH light curves of SN 2013dy. The solid lines represent the best fit (from snoopy) to the observed light curves.
RATIR photometry of SN 2013dy.
| MJD | r | i | Z | Y | J | H |
|---|---|---|---|---|---|---|
| (mag) | (mag) | (mag) | (mag) | (mag) | (mag) | |
| 56491.30 | 13.86 ± 0.02 | 13.96 ± 0.02 | 13.93 ± 0.02 | 14.15 ± 0.02 | 14.43 ± 0.05 | 14.93 ± 0.07 |
| 56498.28 | 13.01 ± 0.02 | 13.32 ± 0.02 | 13.26 ± 0.02 | 13.66 ± 0.02 | 13.79 ± 0.05 | 14.39 ± 0.07 |
| 56501.27 | 12.89 ± 0.02 | 13.35 ± 0.02 | 13.22 ± 0.02 | 13.89 ± 0.02 | – | – |
| 56503.30 | 12.90 ± 0.02 | 13.40 ± 0.02 | 13.18 ± 0.02 | 14.10 ± 0.02 | 14.02 ± 0.05 | 14.64 ± 0.07 |
| 56504.33 | 12.88 ± 0.02 | 13.44 ± 0.02 | 13.20 ± 0.02 | 14.20 ± 0.02 | 14.09 ± 0.05 | 14.63 ± 0.07 |
| 56505.45 | 12.93 ± 0.02 | 13.48 ± 0.02 | 13.24 ± 0.02 | 14.29 ± 0.02 | 14.19 ± 0.05 | 14.69 ± 0.07 |
| 56506.45 | 12.95 ± 0.02 | 13.52 ± 0.02 | 13.29 ± 0.02 | 14.35 ± 0.02 | 14.28 ± 0.05 | 14.68 ± 0.07 |
| 56508.32 | 13.03 ± 0.02 | 13.62 ± 0.02 | 13.34 ± 0.02 | 14.45 ± 0.02 | 14.55 ± 0.05 | 14.73 ± 0.07 |
| 56509.44 | 13.09 ± 0.02 | 13.69 ± 0.02 | 13.40 ± 0.02 | 14.51 ± 0.02 | – | – |
| 56510.43 | 13.12 ± 0.02 | 13.76 ± 0.02 | 13.44 ± 0.02 | 14.54 ± 0.02 | 14.89 ± 0.05 | 14.76 ± 0.07 |
| 56511.35 | 13.21 ± 0.02 | 13.83 ± 0.02 | 13.46 ± 0.02 | 14.57 ± 0.02 | 15.05 ± 0.05 | 14.79 ± 0.07 |
| 56512.39 | 13.30 ± 0.02 | 13.93 ± 0.02 | 13.49 ± 0.02 | 14.57 ± 0.02 | 15.26 ± 0.05 | 14.81 ± 0.05 |
| 56516.26 | 13.53 ± 0.02 | 14.19 ± 0.02 | 13.55 ± 0.02 | 14.49 ± 0.02 | 15.66 ± 0.05 | 14.74 ± 0.05 |
| 56517.24 | 13.56 ± 0.02 | 14.19 ± 0.02 | 13.54 ± 0.02 | 14.44 ± 0.02 | 15.64 ± 0.05 | 14.72 ± 0.05 |
| 56519.47 | 13.63 ± 0.02 | 14.15 ± 0.02 | 13.49 ± 0.02 | 14.31 ± 0.02 | 15.62 ± 0.05 | 14.63 ± 0.05 |
| 56521.42 | 13.66 ± 0.02 | 14.10 ± 0.02 | 13.47 ± 0.02 | 14.17 ± 0.02 | 15.55 ± 0.05 | 14.57 ± 0.05 |
| 56522.30 | 13.67 ± 0.02 | 14.09 ± 0.02 | 13.47 ± 0.02 | 14.12 ± 0.02 | 15.53 ± 0.05 | 14.55 ± 0.05 |
| 56535.30 | – | 14.04 ± 0.02 | 13.46 ± 0.05 | – | – | – |
| 56541.30 | 14.39 ± 0.02 | 14.36 ± 0.02 | 14.00 ± 0.02 | 13.62 ± 0.02 | 15.39 ± 0.05 | 14.75 ± 0.05 |
| 56545.30 | – | – | – | – | – | – |
| 56552.30 | 14.82 ± 0.02 | 14.89 ± 0.02 | 14.68 ± 0.02 | 14.25 ± 0.02 | 16.17 ± 0.05 | 15.35 ± 0.05 |
Spectroscopy
As part of our follow-up campaign, we obtained a series of low-resolution near-UV (NUV) through NIR spectra with HST, as well as low- and high-resolution optical spectra from a variety of sources.
We procured 10 epochs of NUV through NIR spectroscopy with the Space Telescope Imaging Spectrograph (STIS) on HST. For each epoch, we obtained data with three different setups to cover the entire wavelength range: the NUV Multi-Anode Microchannel Array (MAMA) detector with the G230L grating, the CCD detector with the G430L grating, and the CCD detector with the G750L grating. Combined, the three setups have a wavelength range of 1600–10 230 Å. The HST data were reduced using the standard Space Telescope Science Data Analysis System (stsdas) routines, including bias subtraction, flat-fielding, wavelength calibration, and flux calibration (Foley et al. 2012b). The HST observations correspond to phases ranging from −7 to +21 d relative to B-band maximum brightness. A log of our HST spectroscopic observations is presented in Table 3, and the spectra are shown in Fig. 2.
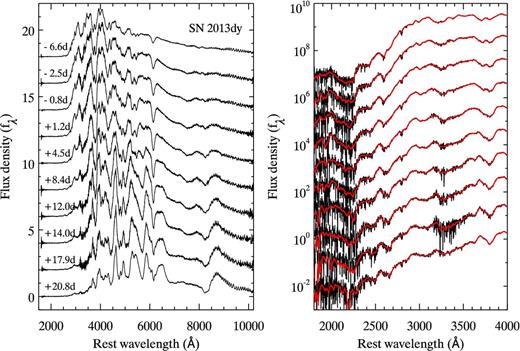
Left: spectra of SN 2013dy taken with HST/STIS, with arbitrary vertical offsets for clarity. Right: same as the left-hand panel, but a closer look at the UV region. The spectra smoothed with a Savitzky–Golay filter (Savitzky & Golay 1964) are shown as red curves.
Log of HST spectroscopic observations of SN 2013dy.
| Date | Phase | Exposure time | ||
|---|---|---|---|---|
| (MJD) | (d) | (s) | ||
| G230L | G420L | G750L | ||
| 56494.48 | −6.6 | 3618 | 336 | 336 |
| 56498.60 | −2.5 | 1382 | 64 | 64 |
| 56500.32 | −0.8 | 1382 | 64 | 64 |
| 56502.31 | +1.2 | 1382 | 64 | 64 |
| 56505.57 | +4.5 | 1382 | 64 | 64 |
| 56509.49 | +8.4 | 1382 | 64 | 64 |
| 56513.09 | +12.0 | 1382 | 64 | 64 |
| 56515.14 | +14.0 | 1382 | 64 | 64 |
| 56518.99 | +17.9 | 1382 | 64 | 64 |
| 56521.91 | +20.8 | 3618 | 336 | 336 |
In addition to the HST spectroscopy, we obtained 32 optical spectra of SN 2013dy with phases of −16 to +480 d relative to B-band maximum brightness with a variety of ground-based facilities. The eight earliest spectra in the data set were already studied by Zheng et al. (2013), but are included in our analysis for completeness. The new spectra (24 of the 32 total) were observed with the Low Resolution Imaging Spectrometer (LRIS; Oke et al. 1995) mounted on the 10 m Keck-I telescope, the DEep Imaging Multi-Object Spectrograph (DEIMOS; Faber et al. 2003) on the 10 m Keck-II telescope, the Kast Spectrograph (Miller & Stone 1993) on the Lick Observatory 3 m Shane telescope, and the Low-Resolution Spectrograph (LRS; Hill et al. 1998) on the 9.2 m Hobby–Eberly Telescope (HET).
Standard CCD processing and spectrum extraction were accomplished with iraf. The data were extracted using the optimal algorithm of Horne (1986). Low-order polynomial fits to calibration-lamp spectra were used to establish the wavelength scale, and small adjustments derived from night-sky lines in the object frames were applied. We employed our own idl routines to flux calibrate the data and remove telluric lines using the well-exposed continua of the spectrophotometric standard stars (Wade & Horne 1988; Foley et al. 2003). Details of our spectroscopic reduction techniques are described by Silverman et al. (2012a). A log of spectroscopic observations is presented in Table 4. The complete spectral sequence can be found in Fig. 3.
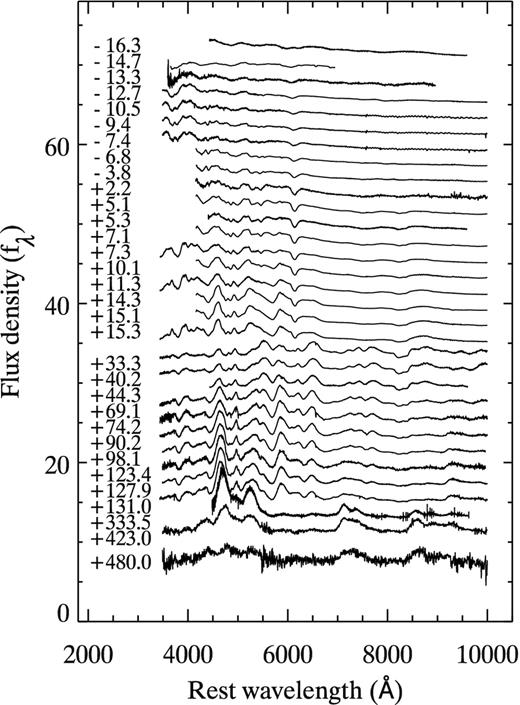
The optical spectra of SN 2013dy.
Log of low-resolution optical spectroscopic observations of SN 2013dy.
| Date | Phase | Instrument | Exp. time |
|---|---|---|---|
| (MJD) | (d) | (s) | |
| 56497.28 | −3.8 | HET/LRS | 380 |
| 56503.26 | +2.2 | HET/LRS | 577 |
| 56506.24 | +5.1 | HET/LRS | 100 |
| 56506.44 | +5.3 | Keck/DEIMOS | 60 |
| 56508.22 | +7.1 | HET/LRS | 260 |
| 56508.41 | +7.3 | Lick/Kast | 360 |
| 56511.21 | +10.1 | HET/LRS | 400 |
| 56512.41 | +11.3 | Lick/Kast | 360 |
| 56515.45 | +14.3 | HET/LRS | 200 |
| 56516.20 | +15.1 | HET/LRS | 200 |
| 56516.41 | +15.3 | Lick/Kast | 360 |
| 56534.42 | +33.3 | Lick/Kast | 180 |
| 56541.32 | +40.2 | Lick/Kast | 180 |
| 56545.36 | +44.3 | Keck/DEIMOS | 300 |
| 56570.23 | +69.1 | Lick/Kast | 450 |
| 56575.26 | +74.1 | Lick/Kast | 450 |
| 56591.33 | +90.2 | Lick/Kast | 900 |
| 56599.24 | +98.1 | Lick/Kast | 1800 |
| 56624.24 | +123.1 | Lick/Kast | 1800 |
| 56629.22 | +127.9 | Keck/LRIS | 350 |
| 56632.12 | +131.0 | Lick/Kast | 1800 |
| 56834.58 | +333.5 | Keck/DEIMOS | 2400 |
| 56924.34 | +423.0 | Keck/LRIS | 1000 |
| 56981.32 | +480.0 | Keck/LRIS | 1000 |
We also observed SN 2013dy with various high-resolution spectrographs on 15 different occasions spanning a phase range of −10 to +19 d. This corresponds to a mean (and median) cadence of 2 d, with the largest gap between spectra being 5 d. The high-resolution spectra were obtained with the Tillinghast Reflector Echelle Spectrograph (TRES) mounted on the 1.5 m Tillinghast telescope, the High Efficiency and Resolution Mercator Echelle Spectrograph (HERMES; Raskin et al. 2011) on the 1.2 m Mercator Telescope, the High-Resolution Spectrograph (HRS; Tull 1998) on the HET, the Ultraviolet and Visual Echelle Spectrograph (UVES; Dekker et al. 2000) on the Very Large Telescope (VLT), the High Resolution Echelle Spectrometer (HRES; Vogt et al. 1994) on the Keck-I telescope, and the High Accuracy Radial velocity Planet Searcher (HARPS-N; Cosentino et al. 2012) on the Telescope Nationale Galileo (TNG). These data represent one of the largest single sets of high-resolution spectra of an SN Ia.2 The spectra have resolutions ranging from ∼30 000 to 115 000. A log of observations is given in Table 5. The spectra were reduced with standard procedures (e.g. Sternberg et al. 2014, and references therein) including telluric correction. For a subset of the observations, we observed standard stars to determine the telluric absorption in the SN 2013dy spectra; for the remaining spectra, we produced synthetic telluric spectra (Smette et al. 2015). We used B-splines to fit the continuum and normalize the spectra.
Log of high-resolution observations of SN 2013dy.
| Date | Phase | Instrument | TExp. | Resolution |
|---|---|---|---|---|
| (MJD) | (d) | (s) | ||
| 56491.42 | −9.7 | Tillinghast/TRES | 2831 | 30 000 |
| 56494.09 | −7.0 | Mercator/HERMES | 3600 | 85 000 |
| 56494.26 | −6.8 | HET/HRS | 1000 | 33 600 |
| 56495.13 | −6.0 | Mercator/HERMES | 3600 | 85 000 |
| 56497.26 | −3.8 | HET/HRS | 1000 | 33 600 |
| 56502.23 | +1.1 | VLT/UVES | 600 | 40 000 |
| 56504.25 | +3.1 | HET/HRS | 1000 | 33 600 |
| 56505.05 | +3.9 | Mercator/HERMES | 2700 | 85 000 |
| 56506.61 | +5.5 | Keck/HIRES | 300 | 48 000 |
| 56511.06 | +10.0 | Mercator/HERMES | 2700 | 85 000 |
| 56513.22 | +12.1 | HET/HRS | 1200 | 33 600 |
| 56515.97 | +14.9 | TNG/HARPS | 1800 | 115 000 |
| 56516.20 | +15.1 | HET/HRS | 1200 | 33 600 |
| 56519.08 | +18.0 | Mercator/HERMES | 3600 | 85 000 |
| 56520.07 | +19.0 | Mercator/HERMES | 3600 | 85 000 |
PHOTOMETRIC ANALYSIS
In this section, we analyse the SN 2013dy photometry. We fit the light curves, deriving estimates of the host-galaxy reddening and extinction, examine the colour evolution, and construct a bolometric light curve. Using broad-band photometry of the host galaxy, we derive host parameters including stellar mass (Mstellar) and star formation rate (SFR).
Light-curve fitting
We fit the SN 2013dy BVrRiIZYJH light curves simultaneously with snoopy (Burns et al. 2011). snoopy is a python-based light-curve fitter, extending the method of Prieto, Rest & Suntzeff (2006). The decline-rate parameter, Δm15 (similar to Δm15(B) defined by Phillips 1993, corresponding to the B-band decline 15 d after maximum brightness), is used to parametrize the SN light-curve shape in snoopy. Given that our data sets were observed with different photometric systems, we provide snoopy with corresponding filter functions and photometric zero-points to perform K- and S-corrections. We adopted the default ‘EBV model’ in snoopy to fit the light curves, which is described in detail below. The fitting results in measurements of Δm15, time of B-band maximum brightness, distance modulus (DM) and the host-galaxy reddening E(B − V)host.
For the EBV model, a B-band peak absolute magnitude (MB) as well as the colours are assumed based on the value of Δm15. Six different calibrations are provided in the model. The parameters of these calibrations were derived by Folatelli et al. (2010) to minimize the Phillips relation (MB versus Δm15; Phillips 1993) using different subsets of the training SN sample, with different RV determined (or fixed) for each calibration.
We tested all six available calibrations and found that calibration #2 (see table 9 in Folatelli et al. 2010) with the EBV model, which corresponds to RV = 3.1, produces the best fit of the SN 2013dy light curves (in terms of χ2, with |$\chi ^2_{\nu } = 2.93$|). We adopted this setup when fitting the light curves. The results of the light-curve fitting are shown in Table 6. The light-curve fitting with different reddening models gives consistent Δm15, but lower E(B − V)host for those with low RV (E(B − V)host = 0.16 and 0.18 mag for RV = 1.46 and 1.01, respectively). This leads to a lower extinction measurement compared to that derived from an RV = 3.1 reddening model. However, the low-RV models produce much poorer fits to the light curves, especially in the NIR, than RV = 3.1. The setup with RV = 3.1 is still strongly preferred for SN 2013dy even if we only fit the BVRI light curves (where the data were better sampled). Previous studies have found that a low RV value is preferred for some highly reddened SNe Ia (e.g. Krisciunas et al. 2006; Wang et al. 2008). On the other hand, we find that the dust reddening of SN 2013dy is much more likely to have a ‘high’ value of RV (RV ≈ 3.1) than it is a ‘low’ value (RV < 2). For the rest of the study, we therefore use the EBV–RV = 3.1 model for our primary results, but examine how the conclusions change with a lower value of RV when appropriate.
Results of snoopy light-curve fitting for SN 2013dya.
| Tmax | Bmax | Δm15 | DM | E(B − V)host |
|---|---|---|---|---|
| (MJD) | (mag) | (mag) | (mag) | (mag) |
| 56501.105 | 13.229 ± 0.010 | 0.886 ± 0.006 | 31.488 ± 0.010 | 0.206 ± 0.005 |
| Tmax | Bmax | Δm15 | DM | E(B − V)host |
|---|---|---|---|---|
| (MJD) | (mag) | (mag) | (mag) | (mag) |
| 56501.105 | 13.229 ± 0.010 | 0.886 ± 0.006 | 31.488 ± 0.010 | 0.206 ± 0.005 |
aThe statistical uncertainties of the measurements are generated by Monte Carlo simulations.
snoopy measures a decline-rate parameter Δm15 = 0.89. This template-derived Δm15 is similar to the conventional B-band decline rate Δm15(B), but with some systematic differences. Using the relation provided by Burns et al. (2011), we calculate a B-band decline rate Δm15(B) = 0.92 mag. This indicates that SN 2013dy has a relatively slower decline rate, compared to the normal SN Ia like SN 2011fe (Δm15(B) ≈ 1.1 mag; Munari et al. 2013), but is similar to another slow decliner SN 1991T (Δm15(B) ≈ 0.94 mag; Hamuy et al. 1996).
The host-galaxy reddening, E(B − V)host = 0.206 ± 0.005 mag measured by snoopy, is similar to that measured by Zheng et al. (2013, E(B − V)host = 0.15 mag) using the equivalent width (EW) of the |$\mathrm{Na}\,\small {I}$|D absorption as a proxy for reddening. We adopt our value and the Cardelli, Clayton & Mathis (1989) reddening law throughout the analyses in this work. Our best-fitting reddening corresponds to a host-galaxy visual extinction of AV, host = 0.64 ± 0.02 mag. For the Milky Way reddening, we adopt E(B − V)MW = 0.14 mag (Schlegel, Finkbeiner & Davis 1998; Schlafly & Finkbeiner 2011) and RV = 3.1.
snoopy also determines a distance modulus DM = 31.49 mag. This gives a luminosity distance of 19.84 Mpc for SN 2013dy, which is much greater than the Tully–Fisher distance to NGC 7250 of 13.7 ± 3.0 Mpc (Tully et al. 2009). However, the distance in snoopy is derived by fitting the SN light curves, so any parameters that affect the light-curve properties (e.g. metallicity) could also affect the distance. Given that the purpose of this work is to investigate how these parameters could affect the SN properties, it would be important that we use an SN-independent distance in the analysis. Accordingly, we adopt the Tully–Fisher distance to NGC 7250 throughout this work.
Colour curves
The dereddened colour curves of SN 2013dy are shown in Figs 4 and 5. For comparison, we also display the colour curves of SN 2011fe and the Hsiao et al. (2007) templates. The Hsiao et al. (2007) colour curves are shifted to match SN 2013dy at maximum brightness. For SN 2011fe, we adopted the BVRI and JHK photometry studied by Richmond & Smith (2012) and Matheson et al. (2012), respectively. Here the dereddened colour curves of SN 2011fe are directly compared without applying any shifts.
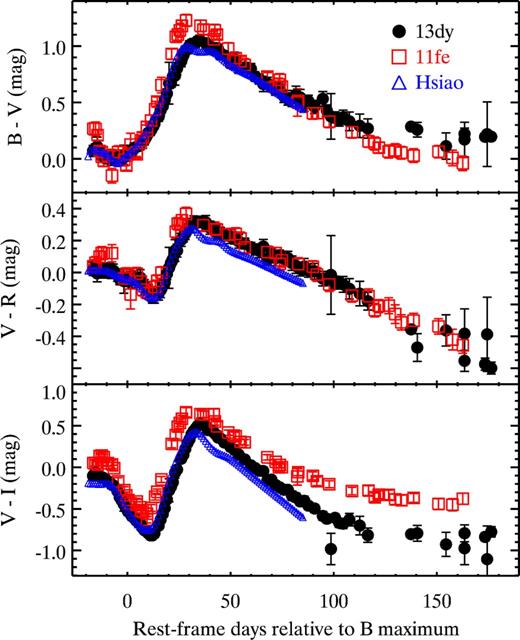
The colour curves of SN 2013dy. From top to bottom: the B − V, V − R, and V − I colour as the function of phase. The filled circles are the data in this work. The colour curves from SN 2011fe (red open squares) and the Hsiao et al. (2007) templates (blue open triangles) are compared.
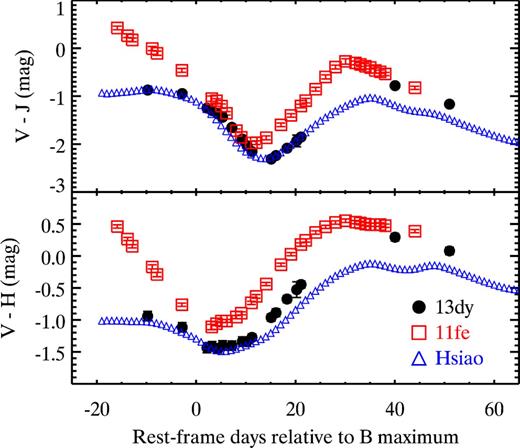
The same as Fig. 4, but using V − J and V − H colour instead.
We find that after dereddening by our adopted reddening parameters, the SN 2013dy and SN 2011fe B − V and V − R colour curves are generally consistent. However, SN 2013dy is slightly bluer (weighted-mean Δ(B − V) = −0.07 ± 0.01 mag and Δ(V − R) = −0.06 ± 0.01 mag) than SN 2011fe at early phases (t ≤ 30 d). The colour curves of SN 2013dy also peak at later times (Δt ≈ 3 d for B − V) and have shallower slopes at later phases (t ≳ 30 d) than SN 2011fe. Burns et al. (2014) showed that the time of B − V maximum is strongly correlated with Δm15(B), with faster declining SNe Ia having earlier B − V maxima and steeper late-time B − V slopes than SNe Ia with slower decline rates. Given that SN 2013dy is a slower decliner (Δm15(B) = 0.9 mag) than SN 2011fe (Δm15(B) ≈ 1.1 mag), our results are consistent with the predicted trends.
The colour curves of SNe 2011fe and 2013dy have larger differences at longer wavelengths. We find that SN 2013dy is bluer than SN 2011fe in V − I at all epochs. The same trends are also found for the V − J and V − H colours, with even greater differences. Finally, relative to SN 2011fe, SN 2013dy has much less pre-maximum V − J and V − H colour evolution.
The colour curves of the Hsiao et al. (2007) templates are generally similar to SN 2013dy at early times. However, they fail to reproduce the trends at t ≳ 30 d, where the templates are bluer than SN 2013dy.
Bolometric light curve
With our exquisite optical/NIR photometry and multi-epoch UV spectroscopy, we are able to construct a pseudo-bolometric light curve which covers 1600–18 000 Å, which covers essentially the entire SN emission. Since the amount of light beyond these wavelengths is likely a very small fraction of all emission, we will refer to the pseudo-bolometric light curve as a ‘bolometric’ light curve, but recognize that there may be small differences with the true bolometric light curve. For all measurements, we correct for Milky Way and host-galaxy reddening, using the parameters derived in Section 3.1.
The KAIT BVRI optical light curves, which cover ∼ 3400–9700 Å, cover phases from −17 to +340 d. Because of the high cadence of the KAIT observations, we do not use the RATIR ri light curves to construct the bolometric light curve. Integrating the total flux through all filters, we construct a BVRI optical light curve. While the bulk of the SN emission is in the optical, a significant amount of light is emitted in the UV and NIR.
Using the 10 epochs of HST spectroscopy (covering phases of −6.6 to +20.8 d), we can construct a UV light curve covering ∼1600–3400 Å. The UV flux is calculated by integrating the SN spectrum from 1600 Å to the effective wavelength of the B band at that particular epoch. For the 10 epochs with UV spectra, we determine the total UV+optical flux and the corresponding fraction of light emitted in the UV. Linearly interpolating the fraction of UV light, we estimate the fraction of light emitted in the UV for all epochs of the BVRI optical light curve between the first and last epochs of UV spectroscopy.
An NIR light curve was constructed using the YJH RATIR light curves. These data cover ∼9700–18 000 Å. We did not include the RATIR Z-band photometry since a large portion of the filter overlaps with the KAIT I band. The NIR light curve was generated using a procedure similar to that of the optical light curve. Since our data set does not cover the flux in the K band, we assume a linear decline from the H-band effective wavelength to zero flux at 18 000 Å. Similar to what was done for the UV light curve, the fraction of the NIR flux in the optical+NIR light curve is calculated. Again, linearly interpolating the NIR fraction, the corresponding NIR flux at each individual epoch of the optical light curve (for those in the phase range covered by the NIR photometry) is determined.
The final UVOIR bolometric light curve was generated by combining the optical light curve with the fraction of light determined to be emitted at UV and NIR wavelengths. The result is shown in the left-hand panel of Fig. 6. Note that the bolometric light curve in this work is only valid from t ≈ −10 to +22 d, the phases where both HST UV spectroscopy and RATIR NIR photometry are available.
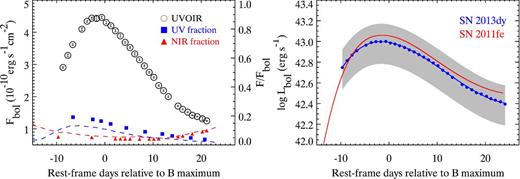
Left: the UVOIR bolometric flux of SN 2013dy (open circles). The UV flux fractions determined by HST UV spectroscopy are represented by blue filled squares. The NIR flux fractions determined by RATIR NIR spectroscopy are represented by red filled triangles. The blue and red dashed lines represent the UV and NIR flux fractions of SN 2011fe (Pereira et al. 2013), respectively. Right: the same as the left-hand panel, but using bolometric luminosity instead. The UVOIR bolometric luminosity of SN 2013dy is shown as blue filled circles. Here the luminosity distance determined using the Tully–Fisher relation (13.7 ± 3.0 Mpc; Tully et al. 2009) is adopted. The blue curve represents the B-spline fit to the data. The grey area shows the 1σ range of the bolometric luminosities considering the uncertainties from the distance. The bolometric luminosity of SN 2011fe from Pereira et al. (2013) is overplotted (red curve).
Fig. 6 also presents the fraction of the total light emitted in the UV and NIR. We find that the UV contribution peaks at the earliest epochs, with 19 per cent of the bolometric light being emitted at UV wavelengths at t ≈ −10 d. The fraction of light emitted in the UV declines steeply, becoming only 4 per cent of the total at +21 d.
The NIR fraction shows a different evolution from the UV fraction, being 6 per cent of all light at −10 d, dropping to a minimum of 4 per cent at +10 d, and then increasing to 10 per cent at +21 d. The NIR contribution overtakes that of the UV at ∼ +15 d.
For comparison, we also show the fractions calculated for SN 2011fe (Pereira et al. 2013). The overall trend of the UV fraction decreasing and the NIR fraction increasing with time also occurs for SN 2011fe. However, SN 2013dy emits more light in the UV and less light in the NIR than SN 2011fe at all phases. At its peak, SN 2011fe emitted 13 per cent of its light in the UV (compared to 19 per cent for SN 2013dy). At +20 d, the UV fraction for both SNe is similar (2 and 4 per cent for SNe 2011fe and 2013dy, respectively). This trend of more UV emission for SN 2013dy with diminishing difference with time is also seen directly in the UV spectra (see Section 4.3). For SN 2011fe, the NIR contributes 9 per cent of the total light at −10 d, decreasing some to be 5 per cent at +10 d, and then increasing to 10 per cent at +20 d, again making SNe 2011fe and 2013dy be similar at the later phases.
The bolometric luminosity of SN 2013dy is shown in the right-hand panel of Fig. 6. Here, we use the Tully–Fisher distance to NGC 7250 (13.7 ± 3.0 Mpc; Tully et al. 2009). Fitting a B-spline to the bolometric light curve, we derive a peak bolometric luminosity of |$L_{\rm bol, peak} = 10.0^{+4.8}_{-3.8} \times 10^{42}$| erg s−1, where the uncertainty in the peak bolometric luminosity is dominated by the uncertainty in the distance to SN 2013dy. If the distance derived in snoopy (19.8 Mpc; see Section 3.1) is adopted, we derive a peak bolometric luminosity of Lbol, peak = 2.09 × 1043 erg s−1, which is ∼2 times larger than that derived from the Tully–Fisher distance.
We calculate Δm15 from the bolometric light curve by fitting the light curve with a B-spline. We find that SN 2013dy has bolometric Δm15 = 0.98 mag, which is larger than its B-band decline rate Δm15(B). Using the same method, we determine Δm15 = 0.99 mag for SN 2011fe. This suggests that SN 2013dy and SN 2011fe have nearly identical bolometric decline rates. Zheng et al. (2013) determined a rise time (here the rise time is defined as the time elapsed from first light to B-band maximum brightness) of ∼17.7 d for SN 2013dy. This value is consistent with that of SN 2011fe (17.6 d; Firth et al. 2015), and close to the average of normal SNe Ia (17.4 d; Hayden et al. 2010). We find there is hint that SN 2013dy is likely to have longer rise time than SN 2011fe based on the bolometric light curves from t ∼ −10 d to maximum brightness. However, the bolometric rise time of SN 2013dy is difficult to constrain directly from the bolometric light curve due to the lack of UV and NIR observations in early times. Using the time of first light derived by Zheng et al. (2013), we find a bolometric rise time for SN 2013dy of ∼16.47 d. Assuming that the Tully–Fisher distance of NGC 7250 is correct, this will result in an 56Ni mass estimate of ∼ 0.44 M⊙ for SN 2013dy, using equation 6 of Stritzinger & Leibundgut (2005).
Host galaxy
The host galaxy of SN 2013dy, NGC 7250, is a blue, late-type (likely between Sc and Im) galaxy. Using SDSS ugriz photometry (Ahn et al. 2014) of NGC 7250 (listed in Table 7), we derive physical parameters for the host galaxy. The details of the procedure are described by Pan et al. (2014). Here we briefly summarize the process.
The host-galaxy photometry used in this work.
| SDSS u | SDSS g | SDSS r | SDSS i | SDSS z |
|---|---|---|---|---|
| (mag) | (mag) | (mag) | (mag) | (mag) |
| 13.225(4) | 12.654(2) | 12.352(2) | 12.635(2) | 12.390(4) |
| SDSS u | SDSS g | SDSS r | SDSS i | SDSS z |
|---|---|---|---|---|
| (mag) | (mag) | (mag) | (mag) | (mag) |
| 13.225(4) | 12.654(2) | 12.352(2) | 12.635(2) | 12.390(4) |
The host-galaxy stellar mass (Mstellar) and SFR are determined using the photometric redshift code z-peg (Le Borgne & Rocca-Volmerange 2002). z-peg fits the observed colour of the galaxies with galaxy SEDs from nine different spectral types (SB, Im, Sd, Sc, Sbc, Sb, Sa, S0, and E). We correct for Milky Way extinction, and allow for a further foreground dust screen varying from E(B − V) = 0 to 0.2 mag in steps of 0.02 mag. A Salpeter (1955) initial mass function is assumed.
The best-fitting Mstellar and SFR determined by z-peg are log (M/M⊙) = 8.67 and 0.55 M⊙ yr− 1, respectively. This indicates that NGC 7250 has a relatively low Mstellar (e.g. the Milky Way has log (M/M⊙) = 10.79; Flynn et al. 2006). Based on the mass–metallicity relation derived by Tremonti et al. (2004), we inferred the gas-phase metallicity of NGC 7250 to be 12 + log (O/H) = 8.49. This value is well below the solar value (8.69; Allende Prieto, Lambert & Asplund 2001), but only slightly larger than the metallicity of the Large Magellanic Cloud (8.40; Garnett 1999). Spectroscopic observations are necessary to precisely constrain the metallicity of the host galaxy. Using the Mstellar derived above, we can then determine the SFR relative to the underlying galaxy stellar mass, which is called specific SFR (sSFR), the SFR per unit Mstellar (Guzman et al. 1997). Expressing sSFR in units of yr−1, this gives log sSFR = -8.92 for NGC 7250, which is a particularly large value (the Milky Way has log sSFR = -10.18; Diehl et al. 2006) and provides evidence that there are strong star-forming regions in the host galaxy. A summary of the z-peg results is given in Table 8.
Summary of host-galaxy parameters derived by z-peg.
| Lower limit | Best | Upper limit | ||
|---|---|---|---|---|
| log Mstellar | (M⊙) | 8.48 | 8.67 | 8.84 |
| log SFR | (M⊙ yr− 1) | −0.47 | −0.26 | −0.06 |
| log sSFR | (yr− 1) | −8.94 | −8.92 | −8.90 |
| Lower limit | Best | Upper limit | ||
|---|---|---|---|---|
| log Mstellar | (M⊙) | 8.48 | 8.67 | 8.84 |
| log SFR | (M⊙ yr− 1) | −0.47 | −0.26 | −0.06 |
| log sSFR | (yr− 1) | −8.94 | −8.92 | −8.90 |
SPECTROSCOPIC ANALYSIS
In this section, we analyse the spectroscopic data. We measure pseudo-equivalent widths (pEWs) and velocities of key spectral features in the UV, optical, and NIR, and study their temporal evolution. The variations of narrow absorption features are also examined. We investigate the spectral properties of SN 2013dy by comparing them with those of a large sample of SNe Ia.
Photospheric optical spectroscopy
The well-observed spectral sequence of SN 2013dy makes it an ideal target to study individual spectral features and their temporal evolution. Using the method outlined by Maguire et al. (2014) and Pan et al. (2015), we measured several spectral features. The key features of interest are the pEWs and velocities of the |$\mathrm{O}\,\small {I}$| triplet, C ii λλ6580, 7234, Si ii λλ6355, 5972, 4130, and the |$\mathrm{Ca}\,\small {II}$| NIR triplet. Here we measured |$\mathrm{Ca}\,\small {II}$| NIR instead of |$\mathrm{Ca}\,\small {II}$| H&K since it provides us cleaner measurements of |$\mathrm{Ca}\,\small {II}$| velocity and pEW without contamination from other features (Foley 2013; Childress et al. 2014; Maguire et al. 2014). In Fig. 7, we show examples of our photospheric spectra with the relevant spectral features marked. Here we are able to decompose the high-velocity feature (HVF) and photospheric velocity feature (PVF) in the |$\mathrm{Ca}\,\small {II}$| NIR triplet (see Fig. 8 for examples).
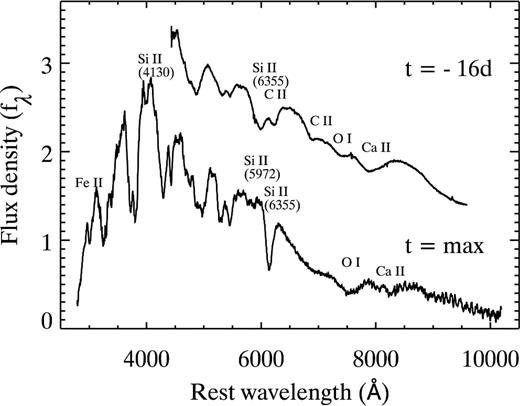
Spectra at t = −16 and +0 d demonstrating the key spectral features measured in this work.
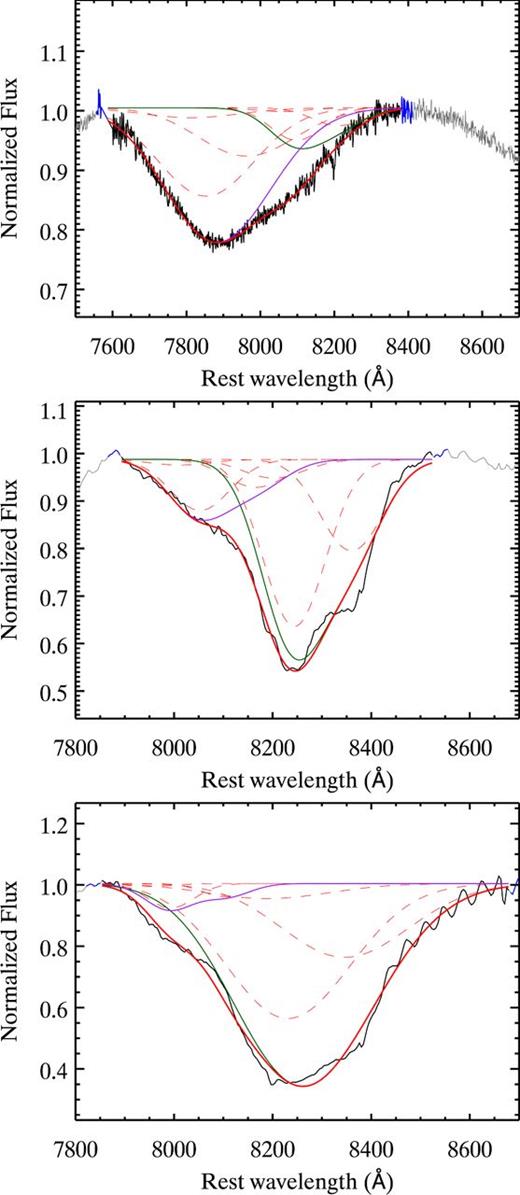
From top to bottom: the |$\mathrm{Ca}\,\small {II}$| NIR absorption at −16, +5, and +15 d, respectively. The black curve shows the range we fit the line profile. The blue continuum regions near the left and right side of the line profile are the regions we select to fit the pseudo-continuum. The red solid line is the best fit to the line profile, which is the superposition of all the line components used for the fitting (represented as dashed lines). The green curve represents the superposition of all the components in |$\mathrm{Ca}\,\small {II}$| NIR PVF. The purple curve represents the superposition of all the components in the |$\mathrm{Ca}\,\small {II}$| NIR HVF.
Fig. 9 shows the velocities and pEWs of the spectral features as a function of phase. Zheng et al. (2013) discovered the presence of C ii λλ6580, 7234 absorption in the earliest spectra, corresponding to 16 d before B maximum brightness, which shows evidence of unburned material in the outer layers of the ejecta. In this work, we confirm the detection of |$\rm {C}\,\small {II}$| and measure physical values similar to that of Zheng et al. (2013). The C ii λλ6580, 7234 features were found with velocities of 16 300 and 14 800 km s− 1 at t = −16 d, respectively. However, both features quickly faded away after t = −13 d (∼ 3 d after explosion). The |$\mathrm{O}\,\small {I}$| triplet can also be clearly identified in the spectral sequence, with an initial velocity of 15 300 km s− 1 at t = −16 d and decreasing to 8900 km s− 1 at maximum light.
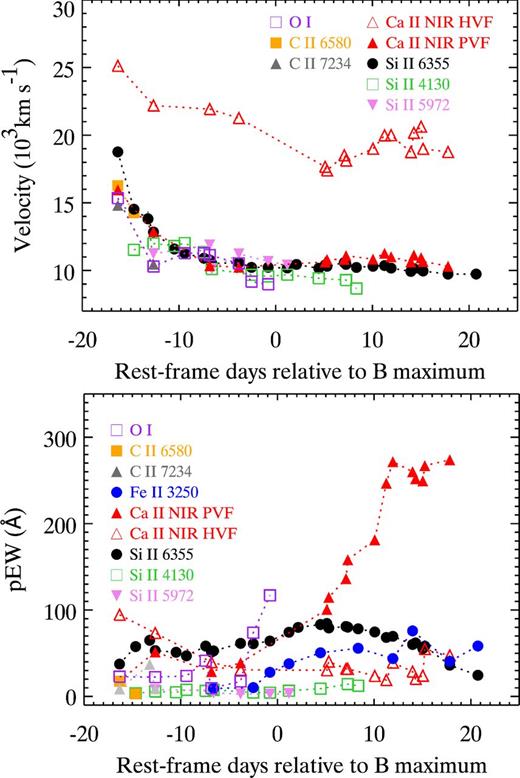
Top: the SN ejecta velocity as a function of phase for various spectral features. Bottom: same as the top panel, but using pEWs instead.
The velocity of |$\mathrm{Si}\,\small {II}\,\lambda 6355$| is ∼ 18 800 km s− 1 at −16 d, consistent with the value reported by Zheng et al. (2013). The silicon velocity then decreased to 10 200 km s− 1 at maximum light, at which point the velocity became relatively stable, decreasing to only 9700 km s− 1 at +20.8 d. The pEWs of |$\mathrm{Si}\,\small {II}\,\lambda 6355$| increased slightly from our first epoch until t ≈ 5 d and then faded away at later times. The Si ii λλ4130, 5972 features generally follow a similar evolution to that of |$\mathrm{Si}\,\small {II}\,\lambda 6355$|, but with lower velocities and weaker absorption.
The |$\mathrm{Ca}\,\small {II}$| NIR triplet can be clearly identified in most of our spectra, even extending to very late times. The velocities of the |$\mathrm{Ca}\,\small {II}$| NIR PVF and |$\mathrm{Si}\,\small {II}\,\lambda 6355$| have similar evolution, but the |$\mathrm{Ca}\,\small {II}$| NIR HVF has much larger velocities than the |$\mathrm{Ca}\,\small {II}$| NIR PVF. For the |$\mathrm{Ca}\,\small {II}$| NIR HVF and |$\mathrm{Ca}\,\small {II}$| NIR PVF, we measure a velocity of 25 130 and 15 955 km s− 1, respectively, at −16 d. However, the velocity of the |$\mathrm{Ca}\,\small {II}$| NIR HVF dramatically decreases to ∼ 20 000 km s− 1 after maximum brightness. The velocity evolution of |$\mathrm{Ca}\,\small {II}$| NIR line is consistent with that of normal-velocity (|$\mathrm{Si}\,\small {II}\,\lambda 6355$| velocity <11 800 km s− 1 at maximum brightness) SNe Ia studied in Silverman et al. (2015). It is also evident from the pEW measurements that the |$\mathrm{Ca}\,\small {II}$| NIR HVF is stronger than the |$\mathrm{Ca}\,\small {II}$| NIR PVF at early times. We find that the ratio of pEW(HVF) to pEW(PVF) is ∼ 5.3 at −16 d, quickly decreases to unity at t ≈ −5 d, and is well below unity at later times.
We also found that the |$\mathrm{Ca}\,\small {II}$| NIR absorption showed increasingly stronger absorption after maximum brightness. We display the evolution of the |$\mathrm{Ca}\,\small {II}$| NIR triplet in Fig. 10, which clearly shows the strengthening NIR absorption with phase. The absorption is still clearly detected at t = 131 d.
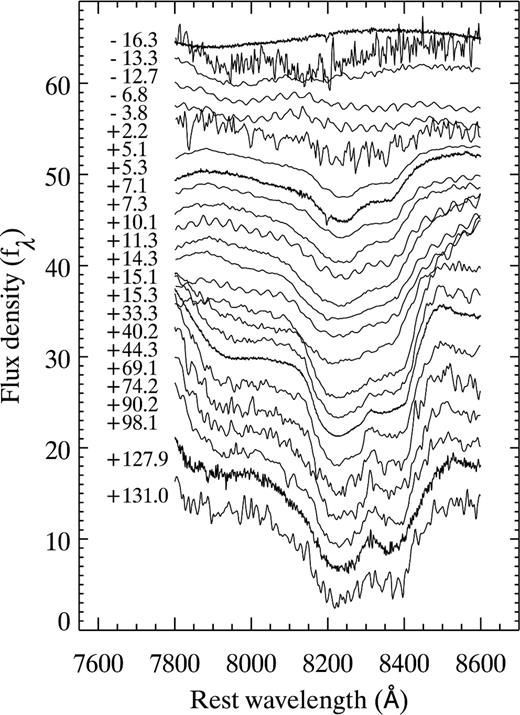
The evolution of the |$\mathrm{Ca}\,\small {II}$| NIR triplet 3with phase.
High-resolution spectroscopy
Studies of the circumstellar environment of SNe Ia are critical in constraining the progenitor models. By using a series of high-resolution optical spectra, recent studies have revealed that at least some SNe Ia have time-varying narrow absorption lines (e.g. Patat et al. 2007; Simon et al. 2009; Dilday et al. 2012). Some explanations suggest that these time-varying absorptions could be caused by the interaction between SN ejecta and the circumstellar medium, which likely originates as gas outflows from the progenitor system.
In this work, we examined the high-resolution spectra at wavelengths corresponding to absorption from Ca H&K, Na D λλ5890, 5896, and K i λλ7665, 7699at roughly the recession velocity of the host galaxy. We also examined absorption from the 5780 Å diffuse interstellar band (DIB). The recession velocity of NGC 7250 is sufficiently large (cz = 1166 km s− 1) that there should be no confusion between interstellar and/or circumstellar gas in NGC 7250 and gas in the Milky Way.
Fig. 11 (left) displays the Na D absorption in the +1.6 d spectrum of SN 2013dy. There are two major absorption features at roughly −85 and + 10 km s− 1, with the bluer component being stronger and saturated. From the K i λ7665 line, which is not saturated, we determine that the − 85 km s− 1 component is composed of two separate velocity components at −83.7 and − 88.4 km s− 1, with the redder component being stronger. Using the Sternberg et al. (2011) classification scheme, where the profile is classified by the velocity of absorption features relative to the strongest Na absorption, SN 2013dy has a ‘redshifted’ profile; however, the bluest ( − 88.4 km s− 1) component as seen in K i is weaker than the strongest absorption ( − 83.7 km s− 1), making the classification somewhat complicated. Using the Maguire et al. (2013) classification scheme, where the profile is classified by the velocity of all features relative to the systemic velocity, SN 2013dy has a ‘blueshifted’ profile.
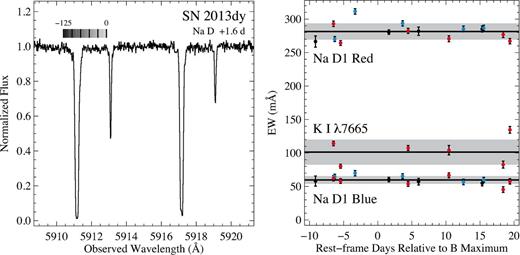
Left: the Na D absorption in the spectrum taken with VLT/UVES. A bar showing the velocity scale is presented on top of the spectrum. Right: the EWs as a function of phase of the blue and red components for the Na D1 line as well as the K i λ7665 line. The spectra taken with different instruments are shown in different colours: HET/HRS (blue), Mercator/HERMES (red), and the rest of the instruments listed in Table 5 (black).
Since the resolutions for the various instruments differ significantly, we focus primarily on the EWs of the absorption features. However, in the cases where we have multiple epochs from the same instrument, we also examined the line profiles in detail. Evaluating each subset from the same instrument also reduces cross-instrument systematics. There is no obvious change for any line in our data.
We measure the EW of the blue and red components of the D1 and D2 lines separately. We do not fit the features, but rather simply sum the data over a wavelength range covering the features in all spectra. This avoids the complication that the higher resolution spectra have clear flat-bottomed profiles, while lower resolution spectra do not. This flat-bottomed feature has two velocity components (as determined by the K i feature) offset by < 5 km s− 1, and at lower resolution they may not be completely resolved. We also measure the EW of the entire profile (for D1 and D2 separately) over a wavelength range covering the entire feature. These measurements should be sensitive to any changes in absorption at velocities different from that of the strong absorption features.
The statistical uncertainties were determined from the root-mean-square scatter near the Na lines (e.g. Leonard & Filippenko 2001). There are additional systematic uncertainties related to the data reduction (and particularly the telluric correction) as well as the continuum determination. We measure the latter uncertainty by varying the order and spacing of breakpoints when fitting the B-splines to the continuum, measuring the EW, and setting the standard deviation of the measurements to be the uncertainty. We determine the former uncertainty by comparing our measurements taken with different instruments on the same night (with the assumption that lines should not vary significantly in the span of a few hours). We present our measurements of the EWs for the blue and red components for the Na D1 line as well as the K i λ7665 line in Fig. 11 (right).
There is no evidence for variable absorption from any of the narrow absorption features in our data. Although the scatter for a given measurement is significantly larger than the uncertainties in the measurements (with |$\chi ^{2}_{\nu } \approx 10$|), there is no coherent change with phase. Instead, we believe that a systematic bias affects the HET/HRS observations, which have systematically high EWs for all components of Na D. While we do not attempt to correct this potential bias in the measurements, we note that the scatter is typically <10 per cent of the measurement, indicating that the potential bias is likely small. The peak-to-peak variations up to ∼ 40 m Å are also expected owing to the fractal patchy structure of the interstellar medium (Patat et al. 2010).
In our highest S/N spectra, we detect the 5780 Å DIB feature, which is consistent with a single component having a velocity of − 20 ± 10 km s− 1. This component is marginally consistent with being at the same velocity as the redder + 10 km s− 1 Na D absorption component. The DIB has an EW of 60 ± 10 mÅ. Using the Phillips et al. (2013) relation, this corresponds to AV = 0.3 ± 0.2 mag. This estimate is comparable to, though lower than, the extinction measurement determined from the SN 2013dy photometry (AV = 0.64 mag; see Section 3.1).
UV spectroscopy
We obtained 10 epochs of HST/STIS spectra in this work. The multi-epoch UV spectra enable an investigation of the UV spectral evolution at wavelengths as short as 1600 Å. In Fig. 12, we compare the HST spectra of SN 2013dy with those of SN 2011fe at similar epochs. We also compare to SNe 2011by and 2011iv at maximum brightness. SNe 2011by and 2011fe have nearly identical optical colours, light-curve shapes, and spectra, but have different UV continua (Foley & Kirshner 2013; Graham et al. 2015a). SN 2011iv is a spectroscopically normal SN Ia, but presents a relatively fast decline rate Foley et al. (Δm15(B) ≈ 1.7 mag; 2012b). All spectra were dereddened and normalized to have the same mean flux between 3500 and 5000 Å.
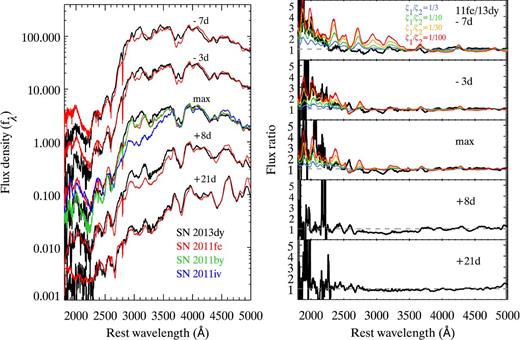
Left: the comparison of SN 2013dy (black) and SN 2011fe (red) spectra under 5000 Å. The maximum-light spectra of SN 2011by (green) and SN 2011iv (blue) are also compared. All spectra are dereddened and normalized accordingly (the normalized region is 3500–5000 Å). Right: the flux-ratio spectra (11fe/13dy) are shown in black. The predicted flux-ratio spectra with differences in metallicity factor ζ are overplotted. Here the models from Days 7, 10, and 15 of Lentz et al. (2000) are compared to the data set at t = −7, −3, and 0 d relative to the B-band maximum brightness, respectively. The grey dashed line represents the line of equality.
At all epochs except for t = +21 d, SN 2013dy has excess flux at 2800 < λ < 4000 Å relative to SN 2011fe. Examining this wavelength range at maximum brightness, we find a trend between the amount of flux in this region (relative to the rest of the spectrum) and light-curve shape. Specifically, the continuum in this region is strongest for SN 2013dy (Δm15(B) = 0.92 mag), followed by SNe 2011by and 2011fe (Δm15(B) ≈ 1.1 mag), and finally SN 2011iv (Δm15(B) ≈ 1.7 mag). Therefore, the amount of flux in this region may be linked to the amount of 56Ni generated in the explosion. We also note that the maximum-light spectra of SNe 2011by and 2013dy are relatively similar for λ < 2300 Å, with both having relatively less flux than SN 2011fe at these wavelengths. SN 2011fe also has excess flux at these wavelengths, relative to SN 2013dy, at earlier epochs.
We further examine the UV evolution of SN 2013dy using the flux-ratio spectra (f13dy/f11fe) shown in the right-hand panel of Fig. 12. Following the method in Foley & Kirshner (2013), we overplot the flux-ratio spectra predicted by the model of Lentz et al. (2000) with differences in metallicity factor ζ. We find that the SN 2011fe/SN 2013dy flux-ratio spectra are better matched by the Lentz et al. (2000) flux-ratio spectra with >30 times metallicity difference. This might suggest that SN 2013dy has a higher progenitor metallicity than SN 2011fe; however, the other differences between these SNe (light-curve shape and spectra; see Section 4.5 for details) complicate this possibility.
For comparison, we also determine the SN 2011by/SN 2013dy flux-ratio spectrum at maximum light (see Fig. 13). The result shows that SN 2013dy and SN 2011by have similar continua in the UV. This is consistent with the conclusion from Foley & Kirshner (2013) and Graham et al. (2015a) that SN 2011by appears to have a higher progenitor metallicity than SN 2011fe.
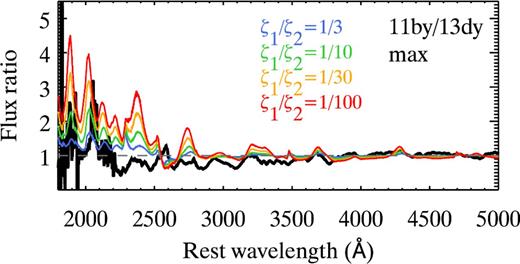
Same as the right-hand panel of Fig. 12, but using the flux-ratio spectrum of SN 2011by and SN 2013dy instead.
In addition to the difference in the continuum, the positions of the UV spectral features of SN 2013dy are systematically bluer than those in the spectra of SN 2011fe. While lacking data at λ < 2900 Å, Maguire et al. (2012) observed a similar trend for the features at 2900 < λ < 3300 Å when comparing the mean spectra of SNe Ia with slower decline rates to those having faster decline rates.
Foley, Filippenko & Jha (2008) defined the ‘UV ratio’ as RUV = fλ(2770 Å)/fλ(2900 Å), finding that the UV ratio is strongly correlated with the luminosities of SNe Ia. Brighter SNe Ia tend to have smaller RUV than their fainter counterparts. For SNe 2013dy and 2011fe, we measure RUV = 0.36 and 0.42, consistent with their light-curve shapes.
The strong absorption feature at ∼ 3000 Å (which is attributed to |$\mathrm{Fe}\,\small {II}\,\lambda 3250$|; Branch & Venkatakrishna 1986) can be clearly identified in all UV spectra. However, the blending with many IGE lines in |$\mathrm{Fe}\,\small {II}\,\lambda 3250$| complicates the velocity measurement. Here we only measure the pEW of the feature as a whole at each epoch and present the result in Fig. 9. The pEW of |$\mathrm{Fe}\,\small {II}\,\lambda 3250$| increases slightly from ∼ 10 Å at −7 d to ∼ 60 Å at +21 d. Our results compare well with the evolution studied by Foley et al. (2008) using a larger sample of SNe Ia.
Nebular spectra
By ∼ 100 d after maximum brightness, SNe Ia enter the so-called nebular phase. At this point, the SN becomes optically thin and photons can escape from the very centre of the ejecta. Thus, observations at these epochs are strongly constraining for SN Ia explosion models. For these phases, the SN spectrum is dominated by forbidden emission lines of IGEs (e.g. iron, nickel, and cobalt). In this work, we obtained six nebular spectra at t > 100 d (three with 100 < t < 150 d and the remaining at t > 300 d).
For each spectrum, we measured the velocity shift of the |$[\mathrm{Fe}\,\small {iii}]\,\lambda 4701$|, |$[\mathrm{Fe}\,\small {II}]\,\lambda 7155$|, |$[\mathrm{Co}\,\small {iii}]\,\lambda 5891$|, and |$[\mathrm{Ni}\,\small {II}]\,\lambda 7378$| emission line features in the nebular spectrum. Fig. 14 shows the velocity of emission lines as a function of phase. |$[\mathrm{Fe}\,\small {iii}]\,\lambda 4701$| is one of the strongest spectral features in the nebular phase, and we are able to measure its velocity in most of the nebular spectra. It has a blueshifted velocity of ∼ −2600 km s−1 relative to the rest wavelength of |$[\mathrm{Fe}\,\small {iii}]\,\lambda 4701$| at t ≈ 100 d. The velocity then decreases to −720 km s−1 at t = 333 d, and is redshifted to ∼ 1300 km s−1 at t = 423 d. Similar trend was also found in Silverman, Ganeshalingam & Filippenko (2013) with a larger sample of SNe Ia.
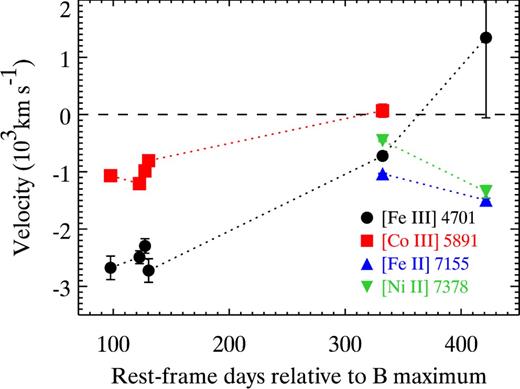
The velocity determined from the emission lines in SN 2013dy nebular spectra as a function of phase. The velocity below/above the dashed line means the emission line is blueshifted/redshifted relative to the rest wavelength.
|$[\mathrm{Co}\,\small {iii}]\,\lambda 5891$| shows a similar evolution to |$[\mathrm{Fe}\,\small {iii}]\,\lambda 4701$|, but has a velocity that is ∼ 1000 km s−1 closer to zero shift. |$[\mathrm{Fe}\,\small {II}]\,\lambda 7155$| and |$[\mathrm{Ni}\,\small {II}]\,\lambda 7378$| are blended in wavelength space and can only be clearly decomposed in the spectra at t = 333 and 423 d. We deblend the line feature by fitting the line with a double Gaussian profile. The velocities of |$[\mathrm{Fe}\,\small {II}]\,\lambda 7155$| and |$[\mathrm{Ni}\,\small {II}]\,\lambda 7378$| are similar to that of |$[\mathrm{Fe}\,\small {iii}]\,\lambda 4701$| at t = 333 d, although an opposite evolution is found afterwards (the velocities of |$[\mathrm{Fe}\,\small {II}]\,\lambda 7155$| and |$[\mathrm{Ni}\,\small {II}]\,\lambda 7378$| are further blueshifted at 423 d).
In Fig. 15, we compare the late-time spectra of SN 2013dy (starting ∼ 1 month after maximum brightness) with similar phase spectra of SN 2011fe. The results show that both SNe are very similar through t ≈ 100 d. However, there are noticeable deviations for the |$[\mathrm{Fe}\,\small {II}]\,\lambda 7155$| and |$[\mathrm{Ni}\,\small {II}]\,\lambda 7378$| features as well as the spectral region around 8500–9000 Å (dominated by [|$\mathrm{Fe}\,\small {II}$|] lines) at t = 333 d. SN 2013dy appears to have a relatively weaker |$[\mathrm{Fe}\,\small {II}]\,\lambda 7155+[\mathrm{Ni}\,\small {II}]\,\lambda 7378$| feature than that of SN 2011fe. At this late phase, the |$[\mathrm{Ni}\,\small {II}]\,\lambda 7378$| pEW of SN 2011fe (1004 ± 2 Å) is about 1.6 times larger than that of SN 2013dy (630 ± 6 Å), but both SNe have similar |$[\mathrm{Fe}\,\small {II}]\,\lambda 7155$| pEWs (739 ± 8 and 892 ± 1 Å for SN 2013dy and SN 2011fe, respectively).
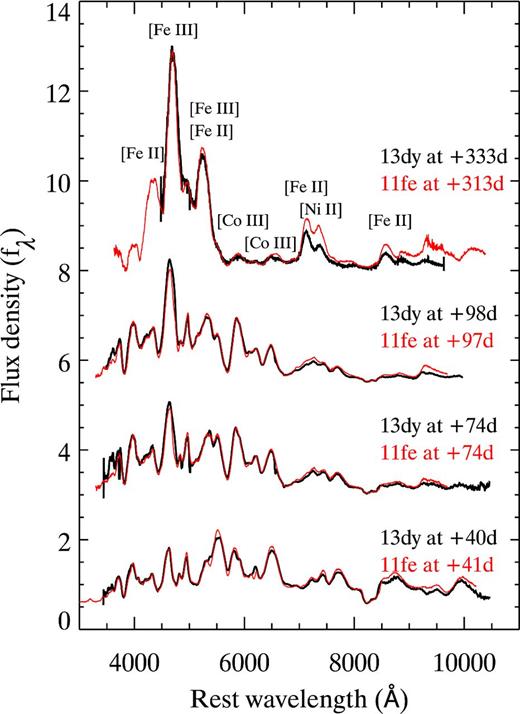
Late-time spectra of SN 2013dy (black) and SN 2011fe (red). The spectra are dereddened and normalized accordingly (the normalized region is 5000–6000 Å).
Following the diagnostic in Graham et al. (2015a), we determine the relative strength of |$[\mathrm{Ni}\,\small {II}]\,\lambda 7378$| to |$[\mathrm{Fe}\,\small {II}]\,\lambda 7155$|, but using pEW instead of the flux of the emission line. Here the pseudo-continuum used to calculate the pEW of emission line is defined with the local minima on each side of the line profile. We measure pEW ratios of 0.85 and 1.12 for SN 2013dy and SN 2011fe, respectively. Since the radioactive 56Ni has a half-life of ∼ 6 d, all of the nickel emission in the nebular spectra at t > 300 d is produced by stable 58Ni. However, the |$[\mathrm{Fe}\,\small {II}]\,\lambda 7155$| emission is produced by the combination of stable iron and radioactive 56Ni. This degeneracy complicates our analysis.
For two identical SNe Ia, except for the amount of (stable) 54Fe, radioactive 56Ni, and (stable) 58Ni generated in the explosion, their nebular spectra would be similar, with the largest discrepancy expected to be in the |$[\mathrm{Ni}\,\small {II}]\,\lambda 7378$|/|$[\mathrm{Fe}\,\small {II}]\,\lambda 7155$| flux ratio. If the amount of stable IGEs is the same, but more 56Ni is generated, which will mostly decay to 56Fe at the time a nebular spectrum is observed, one would naively expect the |$[\mathrm{Ni}\,\small {II}]\,\lambda 7378$|/|$[\mathrm{Fe}\,\small {II}]\,\lambda 7155$| flux ratio to be smaller than in an object with smaller 56Ni. Similarly, if the amount of 56Ni is the same, but the amount of stable IGEs is smaller, then one would expect a smaller |$[\mathrm{Ni}\,\small {II}]\,\lambda 7378$|/|$[\mathrm{Fe}\,\small {II}]\,\lambda 7155$| flux ratio.
Since SN 2013dy has a smaller |$[\mathrm{Ni}\,\small {II}]\,\lambda 7378$|/|$[\mathrm{Fe}\,\small {II}]\,\lambda 7155$| flux ratio than that of SN 2011fe, SN 2013dy naively had a smaller amount of stable IGEs or a larger amount of 56Ni (or some combination) than did SN 2011fe. For the latter case, and given the correlation between SN Ia peak bolometric luminosity and the mass of 56Ni (Arnett 1979, 1982), the Tully–Fisher distance to NGC 7250 (see Section 3.3) may be underestimated. Given the relative light-curve shapes for the two SNe, with SN 2013dy having a broader light curve than SN 2011fe, this is a reasonable explanation. A separate distance measurement to the host galaxy (e.g. using Cepheid distance) is necessary to verify our results.
For the former case (SN 2013dy having a smaller amount of stable IGEs than SN 2011fe), the relative |$[\mathrm{Ni}\,\small {II}]\,\lambda 7378$|/|$[\mathrm{Fe}\,\small {II}]\,\lambda 7155$| flux ratio would suggest that SN 2013dy produced a smaller amount of stable to radioactive IGEs, consistent with SN 2013dy having a smaller metallicity than SN 2011fe, contrasting the results from our UV data (see Section 4.3).
Again, the real situation may be more complicated, and some degeneracies need to be considered here. SNe Ia with higher metallicities not only produce more 58Ni, but also more stable iron (Timmes et al. 2003). That means the ratio |$[\mathrm{Ni}\,\small {II}]\,\lambda 7378$|/|$[\mathrm{Fe}\,\small {II}]\,\lambda 7155$| may not be necessarily larger with higher metallicity. In addition, the prediction made by Timmes et al. (2003) is for exactly the same explosion energies. As we will discuss in Section 4.5, this is unlikely to be the case for SN 2013dy and SN 2011fe. Physical conditions other than progenitor metallicity could also contribute here (e.g. central density; Lesaffre et al. 2006; Krueger et al. 2012; Seitenzahl et al. 2013). Seitenzahl et al. (2013) showed that in Chandrasekhar-mass models the influence of central density (at ignition) on the ratio of |$[\mathrm{Ni}\,\small {II}]\,\lambda 7378$|/|$[\mathrm{Fe}\,\small {II}]\,\lambda 7155$| is even greater than that of metallicity. They found that the models with higher central density generally have a higher ratio of |$[\mathrm{Ni}\,\small {II}]\,\lambda 7378$|/|$[\mathrm{Fe}\,\small {II}]\,\lambda 7155$| (assuming that they have equal metallicity). It is currently difficult to disentangle the two situations for singular objects. Nevertheless, the data appear to be more consistent with SN 2013dy having produced more 56Ni than SN 2011fe, with metallicity being less of an influence.
Spectroscopic subclasses
Previous studies which examined large sample of SNe Ia and their spectra at maximum light demonstrated the existence of several subclasses of SNe Ia (Benetti et al. 2005; Branch et al. 2006). In Fig. 16 (left), we show the subclasses of SNe Ia as determined by the gradient of |$\mathrm{Si}\,\small {II}\,\lambda 6355$| velocity and B-band decline rate Δm15(B) (Benetti et al. 2005). The SN Ia sample in Benetti et al. (2005) is split into three groups: a ‘low velocity gradient’ (LVG) group, which have low |$\mathrm{Si}\,\small {II}\,\lambda 6355$| velocity gradients and naturally have lower values of Δm15(B); a ‘high velocity gradient’ (HVG) group, which have high |$\mathrm{Si}\,\small {II}\,\lambda 6355$| velocity gradients and low Δm15(B); and a ‘FAINT’ group including SN 1991bg-like events that have higher values of Δm15(B) and naturally have larger velocity gradients. SN 2013dy shows a low |$\mathrm{Si}\,\small {II}\,\lambda 6355$| velocity gradient (− 15 km s− 1 d− 1; measured from maximum light to +21 d) and a slow decline rate (Δm15(B) = 0.92 mag). Using these spectral indicators, we can classify SN 2013dy as an LVG SN Ia.
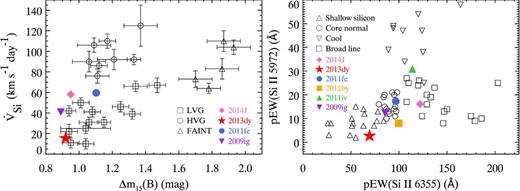
Left: the gradient of |$\mathrm{Si}\,\small {II}\,\lambda 6355$| velocity (km s− 1 d− 1) as the function of B-band decline rate Δm15(B). The sample and subclasses studied in Benetti et al. (2005) are overplotted. The sample is split into three different subclasses: ‘low velocity gradient’ (LVG; open squares), ‘high velocity gradient’ (HVG; open circles), and ‘FAINT’ (open triangles). Right: |$\mathrm{Si}\,\small {II}\,\lambda 5972$| pEW as the function of |$\mathrm{Si}\,\small {II}\,\lambda 6355$| pEW. The sample and subclasses studied in Branch, Dang & Baron (2009) are overplotted. The sample is split into four different subclasses: ‘shallow-silicon’ (open triangles), ‘core-normal’ (open circles), ‘cool’ (open downward triangles), and ‘broad-line’ (open squares). The position of SN 2013dy is represented by the red filled star. We also mark the positions of a variety of SNe Ia for comparison.
Fig. 16 (right) shows the subclasses of SNe Ia according to the pEW of Si ii λλ6355, 5972 (Branch et al. 2006). Branch et al. (2006) split the SN Ia sample into four groups: a ‘shallow-silicon’ group, which have low pEWs for Si ii λλ6355, 5972 lines (and include SN 1991T-like objects); a ‘core-normal’ group, which have homogeneous and intermediate pEWs; a ‘cool’ group (similar to the FAINT group in Benetti et al. 2005) with strong |$\mathrm{Si}\,\small {II}\,\lambda 5972$| lines relative to |$\mathrm{Si}\,\small {II}\,\lambda 6355$|; and a ‘broad-line’ group, which present strong |$\mathrm{Si}\,\small {II}\,\lambda 6355$| absorptions (and have much overlap with the HVG group). In this scheme, we classify SN 2013dy as a ‘shallow-silicon’ SN Ia corresponding to its relatively weak Si ii λλ6355, 5972 absorptions.
In addition to the samples of Benetti et al. (2005) and Branch et al. (2006), we specifically added SNe 2009ig, 2011by, 2011fe, 2011iv, and 2014J to Fig. 16. All of these SNe have maximum-light UV spectra (Foley et al. 2012a,b; Foley 2013; Foley & Kirshner 2013; Foley et al. 2014; Mazzali et al. 2014). While SNe 2009ig and 2014J have similar decline rates as SN 2013dy (Δm15(B) = 0.89 and 0.95 mag, respectively), both have larger |$\mathrm{Si}\,\small {II}\,\lambda 6355$| velocity gradients, with SN 2014J having a velocity gradient somewhat intermediate to the LVG and HVG classes. None the less, all three SNe are classified as LVG objects. SN 2011fe, on the other hand, is intermediate to the LVG and HVG groups.
Using purely spectral parameters, we classify SNe 2011by and 2011fe as core-normal, SN 2011iv as cool, SN 2014J as broad-lined, and SN 2009ig as intermediate between shallow-silicon and core-normal. This indicates that there is no perfect match for SN 2013dy among the SNe Ia with maximum-light UV spectra. However, from Fig. 16, we see that we are consistently filling out the parameter space of SNe Ia with objects that have UV spectra. To this end, SN 2013dy represents an extreme object in velocity gradient, Δm15(B), pEW(|$\mathrm{Si}\,\small {II}\,\lambda 6355$|), and pEW(|$\mathrm{Si}\,\small {II}\,\lambda 5972$|).
COMPARISON TO MODELS
With an excellent UV through NIR spectral sequence and a well-sampled bolometric light curve, SN 2013dy is an ideal object to which one can compare models. Through these comparisons, we can constrain the progenitor and explosion models of SN 2013dy. For this purpose, we select two primary models: the one-dimensional deflagration model W7 (Nomoto, Thielemann & Yokoi 1984) and the three-dimensional delayed-detonation N5 model (Seitenzahl et al. 2013). These models are chosen based on their similar bolometric light-curve shapes to that of SN 2013dy (e.g. see Sim et al. 2013). Spectral sequences were generated for these models using the radiative transfer codes developed by Kromer & Sim (2009, artis). The corresponding model spectra were described in Kromer & Sim (2009) for the W7 model and Sim et al. (2013) for the N5 model. In addition to the nominal W7 model, we modify the W7 abundance profile to match solar metallicity (Asplund et al. 2009) in the outer layers (W7 Z⊙; see also Foley et al. 2012b). This model is useful for determining if the progenitor star had non-zero metallicity.
In Fig. 17 , we compare the bolometric light curve of SN 2013dy with the model bolometric light curves. Because of the large distance uncertainty of SN 2013dy, we shift the model light curves such that their flux at the time of B-band maximum brightness matches that of SN 2013dy. By doing this, we are examining the shape of the bolometric light curve instead of the absolute luminosity. Future observations may more accurately determine the peak luminosity of SN 2013dy and thus better constrain the explosion models.
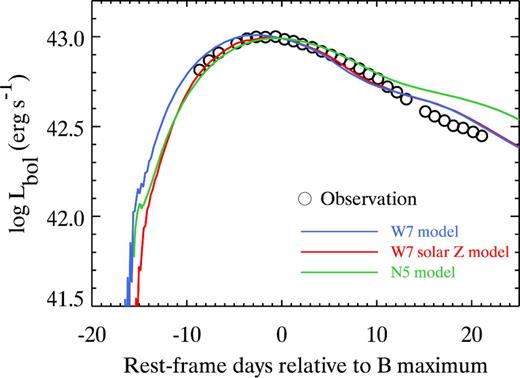
The UVOIR bolometric light curve of SN 2013dy (same as Fig. 6) is shown as open circles. We compare the data to model light curves generated from the W7 model (blue curve), the solar-metallicity polluted W7 Z⊙ model (red curve), and the three-dimensional delayed-detonation N5 model (green curve), respectively. Here the model light curve shown for the N5 model is angle-averaged. The model light curves are shifted to match the bolometric flux of SN 2013dy at the time of B-band maximum.
At early phases (t ≤ 0 d), the model light curves generated from W7 Z⊙ and N5 models are nearly identical, and both are a better match to the data than the W7 model. At later phases (t ≳ 0 d), the N5 light curves start to deviate from the data, having a slower decline, while the W7 and W7 Z⊙ evolve in a similar fashion as SN 2013dy. The slower decline found in the N5 model could be a reflection of the larger IGE mass compared to the W7 model, which will result in a higher opacity and temperature. The difference between the W7 and W7 Z⊙ models is negligible at later epochs since the W7 and W7 Z⊙ models only differ in the outer layers. The post-maximum evolution of both models should resemble to each other as expected. We further demonstrate this effect in Fig. 18 by investigating the details of the spectral sequence.
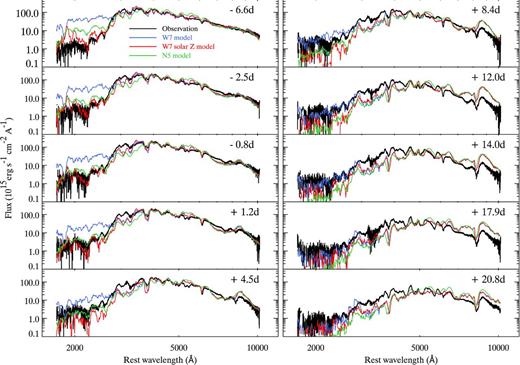
The HST spectra at different epochs (black curves). We compare the data to model spectra generated from the W7 model (blue curves), the solar-metallicity polluted W7 Z⊙ model (red curves), and the three-dimensional delayed-detonation N5 model (green curves), respectively. The model spectra are scaled with the same multiplicative factor used to shift the model bolometric light curve in Fig. 17.
Previous theoretical studies have shown that the UV SED is extremely sensitive to the progenitor metallicity as it significantly alters the UV opacity, which is dominated by line blanketing (Hoeflich et al. 1998; Lentz et al. 2000). SNe Ia with identical optical spectra could have (and have shown) large differences in the UV (Foley & Kirshner 2013). In Fig. 18, we compare the model spectra with those of SN 2013dy. To be consistent, the model spectra are scaled with the same multiplicative factor used to shift the model bolometric light curve in Fig. 17. We exclusively examine the HST spectra, since almost all of the discriminating power is in the UV.
For the phases earlier than a week after maximum brightness, the W7, W7 Z⊙, and N5 models have similar optical spectra with all generally agreeing with the data. However, as already noticed by Foley et al. (2012b), the W7 and W7 Z⊙ models start to have large differences at far-UV wavelengths (λ ≤ 2800 Å), which is exactly the region shown to be sensitive to the progenitor metallicity (e.g. Lentz et al. 2000). While the UV flux of the W7 model is significantly larger than that of SN 2013dy (≳50 times at some wavelengths), the W7 Z⊙ and N5 models are generally in agreement with the data. This result seems to be a conflict with our previous conclusion since the N5 model does not have solar-metallicity admixture like the W7 Z⊙ model. However, in the three-dimensional delayed-detonation models, the IGE-rich deflagration ashes will rise due to the turbulent motions (e.g. Sim et al. 2013). This will lead to a mixture of burning ashes at higher velocities and cause the suppression of UV flux, which is similar to the effect of progenitor metallicity in the W7 Z⊙ model. For our earliest epoch (t = −6.6 d), even the N5 model has more UV flux than the data, but at this time, the W7 Z⊙ model is relatively consistent with the observations.
For the phases later than a week after maximum brightness, the models are less consistent with the observations. These discrepancies might be caused by systematic effects in the model spectra related to approximations in the treatment of excitation and ionization in our radiative transfer simulations. Since full non-local thermodynamic equilibrium calculations are currently unavailable for these explosion models, this limitation is expected to introduce some uncertainty to the radiative transfer simulations in this work.
To summarize, we find that the W7 Z⊙ model is in good agreement with SN 2013dy. In terms of bolometric behaviour and early-time UV spectra, it performs significantly better than the zero-metallicity W7 model. For the earliest epoch of spectroscopy and at later times, the W7 Z⊙ model also performs slightly better than the delayed-detonation N5 model. The UV data were critical in making this determination.
CONCLUSIONS
SN 2013dy was discovered only 2.4 h after explosion in NGC 7250, which makes it the SN Ia with the earliest known detection. In this work, we present high-quality photometric and spectroscopic data. The photometric observations were taken from t = −16 to +337 d (relative to maximum brightness). 10 epochs of UV through NIR spectra were taken with HST/STIS. For phases of t = −16 to +480 d, additional low- and high-resolution optical spectra were obtained with a variety of ground-based facilities.
Our photometric analysis shows that SN 2013dy has a relatively slow decline rate (Δm15(B) = 0.92 mag) and is intrinsically bluer than SN 2011fe. Consistent with previous results, SN 2013dy, being a slowly declining SN Ia, has colour curves that peak later and have shallower later-time slopes than those of faster declining SNe Ia. We generated a UVOIR bolometric light curve for SN 2013dy (1600–18 000 Å) with both photometric and spectroscopic data sets, but large uncertainties in the distance to SN 2013dy prevented a precise measurement of its peak bolometric luminosity.
We also determined the physical parameters of NGC 7250, the host galaxy of SN 2013dy. NGC 7250 is blue with evidence of strong star formation. The relatively low Mstellar suggests that the environment of SN 2013dy is likely metal poor. This seems to be a conflict with the results suggested by the UV spectroscopy. However, using the global properties of host galaxy as proxy to constrain the SN progenitor could present large uncertainties. The host parameters determined in this work may not well reflect the real physical conditions of the SN birthplace.
In the earliest spectra (1.6 to 5 d after the explosion), there are strong C ii absorption features, indicating the evidence that unburned material exists at the outer layers of the ejecta. Using the classification schemes defined by Benetti et al. (2005) and Branch et al. (2009), we further classified SN 2013dy as an SN Ia with LVG and shallow-silicon absorption. Therefore, SN 2013dy is spectroscopically different from core-normal SNe similar to SN 2011fe.
SN 2013dy also has strong |$\mathrm{Ca}\,\small {II}$| NIR HVF at early phases. The velocity of the |$\mathrm{Ca}\,\small {II}$| NIR HVF is ∼ 10 000 km s− 1 higher than that of the |$\mathrm{Ca}\,\small {II}$| NIR PVF. We find that the |$\mathrm{Ca}\,\small {II}$| NIR HVF was stronger than the |$\mathrm{Ca}\,\small {II}$| NIR PVF a few days after the explosion. However, the |$\mathrm{Ca}\,\small {II}$| NIR HVF quickly became weaker than |$\mathrm{Ca}\,\small {II}$| NIR PVF immediately after t = −5 d. Although the velocity of the |$\mathrm{Ca}\,\small {II}$| NIR triplet decreased quickly with phase, we observed increasingly stronger absorptions for the |$\mathrm{Ca}\,\small {II}$| NIR triplet from maximum brightness until t = +131 d.
We obtained 15 epochs of high-resolution spectra, which is one of largest known single set of high-resolution spectra for an SN Ia. Examining narrow absorption features including Na iD, K i λ7665, and the 5780 Å DIB, we find no evidence of temporal variability.
We compared the HST UV spectra to those of SNe 2011by, 2011fe, and 2011iv at similar phases. At maximum brightness, there appears to be a correlation between the amount of UV flux at 2800 < λ < 4000 Å and decline rate with SN 2013dy having both the slowest decline rate and highest UV flux of the sample. By examining the flux-ratio spectra, we find that SN 2013dy has a depressed far-UV continuum (λ < 2300 Å) relative to that of SN 2011fe, consistent with predictions of a higher metallicity progenitor for SN 2013dy. However, differences in the two SNe complicate this interpretation. SN 2013dy also shows systematically blueshifted UV features relative to SN 2011fe.
The late-time spectra of SNe 2013dy and 2011fe are very similar from t = 40 to 100 d. However, we find that SN 2013dy has a smaller |$[\mathrm{Ni}\,\small {II}]\,\lambda 7378$|/|$[\mathrm{Fe}\,\small {II}]\,\lambda 7155$| ratio than SN 2011fe at t ≈ 333 d. This may suggest that SN 2013dy synthesized more 56Ni than SN 2011fe assuming that both SNe generated the same amount of stable iron and 58Ni, but we note that metallicity could have some effect here.
By comparing the bolometric light curve and spectral sequence of SN 2013dy to that of SN Ia explosion models, we find that the W7 Z⊙ model (solar-metallicity polluted W7 model) is in good agreement with the entire SN 2013dy data set. The W7 Z⊙ model is much more consistent than the zero-metallicity W7 model and slightly more consistent than the delayed-detonation N5 model. SN 2013dy again demonstrates that UV data are critical for understanding the progenitor metallicity for SNe Ia.
SN 2013dy is one of the best-studied SNe Ia. It is very nearby and bright, and was discovered immediately after explosion. Follow-up observations were obtained consistently, spanning both a large time frame and wavelength range. This exquisite data set shows that a detailed study of a single well-observed SN Ia can provide unique information about the progenitors and explosions of SNe Ia.
This work is based on observations made with the NASA/ESA Hubble Space Telescope, obtained from the Data Archive at the Space Telescope Science Institute, which is operated by the Association of Universities for Research in Astronomy, Inc. under NASA contract NAS 5–26555. These observations are associated with programme GO-13286. We thank the Telescope Time Review Board for allowing these observations to begin before the official start of Cycle 21. We especially thank the STScI staff for accommodating our target-of-opportunity programme. A. Armstrong, R. Bohlin, S. Holland, and D. Taylor were critical for the execution of this programme. Some of the data presented herein were obtained at the W. M. Keck Observatory, which is operated as a scientific partnership among the California Institute of Technology, the University of California, and NASA; the observatory was made possible by the generous financial support of the W. M. Keck Foundation.
This work was supported by the Deutsche Forschungsgemeinschaft via the Transregional Collaborative Research Center TRR 33 ‘The Dark Universe’ and the Excellence Cluster EXC153 ‘Origin and Structure of the Universe’. AS is supported by the DFG cluster of excellence Origin and Structure of the Universe. GP acknowledges support provided by the Millennium Institute of Astrophysics (MAS) through grant IC120009 of the Programa Iniciativa Cientifica Milenio del Ministerio de Economia, Fomento y Turismo de Chile. JV is supported by Hungarian OTKA Grant NN 107637. JMS is supported by a National Science Foundation (NSF) Astronomy and Astrophysics Postdoctoral Fellowship under award AST-1302771. JCW's supernova group at UT Austin is supported by NSF Grant AST 11-09801. The work of AVF's group at U.C. Berkeley was made possible by NSF grant AST-1211916, the TABASGO Foundation, Gary and Cynthia Bengier, and the Christopher R. Redlich Fund. ST acknowledges support by TRR 33 ‘The Dark Universe’ of the German Research Foundation (DFG). RPK thanks the NSF for support through AST-1211196. MDS gratefully acknowledges generous support provided by the Danish Agency for Science and Technology and Innovation realized through a Sapere Aude Level 2 grant. This paper is partially based on observations made with ESO telescopes at the La Silla Paranal Observatory under programme 091.D-0780(A).
HET is a joint project of the University of Texas at Austin, the Pennsylvania State University, Stanford University, Ludwig-Maximilians-Universitat Munchen, and Georg-August-Universitat Gottingen. The HET is named in honour of its principal benefactors, William P. Hobby and Robert E. Eberly. The Marcario Low Resolution Spectrograph is named after Mike Marcario of High Lonesome Optics who fabricated several optics for the instrument but died before its completion. The LRS is a joint project of the HET partnership and the Instituto de Astronomia de la Universidad Nacional Autonoma de Mexico. We thank the staff at McDonald Observatory for their excellent work during the observations. RP acknowledges support by the European Research Council under ERC-StG grant EXAGAL-308037 and by the Klaus Tschira Foundation.
We thank the RATIR instrument team and the staff of the Observatorio Astronoḿico Nacional on Sierra San Pedro Ma ŕtir. RATIR is a collaboration between the University of California, the Universidad Nacional Autonoḿa de Mex́ico, NASA Goddard Space Flight Center, and Arizona State University, benefiting from the loan of an H2RG detector from Teledyne Scientific and Imaging. RATIR, the automation of the Harold L. Johnson Telescope of the Observatorio Astronoḿico Nacional on Sierra San Pedro Maŕtir, and the operation of both are funded by the partner institutions and through NASA grants NNX09AH71G, NNX09AT02G, NNX10AI27G, and NNX12AE66G, CONACyT grant INFR-2009-01-122785, UNAM PAPIIT grant IN113810, and a UC MEXUS-CONACyT grant.
NSF Astronomy, and Astrophysics Postdoctoral Fellow.
SExtractor and swarp can be accessed from http://www.astromatic.net/software.
There are several separate sets of high-resolution spectra of SN 2014J (Foley et al. 2014; Goobar et al. 2014; Welty et al. 2014; Graham et al. 2015b; Jack et al. 2015); the largest single set of spectra has 33 epochs. The largest single set of spectra of SN 2011fe has 12 epochs (Patat et al. 2013).
REFERENCES
