


Abstract
We use cosmological hydrodynamic simulations to consistently compare the assembly of dwarf galaxies in both Λ dominated, cold dark matter (CDM) and self-interacting dark matter (SIDM) models. The SIDM model adopts a constant cross-section of 2 cm2 g−1, a relatively large value to maximize its effects. These are the first SIDM simulations that are combined with a description of stellar feedback that naturally drives potential fluctuations able to create dark matter (DM) cores. Remarkably, SIDM fails to significantly lower the central DM density within the central 500 pc at halo peak velocities Vmax < 30 km s−1. This is due to the fact that the central regions of very low mass field haloes have relatively low central velocity dispersion and densities, leading to time-scales for SIDM collisions greater than a Hubble time. CDM haloes with Vmax < 30 km s−1 have inefficient star formation, and hence weak supernova feedback. At a fixed 2 cm2 g−1 SIDM cross-section, the DM content of very low mass CDM and SIDM haloes differs by no more than a factor of 2 within 100–200 pc. At larger halo masses (∼1010 M⊙), the introduction of baryonic processes creates field dwarf galaxies with DM cores and central DM+baryon distributions that are effectively indistinguishable between CDM and SIDM. Both models are in broad agreement with observed Local Group field galaxies across the range of masses explored. To significantly differentiate SIDM from CDM at the scale of faint dwarf galaxies, a velocity-dependent cross-section that rapidly increases to values larger than 2 cm2 g−1 for haloes with Vmax < 25–30 km s−1 needs to be introduced.
INTRODUCTION
In this paper, we use high-resolution smoothed particle hydrodynamics (SPH) + N-Body cosmological simulations to focus on two main questions: Can we identify a clear difference between cold dark matter and self-interacting dark matter (CDM and SIDM, respectively) predictions for the structural and observable properties of dwarf galaxies? How do the properties of CDM and SIDM haloes differ at halo masses below 1010 M⊙, where star formation (SF) becomes very inefficient and the effect of the underlying dark matter (DM) component should dominate?
SIDM was originally introduced as a solution for the so-called core-cusp problem, the excess of DM predicted by the CDM model at the centre of field and satellite dwarf galaxies compared to observations (Moore et al. 1999a; Oh et al. 2008; Walker & Peñarrubia 2011; Adams et al. 2014). In the SIDM model, DM particle collisions isotropize the cores of galaxies and transfer mass outwards from the dense central regions of DM haloes over cosmic time-scales. This process creates large cores, more spherical haloes, and a signature flat radial profile of the DM velocity dispersion (Burkert 2000; Spergel & Steinhardt 2000). A SIDM model with fixed cross-section and elastic collisions represents the simplest model in a large class of plausible ‘dark sector’ DM models. However, significantly more complex interactions are possible, including Yukawa potentials (Feng et al. 2009; Feng, Kaplinghat & Yu 2010; Loeb & Weiner 2011), and cooling or atomic DM (Cyr-Racine & Sigurdson 2013; Buckley et al. 2014; Schutz & Slatyer 2015). The dynamics of SIDM was first implemented in cosmological simulations as a fluid (Moore et al. 2000) and then as elastic collisions between particles (Burkert 2000; Spergel & Steinhardt 2000; Davé et al. 2001; Colín et al. 2002; Strigari, Kaplinghat & Bullock 2007; Martinez et al. 2009; Koda & Shapiro 2011; Vogelsberger, Zavala & Loeb 2012).
Numerical studies combined with observations (the ellipticity of galaxy clusters, the abundance of and the core size of field dwarf galaxies) have constrained the cross-section of SIDM to be of the order of ∼0.1–1 cm2 g−1 (Loeb & Weiner 2011; Peter et al. 2013; Rocha et al. 2013; Zavala, Vogelsberger & Walker 2013). However, a variable SIDM cross-section (a decreasing function of the DM particles’ relative velocity) can preserve the ellipticity and density of galaxy clusters while producing cores in dwarf galaxies [Peter et al. 2013, but see Newman et al. (2013) for evidence for DM cores in clusters]. While weakening existing constraints, a variable SIDM cross-section is well motivated by ‘hidden sector’ particle physics models (Tulin, Yu & Zurek 2013). Further crucial constraints on large SIDM cross-sections (Elbert et al. 2014) come from the necessity of forming cores in very faint galaxies without evaporating the satellites of MW-like haloes and galaxy-sized haloes in clusters as they interact with a dense DM environment (Gnedin & Ostriker 2001; Vogelsberger et al. 2012).
Unfortunately, a large fraction of the astrophysically driven support for non-standard DM models has come so far from simplified simulations that lack the complexities of ‘baryon physics’ and follow only the assembly of the DM component (see the review by Brooks 2014). The necessity to couple a DM model with baryon physics comes from the existence of ‘bulgeless galaxies’, a problem that requires the removal of low angular momentum gas from galaxies (Binney, Gerhard & Silk 2001; van den Bosch, Burkert & Swaters 2001; Governato et al. 2010) through feedback processes (Brook et al. 2011). Further motivation for including baryon physics includes the necessity to quench SF in galaxy satellites (Klypin et al. 1999; Moore et al. 1999b; D'Onghia & Burkert 2003), especially if the SIDM power spectrum is similar to CDM at small scales and subhaloes survive evaporation (as found by Zavala et al. 2013).
Crucially, analytical and numerical work have shown that feedback lowers the central DM density in galaxies, creating gas outflows and repeated fluctuations in the gravitational potential (Mashchenko, Wadsley & Couchman 2008; Del Popolo 2009; Governato et al. 2010; Pontzen & Governato 2012; Teyssier et al. 2013; Di Cintio et al. 2014; Velliscig et al. 2014). This results in irreversible energy transfer to the DM (see also review by Pontzen & Governato 2014). These outflows, generated by a bursty SF, have strong observational support (van der Wel et al. 2011; Lundgren et al. 2012; Martin et al. 2012; Domínguez et al. 2015; Geach 2015). Bursty star formation history (SFH) have also been robustly associated with the build-up of the stellar content of galaxies in the 108–1010 M⊙ range (Tolstoy, Hill & Tosi 2009; Kauffmann 2014). The ability of feedback to dynamically heat the DM can potentially remove the need for SIDM at galactic scales. As a result, it is fundamental to identify the unique differences between CDM and SIDM when both models include an explicit treatment of the physics of galaxy formation.
This study is able to follow the evolution of field SIDM haloes at masses below ∼1010 M⊙ (Vmax1 < 40 km s−1). This is an important regime as (1) observational data are becoming robust (e.g. Papastergis et al. 2015), and (2) feedback processes become less efficient with declining Vmax (Governato et al. 2012; Peñarrubia et al. 2012; Di Cintio et al. 2014). The most recent simulations (Madau, Shen & Governato 2014; Governato et al. 2015; Oñorbe et al. 2015) show core formation when only 105.7–106 M⊙ of stars has formed. Also, it is often naively assumed that SIDM will form DM cores at all dwarf masses. However, at these small halo masses the trend of later assembly epoch of the first progenitor (Li, Mo & Gao 2008), and consequentially lower central densities (Avila-Reese et al. 2005), will affect the time-scale and extent of SIDM core formation in field galaxies beyond simple scaling calculations. Furthermore, the relative velocity of a halo and the surrounding DM background are crucial in determining the collision rate, boosting it in small haloes (that have intrinsic low σ). Our subset of DM-only simulations is also one of the first to compare very small field and satellite galaxies at similar mass and spatial resolution. The central density of field and satellite dwarfs (that move fast through a dense DM environment) may then be significantly different, but it has not been properly compared yet.
In this work, we adopt a constant velocity cross-section of 2 cm2 g−1 in the SIDM runs (a relatively large value to maximize its effects) and a common description of SF and feedback in both CDM and SIDM models. The SF and feedback prescriptions have been shown to form CDM galaxies with SF efficiency, photometric, and kinematic properties close to those of real ones (Oh et al. 2011; Munshi et al. 2013; Brooks & Zolotov 2015; Christensen et al. 2014a; Shen et al. 2014). These simulations are the first high-resolution simulations to compare the assembly of dwarf galaxies in CDM versus SIDM cosmologies including a description of SF and supernova feedback that creates realistic galaxies while creating DM cores through ‘DM dynamical heating’. Other recent numerical work (Vogelsberger et al. 2014) focused on small galaxies in SIDM and explored the role played by a variable cross-section; however, the feedback recipe implemented in their work does not generate DM cores.
In Section 2 we describe the simulation and the code used. In Section 3 we present the results, which are then discussed in Section 4.
METHODOLOGY
ChaNGa, SF, and bursty feedback with outflows
The simulations were run in a full cosmological context and to a redshift of zero using the N-body Treecode + SPH code ChaNGa (Jetley et al. 2008; Quinn et al. 2013; Menon et al. 2015).2 ChaNGa includes standard physics modules previously used in gasoline (Wadsley, Stadel & Quinn 2004; Wadsley, Veeravalli & Couchman 2008; Stinson et al. 2013) including a treatment of metal line cooling, self-shielding, cosmic UV background, SF, ‘blastwave’ SN feedback, and thermal feedback from young stars (Stinson et al. 2006, 2013). The SPH implementation includes thermal diffusion (Shen, Wadsley & Stinson 2010) and eliminates artificial gas surface tension through the use of a geometric mean density in the SPH force expression (Ritchie & Thomas 2001; Menon et al. 2015; Governato et al. 2015). This update better simulates shearing flows with Kelvin–Helmholtz instabilities. For consistency with our previous work comparing CDM and warm dark matter (WDM) scenarios, we adopted the same feedback and SF parameters as in Governato et al. (2015). A Kroupa initial mass function is assumed (Kroupa 2001) and the density threshold for SF is set at 100 amu cm−3. Limiting SF to dense gas regions is a realistic approach and concentrates feedback energy (Brook et al. 2012; Agertz & Kravtsov 2015; Christensen et al. 2014b). 100 per cent of SN energy is coupled to the surrounding gas.
SIDM implementation and analytical expectations
In practice, to simulate interactions for discrete N-body DM particles, we use equation (1) as the implied probability for a particle to scatter. This assumption is valid as Δt approaches zero or numerically where Δt is chosen to be much smaller than needed to avoid multiple collisions. At each time step, our numerical code calculates the relative velocity and density ρ using the same functional SPH kernel as in hydrodynamical calculations of each DM particle in relation to its 32 nearest neighbours. These values are used to calculate the probability that the DM particle interacts with one of its neighbours. Similar to Vogelsberger et al. (2012), a scattering event may occur at each time step between particles i and j if a uniform random variable in the interval (0,1) is less than Pij/2 (the probability is divided by 2 in order to account for the fact that each set of particles are compared to each other twice). While producing similar results, this approach differs slightly from the one adopted in Rocha et al. (2013), where collisions are defined between DM particle pairs and the probability of interaction P(i|j) is explicitly = P(j|i). When a particle collision is detected, we isotropically and elastically scatter the particles to random angles.
One important conclusion to draw from equation (A1) is that not every SIDM model will necessarily form significant cores in the smallest haloes. Low halo peak velocities and low central densities (at a fixed radius) may result in τSI comparable to the lifetime of a halo and therefore in the preservation of cusps. Another important consequence is that in SIDM the central densities of very small satellite haloes could be differentiated from those of their field counterparts by the interaction with the DM halo of a more massive host as the orbital velocity is much higher than the internal velocities of the satellite. We test these analytical predictions in the next section, where we present results of simulations that resolve the internal structure of DM haloes smaller than most previous SIDM studies. Observational evidence of DM cores in small field haloes where baryonic processes may be inefficient (Vmax < 20–30 km s−1) and in satellite galaxies (which move at 100–200 km s−1 in an ∼200–1000 × ρcrit DM field) can then provide useful lower limits to the SIDM cross-section.
CDM AND SIDM SIMULATIONS
In all simulations, we assumed a Λ dominated cosmology (Ω0 = 0.26 Λ = 0.76, σ8 = 0.77, n = 0.96) and used the ‘zoom-in’ technique to achieve high resolution in the regions of interest (Katz & White 1993). The gravitational force spline softening length is in the range 64–86 pc (Power et al. 2003) and the smoothing length for the gas component is allowed to shrink to 0.1 the force softening. Simulations start at z = 120–100. The combination of simulations (see Table 1) allows us to compare the effects of SIDM and baryon physics on a range covering almost four orders of magnitude in halo masses and a variety of environments from the field to the dense region within the virial radius of a large field disc galaxy.
Cosmological simulations of well-resolved haloes with mass <1010 M⊙ (corresponding to a halo peak velocity Vmax < 30 km s−1) are particularly relevant for SIDM, as baryonic effects at these scales should be limited (Governato et al. 2012; Peñarrubia et al. 2012). Based on equation (2), the ability of SIDM to lower the central density of haloes depends on the DM ρ and the typical particle velocity, which is lower in less massive haloes. Interestingly, previous CDM simulations have suggested that the central density of small mass field haloes decreases with their halo mass (Avila-Reese et al. 2005; Li et al. 2008). In a SIDM scenario, extending this trend to very small haloes could prevent the formation of low-density central cores by increasing the time-scale of DM–DM collisions.
DM-only simulations: environmental effects and cuspy haloes at Vmax < 30 km s−1
To study the structure of a significant sample of DM haloes in a range of environments, we simulated four different regions with the zoomed-in approach (Katz & White 1993). The first three regions (Table 1) are centred on filamentary structures with a density close to average measured inside a sphere of 5 Mpc in radius. The largest one of them is nicknamed ‘The Forty Thieves’ and includes several tens of haloes with Vmax < 30 km s−1, equivalent to a mass range 108–1010 M⊙, where the minimum mass refers to haloes with at least 50 000 DM particles within the virial radius. To complement this data set, a high-resolution simulation of massive haloes and its system of satellites has been included (h148). The haloes in this simulation have mass and spatial resolution similar to their ‘40 Thieves’ counterparts and mass and spatial resolution better by a factor of 2 compared to recent work by Vogelsberger et al. (2012) and Zavala et al. (2013). In Appendix A we verified that our results and the Monte Carlo implementation of SIDM collisions are not affected by resolution effects.
Simulations and physics parameters explored in our simulations. All SIDM runs adopt σSIDM = 2 cm2 g−1. The mass range shows haloes with at least 50 000 DM particles within their virial radius. The main haloes in each volume are studied with several million particles each. The DM-only subsample is one of the first to simulate a sample of field and satellite haloes at similar mass and spatial resolution. This approach allowed us to study the effect of the environment on the DM distribution of the haloes in the two populations.
| Name | Physics | DM/gas particle mass (M⊙) | Force softening (pc) | Halo mass range (M⊙) |
|---|---|---|---|---|
| h516CDM | SF and DM-only | 1.6 × 10⁴/3.3 × 103 | 86 | 109 to 5 × 10¹⁰ |
| h516SIDM | SF and DM-only | 1.6 × 10⁴/3.3 × 103 | 86 | 109 to 5 × 10¹⁰ |
| h2003CDM | SF and DM-only | 0.67 × 10⁴/1.4 × 103 | 64 | 4 × 10⁸ to 1 × 10¹⁰ |
| h2003SIDM | SF and DM-only | 0.67 × 10⁴/1.4 × 103 | 64 | 4 × 10⁸ to 1 × 10¹⁰ |
| 40Thieves-CDM | DM-only | 0.81 × 10⁴ | 64 | 4 × 10⁸ to 2.7 × 10¹⁰ |
| 40Thieves-SIDM | DM-only | 0.81 × 10⁴ | 64 | 4 × 10⁸ to 2.7 × 10¹⁰ |
| 40Thieves-SIDM.hr | DM-only | 0.24 × 10⁴ | 64 | 1.25 × 10⁸ to 2.7 × 10¹⁰ |
| h148CDM | DM-only | 1.93 × 10⁴ | 86 | 109 to 2 × 10¹² |
| h148SIDM | DM-only | 1.93 × 10⁴ | 86 | 109 to 2 × 10¹² |
In Fig. 1, we show the density measured at 500 pc (a radius at which the rotation curves of many dwarf galaxies have been resolved; e.g. Oh et al. 2011) for all resolved haloes in our h148 (×) and ‘the 40 Thieves’ (+) DM-only simulations as a function of Vmax. We then overplot lines of fixed τSI for 1 and 5 Gyr. SIDM and CDM show identical central DM densities if the typical scale for DM interactions is longer than 5 Gyr. At larger peak velocities (and halo masses) with shorter time-scales for interaction, the SIDM densities decrease compared to their CDM counterparts and fall in a valley between the 1 and 5 Gyr lines, matching results from previous works (Vogelsberger et al. 2012; Rocha et al. 2013). In other words, SIDM interactions force the DM density to drop until, going to smaller and smaller halo masses, the interaction time-scale rises to a significant fraction of the Hubble time and SIDM (with σ = 2 cm2 g−1) is not effective anymore. Fig. 2 shows the SIDM versus CDM ratio of the enclosed mass as a function of radius for paired haloes from the ‘40 Thieves’ run. At radii currently tested by observations (100–500 pc), but entirely neglecting baryonic physics, the difference between the two models decreases rapidly. A factor of 2 in the DM content within 100–500 pc of faint field dwarfs could be revealed by large spectroscopic samples of the associated stellar populations (Walker, private communication). We also verified that at larger Vmax the density profiles of the DM-only haloes match those recently published in Elbert et al. (2014), which at Vmax ∼ 35 km s−1 form significant cores (see also the next section where the effect of baryons in these larger systems is included). This result confirms our simple analytical expectations and shows that even with a significant constant SIDM cross-section, DM cores rapidly become smaller than our resolved scale (∼100–200 pc or twice the spline kernel softening) in field haloes with virial mass <1010 M⊙ and Vmax < 30 km s−1. Confirming the results from Li et al. (2008) and extending them to much smaller halo masses and higher resolution, we verified that the increased τSI at small halo masses comes not only from a lower σdm but also from lower cusp densities, possibly due to the later epoch of collapse of the central regions of a halo. We verified that the DM density within the central 250 pc decreases by a factor of 8 in CDM haloes with mass of 108 M⊙ compared to haloes of 1010 M⊙. If we look at the average densities as a function of Vmax, another difference emerges between the SIDM field (circled red crosses) and satellites (red crosses), with satellite haloes showing central densities lower by about a factor of 2 compared to field haloes of similar Vmax. This important environmental difference could be due to the satellites forming their central regions earlier or to the significant boost to ρ and vmax in equation (A1) due to their orbiting (1) inside the dense halo of a much more massive host and (2) at a much higher speed than their internal velocity dispersion. Our simulations were able to highlight this difference as our simulations resolve field and satellites haloes with significantly lower peak velocities (10–20 km s−1) than in previous works.

DM-only simulations: the DM density measured at 500 pc as a function of halo maximum velocity and DM model. Blue crosses: CDM, red crosses: SIDM. Circled symbols correspond to isolated haloes, non-circled symbols show the satellites of the MW-sized, h148 halo. At small halo masses, the central densities of CDM and SIDM haloes do not differ substantially, while at larger velocities/halo masses SIDM-only haloes have lower central densities than their CDM-only counterparts. This difference can be understood in terms of the dotted lines which show the maximum time-scale τSI at which collisions are significant in the SIDM case (see the text for details). This result shows that fixed cross-sections commonly adopted at the scale of larger systems (0.1–2 cm2 g−1) would not be sufficient to form kpc-sized cores in the smallest observable field haloes with Vmax < 30 km s−1. In the Vmax = 30–60 km s−1 range, SIDM satellites have central densities lower by a factor of 2 compared to their field counterparts, due the added boost to SIDM collisions coming from satellites orbiting at high velocity in the dense DM halo of the host.
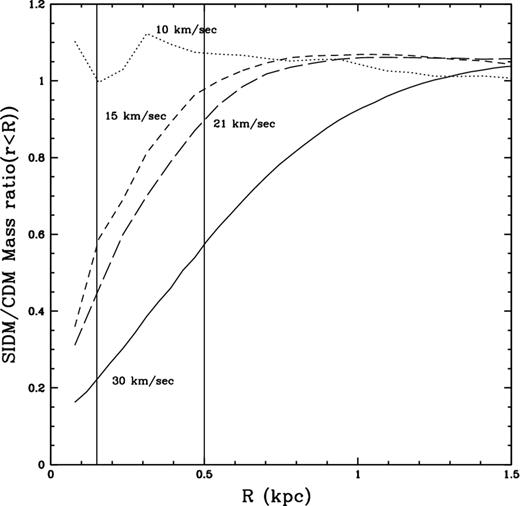
The relative DM content as a function of radius in DM-only simulations: the ratio of the cumulative DM content measured for a set of small haloes over the 0–1.5 kpc radial range (from the 40 Thieves run). Each CDM halo was matched with its ‘twin’ halo in the SIDM simulation. The spline kernel force resolution is 64 pc. Vertical lines mark 150 and 500 pc (2.3 and 5 softening lengths). With our adopted cross-section of 2 cm2 g−1, small CDM and SIDM become progressively difficult to differentiate, with DM content at a given radius being within a factor of 2 in the two cosmologies. Detecting such a difference in field dwarfs could require a next-generation telescope (Walker, private communication). A SIDM with a variable cross-section could show a more significant difference compared to CDM.
The main result from this section is that evidence of DM cores in real galaxies with Vmax < 30 km s−1 would constrain the SIDM cross-section to values σ ≫ 2 cm2 g−1 when the typical DM velocity dispersion is low. If significant DM cores are found in these galaxies, their existence would give support to models with a variable SIDM cross-section that is higher (20 cm2 g−1, see equation 2) at small halo masses and then declines rapidly at the scale of groups and galaxy clusters as constraints at that scale support small cross-sections σ < 1 cm2 g−1. We plan to further explore the relative effect of stronger SIDM interactions on satellites compared to field haloes in future work.
Simulations with SF: SIDM similar to CDM when baryon physics are relevant
We focused our hydrodynamical simulations on the largest galaxies formed in the filamentary regions ‘h516’ and ‘h2003’. These are two well-studied fields: h2003 is the same halo simulated in Governato et al. (2015), while h516 is the main halo of Governato et al. (2010) and of the ‘7 dwarfs’ galaxies sample studied in Shen et al. (2014) and Madau et al. (2014). The SF parameters in our study were identical for all CDM and SIDM simulations. They also correspond to the fiducial ‘g5’ runs in Governato et al. (2015), where we explored the effects of different feedback and SF recipes in the context of comparing the formation of dwarfs in CDM versus WDM scenarios. Here we emphasize that our SF implementation creates repeated starbursts and gas outflows with significant loading factors [gas mass ejected from the centre divided by star formation rate (SFR)]. Multiwavelength evidence for outflows, analysis of the stellar populations in the SDSS dwarfs, and realistic colour-magnitude diagrams (CMDs) (Governato et al. 2015) give strong support to our implementation of SF. This approach differs from the SIDM study of Vogelsberger et al. (2014) where less bursty feedback still removes gas from galaxy centres, but does not create substantial DM cores. The baryonic content of the galaxies in our study is summarized in Table 2.
The total halo mass, stellar and H i masses, and Vmax (in km s−1) for some representative haloes in the CDM runs with SF and their SIDM counterparts. z = 0 stellar masses were measured within 2.5 kpc. h516b is the second most massive halo in the h516 run.
| Run | Halo mass | Vmax | Stellar mass | H i mass |
|---|---|---|---|---|
| ID | CDM/SIDM | (km s−1) | CDM/SIDM | CDM/SIDM |
| h516 | 4.1 ×10¹⁰ | 58.4 | 6.2/4.9 ×107 | 3.3/2.0 ×108 M⊙ |
| h516b | 1.1 ×10¹⁰ | 33.0 | 9.8/14.7 ×106 | 1.6/0.94 ×108 M⊙ |
| h2003 | 1.1 ×10¹⁰ | 30.5 | 3.1/3.4 ×106 | 5.0/16.6 ×106 M⊙ |
Fig. 3 (left-hand panel) compares the density profiles of the DM component of galaxies h516 and h2003. In DM-only simulations, haloes with masses >1010 M⊙ have cuspy profiles (halo h2003: cyan dashed, halo h516: blue dotted). Once baryon physics and outflows are introduced, flatter DM profiles are created in both SIDM and CDM cosmologies. The blue dashed (CDM-only) versus blue (CDM+SF) lines and the red (SIDM+SF) show results for h516. The cyan dashed (CDM-only) versus cyan solid (CDM+SF) lines and the magenta (SIDM+SF) lines show results for h2003, the smaller halo. In both CDM and SIDM models, the central cuspy profiles have been significantly flattened inside 1 kpc. h516, the most massive halo studied with the inclusion of SF, is the one where the central DM density decreases the most. This result is consistent with previous findings (Governato et al. 2012; Di Cintio et al. 2014), showing that the efficiency of core formation peaks in haloes with Vmax ∼ 50 km s−1.
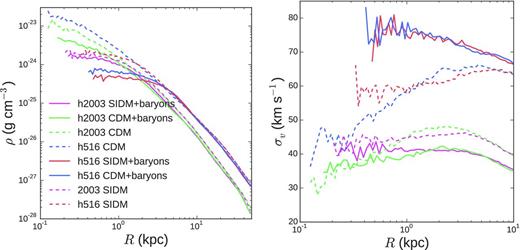
Radial profiles. Left: the radial density profile of the DM component for haloes/galaxies h516 and h2003. Right: the velocity dispersion of DM component in the same haloes/galaxies – h516-CDM: blue; h516-SIDM: red; h2003-CDM: cyan; h2003-SIDM: magenta; dashed: DM-only runs. Both density and dispersion profiles become similar in CDM versus SIDM once baryonic processes are introduced.
Fig. 3 (right-hand panel) compares instead the velocity dispersion profiles of the DM component in haloes h516 and h2003. As for the density profiles, DM-only runs of different cosmologies have different local DM velocity distribution profiles: CDM haloes show a decreasing dispersion closer to the halo centre while the SIDM haloes show a rather flat profile. This difference, a result of the energy transfer to the centre of the halo due to collisional processes, had been considered a strong signature of SIDM. However, this difference is erased by the introduction of bursty feedback, which creates significant DM cores in the CDM haloes. ‘Dynamical heating’ also causes the velocity dispersion profiles of all haloes to flatten out.
Fig. 4 shows the stellar mass/halo mass ratio of the haloes we simulated with the inclusion of baryon physics, showing that they follow the stellar mass–halo mass relation inferred using local data and the abundance matching technique (Brook & Di Cintio 2015; Garrison-Kimmel et al. 2014). This is particularly relevant as producing the correct number of stars is necessary to estimate the minimum mass at which baryonic processes can originate cores. After this paper was submitted, Oñorbe et al. (2015) published results from a simulated CDM halo of similar total mass, which also formed about 106 M⊙ in stars, leading to a cored DM profile.
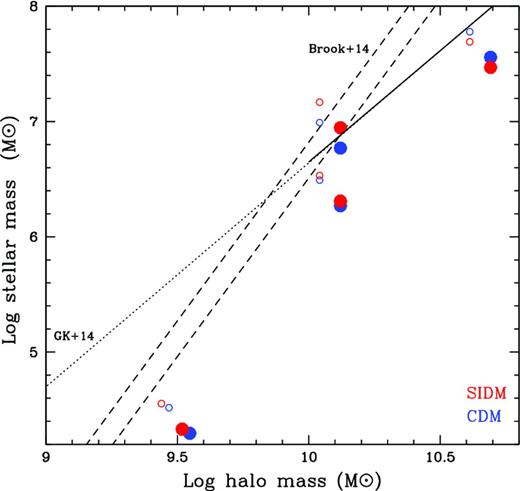
Stellar mass–halo mass relation for the simulated galaxies. Dashed lines and solid lines show the relation obtained from Local Group data (Brook & Di Cintio 2015; Garrison-Kimmel et al. 2014). The relations are extrapolated below ∼106.5 M⊙ due to sample incompleteness (dotted lines). Circles show the raw data; solid dots show the simulation data correcting for observational and simulation biases (Munshi et al. 2013) in measuring stellar and halo masses. Overall the simulations produce the right number of of stars. The most massive halo converts about 1 per cent of gas into stars. The rapid drop in SF efficiency at halo masses below 1010 M⊙ is due to the introduction of ‘early feedback’ (see the text).
Fig. 5 shows the DM central densities as a function of halo peak velocity once SF is included. The comparison with Fig. 1 is striking: where at Vmax > 30 km s−1 CDM was clearly differentiated from SIDM, now the central density of CDM and SIDM haloes is almost identical over the whole 10–50 km s−1 range. This result clearly illustrates how predictions from DM-only runs can be completely superseded by the addition of the complex baryon–DM interactions.
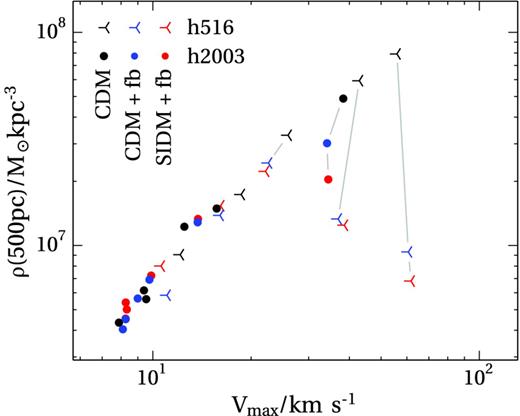
Effects of baryons physics: the central density of CDM-only haloes (blue) versus their SIDM (red) counterparts run with baryon physics and bursty feedback. Lines connect the DM-only runs of h516 and h2003 to their counterparts with baryons. For our choice of the SIDM interaction cross-section and for haloes with Vmax > 50 km s−1(corresponding to stellar masses larger than 108 M⊙), the central mass of CDM and SIDM haloes is similar, but significantly lower than the predictions of CDM-only runs. Due to low DM interaction rates and lack of bursty outflows, at lower halo masses both cosmologies give similar predictions: cuspy central DM profiles. Larger SIDM cross-sections would be able to differentiate the various models in haloes with Vmax < 20 km s−1 as DM cores would then form in galaxies were baryon physics do not play a major role.
In Fig. 6, we investigate how the slope of the DM profile (measured at 500 pc) evolves with time in a sample of field haloes with a range of masses. As the mechanisms of core formation differ (potential fluctuations linked to SF versus SIDM collisions), the time evolution of the DM slope may also be significantly different. We have found that the evolution of the systems can be roughly divided into three stellar mass ranges. Present-day systems with stellar masses larger than 108 M⊙ (Vmax > 50 km s−1 as in classic field dwarfs) had cored DM profiles since redshift >4, with no significant difference between SIDM and CDM (top panel). In the SIDM-only run, the DM core forms more slowly than when the effect of baryons is included. The effect of baryon feedback on the DM profile is clearly detectable as soon as about 106 M⊙ of stars has been created (see also Peñarrubia et al. 2012; Governato et al. 2015). In galaxies with present-day stellar masses below 107–108 M⊙, the effect of ‘dynamical heating’ induced by feedback is progressively reduced (Governato et al. 2012, 2015; Di Cintio et al. 2014). At the radial scale of 500 pc, the CDM and SIDM haloes of h2003 show DM profiles that start cuspy and then slowly develop a flatter profile. In both SIDM and CDM, the process is more gradual compared to more massive systems, due to a number of factors (SFR are lower and τSI is longer). However, the inclusion of baryonic processes again makes the galaxy evolve similarly in CDM versus SIDM. By redshift z < 1, the difference in DM slopes is not significant enough to discriminate between SIDM and CDM. Halo h2003 was also recently run in a WDM cosmology (Governato et al. 2015). Similar to the CDM case, the WDM cusp turned into a core over time, due to bursty feedback. By z = 0, the central DM distribution of halo h2003 is similar in CDM, WDM (Governato et al. 2015), and SIDM (this work).
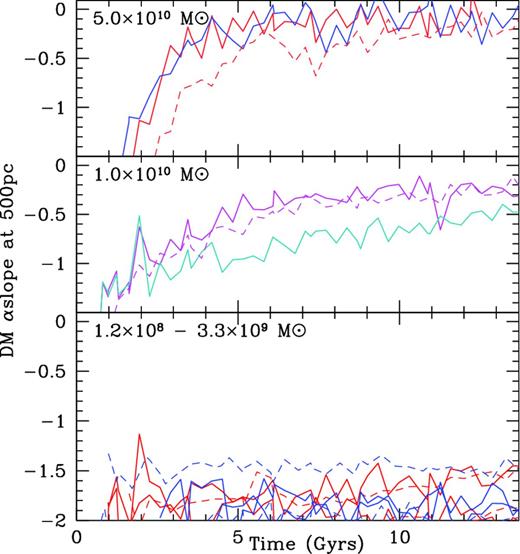
The slope α of the DM density profile in SIDM and CDM over different mass ranges: blue and cyan: CDM, red and magenta: SIDM, solid lines: baryon+DM runs, dashed lines: DM-only runs. Top: halo h516. The DM slope evolves rapidly and in a similar way in both CDM and SIDM, as dynamical heating is very efficient at this scale. Middle: halo h2003 (blue: CDM, red: SIDM). Bottom: a collection of field haloes with total mass <109 M⊙ from our simulations. SF efficiency is too low and the SIDM interaction rate is too low to create cores.
At even smaller masses, the evolution of the DM slope α with the inclusion of baryonic processes (continuous lines) confirms the results from the DM-only runs (dashed lines). SF at such small scales is strongly inhibited by the cosmic UV field. Similarly, at such small masses the SIDM interaction time-scale becomes long compared to the Hubble time and the survival time of the halo. Hence, the central DM slope measured at 500 pc is not significantly different in SIDM versus CDM haloes, as predicted by the empirical calculations in the previous section. The failure of SIDM to form substantial DM cores in very faint dwarfs with host haloes with mass <1010 M⊙ had not been explored in previous numerical works, where high-resolution simulations mostly focused on haloes more massive than 1010 M⊙.
Overall, the inclusion of SF and baryonic processes erases the differences seen in the DM-only runs. At the scale of dwarf galaxies with Vpeak ∼ 30–50 km s−1, energy transfer to the DM makes the DM distribution at the centre of galaxies flatter than a Navarro–Frenk–White (NFW) profile and almost identical in CDM versus SIDM. As a result, current constraints on the SIDM cross-section from dwarf-sized field come out considerably weakened and will have to be reconsidered. Moreover, we predict (see Fig. 1) that a SIDM cross-section >10 cm2 g−1 would be necessary to create DM cores in smaller haloes with Vmax < 10 km s−1. The shapes of galaxy clusters require a SIDM cross-section smaller than 1 cm2 g−1 (Peter et al. 2013). If cores exist in dwarf galaxies, these results argue in favour of a variable SIDM cross-section (see also Vogelsberger et al. 2012).
SFHs and assembly of the baryonic component
In this section, we analyse the z = 0 baryonic distribution of the galaxies that form stars in our simulations, while focusing on the two main haloes: h2003 and h516. We verified that in both CDM and SIDM cosmologies the stellar mass of galaxy h516 follows an exponential profile with no spheroidal component. The projected gas and stellar densities of galaxy h516 are shown in Fig. 7, showing a similar distribution in CDM versus SIDM. Both stellar discs are thick and dynamically hot (Fig. 7) and more extended than the CDM version of h516 described in Christensen et al. (2014a), an effect of the introduction of early feedback (Trujillo-Gomez et al. 2015; Roškar et al. 2014). Confirming the visual impression from Fig. 7, we verified that the radial distribution of stars at z = 0 does not change significantly in the CDM galaxies versus their SIDM counterparts, both following a trend for larger systems to have more extended stellar systems and roughly consistent with observational data. The half-light radius for h516b (Table 1) is, for example, 2.0 kpc in SIDM, versus 1.8 kpc in CDM. This is a different outcome compared to the results of a less bursty SF scenario as the one studied in Vogelsberger et al. (2014), which followed galaxies in a similar mass range to ours. In their simulations, the SIDM distribution is less concentrated compared to the CDM one, leading ‘to dwarf galaxies with larger stellar cores and smaller stellar central densities’. In our simulations, the dynamical coupling of baryons to DM, driven by fast and repeated outflows, shapes the stellar distribution and leads to a similar baryon distribution and content.
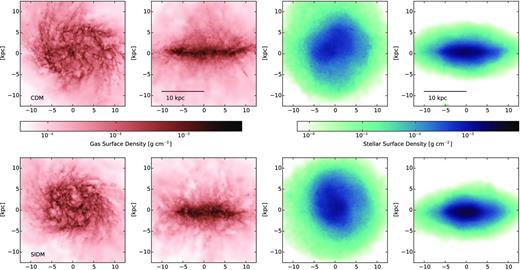
The projected colour density map of the baryon distribution in galaxy h516. Top: CDM. Bottom: SIDM. Left-hand panels: projected gas density at z = 0 seen edge-on and face-on. Right-hand panels: stellar projected density at z = 0. The stellar discs are relatively thicker than those in earlier simulations (Governato et al. 2010), an effect of the introduction of ‘early feedback’ from young stars. We verified that in both models the stellar distribution is exponential, with a similar disc scalelength and lack of a central dense spheroid.
Furthermore, with the adopted SF prescription, the SFHs of the galaxies formed in the CDM model look very similar to the SIDM counterparts. This is most likely due to two main reasons: (1) the assembly rate of both DM and baryons, being driven by the large-scale structure, remains unchanged in SIDM and (2) there is no difference in the central DM distribution between the two models as it responds quickly to the effects of feedback. As an example, Fig. 8 shows the SFH of halo h516 in the CDM and SIDM models, which show a very similar time evolution, peaking 5 Gyr after the big bang. Overall, SIDM and CDM haloes have almost identical DM masses by z = 0 and the SF efficiency is similar, within 20 per cent in the two models. This result differs from the CDM versus WDM comparison in Governato et al. (2015), where the WDM0 version of h2003 formed only half the stars due to the delayed assembly of the halo (see also Colín et al. 2015). However, changes in the time-scale and intensity of the individual SF events could be driven by subtle effects and still differentiate between CDM and SIDM, for example a shallower density profile could drive more gas instabilities that lead to radial inflows and increase the burstiness of SF, or, on the other hand, lower DM densities could slow down the collapse of gas and reduce SF in the SIDM scenario. We quantified the burstiness of SF in SIDM versus CDM by measuring the dispersion in SFR measured in ΔTSFR intervals, where ΔTSFR was varied from 106 to 109 yr (for a similar approach but different definition of burstiness, see Hopkins et al. 2014). Measuring ΔTSFR over hundreds of randomly sampled intervals, bursty SF at a given time-scale shows a large dispersion if the SF rate at a time T + ΔTSFR differs substantially from the SFR at a previous time T. The right-hand panel of Fig. 8 shows that the burstiness measured over different time-scales was similar for both halo h516 and h2003 in both models. Both h516 and h2003 show an SFR dominated by small time-scale fluctuations, with a similar dependence on time-scale and halo mass, with the less massive haloes having a burstier SF at all time-scales (a result also seen in simulations with different feedback models; e.g. Hopkins et al. 2014). Observations of nearby stellar populations and comparisons with simulations (Tolstoy et al. 2009; Kauffmann 2014; Weisz et al. 2014; Governato et al. 2015) strongly support a bursty build-up of the stellar content of dwarf galaxies. We verified that our set of simulations qualitatively reproduce the fraction of stars formed in bursts as estimated in Kauffmann 2014): 20–50 per cent with a larger fraction formed in the less massive system. Bursts were defined as periods with SF >2–4 × 〈SFH〉 and duration of 107–108 yr. A burstier implementation of our SF model (as one that neglected H i self-shielding) would be ruled out by excessive structure in the stellar CMD, as discussed in Governato et al. (2015).
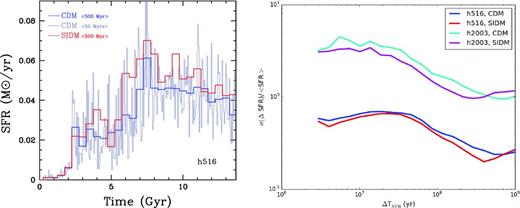
The SFR as a function of cosmic time. Left-hand panel: halo h516 in CDM and SIDM cosmologies. Both galaxies have extended, gas-rich discs and negligible bulges. Right-hand panel: the burstiness of models h516 and h2003 in CDM and SIDM, measured at different time-scales (see the text for a definition). SF does not differ significantly in CDM versus SIDM, and appears to be mostly regulated by feedback and accretion rates.
Overall, within our small sample of galaxies, we do not find evidence of large differences in the baryonic content and distribution in galaxies formed in a CDM versus SIDM model.
Finally, Fig. 9 shows the rotation curves Vc (defined as |$\sqrt{GM(<r)/r}$|) of our galaxies h516 and h2003 compared to estimates from a sample of local dwarfs (open squares; from Wolf et al. 2010; Weisz et al. 2014). The left-hand panel shows the well-known result that haloes formed in CDM-only simulations have higher central mass densities than most observed dwarfs (although significant uncertainties remain on the observational estimates). At the same time, SIDM-only runs with a range of cross-sections (Elbert et al. 2014) show better agreement with observational estimates as the central DM densities are lower. However, the right-hand panel of Fig. 7 shows that once baryon physics are introduced, the central mass distribution (DM+baryons) of CDM dwarfs matches the observational data, equally well, without requiring SIDM. Recent works have compared dwarf galaxies in the Local Group (Brook & Di Cintio 2015; Sawala et al. 2015) and MW satellites (Zolotov et al. 2012; Arraki et al. 2014) with simulations. They have shown how the introduction of feedback (and tidal processes for satellites) generates a realistic Mstar–Mhalo relation, as galaxies at a fixed Mstar are hosted by more massive haloes than when a universal NFW profile is assumed in the analysis.3 This result shows how the perceived discrepancy between the observed number density of field galaxies as a function of Vmax and that of the underlying halo population is naturally accounted for in a CDM context where feedback is introduced and the central total density is lowered. In good agreement with results from our simulations, the revised abundance matching from Brook & Di Cintio (2015) predicts that field galaxies are hosted in haloes with mass >5 × 10⁹ M⊙, with most haloes below that threshold being devoid of stars. Our results provide direct evidence that SIDM-only simulations mimic the effects of feedback, but also that when bursty feedback is introduced, SIDM galaxies are essentially indistinguishable from their CDM counterparts. Both SIDM and CDM models create galaxies with mass distributions and observable properties in broad agreement with the observed ones.
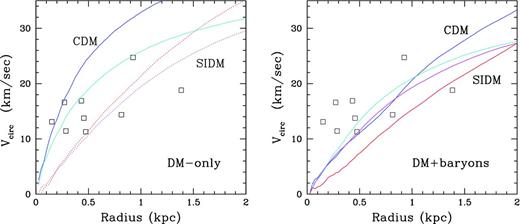
The rotation curves Vc of haloes h516 and h2003 in CDM (blue and cyan) and SIDM (red and magenta) compared with the observational constraints from a sample of Local Group field dwarfs (Wolf et al. 2010; McConnachie 2012; Weisz et al. 2014). The introduction of feedback processes lowers Vc out to at least 2 kpc, where mass decomposition based on H i kinematics is crucial (Vc is defined as = (GM/r)1/2). Softening is 64 pc for h2003 and 86 pc for h516.
CONCLUSIONS
We studied a set of cosmological simulations of field dwarf galaxies in CDM and SIDM. The SIDM simulations include for the first time a description of bursty SF and feedback that creates potential fluctuations able to lower the central DM density of haloes where at least 106 M⊙ of stars has formed. The force resolution of our simulations (64–86 pc with a spline kernel softening) allows us to resolve with many thousands of particles the central regions of haloes (and millions to the virial radius) down to halo masses where the impact of SF will not play a major role and where the effect of SIDM alone dominates. A relatively large value (2 cm2 g−1) for the SIDM cross-section was chosen to maximize its difference from the CDM model. We have also run a set of DM-only simulations that allowed us to study the evolution of a uniform resolution set of DM haloes down to masses of only few times 108 M⊙ (equivalent to Vmax < 20 km s−1) both in the field and in the dense environment of a more massive host. Our results can be summarized by three main findings.
Once SF and resulting feedback are introduced, the central DM mass distribution and velocity dispersion become similar for CDM and SIDM galaxies with stellar masses in the 106–108 M⊙ range and circular velocity 25–50 km s−1 (Fig. 3). At the scale of 0.5–2 kpc, the total matter content is in good agreement with observational estimates of Local Group dwarfs. This result differs starkly from the predictions of DM-only simulations or simulations where energy feedback does not lead to core formation (Boylan-Kolchin, Bullock & Kaplinghat 2011; Garrison-Kimmel et al. 2014).
Analytical expectations and simulations show that with a fixed SIDM cross-section of 2 cm2 g−1 the DM central density and internal velocities of haloes with mass below 109 M⊙ are too low to have a significant number of DM–DM interactions. Such SIDM haloes remain cuspy when observed at a scale of 500 pc, and show an enclosed DM mass content lower by about only a factor of 2 compared to their CDM counterparts (Figs 1 and 2). This result poses an interesting lower limit to the SIDM cross-section in haloes associated with galaxies with stellar masses below 106 M⊙. If kpc-sized DM cores are found in these galaxies, their existence would give support to models with a variable SIDM cross-section that is high (∼10–20 cm2 g−1, see equation 2) at small halo masses and then declines rapidly at the scale of galaxies and clusters. Large cross-sections at dwarf scales are also suggested by DM-only studies (Elbert et al. 2014). Such large cross-sections may have a detectable effect on the SFHs of dwarf-sized systems, but could also make galaxy satellites easier to disrupt. Our simulations also highlight the relative environmental effects of the enhanced interaction rate at the centre of very small satellites compared to their field counterparts, due to rapid orbital velocities in the dense haloes of a massive host. This relative difference offers the potential of using faint galaxies to constrain the cross-section of SIDM as a function of the DM velocity.
Once regulated by feedback, the SFHs (Fig. 7), stellar and gas content, and spatial distribution do not differ substantially in the CDM versus SIDM model, both forming gas-rich galaxies with bulgeless discs which resemble real ones.
These results lead to potentially important implications for SIDM models. As baryons lead to a drastic change in the mass distribution of central regions of typical dwarf galaxies with Vc ∼ 30–60 km s−1, many of the current bounds on the SIDM cross-section at different mass scales will need to be re-examined. After the introduction of realistic descriptions of SF and feedback, both CDM and SIDM form dwarf galaxies with DM distribution and observable properties in broad agreement with observational data. As a result, while certainly not excluded, SIDM is not necessary to solve the problem of the excess of DM at the centre of simulated dwarf galaxies with Vmax > 30 km s−1. Furthermore, because the effect of SIDM becomes negligible at very small galaxy/halo masses even with a relatively large constant velocity cross-section (2 cm2 g−1), SIDM with a velocity-dependent cross-section will become necessary if even very faint dwarf galaxies are observed to have DM cores. This work highlights how simulations that (a) include realistic SF and feedback processes and (b) study a large sample of faint dwarfs are necessary to take advantage of astrophysical constraints on DM models.
ABF was funded by Washington NASA Space Grant Consortium, NASA Grant NNX10AK64H. FG and TQ were funded by NSF grant AST-0908499. FG acknowledges support from NSF grant AST-0607819 and NASA ATP NNX08AG84G. AP is supported by a Royal Society University Research Fellowship. Some results were obtained using the analysis software pynbody, (Pontzen et al. 2013). ChaNGa was developed with support from National Science Foundation ITR grant PHY-0205413 to the University of Washington and NSF ITR grant NSF-0205611 to the University of Illinois. We thank Haibo Yu, Sean Tulin, Matt Walker, and Lucio Mayer for stimulating discussions and a careful reading of the manuscript. We also thank the referee for constructive comments.
where Vmax is defined as the peak of the rotation curve, with Vrot = (GM/r)1/2.
ChaNGa is part of the Agora group, a research collaboration with the goal of comparing the implementation of hydrodynamics in cosmological codes (Kim et al. 2014). ChaNGa is available at http://www-hpcc.astro.washington.edu/tools/changa.html
In a halo model with a central mass density lower than NFW, the Vcirc measured at ∼1 kpc translates to the same Vpeak and hence halo mass of an NFW halo. As a consequence, an observed Vcirc translates to higher halo host mass than when a more concentrated NFW halo is assumed.
REFERENCES
APPENDIX A: THE SIDM IMPLEMENTATION
We verified our implementation of SIDM by comparing analytical predictions of the number of DM interactions to simulations of DM haloes with a Hernquist density profile (Hernquist 1990) (Fig. A1). We then demonstrate the formation of a flat core and the signature flat SIDM velocity dispersion profile, starting from an NFW profile with a cuspy density profile and a raising velocity dispersion (Navarro, Frenk & White 1996). Our implementation code closely replicates published results of the predicted number of SIDM collisions as a function of halo mass and local density and the evolution of the central density profile (Vogelsberger et al. 2012; Rocha et al. 2013) (Figs A1 and A2).
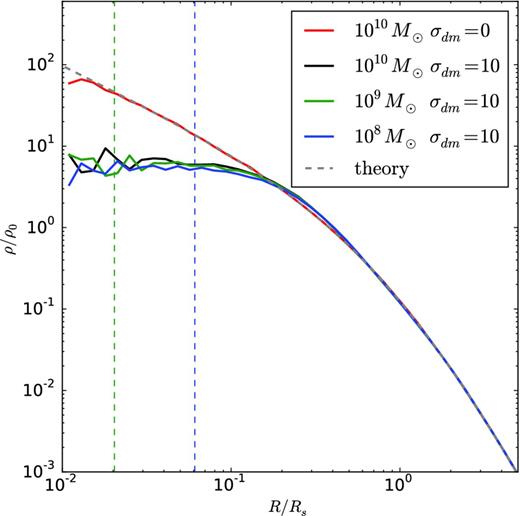
The density in scaled units of R/Rs for Hernquist haloes of 1010 (black), 109 (green), and 108 M⊙ (blue) which have scale radii of 1.099, 0.37, and 0.12 kpc, respectively, based on the mass concentration ratio relation from Neto et al. (2007). Each halo has been evolved for about 25 scaled dynamical times which correspond to 91, 44, and 20 Myr, respectively. The haloes demonstrate similar evolution in these scaled distance and time units. The density ρ has been scaled by the central density. The vertical dashed lines indicate the softening length of 7.5 pc that is scaled for each halo (the dashed line for the 1010 M⊙ halo is off the plot further to the left). The dashed grey dashed line is the Hernquist density profile.
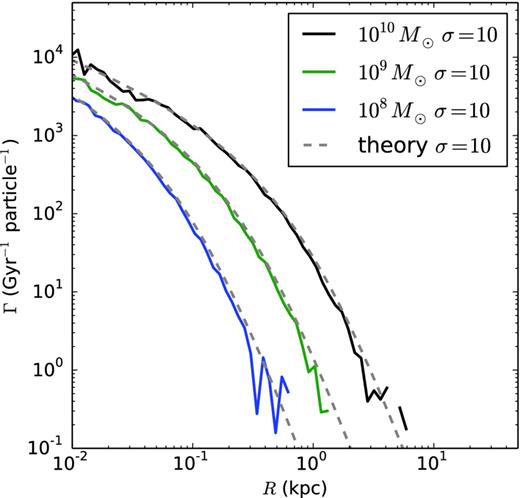
Snapshots of a Hernquist profile SIDM simulation showing the number of interactions that occur per particle per gigayear for the same haloes as in the previous figure. The cross-section is 10 cm2 g−1. In dashed grey is the analytical prediction for each halo. The simulations were run for a period much shorter than the dynamical time of the halo. Each Hernquist profile has a different scaled structure as described in the previous figure. Each halo was described with about 2 million particles.
The total number of interactions per unit time is then given by equation (A4) in this appendix. However, because the initial velocity dispersion is that of a Hernquist profile in equilibrium, this analytic prediction is an approximation which declines in accuracy with halo evolution in time. In Fig. A1, we show the analytic prediction of the expected number of DM interactions compared to a simulation of the haloes that has been run for a brief period (105 yr), much smaller than the dynamical time of the haloes and before the density profile evolves significantly.
Convergence of SIDM profiles in DM-only simulations
In Fig. A3, we show a resolution test using the most massive halo of simulation ‘h516’. The halo (of final mass 4 × 10¹⁰ M⊙) was simulated lowering the mass resolution by a factor of 64 in mass and 4 in force resolution. The ratio of the spherically averaged local density as a function of radius shows that the SIDM simulation converges at about 2 softening lengths, similar to the CDM run (see also Power et al. 2003). The ‘central’ density decreases by a factor of ∼6 between the CDM and SIDM case. These results agree with previous works. To verify the convergence of the SIDM density profiles at the previously poorly explored regime of Mvir < 109 M⊙, we also simulated the ‘40 Thieves’ volume first with particle mass 8000 M⊙ and then again 2400 M⊙, and a force resolution of 65 pc in both cases. Combining these runs with the h148 volume, we are able to cover four orders of magnitude in halo mass, from small haloes with peak velocities smaller than 10 km s−1 to massive galaxies with a large system of satellites. We have simulated h148 at lower resolution with hydrodynamics and SF, finding that it hosts a large disc galaxy.
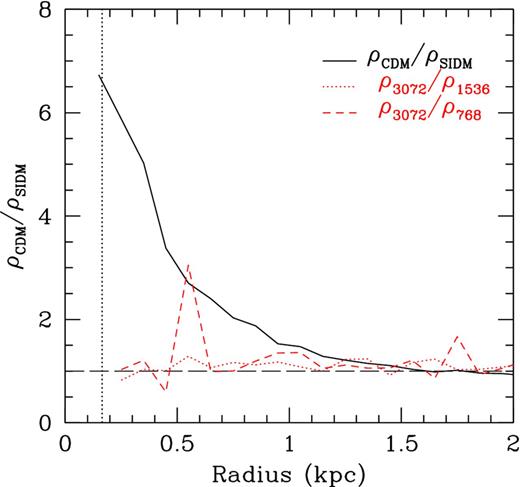
The local density ratio as a function of radius between the high-resolution SIDM version of halo h516 (ρSIDM) and its lower resolution counterparts (ρ1536) and (ρ768) Results in the low-resolution versions converge at ∼2 softening lengths, as typical of CDM-only simulations.
