


Abstract
We have carried out a study of radio emission from a small sample of magnetic O- and B-type stars using the Giant Metrewave Radio Telescope, with the goal of investigating their magnetospheres at low frequencies. These are the lowest frequency radio measurements ever obtained of hot magnetic stars. The observations were taken at random rotational phases in the 1390 and the 610 MHz bands. Out of the eight stars, we detect five B-type stars in both the 1390 and the 610 MHz bands. The three O-type stars were observed only in the 1390 MHz band, and no detections were obtained. We explain this result as a consequence of free–free absorption by the free-flowing stellar wind exterior to the confined magnetosphere. We also study the variability of individual stars. One star – HD 133880 – exhibits remarkably strong and rapid variability of its low-frequency flux density. We discuss the possibility of this emission being coherent emission as reported for CU Vir by Trigilio et al.
INTRODUCTION
The last decade has witnessed the identification and characterization of an important population of hot O- and B-type stars hosting strong, organized magnetic fields (e.g. Donati et al. 2002; Oksala et al. 2010; Grunhut et al. 2012; Wade et al. 2012). Observational and theoretical studies of the interaction of their intense radiation-driven winds with their magnetic fields (e.g. ud-Doula & Owocki 2002; Townsend, Owocki & Groote 2005; Sundqvist et al. 2012) have revealed that the wind properties of magnetic hot stars are modified in important ways as compared to the winds of non-magnetic stars, introducing significant changes across the entire electromagnetic spectrum.
The presence of an organized magnetic field at the surface of a hot star leads to channelling and confinement of its outflowing stellar wind, creating a magnetosphere, which can radiate in various wavebands (Andre et al. 1988; Linsky, Drake & Bastian 1992). In regions close to the star, the magnetic pressure dominates and causes the wind to follow dipolar field lines. At greater distances from the stellar surface, the wind kinetic energy density exceeds the magnetic pressure due to the stronger radial decline of magnetic field energy density than of wind kinetic energy density. The radius at which the wind kinetic energy density becomes equal to the magnetic pressure is defined as the Alfvén radius (e.g. ud-Doula & Owocki 2002). The region below the Alfvén radius, i.e. interior to the largest closed magnetic loop, is defined as the inner magnetosphere (Trigilio et al. 2004), which is the site of generation of X-ray and H α emission (e.g. Babel & Montmerle 1997; Gagné et al. 2005; Howarth et al. 2007; Sundqvist et al. 2012; ud-Doula et al. 2014). Beyond the Alfvén radius, the wind opens the magnetic field lines, generating a current sheet in the magnetic equatorial plane. This region is defined as the middle magnetosphere. At greater distances from the star, the outer magnetospheric region is characterized by a radial magnetic topology following wind streamlines.
Radio emission from non-magnetic hot stars is expected to be thermal free–free emission from the ionized wind in the circumstellar environment (Panagia & Felli 1975; Wright & Barlow 1975). However, in the presence of magnetic fields electrons can be accelerated to relativistic energies, either by reconnection near the current sheet in the middle magnetosphere (Usov & Melrose 1992) or in strong, large-scale shocks in the inner magnetosphere (Babel & Montmerle 1997; ud-Doula, Townsend & Owocki 2006; Ud-Doula, Owocki & Townsend 2008). These energetic electrons can give rise to gyrosynchrotron radio emission (Drake et al. 1987; Linsky et al. 1992; Trigilio et al. 2004).
Various surveys of cooler magnetic A- and B-type stars have been carried out at 5–8 GHz radio frequencies, resulting in ≈25 per cent detections (e.g. Abbott, Bieging & Churchwell 1985; Drake et al. 1987; Linsky, Drake & Bastian 1992). Linsky et al. (1992) interpreted the radio emission in these stars as gyrosynchrotron in nature, arising from regions located at 10–20 R*, with higher frequency emission originating from plasma located closer to the star, and the lower frequency emission from material farther away.
Leone & Umana (1993) monitored the 5-GHz radio emission of two magnetic B-type stars, HD 37017 and σ Ori E, and observed variability in accordance with their respective rotational periods. The coincidence of radio maxima with the extrema of the longitudinal magnetic field in these stars led those authors to suggest that radio emitting regions are located above the magnetic poles. Radio variability was also measured from the magnetic B8p star HD 133880 (HR Lup). The flux density and circular polarization were observed to vary according to the stellar rotation period (Lim, Drake & Linsky 1996; Bailey et al. 2012), and was also interpreted as gyrosynchrotron emission (Bailey et al. 2012).
Leone et al. (2004) argued that as per the standard radio emission gyrosynchrotron models, emission at a given frequency should be emitted in a well-localized torus above the magnetic poles. They examined the radio spectral energy distributions (SEDs) of five magnetic B-type stars in the range from 1 to 87.7 GHz. They concluded that the observed slopes of the radio spectra and the absence of millimetre emission are not generally compatible with this model, and suggested a cut-off frequency of the radio emission.
Trigilio et al. (2000) detected rapid, intense, narrow-band and highly polarized radio bursts from the late B-type star CU Vir, which they hypothesized to be Electron Cyclotron Maser Emission (ECME) at 1.4 GHz. Such emission is expected to occur principally at low frequencies (<1.5 GHz; Trigilio et al. 2000; Leto et al. 2012). However, to date, few such low-frequency observations have been obtained, and generally they correspond to null results (e.g. George & Stevens 2012).
Clearly, a variety of diverse investigations of the radio emission of magnetic A- and B-type stars have been carried out, leading to an array of disconnected results. However, no similar studies have yet taken place for hotter magnetic O- and B-type stars. In an attempt to extend and homogenize the study of the physics of radio magnetospheres of hot stars, we have initiated a systematic survey of the radio emission properties of the known magnetic B- and O-type stars. Our survey includes observations at both high frequency (currently being obtained with the VLA) and at low frequency (currently being obtained with the GMRT).
In this first paper, we describe a pilot study of eight established magnetic O- and B-type stars, observed with the Giant Metrewave Radio Telescope (GMRT) in the 1390 MHz (20 cm) and 610 MHz (50 cm) bands, to characterize the radio emission properties of their magnetospheres at very low frequencies, study their radio SEDs to understand magnetospheric properties and probe mass-loss from the star in the case of dominant free–free absorption.
In Section 2, we describe the observations and data analysis. In Section 3, we carry out a detailed analysis and look for variability of the detected stars within the observing period, and in Section 3.6 we discuss the stars for which no radio emission was detected. In Section 4, we discuss our results and the potential of low frequency radio observations for providing new constraints on the physics of hot star magnetospheres.
OBSERVATIONS
The GMRT observations of eight magnetic O- and B-type stars were taken between 2013 October 24 to 2014 January 24 under cycle 25 in the 1390 (L band) and 610 MHz bands. Table 1 gives details of the observed stars. Out of these, five B-type stars were observed in both the 1390 and 610 MHz bands, while the three O-type stars were observed only in the 1390 MHz band. Each observation was of approximately 3 h in duration and a total of 26–29 good antennas were used. For all observations, visibilities were recorded for two circular polarizations (RR and LL) with a bandwidth 32 MHz, divided into 256 frequency channels, and 16 s integration time. Calibrator sources were used to remove the effect of variation of the instrumental and other non-astronomical factors in the measurements. 3C48, 3C286 and 3C147 were used as flux calibrators in various observations. Flux calibrators were observed for 10–15 min, either in the beginning or towards the end of each observation. Flux calibrators were also used for bandpass calibration. Phase calibrators were chosen from the Very Large Array (VLA) calibrator manual such that they are located within 15° of the target star. They were observed more frequently. This is important not only for the tracking of instrumental phase and gain drifts and atmospheric and ionospheric gain and phase variations but also for monitoring the quality and sensitivity of the data and for spotting occasional gain and phase jumps. In the 1390 MHz band, the phase calibrator observations were made approximately every 25–30 min for 5 min duration, whereas in the 610 MHz band, the 6 min phase calibrator scans were obtained every 35–40 min.
Details (spectral type, effective temperature, luminosity, radius, mass, rotational period, polar strength of the magnetic dipole at the stellar surface, Kepler corotation radius, Alfvén radius, mass-loss rate and wind terminal velocity) of magnetic O and B stars observed with the GMRT. Rff is the radius of the free–free absorption photosphere at 1390 MHz, discussed in Section. 3.6.
| Star | Spectral | Teff | log L* | R* | M* | Period | Bp | RK | RA | |$\log (\dot{M})$| | v∞ | Rff | Rff/RA |
|---|---|---|---|---|---|---|---|---|---|---|---|---|---|
| type | (kK) | (L⊙) | (R⊙) | (M⊙) | (d) | (kG) | (R*) | (R*) | (M⊙ yr−1) | (km s−1) | (R*) | ||
| HD 215441 | B8-9p | 15 ± 2 | 1.8 | 2.6 | |$\phantom{0}$|3.5 | 9.49 | 34 | – | - | - | - | - | - |
| HD 37479 | B2 Vp | 23 ± 21 | 3.61 | 3.91 | |$\phantom{0}$|5.01 | 1.192 | 9.63 | |$\phantom{0}$|2.13 | 313 | −9.7744 | 17944 | 6.5 | 0.2 |
| HD 37017 | B2 Vp | 21 ± 25 | 3.45 | 3.95 | |$\phantom{0}$|7.25 | 0.905 | >6.06 | |$\phantom{0}$|1.94 | >184 | −9.0724 | 11024 | 27.6 | <1.5 |
| HD 36485 | B3 Vp | 20 ± 27 | 3.57 | 4.57 | |$\phantom{0}$|7.17 | 1.487 | 107 | |$\phantom{0}$|2.44 | 244 | −8.9694 | 10124 | 30.4 | 1.3 |
| HD 133880 | B8IVp | 13 ± 18 | 2.08 | 2.08 | |$\phantom{0}$|3.28 | 0.888 | 198 | |$\phantom{0}$|2.28 | 608 | −11.08 | 7508 | 4.6 | 0.1 |
| HD 37022 | O7 Vp | 39 ± 19 | 5.39 | 9.99 | 459 | 15.4210 | 1.111 | |$\phantom{0}$|9.44 | 2.44 | −6.3994 | 32254 | 236.3 | 98.5 |
| HD 57682 | O9 V | 34 ± 112 | 4.812 | 7.012 | 1712 | 63.5713 | 1.713 | 244|$\phantom{0}$| | 3.74 | −7.0794 | 23954 | 153.7 | 41.5 |
| NGC 1624-2 | O6.5f?cp | 35 ± 214 | 5.114 | 9.714 | 3414 | 158.014 | >2014 | 4114 | >1114 | −6.7864 | 28904 | 151.2 | <13.7 |
Notes.1Hunger, Heber & Groote (1989), 2Townsend et al. (2010), 3Oksala et al. (2012), 4Petit et al. (2013), 5Bolton et al. (1998), 6Bohlender et al. (1987), 7Leone et al. (2010), 8Bailey et al. (2012), 9Simón-Díaz et al. (2006), 10Stahl et al. (2008), 11Wade et al. (2006), 12Grunhut et al. (2009), 13Grunhut et al. (2012), 14Wade et al. (2012).
A FLAGging and CALibration (flagcal) software pipeline developed for automatic flagging and calibration of the GMRT data (Prasad & Chengalur 2012) was used to flag and calibrate the GMRT data. In 70 per cent of the cases, the results were satisfactory and only minor additional flagging was needed after the flagcal. However, in some cases, the data needed more significant flagging and recalibration. In such cases the flagging was done manually and a flag file was created. The flagcal was then run again using the manual flag file. The calibrated data were inspected to determine the presence of any spurious signature. The above step was repeated until satisfactory calibration was achieved. The flagged and calibrated visibility data were used to make continuum images using the standard tasks in the Astronomical Image Processing System (aips). To avoid bandwidth smearing in the continuum image, the total bandwidth was divided into six sub-bands in the 1390 MHz observations, and in 10 sub-bands in the 610 MHz observations. Because of the large field of view (FoV) of the GMRT, the three-dimensional (3D) imaging feature in the aips task ‘IMAGR’ was used in which the entire FoV is divided into multiple subfields (facets) and each of which was imaged separately. For the 1390 MHz image, the total FoV was divided in 19 subfields, and in the 610 MHz band the FoV was divided into 37 subfields. The presence of a large number of bright sources in the FoV of various stars allowed us to carry out self-calibration to improve the complex gains. This reduces the errors from temporal variations in the system gain, and spatial and temporal variations in the ionospheric properties. After three rounds of phase self-calibration, the clean component model was subtracted from the UV data to identify the residual bad data. Some more flagging was performed and two more rounds of phase self-calibration were run. A final round of amplitude and phase self-calibration was also performed in each data set. Since the phase variations occur on time-scales of a few minutes, the time interval for the phase self-calibration was chosen to be 1 min, and 5 min for the amplitude and phase self-calibration. The map resolutions for the 1390 MHz images were around 2–3 arcsec’, and around 5–6 arcsec for the 610 MHz data. In Table 2, we report the values of the final flux density. For non-detections, we quote 3σ upper limits.
GMRT observations of magnetic B- and O-type stars.
| Star | Obs date | Mean | Mean | Flux density | rms | Obs date | Mean | Mean | Flux density | rms |
|---|---|---|---|---|---|---|---|---|---|---|
| 1.4 GHz | HJD | phase | F20 (mJy) | (μJy) | 0.6 GHz | HJD | phase | F50 (mJy) | (μJy) | |
| HD 215441 | 01-Nov-13 | 2456598.262± 0.050 | 0.93 | 1.49 ± 0.10 | 46 | 24-Oct-13 | 2456590.168± 0.044 | 0.08 | 0.98 ± 0.10 | 56 |
| HD 37479 | 31-Oct-13 | 2456597.433± 0.170 | 0.09 | 2.00 ± 0.11 | 57 | 24-Oct-13 | 2456590.402± 0.044 | 0.18 | 1.25 ± 0.28 | 51 |
| HD 37017 | 31-Oct-13 | 2456597.422± 0.131 | 0.94 | 1.59 ± 0.12 | 53 | 24-Oct-13 | 2456590.430± 0.040 | 0.18 | 0.59 ± 0.32 | 153 |
| HD 36485 | 27-Oct-13 | 2456593.378± 0.050 | 0.94 | 1.30 ± 0.10 | 54 | 26-Oct-13 | 2456591.494± 0.076 | 0.66 | 0.59 ± 0.17 | 88 |
| HD 133880 | 24-Jan-14 | 2456681.616± 0.055 | 0.84 | 14.45 ± 0.11 | 49 | 14-Jan-14 | 2456671.590± 0.048 | 0.42 | 2.04 ± 0.15 | 66 |
| HD 37022 | 31-Oct-13 | 2456597.476 | 0.4 | <4.95 | 1650 | – | – | – | – | – |
| HD 57682 | 01-Nov-13 | 2456598.370 | 0.13 | <0.16 | 52 | – | – | – | – | – |
| NGC 1624-2 | 02-Nov-13 | 2456598.487 | 1.0 | <0.21 | 71 | – | – | – | – | – |
ANALYSIS AND RESULTS
With our GMRT observations, we have detected five out of eight stars. The detected stars, HD 215441, HD 37479, HD 37017, HD 36485 and HD 133880, are B-type stars and have been detected in both the 1390 and 610 MHz bands. The O-type stars, HD 37022, HD 57682 and NGC 1624-2, were observed only in the 1390 MHz band, and none of them are detected.
Of the B stars, four stars (HD 37479, HD 37017, HD 36485 and HD 133880) are sufficiently rapid rotators that rotation contributes significantly to the support of their magnetospheres (so-called-centrifugal magnetospheres; Petit et al. 2013). On the other hand, the O-type stars, as well as HD 215441, rotate slowly, and their magnetospheres receive no significant rotational support (so-called dynamical magnetospheres; Petit et al. 2013).
The observations are summarized in Table 2. In this section, we give details of the detected B-type stars, and explore potential causes of non-detections in O-type stars.
HD 215441
HD 215441 (Babcock's star) is a cool magnetic B8-9p star. It exhibits no optical, UV or X-ray evidence of a magnetosphere, but was detected in the 5 and 1.4 GHz bands (flux density ∼1 mJy) by Linsky et al. (1992). Despite its low temperature, this star is noteworthy due to its extraordinarily strong magnetic field (Babcock 1960).
Magnetic O- and B-type stars show variability of many observational quantities. This variability is understood as rotational modulation in the context of the oblique rotator model (ORM; Stibbs 1950; Wade et al. 2011), in which the dipolar surface magnetic field is tilted with respect to the rotational axis. Rotation of the star results in strict periodic variability according to the stellar rotational period.
Linsky et al. (1992) reported a flux of 1.07 ± 0.09 mJy at 1.4 GHz on 1987 July 2. According to equation (1), this corresponds to phase 0.08, i.e. the same phase as our 610 MHz observation (0.98 ± 0.1 mJy). Comparing the two measurements, this implies an essentially flat spectral index (α; Fν ∝ να) of α = log (F1390/F610)]/log (1390/610) = +0.02 ± 0.03 at this phase. This result appears inconsistent with the α = −0.26 index derived by Leone et al. (2004) based on higher frequency observations. This suggests that the SED flattens at low frequency.
HD 37479
HD 37479 (σ Ori E) is the prototypical B2 Vp star hosting a centrifugal magnetosphere. It exhibits strong and variable H α emission that has been studied in some detail (e.g. Townsend et al. 2005; Oksala et al. 2012). It was detected by Linsky et al. (1992) at 15, 5 and 1.4 GHz frequency bands using the VLA, and observed at several phases. The flux density was observed to vary by a factor of about 2, from 2.4-3.1 mJy at 15 GHz, 2.8-3.9 mJy at 5 GHz and 1.5-3.2 mJy at 1.4 GHz bands. They also detected variable circular polarization at 15 GHz. This star was also observed by Leone & Umana (1993), who detected 5 GHz emission varying with the rotational period, with maxima coinciding with the magnetic extrema.
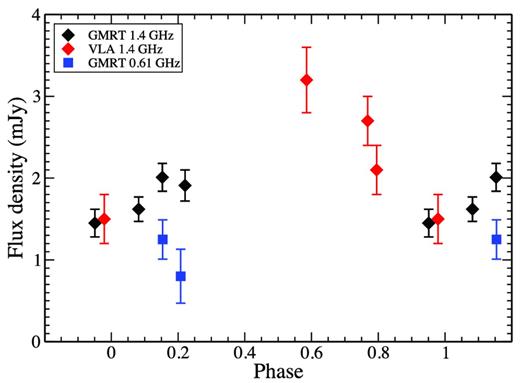
GMRT and VLA 1.4 GHz measurements (black and red diamonds, respectively) and GMRT 610 MHz measurements (blue squares) of HD 37479 (σ Ori E). The VLA measurements are taken from the archive.
The combined 1390 MHz data suggest a roughly sinusoidal variation peaking at phase 0.5, with a peak flux of ∼3.2 mJy. The 610 MHz measurements are both weaker than the minimum 1390 MHz measurement, but their phase coverage is too sparse to infer meaningful information about the phase variation in this band.
Leone & Umana (1993) proposed that the 5 GHz flux from this star exhibited a double-wave phase variation. This is not suggested to be the case at 1.4 GHz band. Nevertheless, additional data will be required to draw more robust conclusions.
Two of the 1390/610 MHz GMRT measurements were obtained at similar phases. From these we infer an instantaneous (ϕ = 0.15–0.2) index of the SED at these frequencies of α = 0.11 ± 0.04. This is consistent with α = 0.12 derived by Leone et al. (2004) based on higher frequency observations.
HD 37017
HD 37017 is an early-type magnetic B2 Vp star that also exhibits H α emission due to the presence of a dense centrifugal magnetosphere (Leone et al. 2010; Petit et al. 2013). This target is in fact a double-lined spectroscopic binary (SB2) system with an 18.65 d orbital period containing the magnetic B star in addition to a late B dwarf (Leone et al. 2010).
Leone & Umana (1993) detected variable radio emission from HD 37017. Like σ Ori E, the radio emission was found to vary with the rotational period, and magnetic extrema coincided with radio maxima. It was detected by Linsky et al. (1992) at 15, 5 and 1.4 GHz bands using the VLA, and observed at several phases. The flux density was observed to vary by a factor of about 2, from 0.9–2.1 mJy at 15 GHz, 1.4–2.6 mJy at 5 GHz and 1.5–2.4 mJy at 1.4 GHz bands. Leone et al. (2004) studied HD 37017 in mm bands and examined the properties of the radio spectrum in the 1.4–87.7 GHz range. They found the flux density to increase up to a frequency of 22.5 GHz and then to decrease in the mm range. This indicates a possible cut-off frequency.
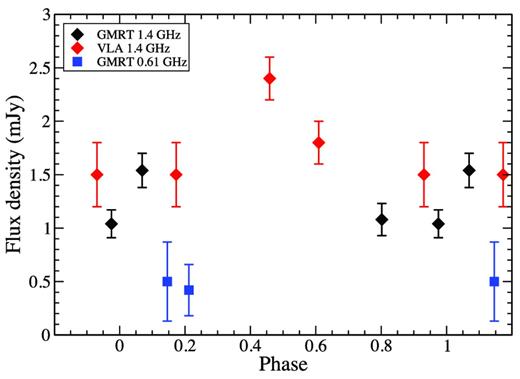
GMRT and VLA 1.4 MHz measurements (black and red diamonds, respectively) and GMRT 610 MHz measurements (blue squares) of HD 37017. The VLA measurements are taken from the archive.
Leone & Umana (1993) described the 5-GHz flux variation as sinusoidal, with a maximum at phase 0.0 and a minimum at phase 0.5. The variation shown in Fig. 2, although weak and coarsely sampled, appears opposite to this description. This is entirely a consequence of the different ephemeris used by those authors and by us. The phasing relative to the longitudinal field variation is the same.
Again, our two 610 MHz observations exhibit lower flux than the lowest of the seven measurements at 1390 MHz. One of the VLA 1.4 GHz observations was obtained at a phase similar to the GMRT 610 MHz data. From these we infer an instantaneous (ϕ = 0.15–0.2) index of the SED at these frequencies of α = 0.23 ± 0.1. This is consistent with α = 0.15 derived by Leone et al. (2004) based on higher frequency observations.
HD 36485
HD 36485 (δ Ori C) is another hot B3 Vp star hosting a centrifugal magnetosphere. The H α emission is variable on a time-scale of a few hours. Notwithstanding its sharp spectral lines, the star is a rapid rotator with a period of about 1.5 d, implying that it is viewed close to the rotational pole (Bohlender, Walker & Bolton 1991; Leone et al. 2010).
δ Ori C was detected with the VLA at 5 GHz with a mean flux density of 0.95 mJy and showed a negative spectral index (α < −0.7) between 5 and 15 GHz bands according to Drake et al. (1987), who concluded a non-thermal origin of the radio emission. Their three measurements at this wavelength did not show any significant variability, with a measurement uncertainty of ±0.1 mJy.
HD 133880
HD 133880 (HR Lup) is a cooler, rapidly rotating (P = 0.88 d; Bailey et al. 2012) Bp star hosting one of the strongest known stellar magnetic fields. However, unlike most Ap/Bp stars, HD 133880 has a magnetic field topology that appears to be predominantly quadrupolar as opposed to dipolar (Landstreet 1990; Bailey et al. 2012). HD 133880 was previously observed with the Australia Telescope Compact Array (ATCA) at 5 and 8.5 GHz frequency bands simultaneously on 1995 February 12, 14 and 16, for around 10 h each day. Lim et al. (1996) had demonstrated that radio flux and circular polarization of HD 133880 at both frequencies vary significantly and coherently according to the rotational period. They reported that the emission shows broad peaks near the phases of the longitudinal field extrema. The reanalysis of the data by Bailey et al. (2012) yielded the same result. They found flux variation to be complex, characterized by strong, broad maxima at phases 0.0 and 0.5 (i.e. the extrema of the longitudinal field), and sharper, somewhat weaker secondary extrema at quadrature phases (i.e. 0.25 and 0.75).
George & Stevens (2012) observed this star with the GMRT in dual mode in the 610 and 240 MHz bands on 2009 December 5 and 7. They reported non-detections in all the observations. However, we extracted the data from the GMRT archive and reanalysed it, and find detections on both days in the 610 MHz band. Furthermore, we also find variability in each observation in this band. To re-confirm our detections of their data, we have analysed the data both in AIPS, as well as in Common Astronomy Software Applications (casa), separating out LL and RR Stokes, and we find consistent results. However, in the 240 MHz band we obtained no detection in either observation, consistent with George & Stevens (2012). The 3σ upper limits in this band at the two epochs were 1.5 and 3.0 mJy, respectively. We also located three data sets at 1420 MHz in the VLA archive, obtained between 1995 February 15–17. We reanalyse these data and tabulate them in Table 3, along with the flux density in various time intervals in both our new observations, as well as the reanalysed observations.
Variability of HD 133880.
| Freq | Telescope | Date | Mean | Phase | Flux density | rms |
|---|---|---|---|---|---|---|
| GHz | HJD | mJy | μJy | |||
| 1.388 | GMRT | 24-Jan-14 | 2456681.572 ± 0.012 | 0.791 | 25.90 ± 0.14 | 108 |
| 24-Jan-14 | 2456681.604 ± 0.012 | 0.827 | 26.14 ± 0.12 | 123 | ||
| 24-Jan-14 | 2456681.636 ± 0.012 | 0.863 | 3.41 ± 0.12 | 117 | ||
| 24-Jan-14 | 2456681.663 ± 0.008 | 0.895 | 2.43 ± 0.14 | 177 | ||
| 1.425 | VLA | 15-Feb-95 | 2449764.040 ± 0.007 | 0.348 | 2.07 ± 0.40 | 396 |
| 15-Feb-95 | 2449764.098 ± 0.006 | 0.414 | 2.87 ± 0.33 | 331 | ||
| 16-Feb-95 | 2449765.013 ± 0.006 | 0.456 | 3.39 ± 0.24 | 239 | ||
| 17-Feb-95 | 2449766.010 ± 0.006 | 0.593 | 5.86 ± 0.27 | 267 | ||
| 0.608 | GMRT | 14-Jan-14 | 2456671.552 ± 0.010 | 0.371 | 1.91 ± 0.23 | 76 |
| 14-Jan-14 | 2456671.579 ± 0.010 | 0.402 | 1.97 ± 0.24 | 68 | ||
| 14-Jan-14 | 2456671.607 ± 0.010 | 0.434 | 2.21 ± 0.24 | 65 | ||
| 14-Jan-14 | 2456671.631 ± 0.007 | 0.461 | 1.91 ± 0.14 | 75 | ||
| 0.606 | GMRT | 05-Dec-09 | 2455170.712 ± 0.026 | 0.966 | 2.37 ± 0.31 | 311 |
| 05-Dec-09 | 2455170.776 ± 0.027 | 0.038 | 2.16 ± 0.33 | 328 | ||
| 0.607 | GMRT | 07-Dec-09 | 2455172.663 ± 0.027 | 0.189 | 1.26 ± 0.32 | 218 |
| 07-Dec-09 | 2455172.726 ± 0.026 | 0.261 | 20.08 ± 0.40 | 287 | ||
| 07-Dec-09 | 2455172.787 ± 0.024 | 0.330 | 3.52 ± 0.37 | 347 |
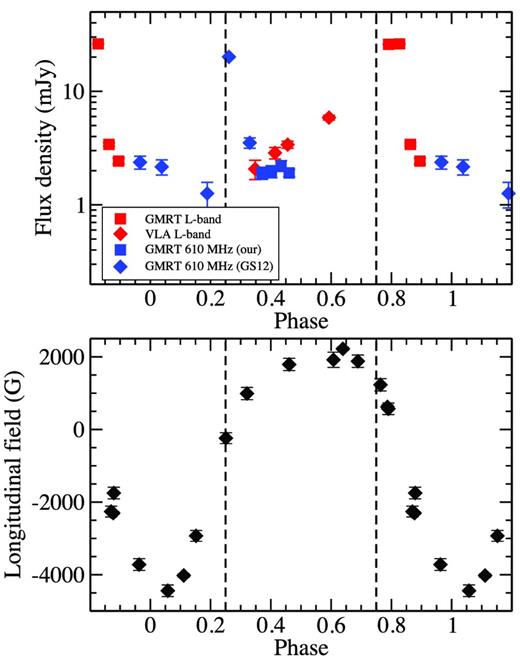
Upper frame – phase versus flux density plot of HD 133880 at 1.4 GHz (red colour) and 610 MHz (blue colour). Here red squares denote GMRT 1390 MHz measurements, red diamonds denote VLA 1.4 GHz measurements, blue squares denote GMRT 610 MHz observations made by us in 2014 January, whereas the blue diamonds are the 2009 December data of George & Stevens (2012) reanalysed by us. Note that unlike in Figs 1 and 2, the vertical scale in this figure is logarithmic. Lower frame – longitudinal magnetic field variation of HD 133880, from Bailey et al. (2012). The vertical lines in both plots indicate phases 0.25 and 0.75.
Variability of other stars in our sample.
| Star | Tel. | Freq | Date | Mean | Phase | Flux density | rms | Ref. |
|---|---|---|---|---|---|---|---|---|
| (GHz) | HJD | (mJy) | (μJy) | |||||
| HD 215441 | GMRT | 1.388 | 01 Nov 13 | 2456598.223 ± 0.010 | 0.927 | 1.43 ± 0.18 | 76 | This paper |
| 01 Nov 13 | 2456598.255 ± 0.010 | 0.931 | 1.15 ± 0.15 | 70 | ||||
| 01 Nov 13 | 2456598.283 ± 0.010 | 0.934 | 1.45 ± 0.18 | 74 | ||||
| 01 Nov 13 | 2456598.306 ± 0.005 | 0.936 | 1.20 ± 0.19 | 92 | ||||
| VLA | 1.4 | 02 Jul 87 | 2446979.250 | 0.078 | 1.07 ± 0.09 | – | ||
| HD 215441 | GMRT | 0.608 | 24 Oct 13 | 2456590.136 ± 0.012 | 0.075 | 1.19 ± 0.13 | 71 | This paper |
| 24 Oct 13 | 2456590.168 ± 0.012 | 0.078 | 1.18 ± 0.13 | 69 | ||||
| 24 Oct 13 | 2456590.201 ± 0.012 | 0.082 | 0.70 ± 0.22 | 108 | ||||
| HD37479 | GMRT | 1.388 | 31 Oct 13 | 2456597.273 ± 0.010 | 0.951 | 1.45 ± 0.17 | 87 | This paper |
| 31 Oct 13 | 2456597.430 ± 0.010 | 0.082 | 1.62 ± 0.15 | 84 | ||||
| 01 Nov 13 | 2456597.514 ± 0.010 | 0.153 | 2.01 ± 0.17 | 86 | ||||
| 01 Nov 13 | 2456597.595 ± 0.008 | 0.221 | 1.91 ± 0.19 | 106 | ||||
| VLA | 1.4 | 11 Mar 85 | 2446136.467 | 0.585 | 3.2 ± 0.4 | – | Linsky et al. (1992) | |
| 12 Mar 85 | 2446136.685 | 0.768 | 2.7 ± 0.3 | – | ||||
| 16 Mar 85 | 2446141.480 | 0.795 | 2.1 ± 0.3 | – | ||||
| 17 Mar 85 | 2446141.699 | 0.979 | 1.5 ± 0.3 | – | ||||
| HD37479 | GMRT | 0.608 | 24 Oct 13 | 2456590.370 ± 0.012 | 0.154 | 1.25 ± 0.24 | 134 | This paper |
| 24 Oct 13 | 2456590.434 ± 0.012 | 0.208 | 0.80 ± 0.33 | 158 | ||||
| HD37017 | GMRT | 1.388 | 31 Oct 13 | 2456597.301 ± 0.010 | 0.802 | 1.08 ± 0.15 | 74 | This paper |
| 31 Oct 13 | 2456597.458 ± 0.010 | 0.975 | 1.04 ± 0.13 | 66 | ||||
| 01 Nov 13 | 2456597.542 ± 0.010 | 0.069 | 1.54 ± 0.16 | 78 | ||||
| VLA | 1.4 | 11 Mar 85 | 2456136.488 | 0.459 | 2.4 ± 0.2 | – | Linsky et al. (1992) | |
| 12 Mar 85 | 2456136.623 | 0.609 | 1.8 ± 0.2 | – | ||||
| 16 Mar 85 | 2456141.419 | 0.931 | 1.5 ± 0.3 | – | ||||
| 17 Mar 85 | 2456141.637 | 0.173 | 1.5 ± 0.3 | – | ||||
| HD37017 | GMRT | 0.608 | 24 Oct 13 | 2456590.402 ± 0.012 | 0.146 | 0.50 ± 0.37 | 74 | This paper |
| 24 Oct 13 | 2456590.462 ± 0.008 | 0.212 | 0.42 ± 0.24 | 66 | ||||
| HD36485 | GMRT | 1.388 | 27 Oct 13 | 2456593.338 ± 0.010 | 0.910 | 0.43 ± 0.17 | 90 | |
| 27 Oct 13 | 2456593.365 ± 0.010 | 0.929 | 0.44 ± 0.33 | 85 | ||||
| 27 Oct 13 | 2456593.393 ± 0.010 | 0.947 | 0.60 ± 0.14 | 92 | ||||
| 27 Oct 13 | 2456593.419 ± 0.009 | 0.965 | 0.52 ± 0.17 | 78 | ||||
| VLA | 1.4 | 07 Jul 86 | 2446619.810 | 0.221 | <1.2 | 400 | Linsky et al. (1992) | |
| HD36485 | GMRT | 0.608 | 25 Oct 13 | 2456591.429 ± 0.012 | 0.618 | 1.46 ± 0.16 | 108 | This paper |
| 25 Oct 13 | 2456591.461 ± 0.012 | 0.640 | 1.26 ± 0.18 | 218 | ||||
| 26 Oct 13 | 2456591.526 ± 0.012 | 0.684 | 0.96 ± 0.19 | 87 | ||||
| 26 Oct 13 | 2456591.558 ± 0.012 | 0.706 | 0.69 ± 0.13 | 97 |
Considering the important differences in the phase variations of the GMRT data and the ATCA data, we speculate that HD 133880 may exhibit maser emission in a manner similar to CU Vir (Trigilio et al. 2000). In CU Vir, while no coherent emission was found at 5 GHz, the 1.4 GHz emission was identified as ECME with a basal flux of 2–3 mJy and then very large increments in the flux density at around phases 0.35–0.45 and 0.75–0.85. While, we do not yet have complete phase coverage for HD 133880, the observed features are highly reminiscent of those of CU Vir (see Fig. 3).
Free–free absorption in O star winds
Schnerr et al. (2007) carried out 5 and 1.4 GHz observations of five (non-magnetic) O stars with the Westerbork Synthesis Radio Telescope (WSRT). They detected three stars, for the first time at 1.4 GHz band, with one star (ξ Per) inferred to show non-thermal radio emission while two others were inferred to show thermal radio emission. In all cases, the observed flux was lower than their predicted thermal flux, based on the mass-loss rates inferred from the Hα line profiles. They explained this discrepancy as due to a stronger influence of wind clumping on the formation of the H α line.
In our programme we also observed three magnetic O-type stars at 1390 MHz. None of these targets were detected (see Table 2). For one of these stars (HD 37022) our upper limit is quite poor because it resides in a region with extended radio emission in Orion.
The high mass-loss rates of O stars can make the wind optically thick due to free–free absorption out to a very large ‘radio photosphere’ (Wright & Barlow 1975). In such a case radio observations are unlikely to directly see the magnetospheric emission. On the other hand, they may probe the global mass-loss, which is predicted to be quite heavily reduced for O stars with dynamical magnetospheres, due to quenching of the mass-loss by the field and the resultant plasma in-fall (ud-Doula & Owocki 2002; ud-Doula et al. 2008).
We adopt a volume filling factor f = 1, i.e. a smooth, unclumped radio emitting region, since it has been demonstrated (Puls et al. 2006) that f = 1 yields the best agreement with observations of thermal radio emission from hot stars when the Vink, de Koter & Lamers (2000) scaling law for mass-loss rates is assumed. Assuming τff = 1, we have computed the position of the radio photosphere (D, in units of R*) at 1390 MHz, using the wind parameters (computed using the Vink scaling) and physical parameters reported by Petit et al. (2013), except for HD 133880, for which we use values reported by Bailey et al. (2012). The results are summarized in Table 1 and illustrated in Fig. 4.
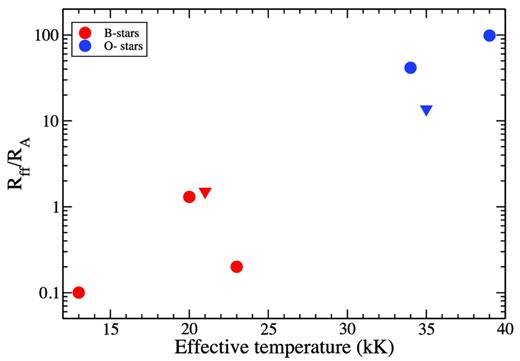
Ratio of Rff to RA versus effective temperature for the observed sample (excluding HD 215441, for which RA is unavailable). Here red circles and blue circles are for B- and O- type stars. The inverted triangle indicate upper limits as listed in Table 1.
If Rff < RA we expect the magnetospheric emission to escape the wind and to be detectable (in principle). However, if Rff > RA, the magnetospheric emission will be hidden within the (thermal) radio photosphere of the wind.
In our sample, B stars show ratios of Rff/RA which are clustered around values 0.1–1.5, whereas all the O-type stars have this ratio clustered between 10 and 100. This is illustrated in Fig. 4. This convincingly demonstrates that the free–free absorption of the magnetospheric radio emission of the B stars likely is negligible, and that the principal cause of the null results for O stars is free–free absorption in the free streaming wind.
Current models of the magnetically confined winds of slowly rotating O stars imply that they host ‘dynamical magnetospheres’. In this scenario, wind streamlines inside RA in the magnetic equatorial region are constrained to follow closed field loops. After the wind streams reach the respective loop top and shock, the cooling plasma returns to the stellar surface on a relatively short (dynamical) time-scale. Simulations (ud-Doula & Owocki 2002) predict that as a consequence of this confinement and fall-back, the global mass-loss of O stars with dynamical magnetospheres should be significantly reduced, by up to a factor of 10–20 compared to similar non-magnetic stars.
In the context of free–free absorption, this reduction in mass-loss has important implications for the location of the radio photosphere. The expected mass-loss rate can be estimated using equation (23) of ud-Doula et al. (2008), leading to a reduction of |$\dot{M}$| by a factor of more than 3 for HD 37022, 5 for HD 57682, and 15 for NGC 1624-2. If we reduce the mass-loss rate in equation (6) by these factors, for HD 37022 and HD 57682 the ratio Rff/RA is reduced to roughly 40, i.e. still well outside the Alfvén radius. However, the ratio for NGC 1624-2 is reduced to ∼2. At shorter wavelengths (3–6 cm), this value becomes <1. Hence multiwavelength radio observations spanning the radio spectrum have the potential to provide novel constraints on predictions of mass-loss quenching of strongly magnetic O stars like NGC 1624-2.
Our lack of detection of free–free emission from the winds of the O stars of our sample is understood naturally in the context of the results of Schnerr et al. (2007). Those authors reported the detection of free–free emission from the winds of two (supergiant) stars, α Cam and λ Cep, with uncertainties at 1420 MHz of 0.01 and 0.02 mJy, respectively. However, neither of the main sequence stars in their sample (10 Lac and 15 Mon) was detected, with 5σ upper limits of 0.1 and 0.25 mJy, respectively. Except for θ1 Ori C, all of our (main-sequence) O-type targets are apparently much fainter than these stars in the optical, reflecting greater heliocentric distances. Considering that our 5σ upper limits for NGC 1624-2 and HD 57682 are respectively 0.25 and 0.35 mJy, we would not have expected to detect their free–free emission at 1420 MHz, even assuming no mass-loss quenching.
SUMMARY AND DISCUSSION
We have studied eight O- and B-type stars with the GMRT in the 1390 and 610 MHz bands. Our 610 MHz detections of the five B-type stars are the first detections of this class of objects at such low frequencies. This indicates that free–free absorption of their winds is not able to shadow their low frequency emission. We also reanalysed archival observations of HD 133880 obtained in 2009 December, for which George & Stevens (2012) claimed non-detections. Surprisingly, we do detect the radio emission in both their observations allowing us to diagnose variability.
For HD 37017 and HD 37479, we confirm weak variability of the 1390-MHz flux density, as reported by Leone & Umana (1993) in 5 GHz band. The variability appears to be in phase with the variation of the longitudinal magnetic field. We do not find evidence of a double-wave 1390 MHz variation of HD 37479 (as reported by Leone & Umana 1993, at 5 GHz), although better phase coverage is necessary to robustly confirm this conclusion.
For the B star HD 36485, our observations suggest a relatively rapid change in the flux density in both bands in narrow phase ranges. This result needs to be confirmed by further observations.
The cooler B star HD 133880 shows remarkable variability in both the 1390 and 610 MHz bands. Even with our limited phase coverage, the initial results suggest that the fluxes in both bands peak at phases coinciding with the minor peaks obtained from ATCA data (Bailey et al. 2012). We propose that this behaviour may be a consequence of ECME, first observed from the B8p star CU Vir by Trigilio et al. (2000). The phenomenon, only observable at low radio frequencies, strongly motivates immediate monitoring of this target.
There were no detections obtained for any of the three magnetic O stars in the 1390 MHz band. Using the scaling law of Torres (2011), we are able to conclude that this null result is in general agreement with the expected free–free optical depth of dense winds of O-type stars. We also conclude that radio observations at higher frequencies will be capable of testing predictions of mass-loss quenching of strongly magnetic O stars like NGC 1624-2.
Leone et al. (2004) commented that the radio spectra of HD 142301 and HD 215441 (the two stars in their sample with the strongest magnetic fields) exhibited a sharp drop in flux density between 15 and 22.5 GHz. They concluded that this suggests there is a cut-off frequency in this range. On the other hand, the chemically peculiar magnetic stars with relatively weak magnetic fields showed flux densities that certainly decrease from the cm to the mm range. In our sample, we were able to measure spectral indices between 1390 and 610 MHz for three stars in common with the sample of Leone et al. (2004). For two stars (HD 37017 and HD 37479), the indices were similar to those obtained at higher frequencies, suggesting a smooth decrement of the flux density. On the other hand, for HD 215441 (the non-degenerate star with the strongest known magnetic field), we obtained a spectral index that differed strongly from that derived by Leone et al. (2004). This implies an equally significant change in the spectral index at low frequencies, and deserves further investigation.
The results presented in this paper represent a first feasibility study of the detection of low frequency emission from magnetic O- and B-type stars. Having demonstrated the general properties of a range of objects, we are now carrying out a larger survey to observe all known magnetic OB stars (roughly 70 stars) in radio bands from low to high frequencies. We are also performing monitoring of individual magnetic stars, in order to better understand the rotational variation of their fluxes and SEDs.
We thank the staff of the GMRT that made these observations possible. GMRT is run by the National Centre for Radio Astrophysics of the Tata Institute of Fundamental Research. AIPS is produced and maintained by the National Radio Astronomy Observatory, a facility of the National Science Foundation operated under cooperative agreement by Associated Universities, Inc. GAW acknowledges Discovery Grant support from the Natural Science and Engineering Research Council (NSERC) of Canada. AuD acknowledges support by NASA through Chandra Award number TM4-15001A and 16200111 and DHC for TM4-15001B issued by the Chandra X-ray Observatory Center which is operated by the Smithsonian Astrophysical Observatory for and behalf of NASA under contract NAS8-03060. AuD also acknowledges support for Program number HST-GO-13629.008-A provided by NASA through a grant from the Space Telescope Science Institute, which is operated by the Association of Universities for Research in Astronomy, Incorporated, under and NASA contract NAS5-26555.
REFERENCES
