


Abstract
We argue that the ‘changing look’ active galactic nucleus (AGN) recently reported by LaMassa et al. could be a luminous flare produced by the tidal disruption of a supersolar mass star passing just a few gravitational radii outside the event horizon of a ∼108 M⊙ nuclear black hole. This flare occurred in a massive, star-forming galaxy at redshift z = 0.312, robustly characterized thanks to repeated late-time photometric and spectroscopic observations. By taking difference photometry of the well-sampled multiyear Sloan Digital Sky Survey (SDSS) Stripe-82 light curve, we are able to probe the evolution of the nuclear spectrum over the course of the outburst. The tidal disruption event (TDE) interpretation is consistent with the very rapid rise and the decay time of the flare, which displays an evolution consistent with the well-known t−5/3 behaviour (with a clear superimposed re-brightening flare). Our analysis places constraints on the physical properties of the TDE, such as the putative disrupted star's mass and orbital parameters, as well as the size and temperature of the emitting material. The properties of the broad and narrow emission lines observed in two epochs of SDSS spectra provide further constraints on the circum-nuclear structure, and could be indicative that the system hosted a moderate-luminosity AGN as recently as a few 104 yr ago, and is likely undergoing residual accretion as late as 10 yr after peak, as seen from the broad Hα emission line. We discuss the complex interplay between TDEs and gas accretion episodes in galactic nuclei, highlighting the implications for future TDE searches and for estimates of their intrinsic rates.
1 INTRODUCTION
It is widely accepted that supermassive black holes (SMBHs) in the nuclei of galaxies grew over cosmological times mainly by accreting matter from their surroundings (Soltan 1982; Merloni 2015, and references therein). Decades of wide and deep surveys at different wavelengths have endowed us with a robust view of this growth process by constraining the luminosity function of active galactic nuclei (AGN) over most of the age of the Universe (see e.g. Hasinger, Miyaji & Schmidt 2005; Hopkins, Richards & Hernquist 2007; Aird et al. 2010; Ueda et al. 2014; Buchner et al. 2015; Merloni 2015; Aird et al. 2015; Brandt & Alexander 2015, and references therein). Moreover, by studying simultaneously and coherently the properties of the AGN host galaxies within multiwavelength surveys, we can now infer the overall duty-cycle of the AGN phenomenon, i.e. measure the fraction of time a typical galaxy spends in an active phase above a given (nuclear) luminosity (Aird et al. 2012; Bongiorno et al. 2012; Hickox et al. 2014). However, the results of these population-based (‘snapshot’) surveys do not provide any information on the behaviour of accreting BHs on time-scales smaller than those over which galaxies evolve (∼ billions of years). This is due to our uncertain knowledge of the fuelling mechanisms of AGN: for every galaxy of given properties, we still do not know whether BH growth is rare and long lived, or frequent and short lived.
In fact, understanding how BHs get their fuel at rates sufficient to power the observed AGN population, despite the huge angular momentum barriers present, is a long-standing goal in the field of galaxy dynamics (see e.g. Shlosman, Begelman & Frank 1990; Jogee 2006; Hopkins & Quataert 2010, and reference therein). As summarized in the recent review by Alexander & Hickox (2012), the current consensus is that gas inflow from kpc scales down to the central ∼100 pc region occurs in all gas-rich galaxies, with the main driving mechanisms being a variety of externally excited (mergers, fly-by) or internally triggered (secular) gravitational instabilities, which help to shed a large fraction of the angular momentum of the gas. On the other hand, on scales of the order of 1–10 pc (i.e. close to, or within, the gravitational sphere of influence of the central BH), these large-scale instabilities are less and less effective. Therefore, other dynamical mechanisms must be invoked, such as dynamical friction, tidal disruption of clouds or star clusters, bars-within-bars, self-gravitating discs, eccentric discs or singled-armed spiral modes, driven by the complex, time-varying potential of the BH, stars and gas (Shlosman et al. 1990; Bekki 2000; Jogee 2006; Hopkins & Quataert 2010).
Such complexity defies any simple modelization, as is apparent in the implementations of BH growth within theoretical models of structure formation. There, lacking enough spatial resolution to model ab initio gas and stellar dynamics within galaxies, a number of different mechanisms have been postulated as primary drivers of nuclear accretion, often with equally satisfactory results (see e.g. Hopkins et al. 2008; Hirschmann et al. 2012; Menci et al. 2014, for recent treatments).
Some observational attempts to infer recurrence times and durations of AGN accretion episodes have been made from indirect (typically space-resolved) tracers of past activity. A classic example is the light echo of Sgr A* that is apparently revealed by refection from the inner molecular zone of our own galaxy (Sunyaev, Markevitch & Pavlinsky 1993; Ponti et al. 2013). Still within the Galaxy, excess Hα emission along the Magellanic Stream has been claimed to be the result of illumination from Sgr A* about 1–3 × 10⁶ yr ago, when the BH was active at a level of 0.03–0.3 times its Eddington luminosity (Bland-Hawthorn et al. 2013). Arguments for powerful past AGN events in nearby galaxies have been based on studies of extended emission-line regions, which can be used to trace the history of AGN emission over time-scales of the order of the light traveltime from the nucleus to the gas (typically 104–105 yr; see, e.g. Dadina et al. 2010; Keel et al. 2012; Gagne et al. 2014; Davies, Schirmer & Turner 2015). Radio galaxies offer alternative routes into AGN variability, via the analysis of the morphology of the large-scale radio emission. Various pieces of indirect evidence of intermittency have been presented, such as the ripples and shock waves detected in the X-ray-emitting atmosphere around Virgo A/M87 (Forman et al. 2005), or the number versus size counts of small radio galaxies (Reynolds & Begelman 1997; Czerny et al. 2009). Finally, the decrease in the optical depth for Lyα photons due to intervening absorbers along lines of sight to high-redshift quasars (the so-called proximity effect; Carswell et al. 1987; Lu & Yu 2011) can also be used to set constraints on the duration of individual QSO episodes.
Yet another complicating factor is that at least some part of the fuel supply for AGN must come from stars, which abound within galactic nuclei, and will be tidally disrupted when dislodged into orbits passing close enough to the central BH (Hills 1975; Gurzadian & Ozernoi 1981; Carter & Luminet 1982; Rees 1988; Milosavljević, Merritt & Ho 2006). The frequency of such events depends on the stellar dynamical properties of galactic nuclei, and is a non-trivial outcome of a series of complex processes (Frank & Rees 1976; Magorrian & Tremaine 1999; Alexander 2012; Merritt 2013; Vasiliev 2014). Indeed, there is substantial uncertainty in the true rate of tidal stellar disruption in galactic nuclei. On the one hand, recent theoretical models, which account for realistic stellar dynamical models in galactic nuclei of different sizes and masses, have converged towards rates as high as ΓTDE ≈ 10−4 yr−1, with just a weak dependence on the BH (or host galaxy) mass (Wang & Merritt 2004; Stone & Metzger 2014). On the other hand, observational studies have mostly reported constraints on the tidal disruption event (TDE) rate that are up to 1 order of magnitude lower (see e.g. Donley et al. 2002; van Velzen & Farrar 2014; Khabibullin & Sazonov 2014). This apparent contradiction should not be surprising, as, observationally, the field is still in its infancy; only around two dozen TDE candidates have been identified so far by means of X-ray (Komossa & Bade 1999; Komossa & Greiner 1999; Esquej et al. 2008; Cappelluti et al. 2009; Maksym, Ulmer & Eracleous 2010; Bloom et al. 2011; Burrows et al. 2011; Saxton et al. 2012; Cenko et al. 2012b; Khabibullin & Sazonov 2014), UV (Gezari et al. 2008, 2009) and optical (van Velzen et al. 2011; Gezari et al. 2012; Arcavi et al. 2014; Chornock et al. 2014; Holoien et al. 2014) observations (see Gezari 2014, for a recent overview). In particular, the full extent of the various selection effects that may plague TDE selection in different bands of the electromagnetic spectrum have yet to be properly characterized. Nevertheless, the rate of discovery is increasing dramatically with the advent of large wide-area optical time-domain surveys (mostly driven by supernovae searches), such as the Catalina Real-Time Transient Survey (CRTS; Drake et al. 2009), the Palomar Transient Factory (PTF; Rau et al. 2009), Panoramic Survey Telescope & Rapid Response System (Kaiser et al. 2010) and the All-Sky Automated Survey for Supernovae (Shappee et al. 2014). The future promises even more rapid advances with next generation wide area X-ray (SRG/eROSITA; Merloni et al. 2012; Khabibullin, Sazonov & Sunyaev 2014) and optical (Skymapper, Keller et al. 2007, ZTF,1 and LSST, Ivezic et al. 2008) surveys.
In this work, we focus on just one particular example: a z = 0.312 galaxy within the Sloan Digital Sky Survey (SDSS) ‘Stripe-82’ area2 which has undergone a dramatic and rapid change in its nuclear emission, from type-1 (broad line) AGN-like, to type-1.9 (showing only a weak broad Hα emission line) within a 10 yr interval. LaMassa et al. (2015), who first reported this serendipitous discovery, rightly point out that such a dramatic change is rare (Dadina et al. 2010; Denney et al. 2014), and can provide important clues on the nature of BH fuelling in galactic nuclei. Here, we perform an in-depth analysis of the available (mostly public) data on this source (Sections 2 and 3), and we argue, based on the outcome of our analysis, that its overall light curve in the last decades is consistent with the tidal disruption of a main-sequence star (with mass M* > 1 M⊙) by a ≈108 M⊙ BH hosted in the nucleus of a massive, star-forming galaxy (Section 4). Our conclusions are mainly based on the properties of the optical light curve, and the overall energetics of the event. However, the full picture reveals the complexity of this galactic nucleus, as we demonstrate that (i) the material giving rise to the broad emission lines illuminated by the observed flare cannot be a distant part of the stellar debris (Section 5.1), and (ii) the narrow emission lines could indicate that about 104 yr ago the central BH was active at a level similar to that observed (Section 5.2). This prompted us, in Section 5.3, to develop a simple unified model for AGN fuelling, in order to estimate the relative occurrence of gaseous accretion and tidal disruption flares in nearby galactic nuclei. Finally, we draw our conclusions in Section 6.
2 DATA ANALYSIS
2.1 Source identification and long-term evolution
The main focus of this paper is the object SDSS J015957.64+003310.5, hereafter SDSS J0159+0033. SDSS J0159+0033 first came to our attention (before being independently reported by LaMassa et al. 2015) whilst creating a reference sample of bright X-ray sources to guide target selection for the SDSS-IV/SPIDERS survey (Merloni et al., in preparation, see also www.sdss.org/surveys/). Starting from a parent sample of bright (F0.2-2 keV > 10−13 erg cm−2 s−1) X-ray sources taken from the 3XMM serendipitous source catalogue,3 we found 557 objects having optical spectroscopic observations in the latest SDSS data release (DR12; Alam et al. 2015). A small subset (35/557) of these had a good quality spectrum available from both the SDSS-I/II phase (using the original SDSS spectrograph; York et al. 2000), as well as a spectrum obtained during the SDSS-III phase (using the upgraded Baryon Acoustic Oscillations Survey (BOSS) spectrograph; Smee et al. 2013). Within this subset of 35 objects there was a single one, SDSS J0159+0033, for which the automated classification derived from the SDSS-I/II spectrum (CLASS=‘QSO’) disagreed with that derived from the SDSS-III spectrum (CLASS=‘GALAXY’). SDSS J0159+0033 appeared in our original X-ray sample due to its serendipitous detection in an XMM–Newton observation of the nearby luminous QSO Mkn 1014 (Markarian, Lipovetskii & Stepanian 1977). The apparent disparity between the two spectroscopic classifications of this object prompted further investigation.
SDSS J0159+0033 was first imaged by the SDSS camera on 1998 September 25, and was subsequently selected for spectroscopic follow-up within the low-redshift ugri colour selected QSO target category (specifically with target bit TARGET_QSO_SKIRT; Richards et al. 2002; Stoughton et al. 2002). The pipeline measurements derived from the SDSS photometry found SDSS J0159+0033 to be a marginally resolved galaxy having de-reddened ugri colours (u − g = 0.53, g − r = 0.79, r − i = 0.31) that placed it outside the main stellar locus, blueward of the colour regions used to reject ‘normal’ galaxies, and also outside additional colour boxes designed to reject rarer stellar contaminants. The optical spectrum taken on 2000 November 23 (MJD 51871) is classified as a z = 0.312 broad-line QSO, due the unmistakable presence of a blue continuum and broad Balmer lines (Hα and Hβ, see Section 2.2 for more details).
On 2010 January 5 (MJD 55201), SDSS J0159+0033 was observed spectroscopically by the BOSS (Dawson et al. 2013) within the SDSS-III project, as part of a small random subset of known broad-line AGN from SDSS that were re-observed in order to define QSO spectral templates for BOSS (targeting flag TEMPLATE_QSO_SDSS). However, the resulting spectrum revealed a z = 0.312 star-forming galaxy with essentially no blue continuum, and no prominent broad emission lines, apart from a weak broad shoulder to the Hα line. The BOSS pipeline measured a velocity dispersion of σ = 169 ± 24 km s−1.
Five X-ray observations of the field containing SDSS J0159+0033 exist in public archives. The oldest of these is a Roentgen Satellite (ROSAT) All-Sky-Survey scan from 1991 January, which failed to detect the source, placing a 3σ upper limit of 3.2 × 10⁻² counts s−1, corresponding to an unabsorbed (i.e. corrected for the Galactic column density of 2.3 × 1020 cm−2; Kalberla et al. 2005) X-ray flux limit in the 0.1–2.4 keV band F0.1-2.4 keV < 8 × 10⁻¹³ erg cm−2 s−1 (for a ΓX = 2.1 power-law spectrum). Two deeper (6.1 and 1.6 ks), ROSAT-PSPC pointed observations of nearby sources (Mkn 1014 and MS 0158.5+0019) on 1992 January 17 and 1992 July 24 also covered the location of SDSS J0159+0033, placing more stringent upper limits on its flux of F0.1-2.4 keV < 2.6 × 10⁻¹⁴ and F0.1-2.4 keV < 4.6 × 10⁻¹³ erg cm−2 s−1, respectively. In contrast, the XMM–Newton observations of the same region performed in 2000 July (aimed at the nearby luminous QSO Mrk 1014), caught SDSS J0159+0033 in an X-ray bright state, with a flux of F2-10 keV = 2.6 × 10⁻¹³ erg cm−2 s−1, and a spectral shape typical of accreting SMBHs, characterized by a power law with slope ΓX = 2.1, and no sign of significant absorption at the redshift of the source4 (LaMassa et al. 2015). Finally, a Chandra observation of Mkn 1014 serendipitously covered SDSS J0159+0033 in 2005, and measured it to be a factor of ∼7 fainter than in 2000, but again with a power-law spectrum consistent with no absorption at the redshift of the source.
To place the observed high-amplitude variability, detected in both X-rays and SDSS optical spectra, into a long-term context, we have collected publicly available UV and optical photometric data points of the source spanning the last ∼30 yr, which we display in Fig. 1.
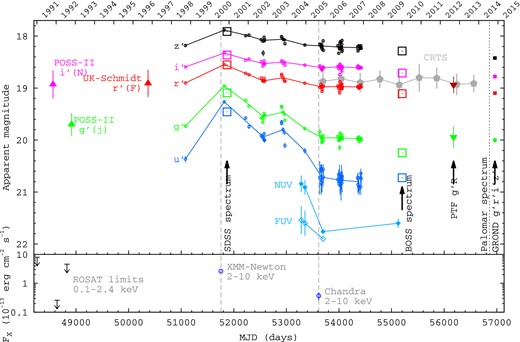
Top panel: long-term optical light curve for SDSS J0159+0033. The SDSS Stripe-82 photometric measurements in the u′g′r′i′z′ filters are shown with small open circle symbols (blue, green, red, magenta and black, respectively), with the yearly medians for each filter connected by solid lines. Stripe-82 epochs not meeting the data-quality criteria described in the text are omitted. The spectro-photometric measurements derived from the two epochs of SDSS spectroscopy (also for the u′g′r′i′z′ filters) are shown with large open boxes (offset by −0.3 mag to align roughly with the contemporary SDSS photometric measurements). Older photometric measurements derived from the Palomar and UK-Schmidt photographic plate surveys, are individually labelled (GSC 2.3.2; Lasker et al. 2008). They have been converted to the nearest SDSS filters according to the procedure described in Appendix A. The yearly median and rms of the unfiltered Catalina Real-Time Transient Survey (CRTS; Drake et al. 2009) measurements are shown with (grey) filled pentagons. The median and rms of the public Palomar Transient Factory (PTF; Rau et al. 2009) data in the g′ and R filters are shown with downwards-pointing triangles (green and red, respectively). GROND photometry (Greiner et al. 2008) in the g′r′i′z′ bands is shown with filled square symbols (green, red, magenta and black, respectively). GALEX (Martin et al. 2005) data points are shown with filled and open light blue diamonds for the NUV and FUV bands, respectively. The epochs of the XMM–Newton and Chandra X-ray observations are shown with vertical dashed lines. The bottom panel: shows the X-ray light curve.
There is no evidence for significant photometric variability after 2005. The spectral energy distribution (SED) of SDSS J0159+0033 derived from the most recent Stripe-82 photometric observations (autumn 2007) shows a great deal of consistency with the BOSS spectrum taken in 2010 (see Fig. 2, and Section 2.2 below). As a further check, we obtained seven-band (g′r′i′z′JHK) GROND (Greiner et al. 2008) observations of SDSS J0159+0033 on 2014 November 4, and found that the SED was still dominated by the host galaxy, fully consistent with all photometric observations since about 2005, including public photometry from wide-field, high-cadence, optical transient surveys (CTRS and PTF), and also confirmed by the Palomar spectrum taken in 2014 (presented by LaMassa et al. 2015).
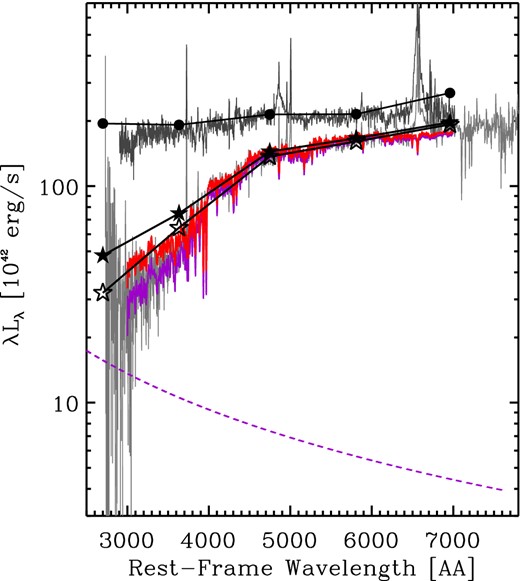
The two dark grey lines show the calibrated spectra (λLλ, in units of 1042 erg s−1) of SDSS J0159+0033 from 2000 (upper curve) and from 2010 (lower curve). Superimposed are the Stripe-82 u′g′r′i′z′ photometric data points from near the outburst peak (2000, black solid circles), and the weighted average of the last season of Stripe-82 photometry (2007, black solid stars). The red solid line is the best-fitting model to the continuum emission of the 2010 spectrum, which as described in detail in the text, is the sum of an SSP host galaxy spectrum (solid purple line) plus a power-law continuum, whose slope has been fixed at Flambda ∝ λ−2.33 (purple dashed line). Finally, the open star symbols show the implied ‘pure’ galaxy SED that we use to study the nuclear flare evolution.
More interestingly, we find that also all available data points before 1998 are consistent with the optical emission of the source being dominated by its host galaxy, albeit with larger uncertainties due to the poorer sensitivity and calibration of photographic plates. The older photometric measurements shown in Fig. 1 were derived from the Palomar and UK-Schmidt photographic plate surveys (GSC 2.3.2; Lasker et al. 2008), and have been converted to the nearest SDSS filters according to the procedure described in Appendix A. These also include a 1983 V-band observation (‘Palomar Quick-V Northern Survey’, not shown in Fig. 1) which translates to r′ = 19.17 ± 0.36 (see Table A1 in Appendix A). Uncertainties on those fluxes, however, are such that it is not possible to exclude that SDSS J0159+0033 was in a state of (low-level) AGN activity even before the flare began.
In summary, the only period during the last ∼30 yr when SDSS J0159+0033 was significantly brighter than its late-time (post-2005) constant level (both in X-rays and optical bands) was during the period between 1998 and 2005, suggesting a one-off, high-amplitude, flaring episode, rather than a more typical AGN variability pattern, often modelled as red-noise or ‘damped random walk’ (MacLeod et al. 2010, and references therein).
2.2 Spectral analysis
LaMassa et al. (2015) have presented a detailed analysis of the 2000 and 2010 spectra, and derived the mass of the central BH under the assumption that the observed broad Hα and Hβ emission lines are produced by virialized material in orbit around the central BH. Adopting the relation between observed line width, continuum luminosity and BH mass of Vestergaard & Peterson (2006) and Greene, Peng & Ludwig (2010) for Hβ and Hα, respectively, they derived a mass of about 1.7 × 10⁸ M⊙. Here, we briefly describe the results of our independent, detailed, spectral analysis.
The SDSS and BOSS spectra were obtained through different sized apertures (3.0 and 2.0 arcsec diameter, respectively). Therefore, we first corrected the spectro-photometric calibration of the SDSS (2000) and BOSS (2010) spectra by matching the i′-band spectro-photometric flux measurements (which, at the redshift of the source, z =0.312, is devoid of strong emission lines), to the nearest (in time) Stripe-82 i′-band photometric measurements. For the SDSS 2000 spectrum, this was the single Stripe-82 data point closest to the peak of the outburst, and for the BOSS 2010 spectrum we took a weighted average over the autumn 2007 i′-band photometric measurements (see Fig. 2).
We then fitted the BOSS 2010 spectrum in the regions of the most prominent emission lines (O ii , 3650 Å < λ < 3800 Å; Hβ, 4700 Å < λ < 5100 Å; Hα, 6480 Å < λ < 6750 Å). For the host galaxy continuum and absorption lines, we used the single stellar population (SSP) high-resolution evolutionary model templates from González Delgado et al. (2005), the preferred model (from a comparison with the broad-band SED) being a Z = 0.019 (i.e. ∼ solar metallicity) ‘Padova’ isochrone template with an age of 2.5 Gyr. The normalization of this component corresponds to a total mass of formed stars of ≈1.1 × 10¹¹ M⊙, which, taking into account stellar mass loss, would imply a stellar mass of the host galaxy of about ≈8 × 10¹⁰ M⊙.5 The corresponding model SED is shown in Fig. 2, and in the bottom panels of Fig. 4. To the stellar component, we added a power-law continuum to represent any residual nuclear emission, which is required to fit the blue end of the observed spectrum. However, the slope of such a component is barely constrained by the BOSS 2010 spectrum, and so we decided to fix it to that expected for the ‘canonical’ viscous accretion disc (Shakura & Sunyaev 1973) α = −1/3, where Fλ ∝ λ−2 + α. Changing the slope of the power-law component within the range observed from the flare emission during the outburst (see Section 3 below) changes our results only marginally, and not qualitatively.
We fit the emission lines with the MPFIT IDL routine (Markwardt 2009), using a set of Gaussians, as described below; the best-fitting parameters for the emission lines (of both the SDSS 2000 and BOSS 2010 spectra) are shown in Table 1.
Emission-line parameters derived from our spectral analysis (see Section 2.2 for details).
| SDSS 2000 | BOSS 2010 | |||||
|---|---|---|---|---|---|---|
| λ(Å) | FWHM (km s−1) | Lline(1040erg s−1) | λ(Å) | FWHM (km s−1) | Lline(1040erg s−1) | |
| |$[{\rm O\,\small {ii}}]$| | 3726.79a | 468a | 38.7a | 3726.79 ± 0.07 | 468 ± 13 | 38.7 ± 3.0 |
| Hβnarrow | 4860.8a | 309a | 18.0a | 4860.8 ± 0.1 | 309 ± 13 | 18.0 ± 1.8 |
| Hβbroad | 4865.8 ± 1.4 | 4493 ± 234 | 103.9 ± 5.1 | – | – | – |
| |$[{\rm O\,\small {iii}}]_{\rm narrow}$| | 5005.7a | 308a | 30.2a | 5005.5 ± 0.1 | 308 ± 13 | 30.2 ± 2.2 |
| |$[{\rm O\,\small {iii}}]_{\rm broad}$| | 5006.0 ± 0.5 | 753 ± 80 | 18.6 ± 2.6 | 5003.8 ± 0.6 | 774 ± 87 | 21.6 ± 5.1 |
| Hαnarrow | 6562.26a | 262.2a | 67.9a | 6562.26 ± 0.05 | 262.2 ± 5.1 | 67.9 ± 4.1 |
| Hαbroad | 6559.9 ± 0.9 | 3408 ± 110 | 329 ± 11 | 6582.4 ± 2.0 | 6167 ± 280 | 143.0 ± 6.7 |
| |$[{\rm N\,\small {ii}}]$| | 6582.7a | 276a | 29.5a | 6582.7 ± 0.1 | 276 ± 13 | 29.5 ± 2.9 |
| |$[{\rm S\,\small {ii}}]$| | 6715.8a | 358a | 24.1a | 6715.8 ± 0.2 | 358 ± 18 | 24.1 ± 2.2 |
aLine parameter fixed at the 2010 values.
Nuclear (host-subtracted) light curve of SDSS J0159+0033 in the u′g′r′i′z′ SDSS bands.
| MJD | |$L_{\lambda ,u^{\prime }}\Delta \lambda _{u^{\prime }}$| | |$L_{\lambda ,g^{\prime }}\Delta \lambda _{g^{\prime }}$| | |$L_{\lambda ,r^{\prime }}\Delta \lambda _{r^{\prime }}$| | |$L_{\lambda ,i^{\prime }}\Delta \lambda _{i^{\prime }}$| | |$L_{\lambda ,z^{\prime }}\Delta \lambda _{z^{\prime }}$| |
|---|---|---|---|---|---|
| (1042 erg s−1) | (1042 erg s−1) | (1042 erg s−1) | (1042 erg s−1) | (1042 erg s−1) | |
| 51081 | 7.1 ± 1.0 | 9.3 ± 0.6 | 4.0 ± 0.5 | 1.3 ± 0.5 | 2.7 ± 1.5 |
| 51819 | 29.8 ± 1.3 | 39.9 ± 0.8 | 17.4 ± 0.6 | 9.2 ± 0.5 | 16.4 ± 1.6 |
| 52225 | 20.9 ± 1.1 | 26.5 ± 0.7 | 10.5 ± 0.5 | 4.9 ± 0.5 | 11.0 ± 1.4 |
| 52288 | 17.1 ± 1.1 | 21.9 ± 0.7 | 9.5 ± 0.6 | 5.5 ± 0.5 | 11.5 ± 1.5 |
| 52522 | 13.7 ± 1.1 | 14.0 ± 0.6 | 7.1 ± 0.5 | 4.0 ± 0.5 | 7.4 ± 1.6 |
| 52551 | 13.6 ± 1.1 | 11.4 ± 0.6 | 5.2 ± 0.5 | 1.6 ± 0.5 | 6.1 ± 1.6 |
| 52558 | 12.9 ± 1.0 | 13.5 ± 0.6 | 5.3 ± 0.5 | 3.1 ± 0.5 | -2.9 ± 2.5 |
| 52576 | 12.3 ± 1.0 | 15.3 ± 0.6 | 5.1 ± 0.5 | 2.7 ± 0.5 | 6.4 ± 1.6 |
| 52577 | 14.4 ± 1.0 | 16.8 ± 0.6 | 6.9 ± 0.5 | 4.4 ± 0.5 | 9.5 ± 1.5 |
| 52585 | 12.2 ± 1.1 | 15.6 ± 0.6 | 5.4 ± 0.5 | 2.9 ± 0.6 | 7.3 ± 1.8 |
| 52909 | 18.4 ± 1.1 | 21.6 ± 0.6 | 9.0 ± 0.5 | 4.3 ± 0.5 | 10.1 ± 1.5 |
| 52910 | 19.2 ± 1.1 | 21.1 ± 0.7 | 9.8 ± 0.5 | 4.4 ± 0.5 | 9.6 ± 1.5 |
| 52935 | 15.9 ± 1.1 | 17.6 ± 0.7 | 7.4 ± 0.6 | 3.1 ± 0.6 | 7.8 ± 1.7 |
| 52963 | 14.8 ± 1.0 | 16.2 ± 0.6 | 5.5 ± 0.5 | 3.7 ± 0.5 | 7.3 ± 1.4 |
| 52971 | 10.6 ± 1.1 | 12.6 ± 0.6 | 5.0 ± 0.5 | 2.1 ± 0.5 | 4.0 ± 1.5 |
| 53351 | 9.1 ± 1.0 | 8.0 ± 0.6 | 3.9 ± 0.5 | 2.1 ± 0.6 | 3.0 ± 1.7 |
| 53634 | 3.4 ± 3.0 | 6.5 ± 1.7 | 1.6 ± 1.1 | 1.8 ± 0.7 | 3.6 ± 1.8 |
| 53655 | 5.0 ± 1.1 | 4.5 ± 0.7 | 3.2 ± 0.6 | 0.8 ± 0.5 | 2.5 ± 1.7 |
| 53665 | 2.6 ± 2.1 | 3.9 ± 1.0 | 1.6 ± 0.7 | 0.3 ± 0.6 | 1.5 ± 1.8 |
| 53669 | 5.1 ± 1.1 | 3.9 ± 0.6 | 1.7 ± 0.5 | 1.0 ± 0.5 | 2.3 ± 1.6 |
| 53671 | 4.6 ± 1.4 | 3.6 ± 0.7 | 2.3 ± 0.7 | 0.9 ± 0.6 | 3.6 ± 1.7 |
| 53676 | 3.0 ± 1.2 | 2.5 ± 0.6 | 0.6 ± 0.6 | 0.1 ± 0.5 | 1.3 ± 1.5 |
| 53679 | 2.3 ± 1.4 | 1.9 ± 0.7 | -0.8 ± 0.7 | -0.3 ± 0.6 | -0.0 ± 1.8 |
| 53700 | 4.9 ± 1.3 | 4.7 ± 0.7 | 2.0 ± 0.6 | 1.2 ± 0.6 | 6.4 ± 1.9 |
| 53705 | 3.5 ± 1.3 | 2.8 ± 0.7 | 2.0 ± 0.6 | 0.9 ± 0.6 | -0.8 ± 1.7 |
| 53975 | 3.1 ± 1.2 | 4.5 ± 0.6 | 2.2 ± 0.5 | 1.5 ± 0.5 | 2.4 ± 1.7 |
| 53994 | 4.0 ± 1.2 | 2.7 ± 0.6 | 1.0 ± 0.5 | 0.4 ± 0.5 | -3.0 ± 1.4 |
| 54008 | 2.8 ± 1.1 | 3.0 ± 0.6 | 1.8 ± 0.5 | 1.4 ± 0.5 | 1.4 ± 1.7 |
| 54010 | 2.7 ± 0.9 | 3.1 ± 0.6 | -0.3 ± 1.0 | 1.0 ± 0.5 | 0.1 ± 1.4 |
| 54012 | 4.1 ± 1.8 | 0.0 ± 1.1 | -1.6 ± 0.7 | -2.4 ± 0.6 | 0.2 ± 1.7 |
| 54020 | 2.3 ± 1.7 | 5.8 ± 1.0 | 4.8 ± 0.7 | 2.6 ± 0.7 | 4.5 ± 2.0 |
| 54024 | 2.7 ± 1.5 | 4.3 ± 0.7 | 3.2 ± 0.6 | 2.1 ± 0.6 | 5.6 ± 1.8 |
| 54030 | 2.7 ± 0.9 | 4.0 ± 0.6 | 2.2 ± 0.6 | 1.2 ± 0.5 | 0.6 ± 1.6 |
| 54037 | 3.6 ± 1.0 | 3.7 ± 0.6 | 2.2 ± 0.5 | 1.2 ± 0.5 | 1.4 ± 1.4 |
| 54040 | 1.5 ± 1.5 | 3.4 ± 1.0 | 0.7 ± 0.8 | 0.4 ± 0.6 | 0.8 ± 1.7 |
| 54049 | 3.6 ± 2.2 | 3.8 ± 1.1 | 2.9 ± 0.7 | 1.4 ± 0.6 | 1.6 ± 1.9 |
| 54053 | 3.0 ± 1.1 | 5.1 ± 0.7 | 3.4 ± 0.6 | 1.5 ± 0.6 | 3.6 ± 1.7 |
| 54056 | 2.6 ± 1.3 | 4.2 ± 0.6 | 0.6 ± 0.6 | -0.8 ± 0.6 | -1.7 ± 1.7 |
| 54059 | 3.2 ± 1.3 | 4.1 ± 0.7 | 1.9 ± 0.6 | 1.3 ± 0.6 | 6.7 ± 1.9 |
| 54062 | 3.7 ± 1.2 | 3.4 ± 0.6 | 1.6 ± 0.6 | 0.8 ± 0.5 | -0.6 ± 1.7 |
| 54357 | 3.5 ± 1.0 | 3.6 ± 0.6 | 1.8 ± 0.5 | 1.2 ± 0.5 | 1.9 ± 1.4 |
| 54359 | 2.3 ± 1.4 | 3.7 ± 0.7 | 1.6 ± 0.6 | 0.7 ± 0.7 | 0.2 ± 2.0 |
| 54362 | 3.3 ± 1.1 | 3.3 ± 0.6 | 1.7 ± 0.6 | 1.7 ± 0.5 | -1.4 ± 1.5 |
| 54376 | 2.1 ± 1.2 | 4.1 ± 0.7 | 1.4 ± 0.6 | 0.7 ± 0.5 | 2.3 ± 1.8 |
| 54382 | 1.8 ± 1.1 | 2.3 ± 0.6 | 0.9 ± 0.6 | 1.2 ± 0.6 | 1.8 ± 1.8 |
| 54385 | 1.8 ± 1.1 | 3.1 ± 0.6 | 1.1 ± 0.5 | 0.6 ± 0.5 | 0.3 ± 1.4 |
| 54411 | 3.5 ± 1.0 | 3.4 ± 0.6 | 2.2 ± 0.5 | 0.8 ± 0.5 | 0.7 ± 1.4 |
| 54413 | 2.0 ± 1.4 | 3.6 ± 0.7 | 2.7 ± 0.6 | 0.8 ± 0.6 | 1.2 ± 1.9 |
| 54415 | 4.2 ± 1.1 | 3.4 ± 0.9 | 1.6 ± 0.5 | 1.0 ± 0.5 | 2.4 ± 1.6 |
| 54422 | 3.3 ± 1.3 | 2.9 ± 0.6 | 1.6 ± 0.6 | 0.7 ± 0.6 | 0.5 ± 1.6 |
For the Hβ region in the BOSS 2010 spectrum (see top left plot in Fig. 4), one narrow component is sufficient to fit the Balmer line, while the [O iii] complex (where we fixed the flux of [O iii]4959 Å to be 1/3 of the [O iii]5007 Å flux) requires an additional, blueshifted broad component, typically associated with outflows in the narrow-line region (NLR) ionized gas. This blue wing has a measured full width at half-maximum (FWHM) of 774±87 km s−1 and is blueshifted by about 100 ± 50 km s−1 with respect to the narrow component. Such a width for the broad component of [O iii] is well within the average for Seyfert 2 galaxies in SDSS of similar luminosity as SDSS J0159+0033 (Mullaney et al. 2013), but not so high as to place it squarely among the secure sources of AGN-driven outflows (typically requiring FWHM >1000 km s−1; see e.g. Brusa et al. 2015).
In the Hα region of the BOSS 2010 spectrum (see top right-hand plot in Fig. 4), in addition to the narrow Hα line and [N ii] complex (where, again, we fixed the flux of [N ii]6548 Å to be 1/3 of the [N ii]6583 Å flux), a very broad line is required, as already noticed by LaMassa et al. (2015).
The narrow lines observed in the BOSS 2010 spectrum can be used to investigate the source of ionizing radiation that excited them. We plot in Fig. 3 the BPT (Baldwin, Phillips & Terlevich 1981) diagnostic diagram for our measurements of the narrow emission lines ([O iii] Hβ, [N ii] and Hα) as well as those derived from the analysis of the three spectra presented by LaMassa et al. (2015, the 2000 SDSS and 2010 BOSS spectra, as well as a later Palomar DBSP spectrum taken in 2014). As expected, since we fit two components to the [O iii] lines, we find different Hβ/[O iii] flux ratios to those of LaMassa et al. (2015), who adopt a single component model, whilst the [N ii]/Hα and [S ii]/Hα line ratio measurements are in agreement. If we only consider the narrow components of [O iii], SDSS J0159+0033 appears to lie well within the ‘transition’ region between star-forming galaxies and AGN. On the other hand, if we sum together both narrow and broad components of the [O iii] line, the object moves into the AGN-dominated part of the diagram. Thus, it appears that the line-emitting material was probably ionized by a source harder than that associated with pure star formation. AGN activity would of course provide a sufficiently hard ionizing source, but the exact amount of any putative AGN contribution to the observed narrow-line emission is harder to disentangle. We discuss the consequence of the narrow emission lines properties for the interpretation of the flare in Section 5.2.
![Line emission diagnostic (BPT; Baldwin et al. 1981) diagrams for the three spectroscopic observations (2000 SDSS, black circle; 2010 BOSS, triangle and 2014, square) of SDSS J0159+0033 presented in LaMassa et al. (2015). The red triangles show the results of our own analysis of the 2010 spectrum: the filled symbol corresponds to the case in which we only consider the narrow [O iii] line component, the empty one for the sum of broad plus narrow [O iii] line components. In each panel, the dot–dashed line represents the Kewley et al. (2006) separation between pure AGN and the rest of the galaxy population. In the left-hand panel, the dashed line is the separation between star-forming galaxies and ‘transition’ objects (i.e. those with ionizing photons coming from both star-forming regions and AGN) defined by Kauffmann et al. (2003).](https://oup.silverchair-cdn.com/oup/backfile/Content_public/Journal/mnras/452/1/10.1093/mnras/stv1095/2/m_stv1095fig3.jpeg?Expires=1750340093&Signature=dggvtBTcMv6FJa-BhyKFTVLwn8NqdKV2pNy4qy4z7zjrzF11LCniEtJFWDYrj070Gzi6pZVchEWwfpbUaFuWk8FoovE3hzZVDxJMZqZ3pn0hc3vDTP3P3uQu3H65JNYkFavr6aLTvWKEVFQTixrfbScWvXRu9YW3QePWHlnfK8N3MTbvB8z4Mt-YLrFQ2OPbrWgLDJ455b3bpRzR37MW8qO9k3MepU6DN~rVoq2lzfrmip3okx~-jZwvje-6PLFVSuaLtZw19-IRtS8go3BmmHbtZoSGa7IkvEyOTQIA5YqiAKP9wfvRje5fR-509nUtqrMM43Wkhn08zNQEMy-DfA__&Key-Pair-Id=APKAIE5G5CRDK6RD3PGA)
Line emission diagnostic (BPT; Baldwin et al. 1981) diagrams for the three spectroscopic observations (2000 SDSS, black circle; 2010 BOSS, triangle and 2014, square) of SDSS J0159+0033 presented in LaMassa et al. (2015). The red triangles show the results of our own analysis of the 2010 spectrum: the filled symbol corresponds to the case in which we only consider the narrow [O iii] line component, the empty one for the sum of broad plus narrow [O iii] line components. In each panel, the dot–dashed line represents the Kewley et al. (2006) separation between pure AGN and the rest of the galaxy population. In the left-hand panel, the dashed line is the separation between star-forming galaxies and ‘transition’ objects (i.e. those with ionizing photons coming from both star-forming regions and AGN) defined by Kauffmann et al. (2003).
Moreover, the strong [O ii] emission line can also be used to infer an approximate star formation rate (SFR) of the host. We follow the procedure of Silverman et al. (2009) to correct the [O ii] for any possible AGN component, by assuming that all observed [O iii] emission is AGN driven, thus obtaining a lower limit to the derived SFR. We assume a fixed [O ii]/[O iii]=0.21 ratio for AGN-only excited emission lines, and use the difference |$L_{\rm [O\,\small {ii}]}-L_{\rm [O\,\small {ii}],AGN}$| to derive an SFR (see equation 2 of Silverman et al. 2009). Under this assumption, we obtain log SFR ≈1.6 (M⊙ yr−1).
A direct comparison between the emission lines seen in the 2010 BOSS and 2000 SDSS spectra can reveal the variable components, and help determine their physical origin. In our analysis of the 2000 SDSS spectrum, taken very close in time to the photometric peak of the light curve (see Fig. 1), we have first assumed that the host galaxy continuum and the narrow emission lines seen in the 2010 BOSS spectrum have not changed significantly over the intervening 10 yr. This baseline constant spectrum is shown as a dashed red line in the middle panels of Fig. 4. We then take the difference of the two spectra (difference = 2000 SDSS spectrum – 2010 host galaxy emission model), plotted in the bottom panels of Fig. 4. In the Hβ region, a clear rising continuum is visible, with a prominent broad Hβ emission line. We fix the power-law continuum slope to that measured over the entire spectral range in the difference spectrum, α = −0.5, leaving its normalization free, and measure the flux and FWHM of the broad lines (also reported in Table 1). The [O iii] emission region is noisy, but the spectrum taken at the peak of the outburst does also show a broad component, which is consistent with having the same properties of that observed 10 yr later (FWHM of 753 ± 80 km s−1).
![Left: spectral analysis of the Hβ region. The top panel shows the calibrated BOSS 2010 spectrum with uncertainties (black histogram with grey error bars), fitted with a host galaxy continuum model from González Delgado et al. (2005; a 2.5 Gyr old Z = 0.019 SSP; top purple dashed line), a power-law continuum of slope α = −1/3 (bottom purple dashed line), narrow Hβ and [O iii] emission lines (green solid line) and a broad [O iii] component (blue solid line). The middle panel shows the observed, calibrated 2000 SDSS spectrum, together with the 2010 best-fitting host galaxy model continuum plus narrow emission lines (red dashed line). The bottom panel shows the difference spectrum (2000–2010), where the rapidly time-varying emission components emerge. This difference spectrum is fitted with a power law of slope α = −0.5, where Fλ ∝ λ−2 + α (dashed purple line) plus broad Hβ and [O iii] emission lines (cyan line). Right: spectral analysis of the Hα region. The top panel shows the calibrated BOSS 2010 spectrum with uncertainties (black histogram with grey error bars), fitted with a host galaxy continuum model from González Delgado et al. (2005; a 2.5 Gyr old Z = 0.019 SSP; purple dashed line), a power-law continuum of slope α = −1/3 (bottom purple dashed line), a narrow Hα and [N ii] emission lines (green solid line) and a broad Hα component (blue solid line). The middle panel shows the observed, calibrated 2000 SDSS spectrum, together with the 2010 best-fitting model host galaxy continuum plus narrow emission lines (red dashed line). The bottom panel finally shows the difference spectrum (2000–2010), where the rapidly time-varying emission components emerge. This difference spectrum is fitted with a power-law continuum (dashed purple line) plus broad Hα emission line (cyan line).](https://oup.silverchair-cdn.com/oup/backfile/Content_public/Journal/mnras/452/1/10.1093/mnras/stv1095/2/m_stv1095fig4.jpeg?Expires=1750340093&Signature=xZmAZq-IB4U3uJ4xKF~WOmsvpvpXD76BWSskYELBFgICUeB8gyKeIA6IkntVeditU9HSy49qjhrIDoNGM0kKm51zQOpATWhR0arrAuU2ifvkORzAgQgQR3Rsl7l7GZVS~DBwHDSgk40sSNYPqX6uket0rkZJSOpMxZcyeXEkDF0piBbH~jXYHEWo1yTMMnikupNHyju2vfg82jZwZHQaYWHWenqIHztB8uiHlzEB90cR3vN0CiZe0ivp3if45wAL4DzQgfKLkeuhcRjZv10bsRJ9zLNeDQmcIdgaK2Lb-9Q8j7keAmdIoDk3~ShByBpgfU2RYtNBE7Y5lipgL97cTw__&Key-Pair-Id=APKAIE5G5CRDK6RD3PGA)
Left: spectral analysis of the Hβ region. The top panel shows the calibrated BOSS 2010 spectrum with uncertainties (black histogram with grey error bars), fitted with a host galaxy continuum model from González Delgado et al. (2005; a 2.5 Gyr old Z = 0.019 SSP; top purple dashed line), a power-law continuum of slope α = −1/3 (bottom purple dashed line), narrow Hβ and [O iii] emission lines (green solid line) and a broad [O iii] component (blue solid line). The middle panel shows the observed, calibrated 2000 SDSS spectrum, together with the 2010 best-fitting host galaxy model continuum plus narrow emission lines (red dashed line). The bottom panel shows the difference spectrum (2000–2010), where the rapidly time-varying emission components emerge. This difference spectrum is fitted with a power law of slope α = −0.5, where Fλ ∝ λ−2 + α (dashed purple line) plus broad Hβ and [O iii] emission lines (cyan line). Right: spectral analysis of the Hα region. The top panel shows the calibrated BOSS 2010 spectrum with uncertainties (black histogram with grey error bars), fitted with a host galaxy continuum model from González Delgado et al. (2005; a 2.5 Gyr old Z = 0.019 SSP; purple dashed line), a power-law continuum of slope α = −1/3 (bottom purple dashed line), a narrow Hα and [N ii] emission lines (green solid line) and a broad Hα component (blue solid line). The middle panel shows the observed, calibrated 2000 SDSS spectrum, together with the 2010 best-fitting model host galaxy continuum plus narrow emission lines (red dashed line). The bottom panel finally shows the difference spectrum (2000–2010), where the rapidly time-varying emission components emerge. This difference spectrum is fitted with a power-law continuum (dashed purple line) plus broad Hα emission line (cyan line).
We can use the measured parameters of the broad emission lines to estimate the mass of the central BH, using the standard ‘single epoch’ virial method (see e.g. Peterson et al. 2004, and references therein). We adopt the Greene & Ho (2007) scaling between BH mass, Hα FWHM and Hα line luminosity to derive log(MBH/M⊙) ≃ 7.8 and log(MBH/M⊙) ≃ 8.2 for the 2000 and 2010 spectra, respectively. Scaling laws to obtain BH masses from the measured width of the Hβ line and the continuum luminosity at 5100 Å (in 2000 measured to be λL5100 = 6.8 × 1043 erg s−1) have been published by many authors. Adopting the calibration of Vestergaard & Peterson (2006), we derive log(MBH/M⊙) ≃ 8.1, while following Greene et al. (2010) we get log(MBH/M⊙) ≃ 8.2. All these estimates come with both statistical and systematic uncertainties of about 0.3 dex, due to the uncertain calibration and the unknown geometry of the broad-line region (BLR) itself (see e.g. Shen & Kelly 2012). Encouraged by the consistency among all the virial BH mass estimators (see also LaMassa et al. 2015), we consider these estimates robust, and, for the remaining of the paper, assume a fiducial SMBH mass of 108 M⊙.
In Sections 5.1 and 5.2, we discuss the observed properties of the emission-line regions within the context of our interpretation of the observed flare from SDSS J0159+0033.
3 THE BOLOMETRIC LIGHT CURVE OF THE FLARE
A change in the optical spectral properties of AGN as dramatic as that observed in SDSS J0159+0033, and taking place within just 10 yr, is very unusual. LaMassa et al. (2015) have discussed a possible interpretation of these rapid changes of flux and spectral properties within the context of the extreme end of normal AGN variability. Given the implied size of the BLR, and the observed X-ray spectra (both XMM–Newton and Chandra can be fitted with unabsorbed power laws), they conclude that an obscuration event, in the form of a large-scale cloud passing in front of the central source and of the BLR, is not consistent with the time-scale of the observed fast flare, nor with the spectral slope of the 2005 Chandra spectrum. It appears, then, that the intrinsic emission of the AGN is fading rapidly, possibly due to a decrease of the accretion rate on to the central BH. However, in the context of standard accretion-disc theory, it is not straightforward to explain both the rapid fading in the period 2000–2005 and, in particular, the very fast brightening of the source between 1998 and 2000; viscous time-scales of optically thick and geometrically thin accretion discs as close as 10 gravitational radii from a 108 M⊙ BH, with the luminosity observed close to its peak, are of the order of a few years (see Section 5 below). Larger discs, needed if the observed optical light is produced from viscous dissipation within the disc itself, would evolve on even longer time-scales.
It appears, then, that a physical process is required that can give rise to rapid enhancement of the accretion rate, a process that delivers large quantities of matter very close to the central BH, where viscous (or thermal) times are the shortest. Moreover, such a process must be highly intermittent, because, as we discussed before, the long-term light curve of SDSS J0159+0033 is essentially dominated by this one single flare. In the following, we describe why we believe that a TDE is a much more natural interpretation for this peculiar transient event.
We first analyse in more detail the evolution of the flare, as traced by the Stripe-82 light curve. Our starting point is the Stripe-82 photometry for SDSS J0159+0033 and two neighbouring reference stars (SDSS J020002.27+003250.6, an r ≈ 18 mag star about 1.2 arcmin away, and SDSS J015955.54+003419.6, an r ≈ 16.1 star about 1.26 arcmin away), retrieved from the SDSS DR7 data server.6 In the few cases where multiple data points were found with the same MJD, we took daily averages, resulting in 70 independent epochs of photometry. We then cleaned the light curve by excluding all epochs with poor photometry, as deduced by comparing the flux of each reference star in each epoch and each band with their long-term average, and discarding all epochs where the average flux of the two stars in any band is more than 2σ off its mean. This leaves us with 50 high-quality epochs of photometry.
We then calculate the ‘baseline’ non-varying host galaxy luminosity in each of the five SDSS filters by assuming that the weighted average of the light collected in the last 10 epochs of Stripe-82 data (autumn 2007) is due to the large-scale galaxy stellar emission, plus a small contribution from a nuclear power law (which we constrained by analysing the 2010 BOSS spectrum, see Section 2.2 above). The SED of the baseline ‘pure’ (i.e. with the nuclear power-law component removed) galaxy emission is shown in Fig. 2 as empty stars.
We then derive the ‘nuclear’ luminosity7 in each SDSS filter by subtracting the baseline host flux from the observed flux at each Stripe-82 epoch (see Table 2, columns 2–6, where we report the source nuclear luminosities based on SDSS modelMag). Finally, we compute the total optical luminosity of the nuclear flare |$L_{\rm opt,nuc}=\int _u^z L_{\lambda } \mathrm{d}\lambda \simeq \sum _{i} L_{\lambda ,i} \Delta \lambda _i$|, where the integral extends over the entire SDSS bandpass, and the summation is over the u′g′r′i′z′ SDSS filters, each characterized by a bandwidth Δλi (Fukugita et al. 1996).
The top panel of Fig. 5 shows the time evolution of the optical nuclear luminosity Lopt, nuc, where each epoch is represented by a data point of a different colour. A simple power-law fit to the time evolution of the flare in its decay phase gives a slope of n∞ = −1.59 ± 0.05, only slightly shallower than the predictions of simple tidal disruption flare models (a power-law evolution in with slope −5/3; Rees 1988; Lodato, King & Pringle 2009; Guillochon & Ramirez-Ruiz 2013).
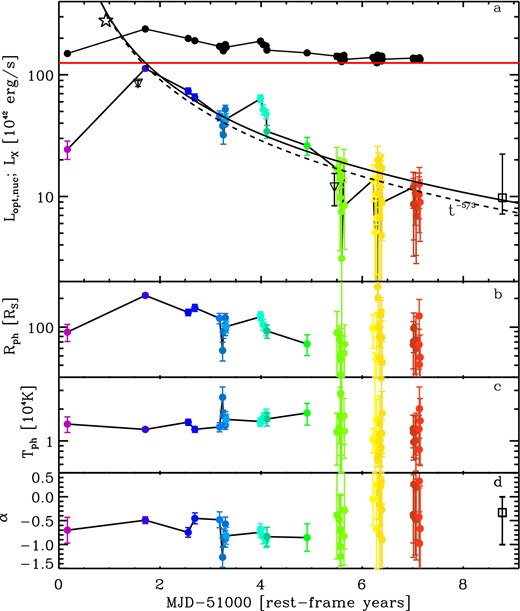
Panel (a): the time evolution of the nuclear luminosity is shown with the coloured circles (where each colour identifies one epoch of the SDSS Stripe-82 observations). The black circles are the total optical luminosity of SDSS J0159+0033, shown here for reference, together with the estimated (constant) luminosity of the host galaxy (red horizontal dot–dashed line). The empty triangles show the X-ray (2–10 keV) luminosity measured by XMM–Newton (first epoch) and Chandra (second epoch). The black solid line is the best-fitting power-law evolution of the flare decay, including all data points (with slope of −1.59 ± 0.05). The dashed line, which is not a fit to the data, shows the t−5/3 long-term decline expected in most TDE models. The empty star shows the approximate location of the peak in our ‘fiducial’ TDE model (see text for details), while the empty square at late times is the corresponding optical luminosity of the power-law component fitted to the BOSS 2010 spectrum, as described in Section 2.2, and plotted in Fig. 6 with a purple dashed line. Panels (b) and (c) show the evolution of the best-fitting photospheric radius (in units of the Schwarzschild radius for a 108 M⊙ black hole) and temperature (in units of 104 K), obtained by fitting the optical photometric SED with a simple blackbody spectrum (filled circles). Panel (d) shows the best-fitting power-law slope α, where Lλ ∝ λ−2 + α. In all panels, the black solid line connecting the points is drawn to guide the eye.
Fig. 6 shows the evolution of the optical SED of the flare; for clarity, only the first 16 epochs of Stripe-82 photometry are shown, with the same colour code of Fig. 5. As a reference, the plot shows also the constant baseline host galaxy SED in the five optical bands (black empty stars, as in Fig. 2). The emission in the u′g′r′i′ filters is consistent with a spectrum that rises steeply with frequency. On the other hand, the z′-band magnitudes are affected by the strong Hα emission, which, at the peak, contributes to about 25 per cent of the observed flux in that band, and this contribution increases as the luminosity of the power-law continuum declines. To better characterize the spectral evolution of the flare, we first fitted the u′g′r′i′ data points with a simple power-law Lν ∝ ν−α (or, equivalently, Lλ ∝ λ−2 + α), and we plot the evolution of the spectral index α in panel (d) of Fig. 5. The slopes that we obtain are slightly steeper than the expected ν1/3 law of a geometrically thin, optically thick (untruncated) accretion disc (Shakura & Sunyaev 1973), but are consistent with previous optical observations of well-sampled TDEs (Gezari et al. 2012; Holoien et al. 2014). The overall ‘colour’ evolution of the flare, as diagnosed by the Stripe-82 u′g′r′i′ light curves, is mild, and reminiscent of the almost constant-temperature evolution seen in most well-sampled TDE light curves (Gezari et al. 2012; Holoien et al. 2014). In fact, this behaviour is a challenge to the simplest model of a ‘bare’ viscous accretion-disc evolution for the decay phase of TDEs, and Guillochon, Manukian & Ramirez-Ruiz (2014) have argued that an extended, large-scale reprocessing layer should be present to produce the observed (almost) achromatic evolution of TDE flares. Such a reprocessor should be expected on the basis of the results of hydrodynamical simulations, that show indeed large amounts of debris present at distances ranging from the outer disc of the bound material that slowly returns to pericentre, r0 ≈ 2(GMBH/π2)1/3t2/3, to the size of the expanding shell of unbound material expelled from the disrupted portions of the star, which moves away from the BH (see Section 4 below). As a simple phenomenological test of the above scenario, we have also fitted the same spectral evolution data shown in Fig. 6 with a single-temperature blackbody spectrum, assuming, for simplicity, an emitting area Aph = 4πRph. Panel (c) of Fig. 5 shows the evolution of the best-fitting photospheric temperature (in units of 104 K), while panel (b) shows the time evolution of the photospheric radius of the emitting surface, Rph (in units of the Schwarzschild radius for a 108 M⊙ BH). Indeed, photospheric temperature changes throughout the flare appear to be mild, if not negligible: the flare displays both temporal and spectral evolution very similar to known UV/optical tidal disruption flares. We discuss in the following section the constraints on the TDE model parameters we can obtain by modelling these data.
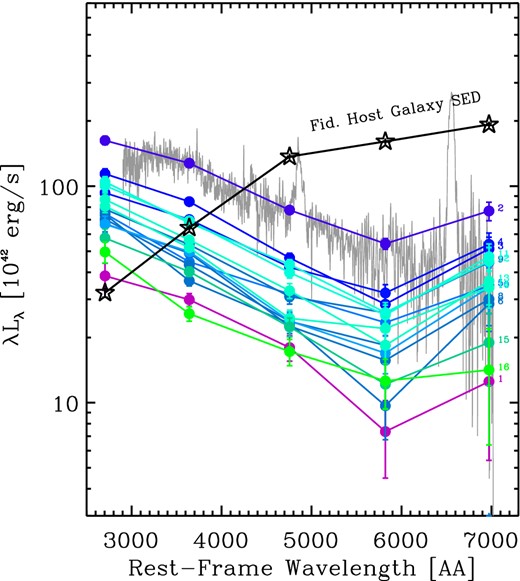
Time evolution of the nuclear optical SED during the flare of SDSS J0159+0033. For each of the first 16 epochs of the cleaned Stripe-82 light curve, spanning the first five rest-frame years, shown in Fig. 5, we plot the monochromatic luminosity, λLλ, in units of 1042 erg s−1, in the u′g′r′i′z′ bands as filled coloured circles. The colour code is identical to that of Fig. 5: each colour corresponds to a different Stripe-82 epoch, as marked on the right of each SED. As in Fig. 2, the empty black stars indicate the baseline (constant) host galaxy SED, derived by taking the weighted average of the photometric data points of the last season of Stripe-82 observations (last 10 epochs, autumn 2007) and subtracting the small power-law contribution that was estimated from the 2010 spectrum. The light grey line shows the difference spectrum between the peak flare (2010) and the host, with the corresponding difference-photometry data points marked as blue solid circles (see Section 3 for more details).
4 THE FLARE AS A TIDAL DISRUPTION EVENT
4.1 Constraining the parameters of TDE models
In the above expressions, Aγ and Bγ represent rational functions of the penetration factor β, evaluated from the numerical simulations for different values of the polytropic index γ (assumed to be equal to 4/3 and 5/3 for high- and low-mass stars, respectively). Their form can be found in equations (A5)– (A8) of Guillochon & Ramirez-Ruiz (2013, 2015b). To further simplify the analysis, we assume a fixed mass–radius relation for main-sequence stars, as given by Tout et al. (1996); we fix the boundary between low- and high-mass stars at 0.6M⊙, and the BH mass to MBH = 108 M⊙, so that the overall family of TDE light curve only depends on the penetration factor β and the star's mass M*.
The left-hand panel of Fig. 7 shows the allowed range of the two-dimensional parameter space defined by the penetration factor β and the star's mass (in solar units), given the above constraints. We obtain a minimum mass of about M*, min = 1.2 M⊙ and a quite narrow range of penetration factors, which widens up as more massive stars are considered. Just as a reference point for discussion, we mark with a black star in Fig. 7 a ‘fiducial’ parameter combination allowed by the data: a 2 M⊙ star with pericentre passage just 1.2 times smaller than its tidal radius. Such an event would produce a flare of optical luminosity Lopt, peak ≃ 2.8 × 1044(ϵ/0.1)(κopt/5)−1, almost three times higher than the maximum caught by SDSS in 2000. The peak time would be ≈0.96 yr after disruption, and, from equations (A3)– (A4) of Guillochon & Ramirez-Ruiz (2013), would evolve to the asymptotic decay power-law slope n∞ ≈ 1.64, consistent, within the uncertainties, with the observed value. Based on the same fiducial model, the amount of mass lost by the star would be ΔM ≈ 0.36 M⊙ (≈18 per cent of the star's mass). Indeed, as a final consistency check, we derived the (bolometric) fluence of the flare, measured with only the available data points: |${\cal F}_{\rm bol}\approx 4\times 10^{52} (\kappa _{\rm opt}/5)$| erg. Assuming a 10 per cent radiative efficiency, this corresponds to about 0.2 M⊙ accreted on to the central SMBH, consistent with the expectations of the fiducial TDE model described above.
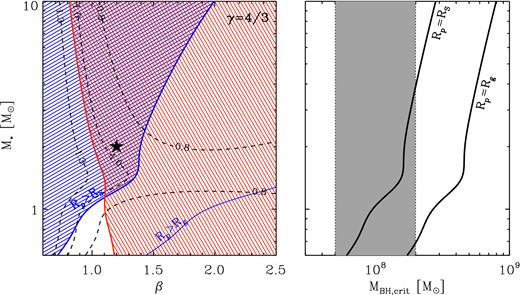
Left: the allowed range of the TDE model parameters β ≡ RT/Rp (penetration factor) and M* (star's mass) is shown as a doubly shaded (blue and red) wedge. It is derived by the combination of two independent constraints: (i) pericentre passage must occur outside the SMBH event horizon (Rp > RS, thick blue line, for the two extreme cases of non-spinning black hole and thin blue line for the case of maximally spinning hole, Rp > Rg); and (ii) the peak luminosity of the flare has to be at least as high as the observed one (assuming a optical-to-bolometric correction of 5 and a radiative efficiency of 10 per cent, solid red line). The black dashed lines show the contours of equal peak time, in rest-frame years. The black star mark a ‘fiducial’ model, discussed in the text, for illustration purposes. Right: the relation between the critical black hole mass MBH, crit (x-axis), above which stars are swallowed whole and no tidal disruption flare can be observed and the star's mass (y-axis) is shown as a black solid line for the case of non-spinning black holes (leftmost line) and maximally spinning black holes (rightmost line). The vertical dashed area mark the range of possible SMBH masses estimated for SDSS J0159+0033 on the basis of the observed broad emission lines.
The right-hand panel of Fig. 7 shows the relation between the critical BH mass MBH, crit, above which stars are swallowed whole and no tidal disruption flare can be observed and the star's mass, for the case of non-spinning BHs and maximally spinning BHs.
The above estimates serve to emphasize, first of all, that a TDE explanation for the observed flare is energetically viable, and, secondly, that well-sampled light curves of tidal disruptions flares by BHs of known mass could provide tight constraints on accretion parameters that are typically elusive in steady accreting systems, such as the radiative efficiency (and thus the BH spin), and the accretion flow bolometric corrections (Guillochon et al. 2014).
To conclude this section, we note that a prominent re-brightening flare was observed about four rest-frame years after the peak. This subflare is characterized by a relatively constant continuum slope and photospheric temperature, and has a fluence of about 5.5 × 1051(κopt/5) erg, corresponding to 14 per cent of the fluence of the whole flare. Among well-monitored TDE so far, only the Swift-selected ‘relativistic’ events (Burrows et al. 2011; Bloom et al. 2011; Cenko et al. 2012b) did show clear structures in their declining light curves, but it is possible that this is simply a selection effect due to lack of long-term dense monitoring of more recently discovered optical TDEs. Lacking a large sample of well-sampled optical light curves of TDEs, it is beyond the scope of this paper to speculate about the nature and causes of this apparent secondary flare event, but one should consider testing hydrodynamical models of tidal disruptions, including the expectations from binary events (Mandel & Levin 2015), to assess whether such events may pose a real challenge to the TDE interpretation of this flare, and point towards an alternative explanation in terms of AGN accretion physics, as we discuss below.
5 DISCUSSION
A previous search for TDEs in the Stripe-82 data (van Velzen et al. 2011) did not select SDSS J0159+0033 as a good tidal disruption candidate. We believe there are two concurrent reasons for this: first of all, the flare we observe is rather slow (taking more than 5 yr to return to quiescence), whilst van Velzen et al. (2011) selected preferentially flares which lasted only one season of Stripe-82 observations. More critically, van Velzen et al. (2011) excluded from their final list of TDE candidates all those with known AGN spectroscopic classification. It is just due to a fortuitous coincidence that the first 2000 SDSS spectrum, showing the prominent broad emission lines that led to type-1 AGN classification, was taken very close in time to the flare peak, and we suspect this crucial detail had been overlooked.
Of course, the main question we would like to answer is the following: is the observed flare from SDSS J0159+0033 the result of the tidal disruption of a star, or just a particularly strong and rapid AGN outburst? To a certain extent, this is an ill-posed question, as TDEs are in fact just a specific class of AGN outbursts. The analysis presented in the previous section, however, suggests that the observed light-curve evolution, and, in particular, the overall energetics of the event are consistent with the amount of accreted mass being a substantial fraction of a massive main-sequence star. In general terms, well-sampled light curves are probably the most powerful tool in order to distinguish TDE-induced flares from stochastic AGN variability, as demonstrated by the recent example of the nearby source IC 3599 (Campana et al. 2015).
The X-ray spectrum observed by XMM–Newton close to the peak of the light curve is consistent with a power law of index 2.1 (LaMassa et al. 2015), similar to what typically observed in luminous AGN. Simple thermal models for the emission from a TDE do not predict such a ‘corona-like’ spectrum, very much as the standard Shakura–Sunyaev theory of geometrically thin and optically thick accretion discs does not predict the ubiquitous Comptonizing medium inferred from X-ray spectra of AGN. Indeed, most TDE candidates detected by ROSAT, XMM–Newton and/or GALEX showed mostly very soft spectra, well fitted by a blackbody model and/or much steeper power law (Brandt, Pounds & Fink 1995; Bade, Komossa & Dahlem 1996; Komossa & Greiner 1999; Greiner et al. 2000; Gezari et al. 2008; Esquej et al. 2008). But harder X-ray spectra have been observed recently from candidate TDEs, too (Cenko et al. 2012a; Nikołajuk & Walter 2013; Saxton et al. 2014). In general, too little is currently known about the spectral formation mechanisms in TDE, across the entire electromagnetic spectrum, to be able to reject the TDE interpretation on the basis of the X-ray spectral shape only. Moreover, we note that, in general, optically selected TDE tend to have low photospheric temperatures and be X-ray faint, while X-ray-selected TDE tended to be hot (when thermal) and optically faint (see e.g. fig. 4 in Gezari 2012), clearly suggesting we are barely scratching the surface in our understanding of TDE selection effects.
There are, moreover, other pieces of evidence that are not straightforward to interpret within the simplest TDE scenario we have described so far. In particular, the properties of the emission lines observed in the spectra are not easily explained by a TDE model, as we discuss in the following subsections.
5.1 The broad-line region
Only since the discovery of the first optically selected TDEs (van Velzen et al. 2011; Gezari et al. 2012), and the consequent availability of early spectroscopic follow-up observations, it has become evident that the emission from tidal disruptions of stars is accompanied by the presence of broad emission lines in their optical spectra. The broad emission-line phenomenology is diverse, with some objects showing only high-ionization lines (typically He ii λ4686), others only Balmer lines, and others still both He and H lines (Arcavi et al. 2014). Measured line widths vary between a few thousands to about 10 000 km s−1. If these broad emission lines are produced by stellar debris illuminated by the tidal disruption flare, we can immediately rule out them being located at a distance from the hole of the order of the circularization radius (typically assumed to be equal to 2Rp), as this would imply (Keplerian) velocity widths of a few times 104 km s−1. In fact, two possible alternative sites of broad emission-line production have been invoked for TDE. Guillochon et al. (2014) argue that the bound material extending out to r0 (see Section 4.1 above) will constitute an elliptical accretion disc, growing inside-out, eventually reaching densities and ionization states leading to the generation of broad, permitted atomic emission lines, very much like those generated by long-lived AGN. According to this scenario, high-ionization lines should appear first, followed by lower ionization lines later on during the outburst. Alternatively, Strubbe & Quataert (2009) considered the outbound stellar material, flying away from the disruption site and extending out to Rmax = RTβ1/2(t/tdyn, *) ≈ 2.2 × 10¹⁷(Rp/RS)−1/2[(t − tp)/yr] cm, as the site of line emission processes. They, however, predicted both emission and absorption lines, and significant bulk blueshift of the lines, contrary to what is typically observed. Moreover, as discussed in detail in Guillochon et al. (2014), Newtonian hydrodynamic simulations clearly show that the unbound material will be confined to a thin filament, covering a small solid angle as seen by the central black hole (Kochanek 1994), hardly large enough to produce emission lines with the observed equivalent width.
The broad Balmer emission lines (Hα, Hβ and Hγ) observed in the 2000 SDSS spectrum of SDSS J0159+0033 do appear at first sight like ordinary QSO broad lines: they are not strongly asymmetric, have no absorption through or P-Cygni profile, and have measured FWHM ranging between 3.4 and 4.5 × 10³ km s−1 (see Table 1). If they are produced by a mechanism analogous to that which generates the BLR in most AGN (an assumption we have implicitly used by adopting the ‘single epoch’ virial BH mass estimates for this object), then they should follow the BLR luminosity-size relation (RBLR ∝ Lδ, with δ = 0.4 − 0.6), which would put them at a distance of about 30 light days (Bentz et al. 2006), i.e. ≈2.6 × 10³RS for a 108 M⊙ central BH.9 This is inconsistent with the Guillochon et al. (2014) ‘inner-accretion-disc’ interpretation, as r0 is only about half this value at the time of the 2000 SDSS spectroscopic observation, and only reaches these distances about three rest-frame years after the observed peak.
However, the most serious problem for the interpretation of the broad emission lines as originating in the stellar debris, is the implied gas mass by the standard ionization/recombination model for BLR. Comparing the measured equivalent widths of Hα and Hβ in the 2000 SDSS spectrum with those predicted by Korista & Goad (2004) as a function of the ionizing flux and BLR particle density, we derive a particle density of about log n ≈ 10.5 (assuming an ionizing luminosity of 1044 erg s−1, and a distance of the BLR of 30 light days). The amount of material needed, assuming spherical geometry is a few hundred solar masses (see Baldwin et al. 2003), obviously much more than could have provided by the disrupted star.
For the particle densities inferred for the BLR emitter, recombination is very fast, so the lines respond effectively instantaneously to flux variations from the central source. Thus, the rapid luminous flare we observed between 2000 and 2005, must have illuminated a pre-existing structure, whose spatial distribution and kinematics closely resemble those of BLR of actively growing SMBH. Further evidence for this can be derived by the fact, noticed by LaMassa et al. (2015), that the measured Hα FWHM between 2000 and 2010 scales as the continuum luminosity to the −1/4 power, as expected if gas in the BLR moves with Keplerian velocity.
The likelihood of the observed configuration, with the broad emission lines appearing transiently in response to a rapid nuclear TDE, depends on the lifetime of the BLR structure in objects where the central black has ceased accreting at substantial rates. This must depend, in turn, on the dynamical status of the BLR itself (is it outflowing, inflowing, circulating?), and, critically, on the time elapsed since the last major accretion episode on to the SMBH. A detailed analysis of these issues is beyond the scope of this paper. In any case, the conclusion that such a configuration is possible was reached recently also by Denney et al. (2014), who studied the peculiar, decades-long flare of the central black hole in Mrk 590, which showed dramatic brightening and subsequent disappearance of strong broad emission lines over little more than 20 yr.
5.2 The narrow-line region
It is not just the properties of the observed broad emission lines that suggest the flare we observed in SDSS J0159+0033 occurred in a formerly active galaxy. The system in question is massive and strongly star-forming, as indicated both by the SED fitting and by the strong [O ii] emission line detected (see Section 2.2 and Table 1 above). In the nearby universe, these are the systems most likely to host an AGN (Kauffmann et al. 2003). The narrow emission-line diagnostics (see Fig. 3) reveal that the emitting material was probably ionized by a source harder than that associated with pure star formation. AGN activity would of course provide a sufficiently hard ionizing source, but the exact amount of any putative AGN contribution to the observed narrow-line emission is harder to disentangle. SDSS J0159+0033 appears to be located close to the boundary of the so-called transition region of parameter space, between the objects whose line ratios imply stellar sources dominate the ionization, and those for which AGN emission is needed to produce the observed line ratios. Kauffmann et al. (2003) estimate that the AGN fractional contribution for objects in the transition region ranges between 30 and 90 per cent. In the most extreme case, then we can estimate the maximum luminosity that any putative AGN must have had in the past to produce 90 per cent of the observed [O iii] flux (corresponding to |$L_{\rm [O\,\small {iii}]} \simeq 3\hbox{-}5 \times 10^{41}$| erg s−1).
There is a large body of literature on the correlation between [O iii] and hard X-ray luminosity in AGN, with somewhat contrasting results on the exact numerical value of the correlation index and on the mean luminosity ratio. In general the ratio of observed (not extinction corrected) [O iii] to X-ray (2–10 keV) luminosity ranges between 0.02 and 0.08, depending on the sample selection and source classification (Mulchaey et al. 1994; Heckman et al. 2005; Trouille & Barger 2010; de Gasperin et al. 2011). Thus, we can conservatively say that the central AGN must have had an X-ray luminosity L2-10 keV ≤ 2 × 1043 erg s−1 (i.e. equal or smaller than the X-ray luminosity measured by Chandra in 2005, L2-10 keV = 1.2 × 1043 erg s−1) about one NLR light-crossing time ago. Using the empirical relation between NLR size and [O iii] luminosity (Greene et al. 2011; Hainline et al. 2013), we derive an NLR size of about 4 kpc, corresponding to a look-back time of about 13 000 yr. As discussed in Section 2.1, the historical optical data pre-flare (i.e. before 1998) are consistent with no strong AGN emission being present above the host galaxy stellar emission, but the uncertainty on the measurements is such that a low-level nuclear activity cannot be ruled out either, so that it is not possible to firmly constrain the possible AGN activity level in the galaxy prior to flare discussed here.
Powerful TDE, just like longer episodes of nuclear activity powered by gas accretion, should imprint in the host ISM an ionization ‘echo’ (see e.g. Yang et al. 2013) detectable as high-ionization narrow emission lines, variable on time-scales longer than the light-crossing time at the location of their production. Variability of strong coronal emission lines, possibly associated to the fading echo of a nuclear TDE has been reported by Komossa et al. (2009), Wang et al. (2012) and Yang et al. (2013). Systematic spatially resolved spectroscopic surveys with integral field unit of nearby galaxies (such as SAMI or MaNGA; Croom et al. 2012; Bundy et al. 2015) could be able to detect signatures of such echoes over the entire body of nearby galaxies, thus probing up to time-scales of the order of techo ≈ Reff/c ≃ 3 × 10⁴(Reff/10kpc) yr. Given current estimates of the intrinsic rate of TDEs per galaxy ΓTDE ≡ 1/trec ≈ 10−5 yr−1 (where we have introduced the recurrence time trec; see Sections 1 above and 5.3 below, and references therein), it is possible that a large fraction of nearby galaxies, of the order of techo/trec ≈ 30 per cent, could be found displaying off-centre high-ionization emission line regions, thus probing the triggering properties of nuclear BHs, and of TDEs (which have the shortest recurrence times) in particular.
5.3 Tidal disruption flares versus gas accretion in galactic nuclei
In the case of tidal disruption of stars (i = TDE), we can write an approximate solution neglecting any redshift dependence, fixing γTDE = 5/3, τTDE = tpeak(MBH, M*, β) (equation 4), and |$L_{\rm peak}=\epsilon \dot{M}_{\rm peak}(M_{\rm BH},M_{*},\beta ) c^2$| (equation 3). For simplicity, we discuss here only tidal disruptions of main-sequence stars, and refer the reader to the more accurate, and comprehensive work of MacLeod et al. (2013), who have computed the contribution to pTDE(Lbol) of giant stars, either disrupted, or undergoing repeated, episodic, mass-transfer events (‘spoon feeding’), which tend to dominate at very low luminosities. As we discussed in the introduction, there is substantial uncertainty in the true rate of tidal stellar disruption in galactic nuclei, with current observationally determined rates lying factors of a few to 10 below the theoretical expectations. Here, for illustration purposes, we adopt a generic (i.e. independent of BH mass) rate of |$\Gamma _{\rm TDE}=3\times 10^{-5} M_{*}^{-1/3} R_{*}^{1/4}$|, but consider, in the following, a 1 order of magnitude allowed range around such a value. The resulting probability distributions, pTDE(Lbol), are shown with a solid black line in Fig. 8, for three different values of MBH.
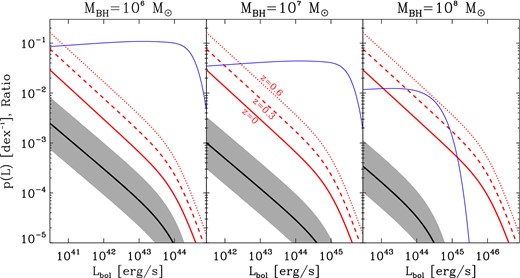
The probability for a galaxy hosting a black hole of mass MBH to have bolometric luminosity in the range Lbol to Lbol + dlog Lbol are shown for three values of MBH (106 M⊙, left; 107 M⊙, centre; 108 M⊙, right). In each panel, the three red lines represent the overall AGN probability function derived empirically from AGN X-ray surveys by Aird et al. (2012), for three redshift values (z = 0, solid; z = 0.3, dashed; and z = 0.6, dotted). the black solid line is the rate for TDE computed averaging equation (7) over a Kroupa (2001) IMF from 0.3 to 30 M⊙. The grey band represents a 1 order-of-magnitude uncertainty in the TDE rates. In each plot the thin blue solid line shows the ratio of the black to red solid lines, i.e. the z = 0 fraction of luminous galactic nuclei powered by tidal disruptions of main-sequence stars.
In the case of gaseous accretion, most attempts to reproduce the AGN luminosity function have implied peak luminosities of the order of the Eddington luminosity. However, both the triggering rate ΓACC(MBH, z) and the peak duration τACC(MBH, z) are essentially unknown. In fact, it is unlikely that a single mechanism could provide a complete description of (gaseous) AGN triggering. Nevertheless, multiwavelength surveys of AGN have been used, in recent years, to provide empirical constraints on pACC(Lbol), by studying in a uniform way the properties of the host galaxies of complete AGN samples typically selected in the X-ray band, to minimize the ‘obscuration’ bias (Bongiorno et al. 2012; Aird et al. 2012). Interestingly enough, Aird et al. (2012) showed that the pACC(Lbol) is independent of BH mass, but strongly evolving with redshift p(Lbol) ∝ (1 + z)3.5, a result confirmed by Bongiorno et al. (2012), both qualitatively and quantitatively. We make use here of the analytic solution of Aird et al. (2012), who expressed pACC(Lbol) as a broken power law, with slope 1/γACC = 0.65 and a rapid decline above the Eddington luminosity.
The very fact that, on average, the overall AGN population is consistent with γACC ≃ 1.5 is interesting, as this is not only a steeper decline than predicted by theoretical models of viscously evolving accretion discs (γACC ≈ 1.1–1.2; Cannizzo, Lee & Goodman 1990; Yu & Lu 2004), but also shallower than the ‘self-regulated’ light curve of the quasar-feedback-dominated major mergers simulated by Hopkins et al. (2005), which predict γACC ≈ 2. Instead, the empirical results of Aird et al. (2012) indicate that, in an average sense, the light curves of AGN do resemble those of tidal disruption flares (we have γTDE ≃ 1.66 and γACC ≃ 1.5); the difference in the overall probability functions between the two populations must then be the outcome of widely different triggering rates, event durations and (to a lesser extent) peak luminosities.
Fig. 8 shows, for three different values of MBH, the probability of hosting an active nucleus with luminosity Lbol (per unit logarithmic luminosity interval) for the full AGN population, as parametrized by Aird et al. (2012, red lines), and for main-sequence stars TDE (solid black line with grey band uncertainty), where we have averaged over a Kroupa (2001) initial mass function (IMF), and taken β = min[1, βmax(MBH, M*)], where βmax(MBH, M*) is the maximum value of the penetration factor still compatible with a tidal disruption (i.e. that value for which RT/RS = 1, see equation 1 above). The plot also shows, in each panel, the ratio of the TDE probability function to the z = 0 AGN probability function, which represent the fraction of active nuclei (of a given mass) at any time which are in fact powered by the disruption of a main-sequence star.
We can also weigh the probability functions pi(L) with the local BH mass function (BHMF) and compute the total fraction of TDE-powered nuclei as a function of nuclear bolometric luminosity for a volume limited sample of local AGN. We adopt the BHMF of Merloni & Heinz (2008), and show the results in Fig. 9. A similar calculation was performed by Milosavljević et al. (2006), who compared TDE volumetric rates with X-ray AGN luminosity functions, and reached similar conclusions as those we can draw here: the fraction of TDE in current AGN samples is highly uncertain, due to the still poorly known intrinsic rates, but, in the range 1042 < Lbol < 1044 erg s−1 could be as high as 10 per cent. The combined effect of the Eddington limit and of the fact that bigger BHs would swallow most main-sequence stars whole, produces a rapid drop of the TDE fraction at bolometric luminosities above 1045 erg s−1, i.e. into the quasar regime. The exact behaviour of the TDE fraction at such high luminosities, however, critically depends on the SMBH spin distribution, as rapidly spinning BHs can tidally disrupt stars even if they are very massive (see the right-hand panel of Fig. 7 above). On the other hand, a proper general-relativistic treatment of TDE could modify the p(Lbol) even at low MBH, where the Lense–Thirring precession of the stellar debris may cause severe delays in the onset of accretion, increasing tpeak and reducing Lpeak (Guillochon & Ramirez-Ruiz 2015a).
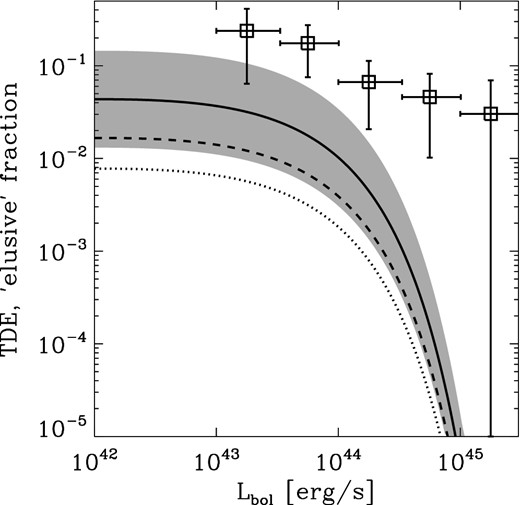
The overall fraction of active galactic nuclei powered by TDE at z = 0 is shown as function of nuclear bolometric luminosity (black solid line), with a grey band representing a 1 order-of-magnitude uncertainty in the TDE rates. The dashed and dotted lines show the evolution of the TDE fraction at z = 0.3 and z = 0.6, respectively, if the TDE rates are assumed to be unchanged, while the total AGN triggering rate evolves as observed empirically by Aird et al. (2012) (pACC ∝ (1 + z)3.5). The empty squares are the observed fractions of ‘elusive’ AGN among all X-ray-selected AGN in a highly spectroscopically complete sample (with flux F2-10 keV > 2 × 10⁻¹⁴ erg cm−2 s−1) in the redshift range 0.1 < z < 0.6 from the BOSS follow-up of the XMM-XXL survey (Menzel et al. 2015).
As a term of reference, we also show in Fig. 9 the observed fraction of all X-ray-selected AGN in a highly spectroscopically complete sample in the redshift range 0.1 < z < 0.6 (from the BOSS follow-up of the XMM-XXL survey; Menzel et al. 2015), which are optically classified as ‘elusive’, or ‘X-ray bright and optically normal galaxies’ (XBONGS), i.e. lacking any spectroscopic signature of AGN emission (see e.g. Comastri et al. 2002; Smith, Koss & Mushotzky 2014; Pons & Watson 2014). At these luminosities, about 6–20 per cent of all X-ray-selected AGN are ‘elusive’, and we suggest that a non-negligible fraction of them are powered by TDE which have faded away by the time the optically spectroscopic follow-up was performed (3–10 yr after the X-ray data were taken in this field). Further clues on the nature of elusive AGN, and on the true fraction of TDEs among them could come from a detailed study of the IR emission from those sources, which could reveal either the presence of a deeply obscured AGN or the transient echo of the TDE emission. Unfortunately, no systematic, deep NIR/MIR data are available for the full X-ray-selected XMM-XXL sample.
6 CONCLUSIONS
We have analysed in detail the light curve and spectra of the flare observed between 1998 and 2005 in SDSS J0159+0033, a massive star-forming galaxy in the SDSS Stripe-82 field. The most striking features of the system are: (i) a rapid increase in the X-ray and optical/UV luminosity of the source by at least 1 order of magnitude, and (ii) the dramatic change of its optical spectrum over a 10 yr time-scale. The object changed from a typical type-1 AGN emission, with prominent broad emission lines of Hα and Hβ and a blue continuum over-imposed on a galaxy spectrum, to a galaxy-dominated continuum. This latter spectrum shows strong narrow emission lines, which could have been ionized by either newly formed stars or (more likely) by past AGN activity, and, in addition, a weak broad Hα emission line, suggesting low-level of ongoing activity a few years after the peak.
We have studied the light curve of the object over the last ∼30 yr, in optical/UV and X-rays, including a well-sampled period coincident with the flare decay from the SDSS Stripe-82 survey. The variable nuclear emission, both in X-rays and in the optical bands, is well described by a single flaring episode, with fast rise and a power-law decay with exponent n∞ = −1.59 ± 0.05, consistent with detailed predictions of hydrodynamical models of tidal disruption flares (Guillochon et al. 2014). The overall fluence of the event indeed suggests that the amount of accreted mass is a substantial fraction (at least about 20 per cent) of a massive star. The decay light curve also shows clear structure, with a re-brightening flare observed about four rest-frame years after the peak, which has a fluence of about 14 per cent of the total fluence of the event.
We have used late-time photometric and spectroscopic observations of the source to build a host galaxy model, that we used to carefully analyse the nuclear (host-subtracted) light curve of the flare in all five SDSS bands. This has allowed us to study the SED evolution of the flare, which we found, consistent with most optically selected TDEs observed to date, to display very little temperature (colour) evolution, as predicted by models in which the accretion energy released in the event is reprocessed by dense, large-scaleheight material (Guillochon et al. 2014). Assuming standard (and conservative) bolometric corrections, this is among the most luminous non-beamed tidal disruption flares discovered so far, and the only one produced by a BH as massive as 108 M⊙. Perhaps due to the serendipitous nature of its discovery, it is also one of the few cases in which both optical and X-ray emission contribute substantially to the bolometric luminosity of the event, suggesting that accretion on to BHs from tidally disrupted stellar debris can also give rise to powerful Comptonizing coronae. In most previous cases, optically selected TDE had low photospheric temperatures and were X-ray faint, while X-ray-selected TDE tended to be hot and optically faint (see e.g. fig. 4 in Gezari 2012), clearly suggesting we are barely scratching the surface in our understanding of TDE selection effects.
If the continuum evolution and the overall energetics of the event strongly suggest a TDE interpretation, the emission-line spectra tell a more complicated story. The BLR, which responded almost instantaneously to the strong illumination from the central flaring source in 2000, is too extended (about 30 light days) and massive (more than hundred solar masses) to have been created by the debris of a disrupted star, and must have been left, in the dark, from previous episodes of more prolonged accretion on to the central BH. Also, the narrow emission lines, which we see unchanged between 2000 and 2010, possibly indicate that the central BH was active as little as 104 yr ago, although it is not straightforward to estimate exactly at which level, as the narrow emission lines could be also partly excited by the powerful star formation observed in this galaxy.
Such a complex interplay must not be too exceptional, also given the fact that this TDE was discovered in a relatively small parent sample. Within a simple, common framework in which both TDE and gas accretion on to an SMBH are modelled as stochastic events with homologous light curves, but widely differing triggering rates and durations, we showed how the available empirical and theoretical constraints suggest that TDE may represent a substantial fraction (between ≈1 per cent and 10 per cent) of all putative AGN in ‘snapshot’ surveys, at least for bolometric luminosities Lbol < 1045 erg s−1. In particular, we expect that tidal disruption flares should be responsible for at least a fraction of those X-ray-selected AGN, which, upon later follow-up analysis, do not reveal any evidence for AGN-induced signatures in their long-wavelength spectra (such as the so-called XBONGS; Comastri et al. 2002; Smith et al. 2014). Systematic re-observations of previously classified broad-line AGN has only been done for small samples of nearby AGN; Scott et al. (2014) have indeed reported a considerable number (8/97) of ‘changing look’ sources (see also Barth et al. 2015, for the results of a recent AGN spectroscopic monitoring campaign). We are, indeed, used to think of AGN as being either type-1 (un-obscured) or type-2 (obscured), based on the properties of their optical emission lines. However, on time-scales longer than the duration, τi, of episodes of high-luminosity (‘flares’), optical emission-line classification is a transient variable. This is particularly important for TDEs, of course, which have flare durations of a few years, at most, but could be relevant for other forms of BH fuelling, too.
A few lessons can be learned from this work: probably the most compelling is that an accurate observational determination of TDE rates requires searches that do not a priori exclude objects previously classified as AGN, and needs to fully account for the exact time when such classification was first made. Also, we showed that TDE confirmation is far from straightforward, and requires well-sampled optical light curves, and would be aided by repeated, early spectroscopic observations, too. LSST (Ivezic et al. 2008), in combination with flexible, rapid responding spectroscopic survey instruments (such as 4MOST, for example, de Jong et al. 2014), will be instrumental for our understanding of nuclear variability and AGN triggering. In addition, deep and wide X-ray observation with the right cadence have the advantage that the TDE-produced light becomes confused with the host galaxy stellar background at much later stages at these energies, thus allowing flares to be identified with less well-sampled light curves and on longer time-scales. Thanks to this fact, the upcoming eROSITA on SRG (Merloni et al. 2012) could yield as many as two TDE candidates alerts per day (Khabibullin & Sazonov 2014), requiring substantial dedicated resources to be mobilized in order to follow most of them up.
We thank Zhu Liu, Marie-Luise Menzel, Enrico Ramirez-Ruiz, Chris Reynolds, Paola Santini, Yue Shen and Nicholas Stone for useful discussions. JG, AM and MS acknowledge support from the DFG cluster of excellence ‘Origin and structure of the universe’ (www.universe-cluster.de). GP acknowledges support via an EU Marie Curie Intra-European fellowship under contract no. FP-PEOPLE-2012-IEF- 331095 and the Bundesministerium für Wirtschaft und Technologie/Deutsches Zentrum für Luft-und Raumfahrt (BMWI/DLR, FKZ 50 OR 1408) and the Max Planck Society.
Part of the funding for GROND (both hardware as well as personnel) was generously granted from the Leibniz-Prize to Prof. G. Hasinger (DFG grant HA 1850/28-1).
This research made use of the cross-match service provided by CDS, Strasbourg.
Funding for the SDSS and SDSS-II has been provided by the Alfred P. Sloan Foundation, the Participating Institutions, the National Science Foundation, the U.S. Department of Energy, the National Aeronautics and Space Administration, the Japanese Monbukagakusho, the Max Planck Society and the Higher Education Funding Council for England. Funding for SDSS-III has been provided by the Alfred P. Sloan Foundation, the Participating Institutions, the National Science Foundation and the U.S. Department of Energy Office of Science. The SDSS web site is http://www.sdss.org/.
The SDSS was managed by the Astrophysical Research Consortium for the Participating Institutions. The Participating Institutions are the American Museum of Natural History, Astrophysical Institute Potsdam, University of Basel, University of Cambridge, Case Western Reserve University, University of Chicago, Drexel University, Fermilab, the Institute for Advanced Study, the Japan Participation Group, Johns Hopkins University, the Joint Institute for Nuclear Astrophysics, the Kavli Institute for Particle Astrophysics and Cosmology, the Korean Scientist Group, the Chinese Academy of Sciences (LAMOST), Los Alamos National Laboratory, the Max-Planck-Institute for Astronomy (MPIA), the Max-Planck-Institute for Astrophysics (MPA), New Mexico State University, Ohio State University, University of Pittsburgh, University of Portsmouth, Princeton University, the United States Naval Observatory and the University of Washington.
SDSS-III was managed by the Astrophysical Research Consortium for the Participating Institutions of the SDSS-III Collaboration including the University of Arizona, the Brazilian Participation Group, Brookhaven National Laboratory, Carnegie Mellon University, University of Florida, the French Participation Group, the German Participation Group, Harvard University, the Instituto de Astrofisica de Canarias, the Michigan StateNotre DameJINA Participation Group, Johns Hopkins University, Lawrence Berkeley National Laboratory, Max Planck Institute for Astrophysics, Max Planck Institute for Extraterrestrial Physics, New Mexico State University, New York University, Ohio State University, Pennsylvania State University, University of Portsmouth, Princeton University, the Spanish Participation Group, University of Tokyo, University of Utah, Vanderbilt University, University of Virginia, University of Washington and Yale University.
Stripe-82 is a 109° × 2| $_{.}^{\circ}$|5 survey field that lies along the celestial Equator within the Southern Galactic Cap, which has been imaged multiple times by the SDSS camera.
Within this model, this corresponds to F0.1-2.4 keV = 6.4 × 10⁻¹³ erg cm−2 s−1.
We note that we are not aiming at a precise determination of the age of the stellar population. Indeed, if we chose a younger SSP from the same library (for example a 1.6 Gyr old one, in agreement with LaMassa et al. 2015), we would recover an equally good fit to the narrow wavelength ranges around the emission lines we are interested in, with all emission-line parameters within the errors, and a stellar mass of the host of ≈7 × 10¹⁰ M⊙. This shows that, on the other hand, the total stellar mass of the system is quite robustly determined by the SSP normalization.
All luminosities have been computed from the measured fluxes adopting a Λ cold dark matter cosmology with Ωm = 0.286, ΩΛ = 0.714 and H0 = 69.6 km s−1 Mpc−1.
Because the SDSS Stripe-82 light curve did not well sample the rising phase of the outburst, and we do not know the exact time of the star's passage at pericentre, we cannot impose a third constraint on the peak time. As a reference, the time elapsed between the first and the second SDSS photometric data points is approximately 1.176 rest-frame years.
Similar values for the BLR size would be obtained by adopting the empirical scaling between X-ray 2-10 keV luminosity and BLR size, Greene et al. (2010).
REFERENCES
APPENDIX A: PHOTOMETRIC CALIBRATION OF DSS PALOMAR AND UK-SCHMIDT PHOTOGRAPHIC DATA AGAINST SDSS
We adopted as a measure of uncertainty the standard deviation of the residuals of points lying within ±0.5 photographic magnitudes of SDSS J0159+0033 (and with a difference between observed and predicted SDSS magnitude <3 mag). Finally, we assume that g − r = 1.0 and r − i = 0.5 (AB mag) when converting the photographic photometry of J0159+0033 (which means that the colour terms disappear for SDSS J0159+0033). Table A1 lists the derived photometric points.
Conversion of DSS photographic plates magnitudes to SDSS photometric system for optical imaging data of SDSS J0159+0033 taken before 1998. The source for the observation dates for the photographic plates was taken from https://archive.stsci.edu/cgi-bin/dss_plate_finder.
| Epoch (yyy-mm-dd) | GSC band | Mag | SDSS band | Mag (AB) |
|---|---|---|---|---|
| 1983-09-09 | V | 19.52 ± 0.79 | r′ | 19.17 ± 0.36 |
| 1991-11-02 | N | 18.66 ± 0.47 | i′ | 18.93 ± 0.27 |
| 1992-10-20 | j | 19.94 ± 0.36 | g′ | 19.70 ± 0.22 |
| 1996-10-14 | F | 18.78 ± 0.40 | r′ | 18.91 ± 0.26 |
| Epoch (yyy-mm-dd) | GSC band | Mag | SDSS band | Mag (AB) |
|---|---|---|---|---|
| 1983-09-09 | V | 19.52 ± 0.79 | r′ | 19.17 ± 0.36 |
| 1991-11-02 | N | 18.66 ± 0.47 | i′ | 18.93 ± 0.27 |
| 1992-10-20 | j | 19.94 ± 0.36 | g′ | 19.70 ± 0.22 |
| 1996-10-14 | F | 18.78 ± 0.40 | r′ | 18.91 ± 0.26 |
