


Abstract
In this paper, we report the discovery and detailed radio/X-ray analysis of a peculiar giant radio galaxy (GRG) detected by INTEGRAL, IGR J14488–4008. The source has been recently classified as a Seyfert 1.2 galaxy at redshift 0.123; the radio data denote the source to be a type II Fanaroff–Riley radio galaxy, with a linear projected size exceeding 1.5 Mpc, clearly assigning IGR J14488–4008 to the class of GRG. In the X-rays, the source shows a remarkable spectrum, characterized by absorption by ionized elements, a characteristic so far found in only other four broad-line radio galaxies.
1 INTRODUCTION
Giant radio galaxies (GRGs) are the largest and most energetic single objects in the Universe and are of particular interest as extreme examples of radio source development and evolution. With linear sizes exceeding 0.7 Mpc1 (e.g. Ishwara-Chandra & Saikia 1999; Lara et al. 2001), they represent the oldest and long-lasting part of the radio galaxies population: assuming that the spectral ages of radio galaxies are representative of their dynamical ages (Parma et al. 1999), GRGs result to have on average radiative ages in excess of 108 yr. Despite this, GRGs display bright radio features which are indicative of current or recent activity of the central engine. Understanding how they can manage to maintain an AGN active for so long and capable of producing radio emission for a long time (while the nucleus in most galaxies becomes quiescent in a much shorter period; see e.g. Parma et al. 1999; Schoenmakers et al. 2000) requires as much data as possible on a fairly extended sample of GRGs.
An interesting new development in the study of GRGs has recently come from the detection of a substantial fraction of these objects among soft gamma-ray-selected radio galaxies. Since 2002, the soft gamma-ray sky has been surveyed by INTEGRAL/ISGRI and Swift/BAT at energies higher than 20 keV; up to now, various all sky catalogues have been released (see for example, Bird et al. 2010; Baumgartner et al. 2013) revealing a large population of active galaxies. Around 7 per cent of these soft gamma-ray-selected AGN display a double-lobed morphology typical of a radio galaxy. What is intriguing and particularly interesting is that a large fraction (∼30 per cent) of these radio galaxies have giant radio structures (Bassani et al., in preparation).
The fraction of GRGs in radio source samples is generally small (∼6 per cent in the 3CR catalogue; Ishwara-Chandra & Saikia 1999), and it becomes relevant among radio-loud soft gamma-ray-selected objects. Therefore it suggests a link between the central AGN properties and the extended radio structures. To date, about 20 objects within the INTEGRAL and Swift surveys have been identified as GRGs; a few of these are new discoveries like IGR J17488–2338 (Molina et al. 2014) and IGR J14488−4008, the source discussed in this paper. These findings confirm that observations at soft gamma-rays are useful tools to find radio galaxies with giant structures but also suggest that combining radio observations with measurements at high energies is a new and useful approach to study GRG.
Here, we report on the discovery and consequent radio and X-ray analysis of the INTEGRAL source IGR J14488–4008, recently classified as a Seyfert 1.2 galaxy at redshift z = 0.123. The radio data indicate that the source has a Fanaroff-Riley FR II morphology (Fanaroff & Riley 1974), and linear size exceeding 1.5 Mpc, making it a newly discovered GRG. In the X-ray, the source shows a peculiar spectrum, characterized by ionized absorption, a characteristic which has so far been found only in four other broad-line radio galaxies (BLRG).
2 HIGH-ENERGY DISCOVERY AND IDENTIFICATION
IGR J14488–4008 was first reported as a hard X-ray emitter in the fourth INTEGRAL IBIS catalogue (Bird et al. 2010) and located, with a positional uncertainty of 4.5 arcmin, at RA(J2000) = |$\mathrm{14^h 18^m 50 {.\!\!\!\!^{{\mathrm{s}}}}2}$| and Dec(J2000) = − 40°08′31″. The source is reported in the Swift-BAT 70-month catalogue and named SWIFT J1448.7–4009. In order to reduce the positional uncertainty associated with the INTEGRAL detection and therefore to favour identification, in 2011 the source was the subject of a follow-up campaign carried on with Swift-XRT (Malizia et al. 2011). Within the ISGRI/BAT error circles, XRT detected two X-ray sources (see Fig. 1): (1) a bright source (N1), located at RA(J2000) = |$\mathrm{14^h 48^m 50 {.\!\!\!\!^{\mathrm{s}}}98}$| and Dec.(J2000) = − 40°08′47|${^{\prime\prime}_{.}}$|12 (with a positional uncertainty of 3.83 arcsec) and with an X-ray flux of 2.4×10⁻¹² erg s−1 cm−2 (see Malizia et al. 2011 and Molina et al. 2012); (2) a dimmer object (N2) located at RA(J2000) = |$\mathrm{14^h 48^m 50 {.\!\!\!\!^{{\mathrm{s}}}}82}$| and Dec(J2000) = − 40°10′56|${^{\prime\prime}_{.}}$|70, with a very soft spectrum (undetected above 3 keV). As evident in Fig. 1, which is an SUMSS (Sydney University Molonglo Sky Survey; Bock, Large & Sadler 1999) image of the sky region around IGR J14488–4008, both objects appear overlaid to a bright and complex radio source, showing a nuclear region plus a two-sided lobe structure. As reported by Molina et al. (2012), this radio source was observed at several radio frequencies: at 1.4 GHz with a flux of 48 mJy (NVSS; Condon et al. 1998); at 4.85 GHz with a flux of 48 mJy (Combined Radio All-sky Targeted Eight GHz Survey–CRATES; Healey et al. 2007); at 8.4 GHz with a flux of 45.9 GHz and at 8.6 GHz with a flux of 46 mJy (ATPM; McConnell et al. 2012). IGR J14488–4008 was also observed during the course of an optical follow-up programme by Masetti et al. (2013); these authors found source N1 to be a Seyfert 1.2 galaxy at z = 0.123, with a black hole mass of (3.8 ± 1.9) × 108 M⊙ and source N2 to be a G-type star with no peculiarities and unlikely to produce high-energy emission.
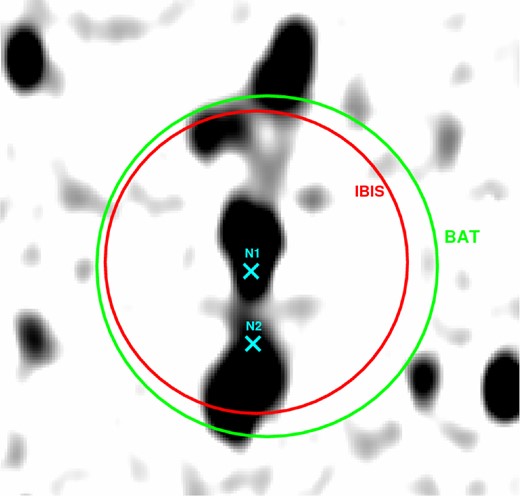
843 MHz SUMSS radio image of the region containing IGR J14488–4008. The larger, green circle marks the BAT position and relative uncertainty (5.07 arcmin); the red circle marks instead the ISGRI position and its uncertainty (4.5 arcmin). The two objects marked as N1 and N2 are the two X-ray sources detected by XRT. N1 is the true counterpart to the high-energy source.
As can be seen from Fig. 1, the resolution of the 843 MHz SUMSS image is not adequate to clearly identify the various components of the radio structures that characterize IGR J14488–4008 in this band and also is unable to associate source N1 to the core of the radio object. IGR J14488–4008 belongs to a sample of GRGs detected by INTEGRAL which is currently under study with the Giant Metrewave Radio Telescope (GMRT) (see 3). To further study the source in the X-ray band, we also carried out an XMM–Newton observation in AO12.
3 RADIO OBSERVATIONS AND IMAGING
The GMRT observations were performed at 610 MHz (on 2014 June 9) and at 325 MHz (on 2014 May 14), for a total of 5 h at each frequency. The observing bandwidth at each frequency is 64 MHz, split into 256 channels with Δν = 250 kHz. The starting steps of the data reduction, i.e. radio frequency interference (RFI) removal and bandpass calibration, were done using flagcal (Prasad & Chengalur 2012), while self-calibration and imaging were carried out using the National Radio Astronomy Observatory (NRAO) Astronomical Image Processing System. We performed self-calibration using all the sources in the GMRT field of view at each frequencies. At both frequencies, we produced final images at full and low resolution, to properly image both compact and extended features of the radio galaxy. The noise in the final images is in the range 1σ ∼ 0.12–0.20 mJy b−1 at 325 MHz and 1σ ∼ 40-80 μJy b−1 at 610 MHz, depending on the resolution and on the position in field.
Fig. 2 shows the 610 MHz GMRT contours overlaid on the same frequency GMRT image. The high resolution and sensitivity of the GMRT images reveal important details on the radio emission of IGR J14488–4008, compared to the image provided by SUMSS. The central component in SUMSS is actually a blend of three compact components. The overlay of the radio image with the XMM–Newton image (see Fig. 3) clearly shows that the core of the radio galaxy is the southernmost one, and it is coincident with the X-ray source labelled N1 in Fig. 1. None of the other two compact components is optically identified on the red plate of the red Digitized Sky Survey DSS2, and the available data (in the optical and in the radio) do not suggest that these two components are the lobes or hot spots of an FR II background radio source. Based on our GMRT images their spectral index |$\alpha _{\rm 322\ MHz}^{\rm 607\ MHz}$| is 0.5, typical of compact radio sources. Moreover, the eastern extension of the northern lobe, as visible on SUMSS, is actually a background radio galaxy with FR II morphology (no redshift is available in the literature for the optical counterpart).
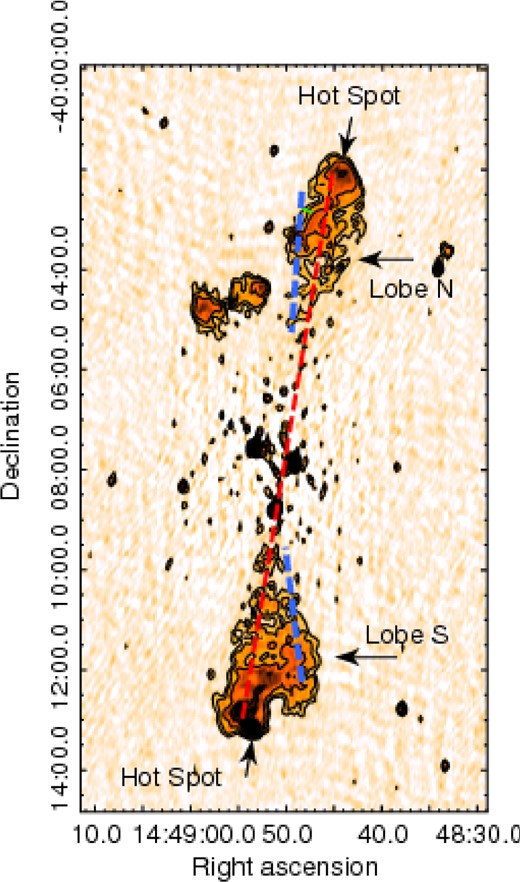
Radio 610 MHz GMRT full resolution image of IGR J14488–4008 with radio contours (at the same frequency) overlaid; the restoring beam is 8.77 arcsec × 4.92 arcsec with an rms of 30 mJy beam−1 around the source edges and of 50 mJy beam−1 close to the source.
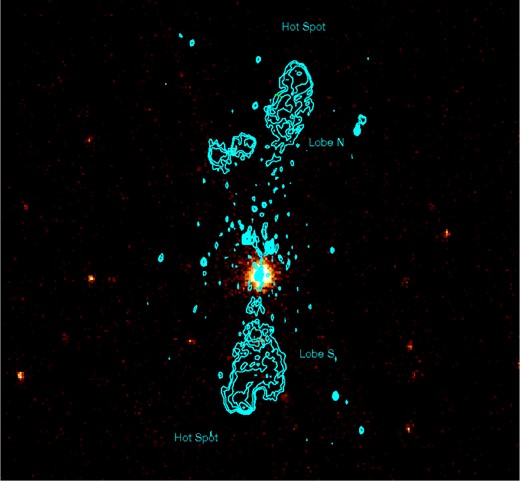
0.3–10 keV XMM–Newton image of IGR J14488–4008, with the 610 MHz radio contours overlaid as in Fig. 2.
A noticeable feature of the large-scale structure of IGR J14488–4008 is the misalignment in the morphology of the lobes. In particular, the high surface brightness regions of the lobes (including the hot spots) are symmetric with respect to the core, and are aligned in position angle of ∼−12°, while the low surface brightness parts are symmetric with respect from the core but their alignment is ∼−5°. This is suggestive of a X-shaped radio galaxy. If confirmed, IGR J14488–4008 would be the second giant X-shaped radio galaxy (Saripalli et al. 2008).
Table 1 reports the flux density of each component at the 325 MHz and 610 MHz, and the spectral index between these two frequencies. The total radio power is typical for FR II radio galaxies, LogP325 MHz = 25.36 W Hz−1, and the largest linear size of IGR J14488–4008, estimated as the projected distance between the peaks of the hot spots is 1.54 Mpc. This size fully qualifies IGR J14488–4008 as a GRG. The core is inverted in this frequency range, and the integrated spectrum of the source is flatter than the canonical values 0.7–0.8 (assuming Sν ∝ ν−α) usually reported for FR II radio galaxies. This is most likely due to the fact that the flux density of the radio galaxy is dominated by the hot spots and the beginning of the backflow of the lobes. We point out that the frequency range of the observations presented here is below 1 GHz, where the spectrum of the radio galaxy may still be dominated by the initial population of relativistic electrons, prior to ageing. We estimated the intrinsic physical parameters of the radio lobes under equipartition assumptions (filling factor Φ = 1 and energy ratio between protons and electrons k = 1), and the values are reported in Table 2. The two lobes are very similar, and the equipartition parameters are considerably lower (at least one order of magnitude) compared to radio galaxies of smaller size,2 and are lower than found in the two other GRGs 3C 35 and 3C 223 under similar assumptions (Orrù et al. 2010).
The radio images.
| Component | S325 MHz | S610 MHz | |$\alpha _{\rm 325\ MHz}^{\rm 610\ MHz}$| (a) |
|---|---|---|---|
| (mJy) | (mJy) | ||
| Core | 20.7 ± 0.8 | 32.3 ± 1.3 | −0.71 ± 0.14 |
| Lobe N | 201.9 ± 10.1 | 148.1 ± 7.7 | 0.49 ± 0.16 |
| Lobe S | 354.4 ± 17.7 | 263.0 ± 13.2 | 0.47 ± 0.16 |
| Total | 576.9 ± 28.8 | 443.4 ± 22.2 | 0.42 ± 0.15 |
Note. (a) The sign convention is S ∝ ν−α.
Physical parameters.
| Component | umin | Pmin | Beq |
|---|---|---|---|
| Lobe N | 4.5 × 10⁻¹⁴ erg cm−3 | 2.4 × 10⁻¹⁴ dyn cm−2 | 0.7 μG |
| Lobe S | 5.5 × 10⁻¹⁴ erg cm−3 | 2.9 × 10⁻¹⁴ dyn cm−2 | 0.8 μG |
| Component | umin | Pmin | Beq |
|---|---|---|---|
| Lobe N | 4.5 × 10⁻¹⁴ erg cm−3 | 2.4 × 10⁻¹⁴ dyn cm−2 | 0.7 μG |
| Lobe S | 5.5 × 10⁻¹⁴ erg cm−3 | 2.9 × 10⁻¹⁴ dyn cm−2 | 0.8 μG |
The lack of information on the spectral index shape and high-frequency cutoff of the two lobes in IGR J1448–4008 does not allow an estimate of the radiative age of the source.
4 X-RAY TIMING AND SPECTRAL ANALYSIS
IGR J14488–4008 was also recently observed by XMM–Newton on 2014 Feb. 16 during revolution 2599. The EPIC-pn (Turner et al. 2001) data were reprocessed using the XMM–Newton Standard Analysis Software (sas) version 12.0.1 and employing the latest available calibration files. Only patterns corresponding to single and double events (PATTERN≤4) were taken into account; the standard selection filter FLAG = 0 was applied. The EPIC-pn nominal exposure of 28 ks was filtered for periods of high background, resulting in a cleaned exposure of ∼17.6 ks. Source counts were extracted from a circular region of 29.5 arcsec radius centred on the source, while background spectra were extracted from two circular regions of 20 arcsec of radius close to the source. The ancillary response matrix (ARF) and the detector response matrix (RMF) were generated using the XMM–sas tasks arfgen and rmfgen and spectral channels were rebinned in order to achieve a minimum of 20 counts per bin. No pile-up was detected for this source. The acquisition of the XMM data allowed us to put firm constraints on the source identification with the bight radio galaxy; it also allowed us to exclude X-ray emission from either the lobes or hot spots of the GRG.
As a preliminary step in the analysis of IGR J14488–4008, we focused on the issue of variability, both on short time-scales, through the analysis of the XMM light curves, and on longer time-scales, employing light curves from ISGRI/ISGRI and Swift/BAT.
The XMM light curves were produced in three different energy bands (soft, 0.3–2 keV; hard, 2–10 keV; total, 0.3–10 keV) and then analysed with the xronos package. The statistical analysis of the light curves in the chosen energy bands, does not point to any significant evidence of short term variability, as shown by the relative χ2. In fact, for a 100 s binned light curve, we find for the soft band (0.3–2 keV) light curve a χ2/d.o.f of 112.7/165, for the hard band light curve (2–10 keV), we find a χ2 of 121.9/163 and finally for the 0.3–10 keV light curve we find χ2 = 120.9/164. For the three light curves, we find a probability of constancy of more than 99 per cent. Also the analysis of the soft versus hard light curve hardness ratio excludes any kind of spectral variability.
We checked as well the hard X-ray light curves obtained by IBIS/ISGRI and Swift/BAT to examine if long-term variability is instead present; also in this case, we found that variability on long time-scales (months) is not significant and could be accounted for by introducing a cross-calibration constant between instruments when fitting the broad-band spectrum, as discussed in Section 4.2.
Spectral analysis was performed using xspec v.12.8.0 (Arnaud 1996); errors are quoted at 90 per cent confidence level for one parameter of interest (Δχ2 = 2.71). In the following analysis, together with the proprietary XMM observation, we use data collected in the fourth IBIS survey (Bird et al. 2010), which consists of all exposures from the beginning of the mission (2002 November) up to 2008 April (revolutions 12 through 530). The IBIS/ISGRI data analysis and the average source spectra extraction has been obtained following the procedure described by Molina et al. (2013). To enhance the available statistics, above all at high energies, we also make use of the accessible Swift/BAT spectrum (Baumgartner et al. 2013) of IGR J14488–4008, obtained from the latest 70-month catalogue.3XMM data have been fitted in the 0.3–10 keV energy range, while the ISGRI and BAT spectra have been fitted in the 20–110 keV and 14–110 keV bands, respectively. Soft and hard X-ray data have then been combined together in order to obtain a broad-band coverage in the 0.3–110 keV energy range.
4.1 The soft 0.3–10 keV XMM–Newton spectrum
The EPIC-pn data were initially fitted in the restricted 2–10 keV energy range, in order to first characterize the primary continuum. As a first step, we fitted the data with a simple power law absorbed only by the Galactic column density (wag*zpo in xspec, with |$N_{\rm H}^{\rm Gal}$| = 0.07 × 1022cm−2); as expected, the fit is very poor (χ2 = 457.90 for 379 degrees of freedom (d.o.f.)) as some additional features (such as a cold absorption and an iron line component) could be present. We therefore added first a cold absorption component to our model (wag*zwa*zpo in xspec); the fit improves (χ2 = 403.92 for 378 d.o.f.) and the component is highly required by the data (at more than 99 per cent confidence level). We then included a Gaussian component to the fit (wag*zwa*(zpo+zga)): the fit further improves (χ2 = 380.20, 375 d.o.f.) and the new component is required at more than 99 per cent coincidence level. The iron line is indeed well detected at 6.45 keV and likely to be broad (we have an upper limit on the line width at 139 eV and an equivalent width of 102 eV). After characterizing the spectrum in the 2–10 keV energy range, we extended our analysis to the softer energies. As shown in Fig. 4, evidence of a strong soft excess is visible below 2 keV. As a first step towards the characterization of this soft excess, we analysed the data using standard thermal models. When a blackbody component (wag*zwa*(zbb+zpo+zga)) is employed to fit our data, the resulting χ2 is quite poor (1101.96 for 588 d.o.f.) and the parameter values are inconsistent with those expected for AGN. We subsequently substituted the blackbody component with the xspec model mekal, but, although the fit is better (χ2 = 699.27, 588 d.o.f.), the spectrum still shows residuals at soft energies, where absorption edges might be present. We also tested if cool Comptonization or reflection models could properly fit the data, but in both cases we did not obtain acceptable fits. In the first case, we tried to fit the soft excess by employing the compTT model, while the continuum was modelled with a power law plus a reflection component due to the accretion disc (local model reflionx), intrinsic cold absorption and a Gaussian component to fit the Fe Kα line. The fit was however poor, yielding a χ2 of 2468.62 (for 586 d.o.f.). We then substituted the cool Comptonization model with a reflection model, consisting in a relativistically smeared reflector (the final model was wag*(kdblur(zpo+reflionx)+zga) in xspec terminology), but again the fit was poor, having a χ2 of 2037.42 (588 d.o.f.). Therefore, we investigated on the possibility that the observed soft excess could be an artefact of smeared absorption from partially ionized material as described by Gierliński & Done (2004). To test this scenario, we have fitted the EPIC-pn data with the smeared absorption from a partially ionized wind from an accretion disc (swind1 in xspec) in addition to the absorbed power-law model for the continuum and the Gaussian line for the Fe kα line. The parameters of the smeared wind model are the absorbing column density, the ionization parameter (ξ = L/nr2)4 and the Gaussian sigma for velocity smearing in units of v/c. Although it has been shown that this model requires non-physical, unusually high terminal velocities of the outflow (Schurch & Done 2008), it can still be used as a proxy for multiple-absorber, partially-covering, ionized absorber models that can account for the soft excess. The smeared absorption model provided a good fit to the spectrum, yielding a χ2 of 759.48 for 587 d.o.f. and the new component is highly required by the data (at more than 99 per cent confidence level). In the smeared wind model framework, lines from atomic recombination are expected to be found in the source spectrum. Indeed, although the fit is acceptable, inspection of the residuals show the presence of absorbing features at around 0.7 and 0.9 keV. Hence, we tested our data for the presence of the O vii and Fe xx absorption edges, located at around 0.73 keV and 0.96 keV, respectively. The O vii absorption edge at 0.73 keV has τmax of 2.58|$^{+0.55}_{-0.40}$|, while the Fe xx absorption edge at 0.96 keV has τmax = 0.71|$^{+0.36}_{-0.31}$|; both components are required by the data at more than 99 per cent confidence level. The 2–10 keV flux and luminosity are 5.26 × 10⁻¹² erg cm−2 s−1 and 1.93 × 1044 erg s−1, respectively. To conclude, we find that the 0.3–10 keV best-fitting model to the XMM data is wag*zwa*zedge*zedge*swind1*(zpo+zga).
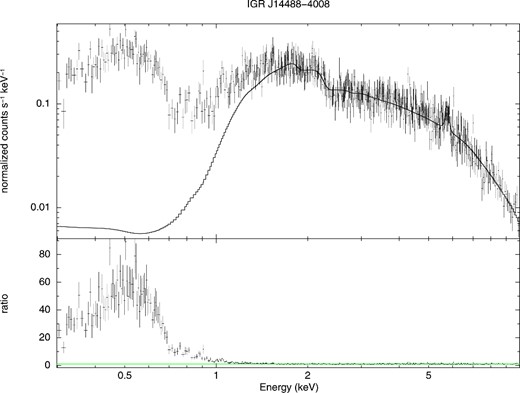
0.3–10 keV EPIC-pn spectrum and residuals,; the model employed is wag*zwa*(zpo+zga). As it is evident, a prominent soft excess component is present below 1 keV.
4.2 Broad-band spectral analysis
Extrapolation of the XMM best-fitting model to the 20–110 keV band provides a slightly higher flux than those obtained by fitting the ISGRI and BAT spectra individually. This suggests that long-term flux variability could be present, although one must consider the possibility of a more complex spectrum when high-energy data are considered. The long-term variability can be accounted for using a cross-calibration constant between instruments when fitting the broad-band (0.3–110 keV) data. When this is done using the XMM best-fitting model, the fit is acceptable yielding a χ2 of 622.68 (604 d.o.f.) and the cross-calibration constants between XMM/BAT and XMM/ISGRI are 0.75 ± 0.21 and 0.55 ± 0.24, respectively. However, inspection of the residuals indicates a curvature in the spectrum above 20 keV, suggesting that some additional components might be required at higher energies to better represent the source spectrum. The presence of a high-energy cut-off was consequently tested by substituting the simple power law in the baseline model with an exponentially cut-off power law reflected from neutral material (wag*zwa*zedge*zedge*(pexrav+zga) in xspec terminology). The reflection component was added to account for the presence of the observed characteristics of the iron line; due to the statistical quality of the high-energy data, we fixed the reflection fraction to 1 given the value of the Fe line EW (since EW/R∼100–130 eV; Perola et al. 2002.) The fit is acceptable, yielding a χ2 of 772.76 for 605 d.o.f. the power-law slope is slightly steeper than the one found for the soft X-ray fit alone, being Γ = 1.76|$^{+0.09}_{-0.10}$|, and the high-energy cut-off is unfortunately not very well constrained (Ecut = 75|$^{+398}_{-45}$| keV). The O vii and Fe xx absorption edges energies have been fixed at the values found for the soft X-ray fit, at 0.73 keV and 0.96 keV, respectively, while their depth has been left as a free parameter. The O vii absorption edge at 0.73 keV has τmax of 2.58|$^{+0.55}_{-0.40}$|, while the Fe xx absorption edge at 0.96 keV has τmax = 0.71|$^{+0.36}_{-0.31}$|.
The fit we obtain is our best fit, with a χ2 of 614.99 for 603 d.o.f (Δχ2 = 1.02). The main spectral parameters are summarized in Table 3, while Fig. 5 shows the fitted spectrum of IGR J14488–4008; note that in this case the cross-calibration constants are closer to unity as listed in Table 3.
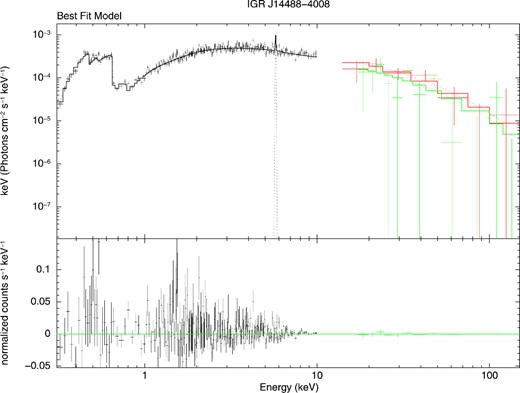
0.3–110 keV XMM/BAT/ISGRI best-fitting plot. Black data points are the XMM measurements, green data points are the BAT spectrum and red data points are relative to the ISGRI one.
0.3–110 keV Best-fitting spectral parameters. The model employed is const*wag*zwa*zedge*zedge*swind1*(pexrav+zga)).
| Cold neutral absorption | NH = (0.17|$^{+0.04}_{-0.04})$| × 1022cm−2 |
| O vii Abs. edge | E = 0.73 keV (fixed) |
| τmax = 2.52|$^{+0.41}_{-0.41}$| | |
| Fe xx Abs. edge | E = 0.96 keV (fixed) |
| τmax = 0.71|$^{+0.36}_{-0.31}$| | |
| SWIND1 Param. | NH = (7.85|$^{+3.04}_{-2.37}$|) × 1022cm−2 |
| Log(ξ) = 2.44|$^{+0.09}_{-0.10}$| erg cm−1 s−1 | |
| σ = 0.22|$^{+0.13}_{-0.08}$| | |
| Continuum slope | Γ = 1.71|$^{+0.16}_{-0.17}$| |
| Cut-off energy | Ec = 67|$^{+227}_{-36}$| keV |
| Reflection | R = 1 (fixed) |
| Iron line | E = 6.45|$^{+0.05}_{-0.04}$| keV |
| σ = 0.03 keV (fixed) | |
| EW = 93|$^{+35}_{-34}$| eV | |
| Cross. calib. const. | CBAT = 0.96|$^{+0.45}_{-0.34}$| |
| CISGRI = 0.71|$^{+0.42}_{-0.30}$| |
The source 20–100 keV luminosity is ∼3 × 1044 erg s−1. Given the source black hole mass (MBH = 3.8 × 10⁸ M⊙; Masetti et al. 2013) and employing the relation used by Mushotzky et al. (2008) and scaled to the 20–100 keV ISGRI luminosity (LBol = 25 × L20-100 keV), we estimate an average bolometric luminosity of ∼6 × 1045 erg s−1 and consequently an average Eddington ratio of 0.16, making IGR J14488–4008 a quite efficient accretor; the uncertainty on the black hole mass gives a small range (0.1–0.3) for the Eddington ratio which therefore reinforces our conclusion that IGR J14488–4008 is an efficiently accreting source. Even using the 2–10 keV luminosity and adopting the bolometric correction for radio-loud AGN discussed by Runnoe, Brotherton & Shang (2012) the Eddington ratio remains high (0.1).
5 DISCUSSION AND CONCLUSIONS
IGR J14488–4008 belongs to a sample of radio galaxies detected by INTEGRAL and currently under study with the GMRT. The high resolution provided by the GMRT has allowed a proper determination of the nature of IGR J14488–4008, confirming that it is a newly discovered GRG with a linear size exceeding 1.5 Mpc and a possible X–shaped morphology. Within the sample of radio galaxies detected by INTEGRAL, IGR J14488–4008 is the second source to be classified as a new GRG (the other being IGR J17488–2338; Molina et al. 2014); this confirms that the hard X-ray selection is indeed a valuable tool to identify this peculiar class of radio galaxies, albeit this might be the result of observing in this energy band the most powerful objects. Both IGR J14488–4008 and IGR J17488–2338 appear to be characterized by high accretion rates, but when comparing their X-ray characteristics, these sources are quite different: while IGR J17488–2338 does not have a very complex spectrum (a part from a cold absorber partially covering the nucleus), IGR J14488–4008 is characterized by the presence of a strong warm absorber, which is indeed a very peculiar feature.
At soft energies, more than half of the radio quiet Seyfert 1 galaxies show complex intrinsic absorption and/or emission lines associated with the presence of photoionized gas, the so-called warm absorber (e.g. Blustin et al. 2005; McKernan, Yaqoob & Reynolds 2007). Up to very recently, their radio-loud counterparts, i.e. BLRG, were not expected to show signs of ionized absorption. This was ascribed to the presence of a jet seen at small angles with respect to the line of sight that would mask the signature of ionized gas with its Doppler-booster, non-thermal radiation. However, with the advent of more sensitive X-ray observatories, this assumption has been proven to be incorrect and there is now a handful of sources for which the presence of a warm absorber has indeed been confirmed (e.g. 3C 382, 3C 390.3, 3C 445, Torresi et al. 2012; 4C 74.26, Ballantyne 2005). Within this framework, IGR J14488–4008 can be considered as a new addition to this small but growing sample of BLRG with complex absorption signatures in their X-ray spectra. Our analysis has also shown that the warm absorber observed in IGR J14488–4008 has similar characteristics to the warm absorbers seen in other BLRG: same column densities and ionization parameter (see Torresi et al. 2012), although the gas outflow velocities are slightly higher, probably due to the different model adopted here.
From the available information, it is possible to evaluate the location of the warm gas in IGR J14488–4008, warning the reader of the many uncertainties which effect the performed calculation (imperfect modelling, large errors on some parameters, various adopted assumptions). Following the reasoning of Torresi et al. (2012), we estimate the minimum and maximum distance of the warm absorber to be Rmin = (2GM)/v2 and Rmax = Lion/(ξNH). Since the ionizing luminosity (Lion) derived in the range 1–1000 Rydberg (13.6 eV–13.6 keV) from our best fit is 2.9 × 1044 erg s−1, while the other parameters required in the above formula are those reported in Table 2, we estimate the location of the warm gas to be between 0.01 and 4.4 pc. In IGR J14488–4008, the location of the broad line region (BLR) and the torus can be obtained following Ghisellini & Tavecchio (2008) and Torresi et al. (2012). Assuming Lion = |$L_{\rm {\rm disc}}$|, we find RBLR = 1017|$L_{\rm {\rm disc}}^{1/2}$| = 0.017 pc and Rtorus = 2.5 × 10¹⁸|$L_{\rm {\rm disc}}^{1/2}$| = 0.4 pc, where |$L_{\rm {\rm disc}}$| is expressed in units of 1045 erg s−1. These values suggest that the bulk of the highly ionized absorbing gas detected in IGR J14488–4008 is located internally to the torus. We also note that among BLRG with a warm absorber component, only for 3C 445 a similar location is reported (Torresi et al. 2012), while in other objects the warm gas is found beyond the torus. IGR J14488–4008 is also similar to 3C 445 for the high outflow mass.
In summary, IGR J14488–4008 is a remarkable AGN; first discovered to be a high-energy emitter by INTEGRAL, it has been identified as a Seyfert 1.2 galaxy thanks to an optical follow-up study and then further characterized as a GRG by means of a dedicated programme which is being carried out at the GMRT facility. IGR J14488–4008 appears to be a highly efficient accretor, and is also peculiar in the X-ray domain, being one of the few BLRG known to have a warm and highly ionizing gas in its nuclear regions. Unlike other BLRG with warm absorbers, the warm gas in IGR J14488–4008 is located well within the torus region, making it similar to only another BLRG, 3C 445.
We acknowledge financial support from ASI under contract INTEGRAL 2013.23.RO. We thank the staff of the GMRT that made these observations possible. GMRT is run by the National Centre for Radio Astrophysics of the Tata Institute of Fundamental Research.
Scaled for a cosmology with H0 = 71 km s−1 Mpc−1, Ωm = 0.27, ΩΛ = 0.73; this value is scaled from the original 1 Mpc to compensate for recent changes in the cosmological constants.
Such values have been derived under the usual assumption of identical energy in electrons and protons, and a volume homogeneously filled with relativistic plasma.
In the formula L is the source luminosity, n is the density and r the distance between the ionizing source and the absorbing gas
REFERENCES
