


Abstract
Modified Newtonian dynamics (MOND) proposed by Milgrom provides a paradigm alternative to dark matter (DM) that has been successful in fitting and predicting the rich phenomenology of rotating disc galaxies. There have also been attempts to test MOND in dispersion-supported spheroidal early-type galaxies, but it remains unclear whether MOND can fit the various empirical properties of early-type galaxies for the whole ranges of mass and radius. As a way of rigorously testing MOND in elliptical galaxies we calculate the MOND-predicted velocity dispersion profiles (VDPs) in the inner regions of ∼2000 nearly round Sloan Digital Sky Survey elliptical galaxies under a variety of assumptions on velocity dispersion (VD) anisotropy, and then compare the predicted distribution of VDP slopes with the observed distribution in 11 ATLAS3D galaxies selected with essentially the same criteria. We find that the MOND model parametrized with an interpolating function that works well for rotating galaxies can also reproduce the observed distribution of VDP slopes based only on the observed stellar mass distribution without DM or any other galaxy-to-galaxy varying factor. This is remarkable in view that Newtonian dynamics with DM requires a specific amount and/or profile of DM for each galaxy in order to reproduce the observed distribution of VDP slopes. When we analyse non-round galaxy samples using the MOND-based spherical Jeans equation, we do not find any systematic difference in the mean property of the VDP slope distribution compared with the nearly round sample. However, in line with previous studies of MOND through individual analyses of elliptical galaxies, varying MOND interpolating function or VD anisotropy can lead to systematic change in the VDP slope distribution, indicating that a statistical analysis of VDPs can be used to constrain specific MOND models with an accurate measurement of VDP slopes or a prior constraint on VD anisotropy.
1 INTRODUCTION
Mass discrepancy (or missing mass) problems in galaxies, galaxy clusters and the Universe have usually been attributed to dark matter (DM) assuming that standard Newton–Einstein gravity is valid in those dynamical systems (for reviews see e.g. Trimble 1987; Bertone, Hooper & Silk 2005; Sanders 2014a). The currently popular Λ cold dark matter (ΛCDM) cosmological paradigm of the Universe provides a successful phenomenological model of the large-scale structure, the cosmological microwave background radiation (CMBR) anisotropy power spectrum and the expansion history of the Universe (e.g. Hinshaw et al. 2013; Planck Collaboration XVI 2014). Theories of galaxy formation and evolution based on the ΛCDM paradigm have also been making progress with the goal of explaining the rich phenomenology of galaxies (for a review see e.g. Mo, van den Bosch & White 2010).
However, in the realm (where dynamics is non-linear) of galaxies the ΛCDM paradigm appears to face serious challenges. Rotation curves of disc galaxies start to deviate from Newtonian expectation all at the same critical acceleration scale a0 ≈ 1.2 × 10⁻¹⁰ m s−2 regardless of galaxy size, luminosity, surface brightness or any other property (McGaugh 2004; Famaey & McGaugh 2012). The velocity at the flat part of the rotation curve is well correlated with the total baryonic mass of the galaxy (consistent with zero intrinsic scatter) spanning five orders of magnitude in baryonic mass from giant spiral galaxies to low surface brightness galaxies; this correlation is now known as the baryonic Tully–Fisher relation (McGaugh 2005, 2011; Famaey & McGaugh 2012). Furthermore, to every feature in an individual rotation curve there corresponds a feature in baryonic mass density profile even in galaxies whose dynamics should be dominated by DM if the ΛCDM paradigm is assumed (Sancisi 2004; Famaey & McGaugh 2012).
The apparent existence of the critical acceleration a0 and the intimate connection between the galaxy rotation curve and the baryonic mass distribution seems unnatural in the ΛCDM paradigm. Other outstanding challenges of the ΛCDM paradigm in galaxies such as the number and distribution of DM subhaloes and the DM central cusp/core density profile are also well documented in the literature (Famaey & McGaugh 2012; Kroupa, Pawlowski & Milgrom 2012; McGaugh 2015).
Milgrom's modified Newtonian dynamics (MOND; Milgrom 1983) offers an alternative paradigm that can bypass the above challenges of rotating galaxies faced by the ΛCDM paradigm. The MOND paradigm posits that Newton's law of gravity breaks down at extremely low accelerations below the critical acceleration a0. Then, the phenomenological existence of a0, the baryonic Tully–Fisher relation and so on can be unified in a single MOND law (see Famaey & McGaugh 2012 for an extensive review). Whether the empirical MOND law can be ultimately explained by a fundamental law of modified gravity or somehow by revised theories of galaxy formation under the ΛCDM paradigm, it is clearly worthwhile as a Kepler-like law of galactic kinematics. If the remarkable success of the MOND paradigm in rotating galaxies implies an underlying law, it must also explain the empirical properties of spheroidal early-type (elliptical and lenticular) galaxies (ETGs) that are different from disc galaxies in dynamics and structure. In this respect it is quite interesting to test MOND in ETGs.
However, testing MOND (or DM) in ETGs is far more challenging because they lack neutral hydrogens (the crucial dynamical tracer for disc galaxies) and orbits of stars (and other tracers) are complex (and/or unknown). Nevertheless, significant efforts have been made to test MOND (and DM) in ETGs using dynamical tracers such as stars (e.g. Salinas et al. 2012 and references therein), planetary nebulae (PNe), globular clusters (GCs), hot X-ray gases, satellite galaxies and gravitational lensing. Despite significant efforts, it is not yet clear whether MOND can provide a successful phenomenological model for the dynamics of ETGs. Sometimes, analyses of the same galaxies often reached different conclusions.
Based on the kinematics of PNe (out to ∼5Re, where Re is the effective radius) of three elliptical galaxies, Milgrom & Sanders (2003) argued that MOND could explain the observed kinematics well and no DM would be needed. However, for the same galaxies Dekel et al. (2005) argued that DM would be consistent with the data once radially varying velocity dispersion (VD) anisotropies were allowed. Independent analyses of PNe kinematics of two other ellipticals by Tiret et al. (2007) and Samurović (2010) showed that MOND could explain the kinematics without DM. Based on the velocity dispersion profiles (VDPs) of stacked Sloan Digital Sky Survey (SDSS) satellite galaxies around two narrow luminosity ranges of red galaxies Klypin & Prada (2009) and Angus et al. (2008) reached opposite conclusions, respectively, against and for MOND because of their different assumptions on the profiles of density and VD anisotropy of satellites. Milgrom (2012) tested MOND using the mass profiles of two X-ray bright elliptical galaxies deduced assuming hydrostatic equilibrium and found that MOND successfully reproduced the profiles over a wide acceleration range from >10a0 (near the galactic centre) down to ∼0.1a0 (over 100–200 kpc). Analyses of (the masses of) strong lens ETGs also produced confusing results, some arguing against MOND (e.g. Ferreras et al. 2012) while others for MOND (e.g. Chiu et al. 2011; Sanders 2014b).
Based on the kinematics of GCs (out to several Re) several studies (Richtler et al. 2008; Samurović & Ćirković 2008; Samurović 2012, 2014; Schuberth et al. 2012) tested MOND in a handful of elliptical galaxies. In particular, Samurović (2014) carried out a systematic analysis of 10 elliptical galaxies covering a broad range of mass. These studies of GC kinematics employed spherical Jeans analyses assuming isotropy or relatively simple anisotropies. According to these studies, as Samurović (2014) emphasized, MOND alone without an additional DM component could not provide a successful fit for several massive slow rotators in their outer regions (beyond ∼3Re), although MOND was generally successful for less massive fast rotators (where the slow/fast dichotomy is in the sense by Emsellem et al. 2007). Richtler et al. (2008) also advocated the need of DM under MOND in the central massive galaxy of the Fornax cluster. It is unclear whether these results imply the breakdown of MOND for a class of elliptical galaxies. The main limits of these studies are small sample sizes and uncertainties in VD anisotropy.
A rigorous test of MOND in ETGs would require (1) a statistically representative sample of ETGs and (2) an empirical probe of mass profile over a wide acceleration range. Here, we propose a test of MOND in elliptical galaxies satisfying the first requirement to a large extent and the second requirement only partially. We calculate MOND-based VDPs of ∼2000 nearly round galaxies from Chae, Bernardi & Kravtsov (2014) for 0.1Re < r < Re using the observed stellar mass distributions under a variety of possibilities of VD anisotropy. We calculate the slopes of the VDPs for 0.1Re < r < Re and compare the distribution of the slopes with the measured distribution in a similarly selected sample of 11 nearly round ATLAS3D (Cappellari et al. 2011) galaxies. Hence our analysis is statistical in nature. We describe the data and the method of analysis in Section 2 and the results in Section 3. We discuss implications of our results for MOND and give our conclusions in Section 4.
2 DATA AND METHOD OF ANALYSIS
We consider only elliptical galaxies that are nearly round so that they can be analysed based on the spherical symmetry assumption with minimal error. A statistically representative sample of nearly round galaxies can be drawn from the immense SDSS (York et al. 2000) data base.1 We use a sample of SDSS galaxies defined and analysed under the ΛCDM paradigm by Chae, Bernardi & Kravtsov (2014, see also Bernardi et al. 2010) that contains photometric parameters recently investigated and measured by Meert, Vikram & Bernardi (2013, 2015) based on Data Release 7 (DR7).2 The sample contains 2054 elliptical galaxies with a mean redshift of 〈z〉 ≈ 0.12 spanning two orders of magnitude in stellar mass that are nearly round (projected minor-to-major axis ratio b/a > 0.85) and do not possess a measurable disc.
Under the standard Newtonian dynamics the observed VD σap may be reproduced by adjusting the stellar mass-to-light (M⋆/L) ratio or equivalently the stellar IMF for a flexible assumption of DM mass profile (even including the case of no DM) given the empirical intrinsic galaxy-to-galaxy scatter of IMF. This means that σap (an average quantity within a region) itself may not be a sensitive probe of gravity or mass distribution. However, the VDP is a powerful probe. The observed VDP of an individual galaxy over a radial range can be used to infer the total mass profile for that range under Newtonian dynamics (e.g. Thomas et al. 2007). For a large sample of galaxies that do not have individually measured VDPs one can, as done in Chae et al. (2014), predict VDPs using galaxy models satisfying the available observational constraints, and then compare the statistical distribution of VDPs with an available empirical distribution. Such a comparison of VDP slope distributions clearly shows that galaxies must be embedded in DM haloes to match the empirical distribution if Newtonian dynamics is assumed to be valid at all acceleration scale (see Chae et al. 2014 and below).
For MONDian dynamical analyses of a galaxy any external field in which the galaxy is embedded should, in principle, be taken into account. A MONDian external field effect (EFE; Milgrom 1983; Famaey, Bruneton & Zhao 2007; Richtler et al. 2011) may particularly matter for those in the central regions of galaxy clusters and those having close neighbours. Most galaxies in our SDSS sample are not in cluster centres and have light distributions ‘uncontaminated’ by neighbours. Also, an evaluation of EFEs for elliptical galaxies using the Virgo and Coma clusters by Richtler et al. (2011) indicates that the expected effects are small. In this work we do not consider including EFEs for our selected galaxies.
Published values of η for dozens of ETGs have a mean of 〈η〉 = −0.06 ± 0.01 with a galaxy-to-galaxy intrinsic scatter of ση = 0.03–0.04 (e.g. Cappellari et al. 2006; Chae et al. 2014). For a more reliable comparison with our nearly round galaxies we select galaxies from the ATLAS3D (Cappellari et al. 2011) public data5 using the same criteria. Out of 260 ATLAS3D ETGs 33 galaxies satisfy projected b/a > 0.85 in both photometric (Cappellari et al. 2013a) and kinematic (Emsellem et al. 2011) distributions within both Re/2 and Re. 17 of them are elliptical and out of these 15 have measured values of LOSVD over 300 bins (pixels) on the plane of the optical region allowing reliable measurement of η. Finally, excluding galaxies having the mean of bulge and total Sérsic indices nSer < 2.5 as for the SDSS ETG sample (Chae et al. 2014) we are left with 11 galaxies: they are NGC 3193, 3379, 4168, 4278, 4283, 4374, 4458, 4552, 5173, 5638 and 5846. For each galaxy about 20 concentric rings are defined within Re. LOSVDs of the bins in each ring are averaged and weighted with the surface brightness (Scott et al. 2013) of the ring and then these luminosity-weighted average LOSVDs give a σ(R) profile. The derived σ(R) profiles for the 11 galaxies are displayed in Fig. 1. For these galaxies the least-square fit power-law slopes for 0.1Re < R < Re have a mean of 〈η〉 = −0.057 ± 0.011 with a standard deviation of 0.037 ± 0.007 (where the quoted errors have been estimated from bootstrap resampling) consistent with published results for ETGs of any ellipticity (Cappellari et al. 2006; Chae et al. 2014).
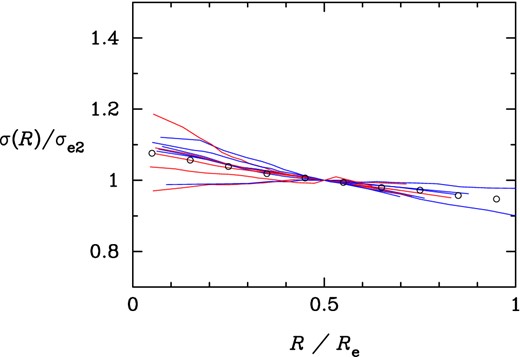
Profiles of luminosity-weighted LOSVD σ(R) (equation 11) for 11 nearly round ATLAS3D galaxies for which LOSVDs have been measured over 300 bins in the optical region (see the text). Red and blue profiles represent, respectively, slow and fast rotators. The abscissa is radius R on the sky normalized by the effective radius Re while the ordinate is normalized by σe2 ≡ σ(R = Re/2). Small circles represent the mean of the displayed profiles.
Emsellem et al. (2011) classify ATLAS3D ETGs by the degree of large-scale rotation using the criterion defined by Emsellem et al. (2007). As noted in Section 1, some previous tests (based mostly on GC kinematics) of MOND in elliptical galaxies obtained contrasting results for fast and slow rotators [MOND was not successful for the outer part ( ≳ 2–3Re) kinematics of slow rotators in several cases; see Samurović 2014 and references therein]. For SDSS ETGs this kinematic information is missing. The majority (86 ± 2 per cent) of ATLAS3D ETGs are classified as fast rotators. However, for the above 11 ATLAS3D ellipticals selected using essentially the same criteria as for the SDSS sample, about one half (six out of 11) are fast rotators. These two kinematic classes of galaxies have mean VDP slopes 〈η〉 = −0.067 ± 0.014 (fast) versus −0.046 ± 0.017 (slow) where the discrepancy is not statistically significant based on the small samples. We caution, however, that the low precision of current samples does not allow a sensitive test.
Fig. 2 shows the distributions of DM fraction within the effective radius (fDM) for the SDSS and the ATLAS3D nearly round galaxies as a function of stellar mass (M⋆), effective radius (Re) and Sérsic index (nSer), where SDSS parameter values are taken from the Chae et al. (2014) modelling result for their fiducial inputs. There are significant differences between SDSS and ATLAS3D samples. SDSS galaxies have larger fDM overall (mean 〈fDM〉 ≈ 0.32 versus 0.18) and are biased towards greater stellar masses (mean log10(M⋆/M⊙) ≈ 11.3 versus 10.8) and (more noticeably) larger sizes (mean log10(Re/kpc) ≈ 0.82 versus 0.48). The range of modelling results considered by Chae et al. (2014) taking into account various systematic effects give 0.27 ≲ fDM ≲ 0.38. The second panel of Fig. 2 indicates that the difference in 〈fDM〉 can be in large part attributed to the difference in galaxy sizes. Indeed, at log10(Re/kpc) = 0.5 SDSS galaxies have fDM ≈ 0.25 (with a systematic error of ∼0.05 due to input variations) getting closer to 0.18 of ATLAS3D galaxies.
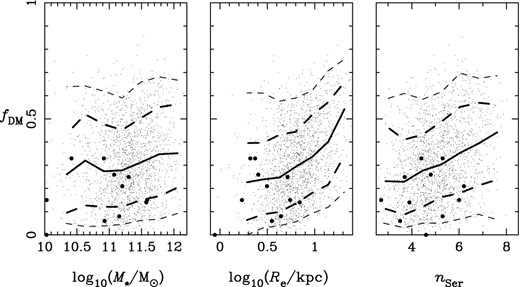
DM fraction within the sphere of radius equal to Re (fDM) in SDSS and ATLAS3D nearly round galaxies as a function of stellar mass (M⋆), effective radius (Re) and Sérsic index (nSer). Large dots represent 11 ATLAS3D galaxies. SDSS galaxies are represented by small dots with thick solid curves representing the median values, thick and thin dashed curves the 68 and 95 per cent limits, respectively. See the text for details.
The difference in Re between the SDSS and the ATLAS3D samples may be due to various factors including different parent populations, measurement errors and different methods of modelling light profiles. The ATLAS3D parent sample is a volume limited sample in the local Universe within D < 42 Mpc (almost) complete for M⋆ ≳ 6 × 10⁹ M⊙ (Cappellari et al. 2011). The SDSS parent sample is magnitude limited to cosmological distances (up to redshift ∼0.2 with a median redshift of ∼0.1) and thus completeness becomes less secure for less luminous galaxies and at larger distances. It is also likely that measurement/modelling errors are at work as can be seen e.g. from the systematic difference between Third Reference Catalogue of Bright Galaxies (RC3) and Two Micron All Sky Survey (2MASS) photometric data for the same ATLAS3D galaxies (Cappellari et al. 2011) and dependence on modelling details for SDSS galaxies (Meert et al. 2013).
We assume that the statistical distribution of η is not significantly affected by such sample difference as that between SDSS and ATLAS3D samples and use the measured distribution of η for the ATLAS3D galaxies to interpret modelling results for the SDSS galaxies. We also make no distinction between fast and slow rotators and note that our selected ATLAS3D galaxies are nearly evenly divided (Fig. 1).
3 RESULTS
The output distribution of η for the SDSS galaxy sample can depend on the input stellar IMF (distribution), parametrized by δM (equation 12), and VD anisotropy β(r) for a given MOND model (interpolating function). Our standard choice for the VD-dependent stellar IMF is that preferred by ATLAS3D (Cappellari et al. 2013b), which can be re-expressed in our adaptation as δM = 0.11 + 0.35log10(2−0.06σe2/130 km s−1). Unless specified otherwise, all presented results are based on the input of this ATLAS3D IMF distribution. However, as demonstrated below, it turns out that the output η distribution is only weakly dependent on the input δM distribution.
We first compare the Newtonian cases without and with DM presented in Chae et al. (2014) with a MOND case. The results for the three cases are shown in Fig. 3. The Newtonian case with DM reproduced here is the result based on the fiducial inputs by Chae et al. (2014). Newtonian dynamics clearly requires DM in a statistical sense (see also Fig. 2) and can match the observed VDP distribution with adjustment of various inputs (Chae et al. 2014). However, it is also evident that MOND can reproduce well the VDP distribution.

Predicted distributions of VDP slope η (equation 13) for ∼2000 nearly round SDSS elliptical galaxies. Three cases are compared: Newtonian cases without and with DM presented in Chae et al. (2014) and a MOND case calculated here for (n, 〈β〉) = (1.5, 0) and shown in Fig. 4. Vertical red solid and dashed lines indicate the measured mean and its error for 11 ATLAS3D nearly round galaxies shown in Fig. 1. The arrows indicate the mean values of the distributions.
We present in turn MOND results for constant anisotropy (Section 3.1) and for varying anisotropy of the form βdOM(r) (Section 3.2).
3.1 Constant anisotropy
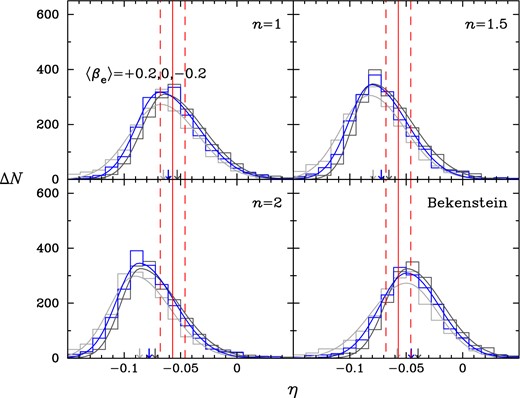
Anisotropy values are drawn from a Gaussian distribution with a mean of 〈β〉 and a standard deviation of 0.2, which is motivated from studies of nearby ETGs (e.g. Gerhard et al. 2001; Cappellari et al. 2007; Thomas et al. 2007). The predicted distribution of η for the SDSS galaxy sample then depends on the input mean anisotropy 〈β〉 and MOND interpolating function. We consider 〈β〉 = +0.2 (light grey), 0 (blue) and −0.2 (dark grey) for each of n = 1, 1.5 and 2 in the function given by equation (5) as well as for the function given by equation (7). The results are displayed in Fig. 4. For n = 1.5 the predicted mean of η can match easily the measured value. The cases n = 1 and n = 2 can also match the measured distribution but not for all the cases of 〈β〉. The case n = 1 prefers 〈β〉 = +0.2 while n = 2 prefers 〈β〉 = −0.2. These results imply that a number of degenerate sets of (n, 〈β〉) can be consistent with the measured η value. However, Bekenstein's model is disfavoured for the assumed cases of constant anisotropies.
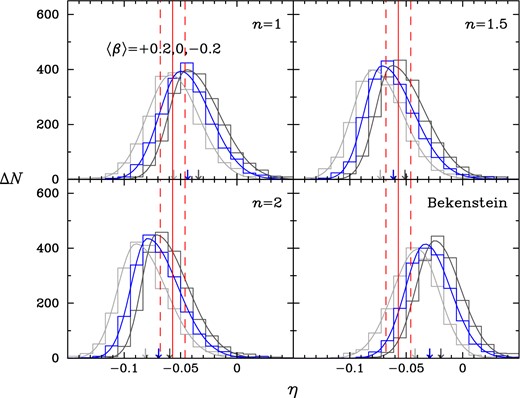
Predicted distribution of VDP slope η (equation 13) for the SDSS galaxy sample depending on MOND interpolation function and VD anisotropy mean value 〈β〉 assuming anisotropy is constant and has a galaxy-to-galaxy scatter of 0.2. We consider a MOND interpolation function of the form given by equation (5) with index n = 1, 1.5 and 2 as well as that given by equation (7) taken from Bekenstein's (2004) relativistic theory of modified gravity. For each MOND model we consider three cases of 〈β〉 = +0.2 (light grey), 〈β〉 = 0 (blue) and 〈β〉 = −0.2 (dark grey). Red lines are the same as in Fig. 3. The arrows indicate the mean values of the distributions.
In our approach it turns out that the output distribution of η is only weakly dependent on the input IMF. In the random process of finding (δM, β) where δM (equation 12) is essentially a representation of the stellar mass-to-light ratio depending on the IMF, the posterior distribution of δM generally deviates from the prior input distribution. Fig. 5 shows the distributions of δM for three cases of input IMF: two VD-independent cases of Chabrier (2003) and Salpeter (1955) and one VD-dependent case of ATLAS3D (Cappellari et al. 2013b), with an intrinsic scatter of 0.1 dex (Cappellari et al. 2013b) imposed in all cases. Irrespective of the input IMF the posterior mean of δM increases with VD and its functional behaviour is well within the behaviours of recently inferred IMFs (Conroy & van Dokkum 2012; Cappellari et al. 2013b; Tortora et al. 2013).
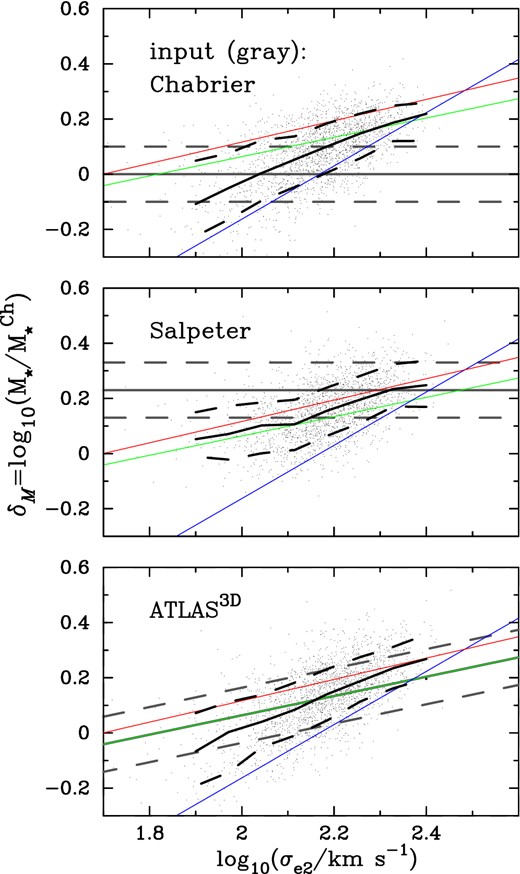
Input and output distributions of stellar IMF mismatch parameter δM (equation 12). Three input IMFs are represented by grey lines with an intrinsic scatter of 0.1 dex (represented by dashed lines): Chabrier (2003), Salpeter (1955) and ATLAS3D (Cappellari et al. 2013b). Data points are the output models and the black lines indicate the median relations (with dashed lines indicating the 68 per cent limits). Thin lines represent recently measured IMF behaviours: red – Conroy & van Dokkum (2012); green – Cappellari et al. (2013b); blue – Tortora et al. (2013).
For the cases of constant anisotropy the predicted width (containing 68 per cent of galaxies) and standard deviation of η (∼0.23) are smaller than the measured standard deviation of ση ≈ 0.037 ± 0.007. This discrepancy is largely removed if varying anisotropies are used as described in Section 3.2.
3.2 Varying anisotropy
For |$\beta _{\rm dOM}(r)=\beta _1/(1+r_1^2/r^2)+\beta _2/(1+r_2^2/r^2)$| the radial mean for 0 ≤ r ≤ Re, βe and the anisotropy at infinity β∞ = β1 + β2 are assumed to be drawn from a Gaussian distribution with a standard deviation of 0.2. Because βe can differ from β∞ for a galaxy (although the means for the entire sample are assumed to be the same, i.e. 〈βe〉 = 〈β∞〉) and 0 < r1/Re < r2/Re < 1 the adopted function allows wild variation within Re. This does not necessarily mean that βdOM(r) represents or fully encompasses real behaviours of anisotropy. We just use βdOM(r) to mimic some uncertainties in varying anisotropies. Examples (taken from modelling results) of βdOM(r) for mean 〈βe〉 = 〈β∞〉 = +0.2, 0 and −0.2 can be found in Fig. 6. Similar examples but with β(r = 0) ≠ 0 can be found in the appendix C of Chae et al. (2012).
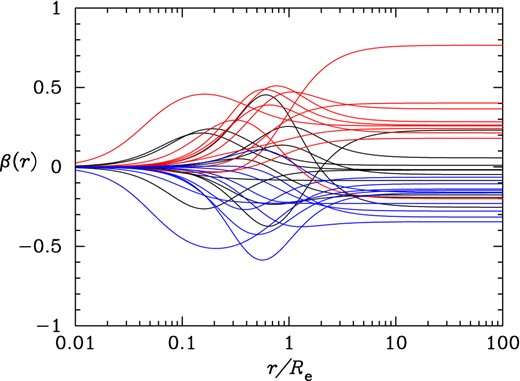
Examples of varying anisotropy |$\beta _{\rm dOM}(r)=\beta _1/(1+r_1^2/r^2)+\beta _2/(1+r_2^2/r^2)$| for mean 〈βe〉 = 〈β∞〉 = +0.2 (red), 0 (black) and −0.2 (blue) and 0 < r1/Re < r2/Re < 1.
Fig. 7 shows the predicted distributions of η for the same combinations of (n, 〈βe〉) as in Fig. 4 of the constant anisotropy case. Compared with the constant anisotropy case the predicted mean 〈η〉 shifts by ≈− 0.01 for the same input of (n, 〈β〉). Consequently, the empirical value of η is best matched by the case n = 1. The case n = 2 is now disfavoured. Interestingly, Bekenstein's model can now be consistent with the empirical value with a suitable choice of 〈βe〉 although it may not be a preferred model. These results confirm that anisotropy shapes can matter in the study of MOND (as well as DM) in spheroidal galaxies.
Same as Fig. 4 except that radially varying anisotropies are used and βe refers to the radial average of an anisotropy within Re of a galaxy.
The width (containing 68 per cent) of the distribution (∼0.27) is about 20 per cent larger compared with the constant anisotropy case, but still somewhat lower than the measured standard deviation. However, the marginal discrepancy may be a result of non-Gaussian nature of the distribution. Indeed, the standard deviation of the distribution (∼0.4) is larger than the 68 per cent width and matches well the measured standard deviation.
4 DISCUSSION AND CONCLUSIONS
We have investigated VDPs for r ≲ Re of ∼2000 nearly round SDSS galaxies with 10 ≲ log 10(M⋆/M⊙) ≲ 12 (mean ≈11.3). Previous study by Chae et al. (2014) shows that the predicted distribution of VDP slope η (equation 13) cannot match an observed distribution without DM under Newtonian gravity (see also Fig. 3). Furthermore, as shown in Chae et al. (2014) each galaxy requires different amount and profile of DM. DM fraction within Re ranges from fDM ≈ 0.1 to 0.5 (68 per cent range; see Fig. 2) and the inner DM density profile slope α, in the generalized Navarro–Frenk–White (Navarro, Frenk & White 1997) parametrization ρDM(r) ∝ (r/rs)−α(1 + r/rs)−3 + α, ranges from α ≈ 0.7 to 1.5 (68 per cent). These results mean that elliptical galaxies do require DM under Newtonian gravity in a statistical sense, although some fraction of galaxies may not contain significant amount in the optical region.
Our analysis of the same galaxies under MOND here indicates that the observationally derived value of η (in 11 nearly round ATLAS3D galaxies) can be reproduced based on a single MOND interpolating function without DM applied to all the galaxies. It is particularly striking that with an interpolation function similar to that of n = 1 or 2 in equation (5), used in various MOND studies particularly for disc galaxies (e.g. Famaey & Binney 2005; Sanders & Noordermeer 2007; Angus et al. 2008; Milgrom 2012), the empirical η value can be easily matched with a relaxed assumption of VD anisotropy (Figs 4 and 7).
The specific functional form of MOND interpolating function depends, however, on the assumption on VD anisotropy (Figs 4 and 7) and cannot be uniquely determined from the current empirical η value. The implied interpolating function can be varied by varying mean anisotropy or radial behaviours. For constant anisotropy and the functional form given by equation (5), mean anisotropy 〈β〉 = +0.2, 0 and −0.2 give, respectively, 0.7 ≲ n ≲ 1.4, 1.1 ≲ n ≲ 1.9 and 1.3 ≲ n ≲ 2.5. For the case of radially varying anisotropy there is an overall shift of Δn ≈ −0.5 for the same value of mean anisotropy so that the traditionally standard model n = 2 is disfavoured. These manifest a degeneracy between MOND interpolating function and VD anisotropy, which is reminiscent of the well-known mass–anisotropy degeneracy under standard dynamics (e.g. Binney & Mamon 1982). This interpolating function–anisotropy degeneracy can be alleviated by a more precise empirical value of 〈η〉 or prior constraints on anisotropy.
Our analysis has been limited to nearly round galaxies (under the spherical symmetry assumption) in the intermediate-acceleration regime although they cover a broad range of mass and size. A MOND analysis of ETGs of any ellipticity is considerably more challenging but would be necessary for a more rigorous test of MOND in spheroidal systems. If a random sample of elliptical galaxies (drawn from the same SDSS parent sample of ETGs using the same criteria except for the ellipticity limit) is analysed based on the MOND spherical Jeans equation (equation 2), the resulting η-distribution has a similar mean but a somewhat larger scatter, probably hinting that MOND works also for ETGs of any ellipticity.
Our analysis provides a novel and rigorous test of MOND in spheroidal galaxies in the sense that it is based on a statistically representative sample of spheroidal galaxies and a range of possibilities of VD anisotropy. Our test is most sensitive at r ≲ Re/2 where gravitational acceleration g due to the baryonic mass distribution is ≳ a0 (Fig. 8). However, our galaxies cover the range 0.1Re ≲ r ≲ Re (see fig. 1 of Chae et al. 2014) for which 0.3a0 ≲ g ≲ 100a0 (Fig. 8). Our results support the view that MOND suggested by dynamics of rotating galaxies is also likely to be valid for dispersion-supported galaxies in their inner regions (r ≲ Re). Our results are in line with the test of MOND through hydrostatic equilibrium in two X-ray bright elliptical galaxies over a wide acceleration range by Milgrom (2012).
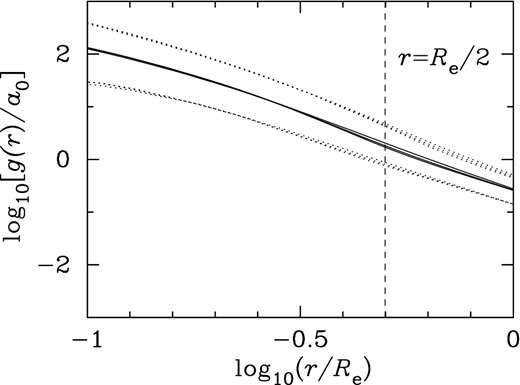
Distribution of gravitational acceleration g(r) normalized by a0 = 1.2 × 10⁻¹⁰ m s−2 due to stellar mass within radius r in ∼2000 nearly round SDSS galaxies based on modelling results with n = 1, 1.5 and 2 for 〈β〉 = 0 shown in Fig. 4. The solid curves represent the medians while the dotted curves represent the 95 per cent limits. The observed VDs of SDSS galaxies analysed in this work are luminosity-weighted LOSVDs within projected radius Rap, which is peaked at Re/2 (represented by the vertical dashed line) but ranges from ∼0.1Re up to ∼Re.
In this work we could not separately consider slow and fast rotators because the necessary kinematic information is not available for the analysed SDSS galaxies. The fact that the similarly selected ATLAS3D elliptical galaxies are nearly evenly divided (see Section 2) hints that the SDSS sample may also contain both kinematic classes, although it is likely to be somewhat biased towards slow rotators as the galaxies are on average more massive and larger than the ATLAS3D counterparts (see Fig. 2). Recently, Samurović (2014) carried out individual Jeans modelling of 10 elliptical galaxies, four of whom are slow rotators, based on observed GC kinematic data up to several effective radii. Considering two cases of constant anisotropy β = 0, −0.2 and one case of radially varying β(r) ≈ 0.5r/(r + 1.4Re) for MOND interpolating functions of n = 1, 2 in equation (5) and that of equation (7), Samurović (2014) could not find successful fits of slow rotators without additional component of DM beyond ∼2–3Re. For one galaxy NGC 4486 (M87), which is in the central region of a cluster, the considered MOND models and anisotropies had difficulty of fitting GC kinematic data even in the inner region (r ≲ 0.5Re). However, as Samurović (2014) notes, it remains unclear whether these problems based on limited cases of anisotropies imply breakdown of MOND for certain objects. In this work we have considered a broader range of possibilities of anisotropy and found that VDPs of a mixed population of fast and slow rotators for r ≲ Re could be statistically explained by MOND without any DM.
If the empirical MOND law is to be truly meaningful, there must exist a universal interpolating function. Studies up to the present indicate that this is a reasonable possibility. However, a firm conclusion can only be reached through precise determination of interpolating functions of galaxies of various types. Our analysis shows that the statistics of VDPs of elliptical galaxies provides a useful tool to test interpolating functions. This statistical analysis can complement individual analyses that can be performed with detailed kinematic data (e.g. Samurović 2014). Despite its current limits, our analysis appears to support the simple interpolating function (equation 5 with n = 1; see Figs 4 and 7), which has also been preferred by galaxy rotation data (e.g. Famaey & Binney 2005; Sanders & Noordermeer 2007) and studies of elliptical galaxies (see Milgrom 2012 and references therein), although we cannot yet rule out the traditionally standard model with n = 2 or even the interpolating function (equation 7) implied by Bekenstein's modified gravity (Bekenstein 2004; Zhao & Famaey 2006).
If a single interpolating function turns out to explain dynamics of all galaxies, that would have far-reaching implications. In this respect it would be quite interesting to empirically verify and determine the supposed universal MOND interpolating function with future data. For spheroidal galaxies both statistical (for large samples, as was demonstrated in this study) and individual (for large radial extent, performed earlier and ongoing) analyses of VDPs will be useful.
We are grateful to Srdjan Samurović for providing a thorough and helpful report of the submitted manuscript. We also thank Maurice van Putten for useful discussions/comments and Mariangela Bernardi for helpful communication regarding SDSS galaxies.
The Meert et al. (2015) photometric measurements for full DR7 data can be downloaded at http://shalaowai.physics.upenn.edu/∼ameert/fit_catalog/download/
If a VDP is measured for a radial range of a galaxy, then one can in principle simultaneously solve for δM and β(r) for that range for the measured ρ(r) and σ(R).
The relation between (βe, β∞) and (β1, β2) can be found in appendix B of Chae et al. (2014).
