


Abstract
We present an analysis of the binary and physical parameters of a unique pulsating white dwarf with a main-sequence companion, SDSS J1136+0409, observed for more than 77 d during the first pointing of the extended Kepler mission: K2 Campaign 1. Using new ground-based spectroscopy, we show that this post-common-envelope binary has an orbital period of 6.89760103(60) h, which is also seen in the photometry as a result of Doppler beaming and ellipsoidal variations of the secondary. We spectroscopically refine the temperature of the white dwarf to 12 330 ± 260 K and its mass to 0.601 ± 0.036 M⊙. We detect seven independent pulsation modes in the K2 light curve. A preliminary asteroseismic solution is in reasonable agreement with the spectroscopic atmospheric parameters. Three of the pulsation modes are clearly rotationally split multiplets, which we use to demonstrate that the white dwarf is not synchronously rotating with the orbital period but has a rotation period of 2.49 ± 0.53 h. This is faster than any known isolated white dwarf, but slower than almost all white dwarfs measured in non-magnetic cataclysmic variables, the likely future state of this binary.
1 INTRODUCTION
White dwarfs are the endpoint for all stars less massive than about 8–10 M⊙, making them the fossils of more than 97 per cent of Galactic stellar content (Williams, Bolte & Koester 2009; Doherty et al. 2015). They are representative of the general population of all stars, providing benchmarks that can calibrate theories of both stellar and binary evolution.
White dwarfs do not sustain substantial nuclear burning, and their evolution is almost exclusively defined by passive cooling of the residual thermal energy of ions in the core. Fortunately, when hydrogen-atmosphere (DA) white dwarfs reach an appropriate effective temperature (roughly 12 500 K), their non-degenerate atmosphere develops a partial ionization zone, impeding energy transport and driving global pulsations; these are the ZZ Ceti stars (or so-called DAVs). Asteroseismology, enabled by matching the periods of observed luminosity variations to well-calibrated theoretical models, provides unparalleled insight into the interiors of these white dwarfs (see reviews by Fontaine & Brassard 2008; Winget & Kepler 2008; Althaus et al. 2010a).
The development of a surface convection zone and the subsequent driving of pulsations are believed to be a naturally occurring phase for all white dwarfs (e.g. Bergeron et al. 2004; Castanheira et al. 2007). This so far holds regardless of overall stellar mass (Giovannini et al. 1998) or core composition (Hermes et al. 2013b).
White dwarfs found in binaries should also pulsate when they reach the appropriate temperature, and recently the first pulsating white dwarfs with main-sequence companions were discovered (Pyrzas et al. 2015). Roughly two-thirds of the known white dwarfs with M dwarf companions are wide enough that the progenitors evolved as if they were single stars (e.g. Nebot Gómez-Morán et al. 2011). The others evolved through a common envelope with a close companion and are post-common-envelope binaries (PCEBs).
Most PCEBs are the detached precursors to cataclysmic variable systems. Nearly all progenitors of observed Type Ia supernovae, independent of single versus double-degenerate channel, are believed to go through at least one common-envelope phase. Pulsating white dwarfs in PCEBs thus hold the exciting potential to allow for the first empirical test of the effects binary interaction has on the remnant white dwarf internal structure and chemical profiles, and can possibly directly constrain Type Ia supernovae boundary conditions.
Serendipitously, the only pulsating white dwarf in a confirmed PCEB discovered by Pyrzas et al. (2015), SDSS J113655.17+040952.6 (hereafter J1136+0409), was observable during the first science field of the two-wheel-controlled Kepler mission (K2 Campaign 1). The extended Kepler mission delivers space-based time series photometry on targets for up to 85 d along the ecliptic (see Howell et al. 2014).
J1136+0409 was spectroscopically identified as a composite WD+dM from a Sloan Digital Sky Survey (SDSS) spectrum. Model-atmosphere fits to the Balmer absorption lines initially suggested the white dwarf had an effective temperature of 11 700 ± 150 K and log g = 7.99 ± 0.08 (Rebassa-Mansergas et al. 2012a), placing it in the empirical DAV instability strip. Pulsations were confirmed by a short (1.0 h) run with the ULTRACAM instrument mounted on the 3.5-m New Technology Telescope, with significant periods near 276.5 and 182.2 s (Pyrzas et al. 2015).
For nearly 78 d in 2014 August, the Kepler spacecraft observed J1136+0409 every minute, delivering an exceptional light curve of the first known pulsating white dwarf in a PCEB. We present here a detailed analysis of the pulsations and binary parameters of J1136+0409, enabled by space-based photometry, as well as spectroscopy from the 8.2-m Very Large Telescope (VLT) and the 4.1-m Southern Astrophysical Research (SOAR) telescope.
2 OBSERVATIONS AND REDUCTIONS
2.1 Spectroscopic observations
The identification of J1136+0409 as both a candidate pulsating white dwarf and a close WD+dM binary arose from an ancillary SDSS science fibre placed on the target. That spectrum, visible in the top panel of Fig. 1, clearly displays a composite of a white dwarf at bluer wavelengths and an M dwarf dominating at redder wavelengths. Fits for the white dwarf temperature put it within the empirical DAV instability strip, and the SDSS subspectra showed significant radial velocity variability over just 18 min, suggesting it is a close binary system. To better constrain both unique aspects of the system, we obtained follow-up spectroscopy.
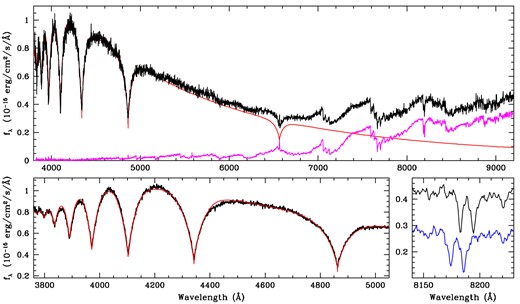
Spectroscopic observations of the WD+dM binary J1136+0409. The top panel shows the discovery spectrum from SDSS. Underplotted in red is the best-fitting SDSS white dwarf model, as well as an M6 template in magenta estimating the contribution of the M-dwarf companion at redder wavelengths. The bottom left-hand panel details our high signal-to-noise ratio SOAR spectrum, from which we refine the white dwarf atmospheric parameters (red line, see Section 3). The bottom right-hand panel shows two different epochs of our VLT/FORS2 observations to calculate the radial velocity of the M dwarf companion using the Na i doublet (see Section 4.1).
In order to solve the radial velocity of the dM component of the system, we obtained 11 service-mode observations using the Focal Reducer/Low Dispersion Spectrograph 2 (FORS2) instrument on the 8.2-m VLT/Unit Telescope 1 (UT1) (Antu) between 2009 April 4 and 2014 May 27. These intermediate-resolution spectra were all taken using the 1028z grism and a 1-arcsec slit, covering a spectral region of 7830–9570 Å with a dispersion of roughly 0.8 Å pixel−1 and 2.4 Å resolution. We were exclusively interested in the sharp Na i absorption doublet at rest wavelengths of 8183.27 and 8194.81 Å (e.g. Rebassa-Mansergas et al. 2012b). Further details describing our reduction and analysis methods for the VLT data can be found in Schreiber et al. (2008).
We display in the bottom right-hand panel of Fig. 1 two epochs of the Na i doublet, separated by less than 2.0 h on 2014 May 27. The analysis of these radial velocities and a full table of the observing epochs and exposure times are detailed in Section 4.1.
Additionally, we sought to improve the white dwarf atmospheric parameters, and obtained higher signal-to-noise ratio (S/N) spectra using the Goodman spectrograph on the 4.1-m SOAR telescope (Clemens, Crain & Anderson 2004). These blue spectra, 4 × 420 s exposures taken consecutively on 2015 January 29, cover the higher order Balmer lines and range from roughly 3600–5300 Å with a dispersion of roughly 0.8 Å pixel−1 and 2.3 Å resolution. We used a 3-arcsec slit, and the seeing was just under 1 arcsec. Each exposure has an S/N ∼ 70 per resolution element in the continuum at 4600 Å.
For all of our follow-up spectroscopy, we processed the images using the starlink packages figaro and kappa. The spectra were optimally extracted (Horne 1986) using the pamela package (Marsh 1989), and wavelength calibrated using the many sky emission lines present. We subsequently flux calibrate and rebinned the spectra to a heliocentric frame using the molly package.1 We have estimated the spectral resolution from measurements of the full widths at half-maximum of arclamp and night-sky emission lines.
2.2 Space-based photometry
The Kepler spacecraft provides an unprecedented capability for acquiring uninterrupted times series of faint variable stars, and the photometry of J1136+0409 (EPIC 201730811, Kp = 17.2 mag) opens a new era in seismology of white dwarfs in binary systems. Our short-cadence exposures, observed every 58.8 s, span nearly 78 d, from 2014 June 4 03:02:00 ut to 2014 August 20 19:55:38 ut.
With only two functional reaction wheels, the pointing of the Kepler spacecraft must be corrected periodically (with checks every 6 h) by firing its thrusters. Thruster firings create significant discontinuities in the photometry and must be detrended. We extracted the light curve using a modified version of the kepsff code based on Vanderburg & Johnson (2014) within the pyke package maintained by the Kepler Guest Observer office. We have also applied an algorithm to select the pixel mask that looks at contiguous pixels above the background; our method is described in more detail in Hermes et al. (2014). A portion of the light curve is displayed in Fig. 2.
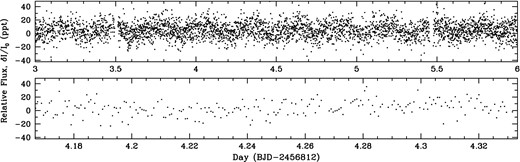
A portion of the raw K2 Field 1 light curve obtained for J1136+0409. This minute-cadence photometry has been extracted from the pixel-level K2 data and detrended to correct for attitude tweaks in the telescope pointing, and has been 4σ clipped. The top panel shows 3 d (less than 4 per cent of our full data set) and is dominated by variability at the orbital period of 6.9 h (see Section 4.2). The bottom panel shows a 4 h stretch. The white dwarf pulsations are not visible above the point-to-point scatter. 1 ppt = 0.1 per cent.
Because the star has variability with a period near to 6 h, the thruster-firing period, we have utilized an independent extraction of the data using the tools outlined in Armstrong et al. (2015) to detrend the light curve. However, the rms scatter of this extraction was slightly higher, so we do not adopt it for our full analysis.
We have removed all points with poor quality flags, as well as those affected by thruster firings, removing 32 265 points. We subsequently clipped all points falling more than 4 × 1.4826 times the median absolute deviation from the median of the light curve, removing 351 points, and ultimately leaving us with 91 144 exposures over 77.8724 d. We have also excluded a brightening event 95.1 min in duration beginning at 245 6844.36916 BJD(TDB); we have inspected the raw photometry using the k2flix package2 (Barentsen 2015) and shown that this brightening corresponds to a Solar system body passing through our target aperture. Pointing into the ecliptic, K2 encounters many asteroids as they pass through its field of view.
Our final K2 light curve has a duty cycle of 79.7 per cent and has a formal frequency resolution of 0.149 μHz. The point-to-point scatter is evident by eye in Fig. 2 (exposures have a mean uncertainty of 13.0 ppt), and unfortunately overwhelms the ability to detect the pulsations by eye. Given the long baseline, the median level in a 1000-μHz-wide empty region of the Fourier transform (FT) centred at 1500 μHz is roughly 0.064 ppt (64 ppm). We describe amplitudes in this paper in units of parts per thousand (ppt), where 1 ppt = 0.1 per cent relative amplitude.
3 ATMOSPHERIC PARAMETERS
From the original serendipitous SDSS spectrum of J1136+0409, Rebassa-Mansergas et al. (2012a) fitted the Balmer lines of Hβ–Hϵ following the method of Rebassa-Mansergas et al. (2007). They found for the white dwarf a Teff = 11 700 ± 150 K and log g = 7.99 ± 0.08.
We obtained higher S/N SOAR spectroscopy to refine the atmospheric parameters of the pulsating component of J1136+0409. White dwarf atmospheric parameters are most sensitive to the higher order Balmer lines, especially the surface gravity (e.g. Kepler et al. 2006), so we have used the blue-efficient Goodman spectrograph on the SOAR telescope (see Section 2.1).
We have fitted the six Balmer lines Hβ–H9 using the synthetic spectra computed by two independent groups. The first set of fits use the pure hydrogen atmosphere models and fitting procedure described in Gianninas, Bergeron & Ruiz (2011) and references therein, which employ the ML2/α = 0.8 prescription of the mixing-length theory (Tremblay et al. 2010). We have fitted each of the four individual SOAR spectra, and found the weighted mean of the atmospheric parameters to be Teff = 12 680 ± 150 K and log g = 7.97 ± 0.03. In addition, we have individually fit the same spectra using the pure hydrogen atmosphere models detailed in Koester (2010), which also employ ML2/α = 0.8. From these fits we find a weighted mean of the atmospheric parameters to be Teff = 12 310 ± 150 K and log g = 8.05 ± 0.03.
To accommodate the unknown systematic uncertainties, we have chosen to adopt the average of these two independent weighted mean fits, using the standard deviation of the two as the uncertainties: Teff = 12 490 ± 260 K and log g = 8.01 ± 0.06. These values represent the effective temperature and surface gravity from fits to models with a one-dimensional treatment of convection. The SDSS fits used ML2/α = 0.6, which explains the disagreement with our new determination.
Our adopted atmospheric parameters require a correction to account for the higher dimensional dependence of convection (Tremblay et al. 2013). Thus, our final best-fitting determinations are Teff = 12 330 ± 260 K and log g = 7.99 ± 0.06 which corresponds to an overall white dwarf mass of 0.601 ± 0.036 M⊙ and a radius of RWD = 0.013 R⊙ using the mass–radius relations of Fontaine, Brassard & Bergeron (2001).
By measuring the secondary contribution to the SDSS spectrum (see the top panel in Fig. 1), we estimate that the main-sequence component to J1136+0409 is of spectral type M6 ± 1V. Using the empirical mass–radius relation of Rebassa-Mansergas et al. (2007), we estimate Msec = 0.196 ± 0.085 M⊙ and Rsec = 0.195 ± 0.090 R⊙. From the flux-scaling factors of each component, we can estimate the overall distance to the system (e.g. Rebassa-Mansergas et al. 2012a). From the white dwarf we find dWD = 125 ± 7 pc, and from the M dwarf we find dsec = 121 ± 56 pc, in good agreement.
4 BINARY ANALYSIS
4.1 Secondary component radial velocities
We have computed the radial velocities for each epoch of VLT/FORS2 and SDSS data using the same techniques described in Schreiber et al. (2008) and Rebassa-Mansergas et al. (2008). In summary, we fit a double-Gaussian-line profile to the Na i absorption doublet, with rest wavelengths of 8183.27 and 8194.81 Å, to compute a radial velocity for each epoch. The results are detailed in Table 1. We then compute a periodogram of the velocities (Scargle 1982).
Journal of radial velocities from the Na i doublet.
| BJDTDB | Radial velocity | Notes |
|---|---|---|
| (km s−1) | ||
| 245 2642.987095 | 76.6 ± 56.1 | 900 s, SDSS subspec |
| 245 2642.974837 | 3.3 ± 18.0 | 900 s, SDSS subspec |
| 245 2642.999318 | 124.9 ± 26.5 | 900 s, SDSS subspec |
| 245 4925.691559 | −118.7 ± 5.5 | 900 s, VLT/FORS2 |
| 245 4937.564039 | −48.0 ± 5.7 | 900 s, VLT/FORS2 |
| 245 6735.731791 | −87.6 ± 11.0 | 570 s, VLT/FORS2 |
| 245 6745.595020 | −78.0 ± 11.6 | 570 s, VLT/FORS2 |
| 245 6803.578535 | −141.8 ± 7.7 | 570 s, VLT/FORS2 |
| 245 6803.600854 | −157.5 ± 8.6 | 570 s, VLT/FORS2 |
| 245 6804.511249 | −55.3 ± 7.0 | 570 s, VLT/FORS2 |
| 245 6804.565577 | 192.3 ± 6.1 | 570 s, VLT/FORS2 |
| 245 6804.573015 | 217.2 ± 6.3 | 570 s, VLT/FORS2 |
| 245 6804.580532 | 235.2 ± 6.4 | 570 s, VLT/FORS2 |
| 245 6804.588222 | 252.8 ± 6.3 | 570 s, VLT/FORS2 |
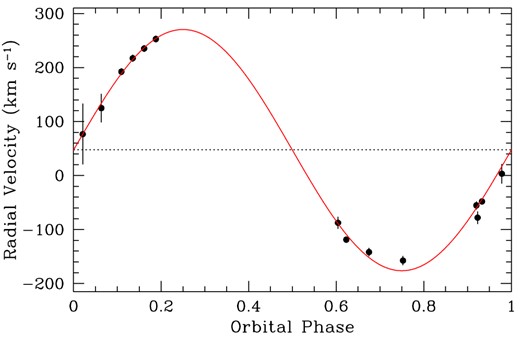
Radial velocity curve of the M dwarf companion in J1136+0409, calculated from the Na i doublet. This curve is folded on the orbital period of 6.8976010 h, and features a semi-amplitude of Ksec = 222.6 ± 3.8 km s−1.
We have assumed circular orbits, and the best-fitting solution bears this sinusoidal signature. We find that the mass function is f = 0.328 ± 0.017 M⊙. Adopting the spectroscopic masses for both components, we find that the stars are separated by asep = 1.70 ± 0.08 R⊙, and the volume-averaged secondary Roche lobe radius is roughly RLsec = 0.49 ± 0.09 R⊙ (Eggleton 1983). Thus, the M6 secondary should sit comfortably within its Roche lobe. The system is far from the onset of mass transfer and its evolution into a semidetached cataclysmic variable, which will occur in roughly 13 Gyr, when the system will have an orbital period of 1.7 h (Schreiber & Gänsicke 2003).
4.2 Binary light-curve model
The dominant feature of the light curve, visible by eye in Fig. 2, is the modulation near 6.9 h. Taking a FT of the entire K2 data set, we find a dominant peak at 6.89756 ± 0.00017 h. We recognize this immediately as a less precise determination of the orbital period.
We have phased the K2 photometry to the inferior conjunction defined from the radial velocities, and folded the light curve into 200 phase bins at the radial-velocity-determined orbital period. The result is displayed in Fig. 4. Both of our light-curve extraction routines described in Section 2.2 produce an identical folded light curve.
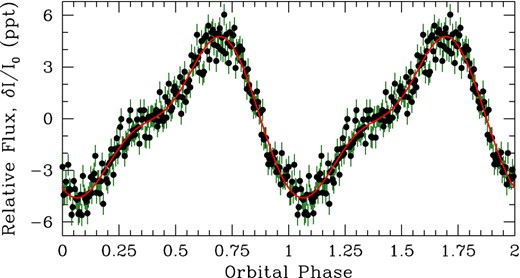
The light curve of our K2 observations of J1136+0409 folded at the radial-velocity-determined orbital period of 6.8976010 h and repeated for clarity. We can produce a sensible model, overplotted in red, of Doppler beaming and ellipsoidal variations of the M dwarf that well describes the orbital photometric variability.
The asymmetric profile of the K2 light curve can be interpreted as a combination of reprocessed light (reflection), Doppler beaming, and ellipsoidal variations of the secondary component of J1136+0409. To confirm this, we have computed models using the lcurve software package developed by Tom Marsh, which computes models for binary systems containing at least one white dwarf (see Copperwheat et al. 2010). Our best-fitting model is overplotted in red in Fig. 4.
To calculate this model, we performed an initial exploration of the parameter space using a Monte Carlo analysis, with initial guesses from the atmospheric parameters described in Section 3. This showed that the data are likely underconstrained, and that there are too many degeneracies to allow for convergence on a robust solution. We proceeded to fix essentially all parameters.
We fixed the white dwarf radius and effective temperature as well as the secondary radius to the atmospheric parameters determined in Section 3, and used the corresponding Claret four-parameter limb-darkening coefficients of Gianninas et al. (2013) and Claret & Bloemen (2011). We convolved the best-fitting atmospheric model spectra (shown in the top panel of Fig. 1) with the Kepler bandpass to estimate the Doppler beaming factors for each component (e.g. Bloemen et al. 2011); we found <B > WD = 2.34 and 〈B 〉 sec = 11.69. The beaming factor for the M dwarf is quite high, and reflects the sharp spectral features that can move in and out of the Kepler bandpass. We fixed the mass ratio at q = Msec/MWD = 0.326, and assumed KWD = qKsec.
Our best fit has an inclination of i = 83°, for which the white dwarf contributes 61.6 per cent of the flux in the Kepler light curve. Aside from inclination, we also fit for the secondary temperature (which best fit as 3030 K) and the fraction of the irradiating flux absorbed by the companion (0.632). The fit is reasonable, with a |$\chi ^2_{\rm red}=1.14$|.
The slight bump around phase 0.25 in the light curve corresponds to ellipsoidal variations of the M dwarf, which peak twice per orbit with roughly the same amplitude; the second maximum near phase 0.75 is enhanced due to Doppler beaming. Ellipsoidal variations are tidal distortions of the secondary and are sensitive to the mass ratio, inclination, and secondary radius (e.g. Morris & Naftilan 1993). Unfortunately, our models are underconstrained without more information about the component masses (especially the primary radial velocity) or system inclination. From a lack of eclipses in the light curve, we can only constrain the inclination of the system to i < 85°. If we take the component masses from Section 3 at face value, the inclination must fall between 61° < i < 85° given the mass function.
Doppler beaming imprints a modulation in the flux of a stellar binary as the source is approaching or receding, directly proportional to the radial velocity semi-amplitude of the source as well as the slope of its spectrum through the observed filter (Loeb & Gaudi 2003; Zucker, Mazeh & Alexander 2007). The dominant source of Doppler beaming in J1136+0409 is the secondary, hence the peak nearest phase 0.75. The peak occurs slightly before phase 0.75 due to a small amount of reprocessed flux (reflection) from the much hotter primary.
For now, we present our model as able to reproduce the data in hand, but do not yet consider it a robust, final solution. We have used our model to show that, with a fixed orbital period, the t0 from our raw, unfolded light curve is 245 4925.5145(11) BJD(TDB), and agrees within 1σ with the inferior conjunction defined from the spectroscopy in Section 4.1.
5 PULSATION ANALYSIS
A FT of the 77.87 d K2 Campaign 1 light curve of J1136+0409 is shown in Fig. 5. Table 2 details all of the significant periodicities detected in the light curve.
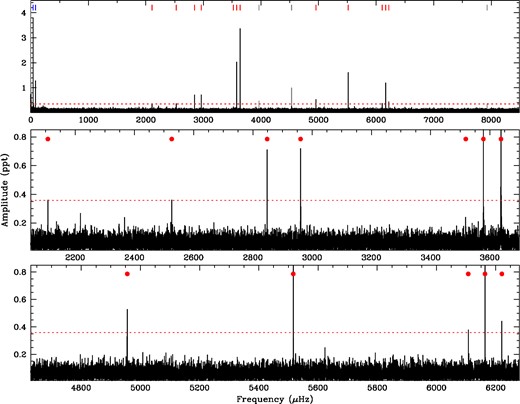
FTs of our K2 Campaign 1 observations of J1136+0409. The top panel shows the FT of the entire data set out to the Nyquist frequency. The middle and bottom panels show the independent pulsation modes in more detail, marked with red dots; the full frequency solution is presented in Table 2. The dashed red line marks the significance threshold, described in the text.
Significant frequencies in the K2 Field 1 photometry of SDSS J113655.17+040952.6.
| ID | Frequency | Period | Amplitude | Phase |
|---|---|---|---|---|
| (μHz) | (s) | (ppt) | (cycle) | |
| f1, + | 3638.2374 | 274.858366(88) | 3.493(50) | 0.1179(23) |
| f1, 0 | 3578.5472 | 279.44301(14) | 2.272(50) | 0.0547(35) |
| f2 | 5516.2411 | 181.282868(73) | 1.841(50) | 0.4957(43) |
| f3, 0 | 6164.0456 | 162.231117(89) | 1.213(50) | 0.1201(65) |
| f4, + | 2961.1013 | 337.71219(60) | 0.775(50) | 0.430(10) |
| f4, − | 2848.1735 | 351.10220(70) | 0.715(50) | 0.885(11) |
| f5 | 4955.8397 | 201.78215(32) | 0.519(50) | 0.756(15) |
| f3, + | 6220.7698 | 160.75181(24) | 0.448(50) | 0.641(18) |
| f6 | 2107.681 | 474.4551(23) | 0.398(50) | 0.145(20) |
| f3, − | 6107.362 | 163.73682(27) | 0.399(50) | 0.515(20) |
| f7 | 2525.804 | 395.9135(17) | 0.373(50) | 0.767(21) |
| f1, − | 3518.907 | 284.1791(14) | 0.240(50) | 0.259(33) |
| forb | 40.2719 | 24 831.21(62) | 4.063(50) | |
| 2forb | 80.5426 | 12 415.79(47) | 1.347(50) | |
| 8fLC | 4531.8157 | 220.66210(20) | 0.994(50) | |
| 7fLC | 3965.3057 | 252.18737(56) | 0.467(50) | |
| 11fLC | 7930.6581 | 126.09294(18) | 0.354(50) |
5.1 Preliminary mode identifications
The two significant peaks at lowest frequencies marked in blue in Fig. 5 fall at 40.2719 ± 0.0010 μHz and its first harmonic of 80.5426 ± 0.0030 μHz. These peaks correspond to the orbital frequency (forb) and its first harmonic. Our light-curve fits discussed in Section 4.2 reveal far more information about the binary parameters, so we will not discuss these signals further.
Short-cadence Kepler data are contaminated by spurious frequencies arising from harmonics of the long-cadence exposure length (fLC = 566.479 μHz). We detect three such artefacts with significance in our FT (7fLC, 8fLC, and 11fLC), and mark them in light grey in Fig. 5. We do not include these signals in our analysis.
The pulsations of the white dwarf in J1136+0409 are confined to a region between 162.2 and 474.5 s, with a weighted mean period of 263.3 s (Clemens 1993). Such relatively short pulsation periods are entirely consistent with the spectroscopically determined temperature of 12 330 K (see Mukadam et al. 2006); hot DAVs near the blue edge of the instability strip have shallower convection zones and thus drive shorter period pulsations than do their cooler counterparts (Goldreich & Wu 1999).
We have computed a significance threshold following the method outlined in Greiss et al. (2014). In short, we have randomly shuffled the fluxes for each point in the light curve, and computed the highest peak in the entire resultant FT for 10 000 random permutations. The 2σ and 3σ lines are defined by the lines for which 95.5 and 99.7 per cent of the highest overall amplitude recorded in each shuffled light curves fall below that threshold. They are 0.330 and 0.359 ppt, respectively. The threshold we adopt is conservative since the basis light curve includes significant signals, notably the orbital modulation. However, no questionable signals fall between our 2σ and 3σ lines, so we adopt the 99.7 per cent threshold (0.359 ppt) for simplicity.
We identify 16 signals in the FT above the significance threshold, which we describe in Table 2. The quoted period, amplitude, and phase uncertainties in Table 2 come from a simultaneous least-squares fit to the data using the software package period04 (Lenz & Breger 2005).
All signals cleanly pre-whiten from the light curve. The only frequency with a marginally significant residual occurs at 2961.585 μHz (with 0.341 ± 0.050 ppt amplitude). We have also pre-whitened the light curve by three very low frequencies, at 0.11842, 0.6624, and 0.8118 μHz, respectively. We do not believe these signals are astrophysical in nature, but are rather long-term trends that have not been perfectly removed in the light-curve extraction.
We note that since the white dwarf is contributing roughly 62 per cent of the flux in the Kepler bandpass, the pulsation amplitudes are all underestimated by a factor of roughly 1.61. The amplitudes have not been adjusted in Table 2, but this should be taken into account when comparing to pulsation amplitudes observed at other wavelengths.
In order to perform an asteroseismic analysis, we must know the spherical degree (ℓ) of the pulsation mode in question. We begin with the initial assumption that all modes are the two lowest degrees possible (ℓ = 1, 2) out of simplicity and because ℓ ≥ 3 modes suffer from significant geometric cancellation (Dziembowski 1977). Additionally, we note that three regions of the FT have signals separated in frequency by a similar amount, roughly 57 μHz. We assume that these are rotationally split multiplets (see Dolez & Vauclair 1981), and discuss these signals further in Section 5.3.
In Table 2 we have identified seven independent pulsation modes, three of which we identify as having more than one rotationally split component. We have tentatively identified the central (0), prograde (+), and retrograde (−) components of these three modes. In one case, f1, −, we have used the expectation that this may be a rotationally split component of a triplet to relax the significance threshold, and include this low-amplitude mode in our analysis.
All of the pulsation signals we have identified in Table 2 are extremely stable in both amplitude and phase. Such frequency stability is a feature of hotter DAVs, which show extremely stable pulsation modes (e.g. G117-B15A; Kepler et al. 2005). In fact, every mode in J1136+0409 shows exceptional amplitude and phase stability, such that if we break the K2 data into four ∼3-week subsets, a linear least-squares fit for all values is consistent within the statistical uncertainties.
5.2 Preliminary asteroseismic analysis
We have used the seven independent pulsation modes identified from the K2 Campaign 1 light curve as input for an initial asteroseismic analysis. Our asteroseismic analysis proceeded in the same way as described in more detail in Bischoff-Kim, Montgomery & Winget (2008).
In short, we matched the observed pulsation periods (Pobs) to theoretical periods (Pcalc) computed from adiabatically pulsating a grid of models derived from an updated version of the White Dwarf Evolution Code (Lamb & van Horn 1975). Our core composition profiles follow the smooth models of Salaris et al. (1997), and feature a sharp transition between the carbon and helium layer, where diffusive equilibrium is assumed for this transition and no diffusion coefficients are used.
The models had five variable parameters: effective temperature, overall white dwarf mass, the mass of the hydrogen envelope (MH), the central oxygen abundance relative to carbon (XO), and the location of the edge of the homogeneous carbon–oxygen core (Xfm). Our model grids were spaced in steps of 200 K, 0.005 M⊙, 0.10, 0.10, and 0.05 dex, respectively, with a range of 10 000–13 000 K, 0.55–0.80 M⊙, 10−4.0–10−6.0, 0.50–0.99 dex, and 0.1–0.8 dex, for a total of 1541 202 models. The mass of the helium envelope (MHe) was fixed at MHe/M* = 10−2.0.
The best-fitting asteroseismic solution is detailed in Table 3, with a σrms = 2.02 s. It arose from the following parameters: Teff= 12 000 K, MWD = 0.605 M⊙, MH/M* = 10−4.9, XO = 0.99, and Xfm = 0.70. The top 20 best fits all shared the same ℓ identifications, with 2.09 < σrms < 2.47 s: their means and standard deviations from an asteroseismic temperature (12 260 ± 270 K) and mass estimate (0.605 ± 0.014 M⊙). The other parameters were consistent within 0.1 dex of the best-fitting asteroseismic solution. The shaded contours in Fig. 6 show only solutions with σrms < 3.5 s, and represent just 0.2 per cent of all models.
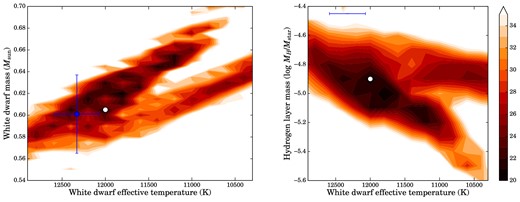
Contours showing the goodness of fit, σrms, from our asteroseismic analysis of J1136+0409. The scale runs linearly in tenths of seconds; darker regions correspond to a better fit. The best asteroseismic solution is marked as a white dot and the 1σ spectroscopically determined atmospheric parameters are marked in blue. This is a five-dimensional parameter space, so to make these two-dimensional projections the best-fitting values for the other parameters were optimized at each grid point.
Summary of the observed periods and the best-fitting asteroseismic model. We have fixed the ℓ marked by a ★ symbol.
| ID | Observed | Model | ℓ | k | Ck, ℓ |
|---|---|---|---|---|---|
| Pobs (s) | Pcalc (s) | ||||
| f1 | 279.44 | 280.78 | 1★ | 3 | 0.350 |
| f2 | 181.28 | 183.41 | 2 | 4 | 0.054 |
| f3 | 162.23 | 164.77 | 1★ | 1 | 0.490 |
| f4 | 344.28 | 345.15 | 1★ | 5 | 0.493 |
| f5 | 201.78 | 199.73 | 2 | 5 | 0.157 |
| f6 | 474.46 | 471.19 | 1 | 7 | 0.412 |
| f7 | 395.91 | 396.23 | 2 | 12 | 0.113 |
The best-fitting models consistently prefer a high oxygen–carbon ratio in the core, but expectations of this parameter are fairly unconstrained (see the discussion in Bischoff-Kim & Metcalfe 2011), and XO has a relatively small impact on DAV period spectra (see table 5 in Bischoff-Kim et al. 2008). The models of Althaus et al. (2010b) predict XO ∼ 0.7 for a 0.6 M⊙ white dwarf.
Given how precisely we were able to determine the pulsations periods with our K2 light curve (to an average of 0.00066 s), the best-fitting asteroseismic model has a rather large σrms of 2.02 s. This indicates that our best fit may not have fully converged on a final solution, or that the models inherently lack some physical details. However, we are encouraged by the good agreement between the atmospheric parameters (temperature and mass) determined by both asteroseismology and spectroscopy. Our preliminary asteroseismic analysis also improves our estimate of the white dwarf rotation period.
5.3 White dwarf rotation period
The symmetric frequency spacing of the f1, f3, and f4 modes, illustrated in Fig. 7, suggests that these are rotationally split multiplets of three independent pulsations modes. Since we see no evidence that these modes have five components, we assume that these are rotationally split triplets of three ℓ = 1 multiplets, each of a different radial overtone number (k).
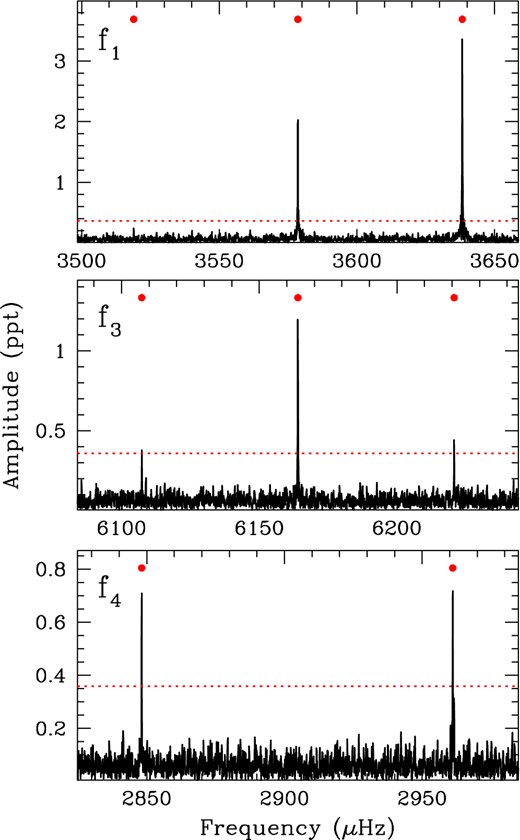
Detailed regions of the FT of J1136+0409 showing the three different rotationally split pulsation modes, all viewed with the same frequency scale. The triplets are split by roughly 57 μHz, which corresponds to a rotation period of roughly 2.49 h (see Section 5.3). Our interpretation suggests that the central (m = 0) component of f4 is not observed.
We find the frequency splitting for each of the three triplets: δf1 = 59.6890(29) μHz, δf3 = 56.7057(92) μHz, and δf4 = 56.464(11) μHz. For each triplet, we computed the spacing between the central component and the prograde or retrograde component, and we average these values weighted by their uncertainties. For f4 we have simply taken half the frequency difference between f4, − and f4, +. Using the Ck, ℓ of our best asteroseismic model, the observed frequency splittings correspond to rotation periods of 3.02, 2.50, and 2.49 h.
Given the excellent agreement for f3 and f4, we do not use the trapped mode f1 in our estimate of the overall rotation period but rather use it to constrain the uncertainties in our determination. We conclude that this white dwarf is rotating at 2.49 ± 0.53 h.
One troubling aspect of the three rotationally split triplets is the inconsistent relative amplitudes: the central component of f3 has the highest amplitude of the multiplet, whereas the central component of f4 is not detected. The central component of f1 has the second-highest amplitude, while the prograde component appears strongest. If the system is at high inclination, as we found in Section 4.2, geometric considerations predict the amplitude of m = ±1 are much larger than m = 0 for ℓ = 1 modes, and that m = ±2, 0 are favoured for ℓ = 2 modes (see Pesnell 1985). The expected amplitude ratios work for f4, but not the other two multiplets. We note that if the multiplets are all m = ±2, 0 components of ℓ = 2 modes rather than m = ±1, 0 components of ℓ = 1 modes, the splittings would correspond to a rotation period of 8.3 ± 1.8 h using the asymptotic relation for ℓ = 1, 2 modes.
Stochastically excited stars, such as solar-like oscillators, have equipartition of energy, such that the amplitudes of all components of a rotationally split multiplet are symmetric and predictable (Gizon & Solanki 2003). However, observationally, this does not appear to be the case for pulsating white dwarfs: different multiplets in the same star almost never have the expected relative amplitudes for a given inclination and the same intrinsic mode amplitudes. For example, the amplitudes of both the ℓ = 1 and the ℓ = 2 modes of one of the best-studied pulsating white dwarfs, PG 1159−035, show inconsistent relative amplitudes (Winget et al. 1991). Similarly, the amplitude ratios of another class of pulsating compact objects, hot subdwarfs, do not show consistent relative amplitudes for all ℓ = 1 modes of the same star (Pablo et al. 2012). Thus, the different relative amplitudes of the observed rotationally split multiplets in J1136+0409 is not problematic to our analysis.
We have searched the FT for a signal at the corresponding spin frequency, fspin = 111.6 μHz, but do not detect any peaks in this region above 0.2 ppt. We do not see a photometric signal of the white dwarf rotation period.
Finally, any slight asymmetry in what should be the even frequency splitting of a pulsation multiplet can constrain the presence of a weak magnetic field, which also acts to break spherical symmetry and cause subtle changes in the frequency spacing (Jones et al. 1989). We find that the two triplets with all three components, f1 and f3, are symmetric within the uncertainties except for the prograde component of f1, which is still symmetric within 2σ. Thus, we can only put an upper limit on the magnetic field strength. Following the method and the scaling factor detailed in Winget et al. (1994), the frequency splitting symmetry to better than 0.023 μHz roughly constrains the dipolar magnetic field of the white dwarf in J1136+0409 to <10 kG. Such a low global magnetic field may be consistent with the lack of a corresponding photometric signal of the white dwarf spin.
6 DISCUSSION
The pulsating component in J1136+0409 is the first carbon–oxygen core white dwarf known to pulsate and also have a close, detached companion (Pyrzas et al. 2015). The only other pulsating white dwarfs with close companions (which have also evolved through at least one and probably two common-envelope phases) are the extremely low-mass (MWD < 0.25 M⊙) white dwarfs showing pulsations (Hermes et al. 2012, 2013a,b; Kilic et al. 2015), as well as the no-longer-detached pulsating white dwarfs in cataclysmic variables (e.g. van Zyl et al. 2004).
As discussed in Section 5.2, the seven independent pulsation modes in J1136+0409 are exceptionally well determined, and provide the possibility for the first in-depth analysis of the interior structural effects of common-envelope evolution. Unfortunately, our asteroseismic analysis is hampered by the fact that there are nearly as many free parameters in our models as there are observed pulsation modes. We have shown that the 20 best-fitting asteroseismic models are in good agreement with the spectroscopically determined atmospheric parameters. However, the best fit is not excellent: it has a σrms = 2.02 s, which is significantly higher than the uncertainty for each pulsation mode (σ < 0.001 s).
For these preliminary asteroseismic fits, we have consistently found a hydrogen layer mass, which controls the rate at which the white dwarf cools, that is thinner than we expect for an isolated white dwarf. Our best fit finds this layer has a mass of MH/M* ≈ 10−4.9, thinner than the canonical value for DA white dwarfs, MH/M*= 10−4.0 (e.g. Althaus et al. 2005). The seismologically derived hydrogen layer mass is nearly an order of magnitude smaller than expected from shell burning in the evolutionary models, and could indicate that some of the hydrogen mass was stripped in the common-envelope phase. However, the fact that we have not considered thinner helium-layer masses and fixed that parameter at the maximal value of MHe/M* ≈ 10−2.0 may have an influence on the derived hydrogen-layer mass.
The only previous constraints on the hydrogen-layer mass of a PCEB have required comparing precision studies of deeply eclipsing systems to model-dependent mass–radius relationships. Such studies have shown that the white dwarfs in PCEBs contain both a relatively thick hydrogen-layer mass, MH/M* ≈ 10−4, as in the case of the 0.535 M⊙ NN Ser (Parsons et al. 2010), as well as a relatively thin hydrogen-layer mass, MH/M* ≈ 10−8, as in the case of the 0.439 M⊙ SDSS J1212−0123 (Parsons et al. 2012).
Pulsations also have the potential to further refine the binary parameters of this unique system. As mentioned in Section 5.1, the pulsations visible in J1136+0409 are notably stable, and a single frequency can well describe each peak in the FT. However, we know that the phases of the pulsations are periodically changing at the orbital period. This is a light-travel-time effect as the white dwarf moves around its centre of mass (e.g. Barlow et al. 2011).
Constraining this phase variation would allow us to directly measure KWD and provide a model-independent solution to the physical parameters. Given the mass estimates from Section 3, we expect the amplitude of this phase variation to be τ = 1.8 ± 0.7 s. However, the K2 light curve is simply too noisy to enable our directly measuring this quantity. We also attempted, unsuccessfully, to directly detect side lobes in the amplitude spectrum, manifest as splittings from the central components of our pulsations set apart by the orbital frequency. We expect the side lobes to have roughly 2 per cent the amplitude of the central component, which is simply buried in the noise of the FT (Shibahashi & Kurtz 2012). We can only set an upper limit of τ < 10 s on this phase variation from the K2 data.
Our radial velocity observations were carried out to exclusively cover the Na i absorption doublet at wavelengths longer than 7500 Å, so we have no spectroscopic information on the white dwarf radial velocities. Measuring the white dwarf radial velocity semi-amplitude directly from the Balmer lines should be possible, since in all likelihood KWD > 70 km s−1. This will fully solve the orbital parameters, yielding a precise estimate for the mass ratio, as well as a gravitational redshift for the white dwarf.
Despite our inability to use the oscillation phases to constrain the binary mass ratio, the exceptional stability of the pulsations can be monitored longer term to watch the orbital period evolution of the system. Roughly 90 per cent of detached, eclipsing PCEBs observed for more than 5 yr show significant changes in the mid-eclipse times inconsistent with secular evolution (for a list, see Zorotovic & Schreiber 2013). Some of these eclipse variations have been attributed to light-travel-time effects caused by circumbinary planets (e.g. Marsh et al. 2014). However, follow-up studies have been unable to directly detect these external companions and have been damaging to the circumbinary interpretation of eclipse timing variations (Hardy et al. 2015).
With follow-up photometry it will be possible to use the stable pulsations in J1136+0409 as a clock to monitor for external light-travel-time effects. Modulations in the pulse arrival times must come from light-travel-time effects, whereas mid-eclipse time variations can arise from orbital period variations caused by other means, such as Applegate's mechanism (Applegate 1992). To enable further monitoring, we have included in Table 2 the phase point for the time of maximum of each pulsation mode from the K2 observations. These phases align with the mid-point of the K2 light curve, 245 6851.5625920 BJD(TDB).
Our K2 observations of the white dwarf in J1136+0409 provide one of the most precise constraints on the rotation period of an object that has gone through common-envelope evolution and is still fully detached. The only other well-constrained rotation period of a PCEB has been determined for the eclipsing system V471 Tau, which has a 9.25-min spin period, although the K2V companion is nearly Roche lobe filling and may have previously transferred mass and angular momentum on to the white dwarf (see O'Brien, Bond & Sion 2001; Hussain et al. 2006).
In the context of other asteroseismically deduced rotation periods of white dwarfs, J1136+0409 is rotating more rapidly than any other known isolated white dwarf with clearly resolved pulsation multiplets (Kawaler 2004, 2014). The previous record-holder is the hot pre-white-dwarf PG 2131+066, which rotates with a period of 5.07 h; notably, it is also in a wide binary with a K7V companion, although the two are currently separated by at least 200 au and so did not undergo a common-envelope event (Kawaler et al. 1995; Reed, Kawaler & O'Brien 2000).
Over time, gravitational radiation and magnetic braking from the M dwarf will bring the two components of J1136+0409 closer together, and the system will likely become a cataclysmic variable. Interestingly, all non-magnetic white dwarfs in cataclysmic variables have rotation periods on the order of minutes or faster, much more rapid than observed for the white dwarf in J1136+0409 (e.g. Sion et al. 1994, 1995; Szkody et al. 2002). Over time, mass transfer in cataclysmic variables is expected to transport enough angular momentum to spin-up the white dwarf to near breakup velocities (e.g. King, Regev & Wynn 1991).
For now, the components of J1136+0409 are detached and still well separated, and the secondary fills roughly 40 ± 8 per cent of its Roche lobe. It is therefore very unlikely that episodes of stable mass transfer occurred in the past that could have considerably affected the current white dwarf rotation. Therefore, the measured rotation period (2.49 ± 0.53 h) and the upper limit on the magnetic field (<10 kG) put interesting constraints on angular momentum transport in evolved stars. Notably, angular momentum transport in giants is still an open problem in astrophysics (Cantiello et al. 2014). First constraints on the problem of core spin-up and envelope coupling in red giants are being explored using seismic data on first-ascent giants from the original Kepler mission (Beck et al. 2012; Mosser et al. 2012).
If isolated white dwarf rotation periods reflect some sort of coupling with the red giant envelope, then the relatively fast rotation of the white dwarf in J1136+0409 could have resulted from truncated red giant evolution via common-envelope ejection. Additionally, the relatively low magnetic field strength of the white dwarf in J1136+0409 may have precluded the development of magnetic torques to slow the white dwarf rotation after the common-envelope event (Suijs et al. 2008).
Finally, we have shown that the white dwarf rotation period is not synchronized with the orbital period of roughly 6.9 h. Similar results from three hot subdwarfs with M dwarf companions in the original Kepler mission showed a similar lack of synchronization, although those subdwarfs rotate much slower than the orbital period (Pablo, Kawaler & Green 2011; Pablo et al. 2012). Finding more such systems help constrain theoretical models for time-scales of tidal synchronization.
7 SUMMARY AND CONCLUSIONS
We have used extensive ground-based spectroscopy and space-based photometry to constrain the physical parameters of the first known pulsating white dwarf that underwent a single common-envelope event, J1136+0409. We summarize these values in Table 4.
Summary of system parameters determined for J1136+0409. Parameters were derived from (1) VLT/FORS2 spectroscopy, (2) SOAR/Goodman spectroscopy, (3) SDSS spectroscopy, and (4) K2 Campaign 1 light curve.
| Parameter | Value | Source |
|---|---|---|
| Orbital period, Porb | 6.89760103(60) h | (1) |
| WD temperature (spectroscopy) | 12 330(260) K | (2) |
| WD temperature (seismology) | 12 260(270) K | (4) |
| WD log g | 7.99(06) cgs | (2) |
| WD mass (spectroscopy) | 0.601(13) M⊙ | (2) |
| WD mass (seismology) | 0.605(14) M⊙ | (4) |
| WD radius (seismology) | 0.013 R⊙ | (4) |
| Secondary spectral type | M6 ± 1V | (3) |
| Secondary radius | 0.195(90) R⊙ | (3) |
| Secondary mass | 0.196(85) M⊙ | (3) |
| WD distance | 125(07) pc | (3) |
| Secondary distance | 121(56) pc | (3) |
| Secondary radial velocity, Ksec | 222.6(3.8) km s−1 | (1) |
| Orbital separation, asep | 1.70(08) R⊙ | (1), (2), (3) |
| Secondary Roche lobe | 0.49(09) R⊙ | (1), (2), (3) |
| WD rotation period | 2.49(53) h | (4) |
| WD magnetic field | <10 kG | (4) |
| WD hydrogen layer mass | MH/M* ≈ 10−4.9 | (4) |
Both our time series spectroscopy and photometry vary at 6.89760103 h, which we determine is the orbital period of this evolved binary. Our photometry from the extended Kepler mission shows orbital variability that can be well reproduced with a model of Doppler beaming, reflection, and ellipsoidal variations of the M6V main-sequence companion. We have matched the seven observed independent pulsation modes to theoretical evolution models, and find reasonable agreement between the spectroscopically determined white dwarf temperature and mass. Asteroseismology also allows us to peer into the interior of the white dwarf and constrain its hydrogen layer mass to MH/M* ≈ 10−4.9, although we only consider this a preliminary asteroseismic investigation and urge caution in overinterpreting this result.
Notably, the observed splittings of the pulsations demonstrate that the white dwarf in this close binary is rotating at a period of 2.49 ± 0.53 h, more rapidly than the orbital period. These splittings are symmetric within the uncertainties, which sets an upper limit on the dipole magnetic field of the white dwarf to <10 kG. Both values are extremely useful inputs for further modelling of the previous common-envelope event that shaped the present binary configuration of J1136+0409, as well as angular momentum transport in stars that have likely underwent truncated red giant evolution.
We thank the anonymous referee whose thorough comments significantly improved this paper. We wish to acknowledge fruitful discussions with Jim Fuller, Danny Steeghs, and Roberto Raddi. JJH, BTG, and PC acknowledge funding from the European Research Council under the European Union Seventh Framework Programme (FP/2007-2013)/ERC Grant Agreement no. 320964 (WDTracer). JTF acknowledges support from the NSF under award AST-1413001. MHM and DEW gratefully acknowledge the support of the NSF under grant AST-1312983. MHM acknowledges the support of NASA under grant NNX12AC96G. TRM was supported under a grant from the UK Science and Technology Facilities Council (STFC), ST/L000733/1. AG acknowledges support provided by NASA through grant number HST-GO-13319.01 from the Space Telescope Science Institute, which is operated by AURA, Inc., under NASA contract NAS 5-26555. MRS acknowledges support from FONDECYT (grant 1141269) and from the Millennium Nucleus RC130007 (Chilean Ministry of Economy). AR-M acknowledges financial support from the Postdoctoral Science Foundation of China (grants 2013M530470 and 2014T70010) and from the Research Fund for International Young Scientists by the National Natural Science Foundation of China (grant 11350110496).
This work is based on observations collected at the European Organisation for Astronomical Research in the Southern Hemisphere, Chile (083.D-0862, 093.D-0300), the SOAR telescope, and the Kepler spacecraft (GO1015). The SOAR telescope is a joint project of the Ministério da Ciência, Tecnologia, e Inovação (MCTI) da República Federativa do Brasil, the US National Optical Astronomy Observatory (NOAO), the University of North Carolina at Chapel Hill (UNC), and Michigan State University (MSU). Funding for the Kepler mission is provided by the NASA Science Mission Directorate.
Facilities: Kepler, K2, VLT, SOAR, SDSS.
