


Abstract
We present a suite of cosmological radiation-hydrodynamical simulations of the assembly of galaxies driving the reionization of the intergalactic medium (IGM) at z ≳ 6. The simulations account for the hydrodynamical feedback from photoionization heating and the explosion of massive stars as supernovae (SNe). Our reference simulation, which was carried out in a box of size 25 h−1 comovingMpc using 2 × 5123 particles, produces a reasonable reionization history and matches the observed UV luminosity function of galaxies. Simulations with different box sizes and resolutions are used to investigate numerical convergence, and simulations in which either SNe or photoionization heating or both are turned off, are used to investigate the role of feedback from star formation. Ionizing radiation is treated using accurate radiative transfer at the high spatially adaptive resolution at which the hydrodynamics is carried out. SN feedback strongly reduces the star formation rates (SFRs) over nearly the full mass range of simulated galaxies and is required to yield SFRs in agreement with observations. Photoheating helps to suppress star formation in low-mass galaxies, but its impact on the cosmic SFR is small. Because the effect of photoheating is masked by the strong SN feedback, it does not imprint a signature on the UV galaxy luminosity function, although we note that our resolution is insufficient to model star-forming minihaloes cooling through molecular hydrogen transitions. Photoheating does provide a strong positive feedback on reionization because it smooths density fluctuations in the IGM, which lowers the IGM recombination rate substantially. Our simulations demonstrate a tight non-linear coupling of galaxy formation and reionization, motivating the need for the accurate and simultaneous inclusion of photoheating and SN feedback in models of the early Universe.
1 INTRODUCTION
The first sources of ionizing radiation in our universe transformed the cold and neutral cosmic gas that was present shortly after the big bang into the hot and ionized plasma that we observe in the intergalactic medium (IGM) today. Research into this transformation, which took place in the first billion years, during the Epoch of Reionization, is crucial for understanding the formation and evolution of galaxies, including our own galaxy, the Milky Way (for reviews see e.g. Barkana & Loeb 2001; Morales & Wyithe 2010; Ricotti 2010; Bromm & Yoshida 2011; Zaroubi 2013; Natarajan & Yoshida 2014). A number of new telescopes are currently being developed or are already underway to unravel the astrophysics of these early times, including the Low Frequency Array (LOFAR; e.g. Zaroubi et al. 2012), the Murchison Widefield Array (MWA; e.g. Lidz et al. 2008), the Square Kilometre Array (SKA; e.g. Mellema et al. 2013), the James Webb Space Telescope (JWST; e.g. Zackrisson et al. 2011), and many others (e.g. Fan, Carilli & Keating 2006b; Furlanetto, Oh & Briggs 2006b; Pritchard & Loeb 2012). These investments at the observational frontier have spurred the construction of models of the early Universe to guide the design of observational campaigns and to help interpret the observations once the data arrive.
Most of the current models are built on the observationally supported notion that reionization is driven mainly by star-forming galaxies (e.g. Choudhury & Ferrara 2007; Loeb 2009; Volonteri & Gnedin 2009; Robertson et al. 2010; Raičević, Theuns & Lacey 2011; Fontanot, Cristiani & Vanzella 2012). A natural implication of these models is a strong coupling between reionization and galaxy formation caused by ionizing radiative feedback (e.g. Ciardi & Ferrara 2005). Photoionization heating by star-forming galaxies typically raises the temperature in the reionized gas to a few times 104 K. The associated increase in gas pressure increases the Jeans scale, i.e. the scale below which pressure prevents the collapse of gas into gravitationally bound objects (e.g. Gnedin 2000b). This boils gas out of low-mass dark matter (DM) haloes and impedes the accretion of gas from the IGM on to them (e.g. Rees 1986; Shapiro, Giroux & Babul 1994; Barkana & Loeb 1999; Gnedin 2000b; Dijkstra et al. 2004; Finlator, Davé & Özel 2011; Petkova & Springel 2011; Noh & McQuinn 2014). Photoheating therefore leads to a reduction in the fuel from which stars form, which lowers the star formation rates (SFRs) and the ionizing emissivities of low-mass galaxies. This makes it more difficult for galaxies to reionize the IGM and, therefore, photoheating provides a negative feedback on reionization.
Photoheating also provides a positive feedback on reionization. The increase in the gas pressure and Jeans mass smooths density fluctuations in the IGM. This decreases the gas clumping factor, |$C_{\rm IGM} \equiv \langle n_{\rm H}^2 \rangle / \bar{n}_{\rm H}^2$|, where the angular brackets indicate the average in the IGM, and |$\bar{n}_{\rm H}$| is the cosmic mean hydrogen density (e.g. Wise & Abel 2005; Pawlik, Schaye & van Scherpenzeel 2009; Finlator et al. 2012; Shull et al. 2012; So et al. 2014). Because the rate at which the IGM recombines is proportional to the gas clumping factor (e.g. Madau, Haardt & Rees 1999), photoheating decreases the IGM recombination rate. Fewer ionizing photons are then needed to keep the gas ionized, which facilitates reionization (e.g. Pawlik et al. 2009; Finlator et al. 2012; Shull et al. 2012; Sobacchi & Mesinger 2014). This positive feedback from photoheating will be especially strong if X-ray sources preheat the gas before it is reionized (e.g. Madau et al. 2004; Ricotti, Ostriker & Gnedin 2005; Haiman 2011; Jeon et al. 2014a; Knevitt et al. 2014; Xu et al. 2014).
The feedback from photoheating may be accompanied by feedback from the explosion of stars as supernovae (SNe; e.g. Dekel & Silk 1986; Wyithe & Loeb 2013). SNe are thought to suppress star formation in low-mass galaxies by expelling gas in winds, which makes it more difficult for galaxies to reionize the IGM. However, the ejection of gas may open additional low-density channels through which ionizing photons may escape the ISM more easily, thus making it easier for galaxies to reionize the IGM (e.g. Yajima et al. 2009; Wise & Cen 2009; Paardekooper et al. 2011; Kimm & Cen 2014). The suppression of star formation by SNe may be amplified in a non-linear manner by the feedback from photoheating (Pawlik & Schaye 2009; Finlator et al. 2011; Hopkins et al. 2014). Locally, SNe may also increase the rates at which stars form as interstellar gas is compressed to star-forming densities in colliding SN shocks (e.g. Geen, Slyz & Devriendt 2013). The wide range of possibilities by which star formation may feed back on the formation of structure and the reionization of the IGM makes modelling reionization a challenging task.
Cosmological simulations are generally considered to be among the most powerful techniques to investigate the impact of stellar feedback on reionization and galaxy formation (e.g. Trac & Gnedin 2011; Finlator 2012), but are also computationally highly demanding. A principal computational challenge is the required large dynamic range. The characteristic size of individual ionized regions is of the order of 10 comoving Mpc (cMpc; e.g. Furlanetto, McQuinn & Hernquist 2006a). The redshift at which these regions percolate to reionize the Universe shows spatial fluctuations due to the modulation of galaxy formation by structure formation modes on still larger scales, of the order of 100 h−1 cMpc (e.g. Barkana & Loeb 2004; Iliev et al. 2014). The concurrent need to resolve the Jeans mass in the IGM as well as the population of atomically cooling galaxies with masses above ∼108 M⊙, the prime candidates for driving reionization, extends the spectrum of relevant scales down to a few kpc, and less (e.g. Gnedin & Fan 2006; Bolton & Becker 2009).
A second computational challenge is the large expense of the radiative transfer (RT) of ionizing photons. A straightforward and accurate treatment of the RT consists of tracing photons from each ionizing source along straight rays, one source at a time (for an overview of RT methods see e.g. Iliev et al. 2006a; Iliev et al. 2009; Trac & Gnedin 2011). The computational cost of such approaches therefore increases linearly with the number of ionizing sources. This renders simulations of cosmological volumes that contain large numbers of sources computationally demanding. The issue becomes particular severe if the ionizing radiation from recombining ions needs to be treated accurately (e.g. Maselli, Ferrara & Ciardi 2003; Hasegawa & Umemura 2010; Raičević et al. 2014). The high cost of ray-based RT methods has triggered the development of moment-based RT methods that are computationally less expensive, but also less accurate (e.g. Gnedin & Abel 2001; Finlator et al. 2009; Aubert & Teyssier 2008; Norman et al. 2015; Rosdahl et al. 2013).
To simplify the problem, cosmological hydrodynamical simulations of galaxy formation often assume the gas to be in ionization equilibrium with a spatially uniform ionizing background (e.g. Miralda-Escudé, Haehnelt & Rees 2000; Pawlik et al. 2009; Duffy et al. 2014). Such simulations enable the investigation of the response of the gas in galaxies and the IGM to heating by ionizing photons at relatively low computational cost, but must assume the redshift at which the ionizing background is instantaneously turned on. The main drawbacks of such simulations are that they do not yield insights in the timing and morphology of reionization, and that fluctuations in the intensity due to local sources (e.g. Gnedin 2010; Yajima, Choi & Nagamine 2012; Rahmati et al. 2013b) and the ability of the gas to throw shadows and self-shield (e.g. Abel, Wise & Bryan 2007; Rahmati et al. 2013a; Altay et al. 2013) are ignored. Sometimes, self-shielding is approximately accounted for by setting the intensity of the ionizing background to zero at densities above which the gas is expected to be neutral in the absence of local sources (e.g. Nagamine, Choi & Yajima 2010; Paardekooper, Khochfar & Dalla Vecchia 2013; Vogelsberger et al. 2013).
Other simulations focus on the accurate treatment of the RT of ionizing photons at the expense of a detailed treatment of the feedback from radiative heating (e.g. Nakamoto, Umemura & Susa 2001; Razoumov et al. 2002; Ciardi, Stoehr & White 2003; Iliev et al. 2006b; McQuinn et al. 2007; Finlator et al. 2009; Aubert & Teyssier 2010; Baek, Ferrara & Semelin 2012). In this type of simulations, the computational complexity is reduced by computing the RT and the evolution of structure separately, ignoring the impact of photoionization heating on the dynamics and distribution of the gas. Often, to simplify the problem further, the dynamics of the gas is ignored altogether and assumed to trace that of the DM (e.g. Iliev et al. 2006b). A semi-analytical model then specifies the location of the galaxies and the rates at which these galaxies form stars. Sometimes, the semi-analytical model is calibrated to approximately account for the radiation-hydrodynamical response to photoheating (e.g. Ciardi et al. 2006; Iliev et al. 2007).
The most direct but also computationally most expensive way to investigate the coupling of reionization and galaxy formation is to carry out three-dimensional cosmological radiation-hydrodynamical simulations. Several of these simulations now exist, including the pioneering works by Gnedin & Ostriker (1997) and Gnedin (2000a). However, even after more than a decade of intense research, the field is still in its infancy. Radiation-hydrodynamical simulations have only very recently begun to approach the cosmological scales and the high resolution needed to capture the relevant physics (Norman et al. 2015; Gnedin 2014; Kimm & Cen 2014).
Most earlier radiation-hydrodynamical simulations of reionization were restricted to relatively small volumes that are less representative of the cosmological mean (e.g. Gnedin 2000b; Ricotti, Gnedin & Shull 2008; Finlator et al. 2011; Petkova & Springel 2011; Hasegawa & Semelin 2013). Only some simulations afforded ray-based RT methods that ensure the accurate propagation of ionization fronts in inhomogeneous density fields (Hasegawa & Semelin 2013). The majority of simulations employed the computationally less expensive but also numerically diffusive moment-based RT methods (e.g. Gnedin 2000a; Finlator et al. 2011; Petkova & Springel 2011; Norman et al. 2015; So et al. 2014). In some cases, the computational expense needed to be reduced further by lowering the spatial resolution at which the RT is carried out, thus requiring a sub-resolution model for the propagation and consumption of photons at hydrodynamically resolved scales (Finlator et al. 2011).
In this work, we present radiation-hydrodynamical simulations of reionization in cosmological volumes at high spatially adaptive resolution, implementing accurate RT using the traphic code (Pawlik & Schaye 2008). traphic solves the time-dependent RT equation by tracing photon packets at the speed of light and in a photon-conserving manner through the simulation box. traphic thus enables an accurate treatment of shadows and self-shielding. The photon packets are transported directly on the spatially adaptive, unstructured grid defined by the SPH particles, thus exploiting the full dynamic range of the hydrodynamic simulation. The large number of ionizing sources typical of these simulations does not pose a problem because traphic employs a photon packet merging technique that renders the computational cost of the RT independent of the number of sources. traphic is implemented in the galaxy formation code gadget (last described in Springel 2005), and this enables us to account for the radiation-hydrodynamical feedback from star formation and reionization.
We focus our investigations on the roles of radiative heating (which we also refer to as photoheating) and SNe in shaping the SFR and reionization history in the physically motivated and observationally supported models of the early Universe that our simulations provide. It is currently not feasible to provide an ab initio description of the internal structure of galaxies in cosmological volumes, even in substantially less expensive simulations in which the detailed transfer of ionizing photons is ignored (e.g. Trac & Gnedin 2011; Scannapieco et al. 2012; Schaye et al. 2015). Simulations like ours therefore rely on sub-resolution models of the interstellar medium (ISM). This introduces free parameters that require careful calibration, e.g. using zoomed simulations that achieve a higher resolution by focusing on a smaller computational volume, or observations. The two main parameters relevant to simulations of galaxy formation during reionization are the fraction fSN of the energy released in SNe and other unresolved stellar evolution processes that is available to heat the ISM, and the fraction |$f_{\rm esc}^{\rm subres}$| of the ionizing photons that escapes the unresolved ISM and are available to reionize the gas.
This paper is organized as follows. In Section 2 we describe our numerical techniques and the set of simulations we have carried out. In Section 3 we describe our results. We start in Section 3.1 with an overview of the simulations and a comparison with observational constraints. This is continued in Section 3.2 and extended by an analysis of the impact of stellar feedback on galaxy formation and reionization. In Section 4 we discuss the sensitivity of our results to variations in physical parameters as well as some of the main limitations inherent to our numerical approach. In Section 5, we conclude with a brief summary. Lengths are expressed in physical units, unless noted otherwise.
2 SIMULATIONS
2.1 Gravity and hydrodynamics
We use a modified version of the N-body/TreePM Smoothed Particle Hydrodynamics (SPH) code gadget (Springel 2005; our specific version is derived from that discussed in Schaye et al. 2010) to perform a suite of cosmological radiation-hydrodynamical simulations of galaxy formation down to redshift z = 6 (see Table 1).
The simulations are initialized at redshift z = 127. Initial particle positions and velocities are obtained by applying the Zeldovich approximation (Zeldovich 1970) to particles arranged along a uniform grid of glass-like structure (White 1996). We use a transfer function for matter perturbations generated with CAMB (Lewis & Bridle 2002) and apply it to describe perturbations in both the DM and the gaseous components. We adopt the Λcold dark matter cosmological model with parameters Ωm = 0.265, Ωb = 0.0448 and ΩΛ = 0.735, ns = 0.963, σ8 = 0.801, and h = 0.71 (Komatsu et al. 2011). These parameters are consistent with the most recent constraints from observations of the Cosmic Microwave Background by the Planck satellite (Planck Collaboration XVI 2014; Planck Collaboration XIII 2015).
We apply a comoving Plummer-equivalent gravitational softening length, ϵsoft, equal to 1/25 of the mean DM particle separation to both DM and baryonic particles, i.e. |$\epsilon _{\rm soft} \approx 1.95\, h^{-1}\ \mbox{ckpc}\ (L/25.0\, h^{-1}\ \mbox{cMpc})\ (N_{\rm DM}^{1/3}/512)^{-1}$|, where NDM is the number of DM particles. SPH quantities are estimated by averaging inside a sphere containing Nngb = 48 neighbouring gas particles and adopting the entropy conserving formulation of SPH (Springel & Hernquist 2002). The SPH kernel, i.e. the radius of this sphere, is prevented from falling below 10−2ϵsoft.
2.2 Chemistry and cooling
While our simulations account for the thermal feedback from the explosion of massive stars as core-collapse SNe (see Section 2.6), for simplicity, we do not follow the ejection and transport of metals. We therefore follow the non-equilibrium chemistry and radiative cooling of the gas, assuming that the gas is of primordial composition. Molecule formation is assumed to be suppressed by the Lyman–Werner background expected to pervade the Universe soon after the formation of the first stars (e.g. Haiman, Rees & Loeb 1997; Ricotti, Gnedin & Shull 2001; Wise & Abel 2005; Greif & Bromm 2006; Ahn et al. 2009), a process not resolved in our simulations. Our simulations thus ignore that molecular hydrogen may form in self-shielded regions (e.g. Wolcott-Green, Haiman & Bryan 2011).
We consider all relevant atomic radiative cooling processes, using the rate coefficients in Pawlik & Schaye (2011): cooling by collisional ionization, collisional excitation of atomic lines, the emission of free–free and recombination radiation, and Compton cooling by the CMB. The species fractions and the gas temperature are advanced in time using the explicit subcycling time integration scheme presented in Pawlik & Schaye (2011). Once stars form and emit radiation, the chemical and thermal evolution of the gas is also affected by photoionization and photoheating, and by the injection of energy by SNe, as we describe below.
Solving for the chemistry and cooling of the gas is by far the most expensive operation in our simulations. To speed up the calculations and unless otherwise noted, we set X = 1, i.e. we neglect helium. In Section 4.1, we will describe a preliminary comparison with a simulation in which we follow the radiative heating and cooling by helium assuming X = 0.75.
Our simulations do not have sufficient resolution and do not capture the physics required to describe the multiple phases of the dense gas in galaxies that are expected to develop above densities nH ∼ 10−2–10−1 cm−3 (e.g. Schaye 2004) as observed in the local Universe. We therefore employ a subgrid model to describe the thermodynamics of the dense gas, imposing a pressure floor |$P\propto \rho ^{\gamma _{\rm {eff}}}$| on gas with densities |$n_{\rm {H}} > n_{\rm {H}}^{\rm c}$|, where |$n_{\rm {H}}^{\rm c} \equiv 0.1 \ \mbox{cm}^{-3}$|, normalized to P/k = 103 cm−3 K at the critical density |$n_{\rm {H}}^{\rm c}$|. We use γeff = 4/3 for which both the Jeans mass and the ratio of the Jeans length and the SPH kernel of gas at the pressure floor are independent of the density, thus preventing spurious fragmentation due to a lack of numerical resolution (Bate & Burkert 1997; Schaye & Dalla Vecchia 2008). Note that, unlike in simulations that impose a polytropic equation of state, in our simulations, gas with densities above the critical density can have pressure above the pressure floor. Our implementation follows Schaye & Dalla Vecchia (2008) and Dalla Vecchia & Schaye (2012), to which we refer the reader for further details. In our simulations adopting a hydrogen mass fraction X = 1, we use a critical density higher than |$n_{\rm {H}}^{\rm c}$| by a factor of 1/0.75 to facilitate comparisons with simulations in which X = 0.75.
2.3 Star formation
We set |$n_{\rm H}^\star = n_{\rm H}^{\rm c}$| and use T⋆ ≡ max (105 K, 100.5Tfloor), where Tfloor is the density-dependent temperature implied by the pressure floor below which particles are prevented from cooling. Moreover, to avoid numerical artefacts at high redshifts when the cosmological mean gas density is high, we require a minimum overdensity of 57.7 for gas to be allowed to form stars.
The star formation law is interpreted stochastically, and the probability that a star-forming gas particle is turned into a star particle in a time interval Δt is given by min (Δt/τ⋆, 1), where |$\tau _\star \equiv \Sigma _{\rm gas}/ \dot{\Sigma }_\star$| is the gas consumption time. Gas particles are converted to star particles assuming a conversion efficiency of 100 per cent, i.e. the masses of the star particles are identical to those of the gas particles from which they are formed. At higher resolution, star formation and the associated feedback may be more extended in time and in space. This may affect the impact of star formation on the gas and therefore alter, e.g., the resolved escape fraction of ionizing photons.
2.4 Ionizing luminosities
We interpret the star particles as simple stellar populations, i.e. coeval stellar clusters that are characterized by an initial mass function (IMF), metallicity, and age.
We compute the time-dependent hydrogen ionizing luminosities of these star formation bursts using the population synthesis models of Schaerer (2003). Since Schaerer (2003) does not tabulate ionizing luminosities for the Chabrier IMF, which is the IMF used by our star formation recipe, we adopt the ionizing luminosities of the Schaerer (2003) models with Salpeter IMF in the range 1–100 M⊙ and metallicity Z = 0.02 = Z⊙. This yields ionizing luminosities close to those of stellar populations drawn from a Chabrier IMF in the range 0.1–100 M⊙ with subsolar metallicity Z = 10−3 = 0.05 Z⊙ and is consistent with the IMF used in our star formation recipe and appropriate for stellar populations at z ≳ 6. (e.g. Maio et al. 2010; Jeon et al. 2014b; Wise et al. 2014).
We multiply the luminosities of each star particle by the sub-resolution escape fraction |$f_{\rm esc}^{\rm subres}$| to model the removal of photons due to absorption in the unresolved ISM. Some previous works that carried out RT simulations of reionization have calibrated the ISM escape fraction to yield reionization histories in agreement with current observational constraints (e.g. Aubert & Teyssier 2010; Ciardi et al. 2012; Finlator et al. 2012). However, as we will discuss below, the interpretation of these constraints is subject to substantial systematic uncertainties and limited by our incomplete understanding of the physical processes at play. We therefore prefer to set |$f_{\rm esc}^{\rm subres} = 1$|, and use our simulations to explore the dependence of the reionization history on box size and resolution. In Section 4.1, we will briefly discuss the impact of variations away from |$f_{\rm esc}^{\rm subres} = 1$| on our results.
2.5 Ionizing radiative transfer
We use the RT code traphic (Pawlik & Schaye 2008, 2011) to transport ionizing photons. traphic solves the time-dependent RT equation in SPH simulations by tracing photon packets emitted by source particles through the simulation box in a photon-conserving manner. The photon packets are transported directly on the spatially adaptive set of SPH particles and hence the RT exploits the full dynamic range of the hydrodynamical simulations. A directed transport of the photon packets radially away from the sources is accomplished despite the irregular distribution of SPH particles by guiding the photon packets inside cones. A photon packet merging technique renders the computational cost of the RT independent of the number of radiation sources. In the following, we provide a brief overview of traphic in order to motivate the meaning of the numerical parameters of the RT specified below. The reader is referred to the descriptions in Pawlik & Schaye (2008), Pawlik & Schaye (2011) and Pawlik, Milosavljević & Bromm (2013) for further discussion.
2.5.1 Method
The transport of radiation starts with the emission of photon packets by star particles in NEC tessellating emission cones. The photons in each photon packet are shared among the |$\tilde{N}_{\rm ngb} \lesssim N_{\rm ngb}$| neighbouring SPH particles residing in the cones. In cones containing zero neighbours, an additional, so-called virtual particle is inserted to which the photon packet is assigned. Star particles emit photons using emission time-steps Δtem, in between which the orientation of the cones is randomly changed to increase the sampling of the volume with photons. The spectrum of the emitted radiation is discretized using Nν frequency bins, and each photon packet carries photons from one of these bins. Therefore, the number of photon packets emitted per emission time-step is Nν × NEC.
The newly emitted photons are assigned a propagation direction parallel to the central axis of the associated emission cone, and, together with any other photon in the simulation box, are then propagated to the downstream neighbours of the SPH particle at which they reside. A particle is a downstream neighbour if it is among the |$\tilde{N}_{\rm ngb}$| neighbouring gas particles and resides in the regular transmission cone centred on the propagation direction and subtending a solid angle of 4π/NTC. The parameter NTC defines the angular resolution of the RT. If there is no downstream neighbour inside a transmission cone, a virtual particle is created to which the photons are then propagated. The transmission cones confine the propagation of photons to the solid angle in which they were originally emitted. The transport of photons occurs at the user-specified speed |$\tilde{c}$| and is discretized using RT time-steps Δtr.
A given SPH particle may receive several photon packets within the same RT time-step Δtr. These photon packets are collected according to their propagation directions using a set of NRC tessellating reception cones. Photon packets whose propagation directions fall in the same reception cone are merged and replaced by a single new photon packet. Each reception cone subtends a solid angle 4π/NRC. Hence, the parameter NRC determines the angular resolution of the merging. In the absence of virtual particles, the merging strictly limits the maximum number of photon packets in the simulation box to NRC × Nν × NSPH, where NSPH is the number of SPH particles, and renders the computation time independent of the number of sources. Note that the angular resolution at which photon packets are merged may be chosen independently of the angular resolution at which photon packets are transferred.
2.5.2 Numerical parameters
In the simulations presented in this work, we set |$\tilde{N}_{\rm ngb} = 32$|, and choose an angular resolution of the transport of NTC = 8 and of the merging of NRC = 8. Sources emit photons into NEC = 8 directions using emission time-steps Δtem = min (10−1 Myr, Δtr). Photons are transported at a speed |$\tilde{c} = c$|, where c is the speed of light, using time-steps of size Δtr = min (10−1 Myr, Δthydro), where Δthydro is the smallest gadget particle time-step. We use a single frequency bin with bounding energies located at [13.6, ∞] eV. We use the fits to the frequency-dependent photoionization cross-sections by Verner et al. (1996) and adopt a blackbody spectral shape of temperature Tbb = 5 × 10⁴ K, consistent with the parameters of the adopted population synthesis models, to compute the grey photoionization and photoheating rate associated with that bin. This gives |$\langle \sigma _{\rm H\,\small {I}} \rangle = 2.93\times 10^{-18}\ \mbox{cm}^{-2}$| and |$\langle \varepsilon _{\rm H\,\small {I}} \rangle = 3.65 \ \mbox{eV}$|. The RT assumes periodic boundary conditions, i.e. photons leaving the box through any given face are reinserted at the periodically opposing face. The dependence of the RT on the parameters has been discussed in Pawlik & Schaye (2008) and Pawlik & Schaye (2011), to which we refer the reader. Additional tests can be found in the appendices of Pawlik et al. (2013) and Rahmati et al. (2013a). For simplicity, we treat recombination radiation in the on-the-spot approximation, i.e. we compute recombination rates using Case B (e.g. Raičević et al. 2014; Tanaka et al. 2014).
2.6 Energy injection by core-collapse supernovae
The feedback from the explosion of stars as core-collapse SNe is modelled as an injection of thermal energy into the ISM surrounding the star particles.2 Our numerical implementation, which has been designed to control spurious radiative energy losses due to the limited numerical resolution, is described in Dalla Vecchia & Schaye (2012). Core-collapse SNe inject thermal energy after a delay of 30 Myr after the birth of the star particle, approximately corresponding to the maximum lifetime of stars that end their lives as core-collapse SNe. For each core-collapse SN that occurs, fSN × 1051 erg of thermal energy is injected. The energy is distributed stochastically to an average subset of 1.34 of the 48 neighbouring SPH particles, instantaneously increasing their gas temperature by ΔT = 107.5 K and assuming a mean atomic weight μ = 0.6 appropriate for fully ionized gas. We set fSN = 1, which results in a good agreement of the star formation history in our reference simulation and observational constraints at z > 6 (see Fig. 4).
2.7 Identification of galaxies
We post-process our simulations to extract haloes using the friends-of-friends (FOF) halo finder, with linking length equal to 1/5th of the mean DM inter-particle distance, built into the substructure finder Subfind (Springel et al. 2001; Dolag et al. 2009). For each FOF halo, we use Subfind to identify the particle for which the gravitational potential is minimum, and let its location mark the halo centre. We obtain the virial radius as the radius of the sphere centred on the halo centre within which the average matter density equals 200 times the redshift-dependent critical density of the universe. The total mass inside this sphere is the virial mass of the halo. The total SFR of the halo is the sum of the SFRs of the gas particles it contains. We will also compute the baryon fraction of the halo, which is the ratio of the total mass in gas and stars inside the virial radius and the virial mass.
3 RESULTS
In Section 3.1 we provide an overview of the simulations listed in Table 1. Thereafter, in Section 3.2, we discuss how stellar feedback from SNe and photoheating impact the formation and evolution of galaxies and the reionization of the gas. We will make use of additional simulations identical to those in Table 1, except that we have turned off SNe and/or photoheating to help isolate the impact of the feedback these processes provide. Most observational works on UV galaxies assume a Salpeter IMF to infer SFRs, while our simulations assume a Chabrier IMF. Where necessary, we have divided observationally inferred SFRs by a factor of 1.7 to account for the difference between the two IMFs (see Section 2.3). Note that the high-resolution (high-res) simulation L12N512 has been stopped at z = 6.8 due to its large computational expense.
Simulation parameters: simulation name; comoving size of the simulation box, Lbox; number of DM particles, NDM; mass of DM particles, mDM; mass of gas particles, mgas; comoving gravitational softening scale, ϵsoft; purpose. The number of SPH particles initially equals NDM (it decreases during the simulation due to star formation). All simulations are carried out down to redshift z = 6, except for simulation L12N512, which was stopped at z = 6.8 because of the large computational expense.
| Simulation | Lbox | |$N_{\rm DM}^{1/3}$| | mDM | mgas | ϵsoft | Purpose |
|---|---|---|---|---|---|---|
| (h−1 cMpc) | (M⊙) | (M⊙) | (h−1 ckpc) | |||
| L25N512 | 25.0 | 512 | 1.00 × 10⁷ | 2.04 × 10⁶ | 1.95 | Reference |
| L12N256 | 12.5 | 256 | 1.00 × 10⁷ | 2.04 × 10⁶ | 1.95 | Small box |
| L12N512 | 12.5 | 512 | 1.25 × 10⁶ | 2.55 × 10⁵ | 0.98 | High resolution |
| L50N512 | 50.0 | 512 | 8.02 × 10⁷ | 1.63 × 10⁷ | 3.91 | Large box |
| L25N256 | 25.0 | 256 | 8.02 × 10⁷ | 1.63 × 10⁷ | 3.91 | Low resolution |
3.1 Overview of simulations
Fig. 1 shows images of the gas densities, temperatures and neutral and ionized hydrogen fractions in our reference simulation L25N512 at z ≈ 9. By this redshift, reionization has already proceeded significantly, and individual reionized regions are just about to percolate the simulation box.
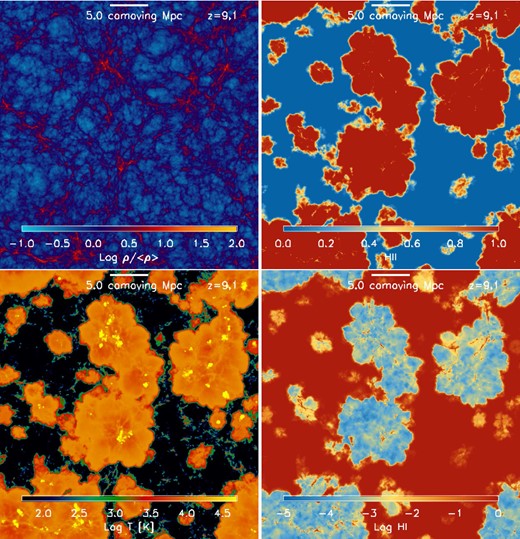
Images of the gas overdensity, the ionized fraction, the temperature, and the neutral fraction (left to right, top to bottom) in the reference simulation L25N512 at z ≈ 9. Each image is an average in a central slice of linear extent 25 h−1 cMpc and thickness 2.5 h−1 cMpc cut perpendicularly to one of the axes of the simulation box. Reionization is already well underway (the volume-averaged ionized fraction is |$x^{\rm v}_{\rm H\,\small {II}} \approx 0.4$|) and has-heated the gas in ionized regions to temperatures ∼2 × 10⁴ K. The gas near galaxies may reach temperatures up to ∼107 K as it is heated by SNe and structure formation shocks. Our spatially adaptive RT simulations reveal a network of self-shielded neutral clumps and filaments inside the ionized regions.
Most of the gas inside the ionized regions is photoheated to about ∼2 × 10⁴ K, the characteristic temperature of stellar H ii regions. Near galaxies, gas may be heated to much higher temperatures in gas-dynamical shocks that accompany the accretion of gas in massive haloes and the explosion of stars as SNe. Some of the gas in the ionized regions is sufficiently dense to shield from the ionizing radiation and remains neutral. The high resolution enabled by our spatially adaptive RT technique is key to tracking this gas phase. For comparison, a RT simulation on a uniform grid with a number of grid cells equal to the number of SPH particles employed here would have limited our ability to resolve the structure of the ionized gas to scales above ≳70 kpc comoving. This is larger than the typical scale of self-shielded (Lyman-limit) systems that are thought to be among the main consumers of ionizing photons (e.g. Schaye 2001; Furlanetto & Oh 2005; Gnedin & Fan 2006). Matching our spatially adaptive resolution using a uniform grid would require 512 × 25 = 12800 grid points per dimension, which is beyond current computational capabilities.
Fig. 2 compares a set of basic observables extracted from our simulations with current observational constraints. The SFR density of currently observationally accessible galaxies with SFRs ≥0.3 M⊙ yr−1 (assuming a Chabrier IMF; see Fig. 4) is insensitive to changes in box size and resolution and in good agreement with observations. The comparison with the total SFR density suggests that current observations uncover only a fraction of stars forming at z ≳ 6.
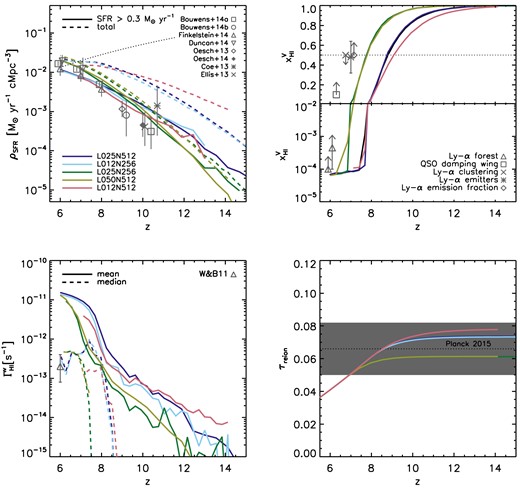
Effect of box size and resolution on the star formation and reionization histories. Curves of different colours correspond to different simulations as indicated in the legend. Top left: comoving SFR density. Dashed and solid curves show the total SFR density and the SFR density including only the contribution from galaxies with SFRs greater than 0.3 M⊙ yr−1, the current detection limit (assuming a Chabrier IMF, corresponding to a limiting UV magnitude MAB ≳ −17, see Fig. 4). The dotted curve shows the critical SFR (equation 6), assuming CIGM/fesc = 25. Observational data are taken from Bouwens et al. (2014, 2015), Finkelstein et al. (2014), Duncan et al. (2014, their SED models), Oesch et al. (2013, 2014), Coe et al. (2013), and Ellis et al. (2013, revised down by a factor of 2 following Oesch et al. 2013), as indicated in the legend, and divided by 1.7 if necessary to convert from the Salpeter IMF to the Chabrier IMF used here. When necessary, we have corrected the published SFR densities upwards to account for contribution from galaxies down to the current detection threshold, following Bouwens et al. (2015). Top right: volume-weighted mean neutral hydrogen fraction. The horizontal dotted line marks a neutral fraction |$x_{\rm H\,\small {I}}^{\rm v} = 0.5$| to guide the eye. The (model-dependent) constraints on the neutral fraction are taken from Schroeder, Mesinger & Haiman (2013, QSO damping wings), Ouchi et al. (2010, Lyα clustering), Ota et al. (2008, Lyα emitters), Dijkstra, Mesinger & Wyithe (2011, Lyα emission fraction) and Fan et al. (2006a, Lyα forest), following the discussion of Fig. 5 in Robertson et al. (2013). Bottom left: mean (solid) and median (dashed) volume-weighted hydrogen photoionization rate. The triangle with error bars marks the observational constraint from Wyithe & Bolton (2011). Bottom right: electron scattering optical depth towards reionization. The horizontal dotted line shows the latest estimate from observations by the Planck satellite, and the grey band indicates the associated 1-sigma error interval.
There is a significant dependence of the total SFR on resolution. Because density fluctuations are increased at higher resolution, the reference simulation L25N512 yields initially a higher total SFR than the low-resolution (low-res) simulation L25N256, and a lower total SFR than the high-res simulation L12N512. On the other hand, near the final simulation redshift at z = 6, the total SFR is slightly smaller in the reference simulation than in the low-res simulation, and slightly larger than in the high-res simulation. This inversion in the dependence on resolution is caused by the stronger suppression of star formation by stellar feedback at higher resolution.
The top right panel of Fig. 2 shows that the reionization history, i.e. the evolution of the neutral hydrogen fraction, is insensitive to the size of the simulation box L ≳ 12.5 h−1 Mpc. This rapid convergence may partly result from our use of identical amplitudes and phases that characterize the initial Gaussian random density fluctuations from which our simulations start. Indeed, a larger variance in the reionization histories on these scales is seen by comparing correspondingly sized sub-volumes of larger-scale simulations (Iliev et al. 2006b; Gnedin 2014; Iliev et al. 2014). However, this variance is caused primarily by the large range of environments sampled by the subvolumes, each of which may have a different mean density (Iliev et al. 2014). The top right panel of Fig. 2 shows further that there is a significant dependence of the reionization history on resolution. At higher resolution, reionization ends at higher redshifts. This mostly reflects the increased SFRs at increased resolution that our simulations show during the early and middle phases of reionization.
In our simulations, reionization completes at higher redshifts than suggested by constraints on the neutral fraction from observations of Lyman α emitting galaxies and high-redshift quasars (e.g. fig. 5 in Robertson et al. 2013). However, interpretations of these observations are dominated by large systematic uncertainties (for a discussion see e.g. Jensen et al. 2013; Robertson et al. 2013; Dijkstra 2014; Mesinger et al. 2015; Taylor & Lidz 2014). At z = 6, the simulated mean neutral fractions are in reasonable agreement with observational constraints from the Lyman α forest (Fan et al. 2006a), which are thought to be relatively robust (e.g. Fan et al. 2006a; but see e.g. McGreer, Mesinger & Fan 2011; Becker et al. 2015; Gnedin 2014). Nevertheless, it is important to keep in mind that our simulations may underestimate the duration and overestimate the redshift of reionization because the limited size of the simulated volume may bias the reionization histories (e.g. Gnedin 2014; Iliev et al. 2014), and because of our choice of a large sub-resolution escape fraction |$f_{\rm esc}^{\rm subres} = 1.0$|.
In this case, the simulated star-forming galaxies can keep the gas at z ≲ 7 ionized provided fesc ≳ 0.3. Whether such a relatively large escape fraction is physically plausible is a matter of active research (see e.g. the recent overview in Benson, Venkatesan & Shull 2013). Computing the escape fraction from our simulations would require additional RT computations beyond the current work. Observations currently probe SFRs ≳ 0.3 M⊙ yr−1 (assuming a Chabrier IMF; e.g. Bouwens et al. 2015, Finkelstein et al. 2014; Duncan et al. 2014; Fig. 4). Under the above assumptions, at z = 6, the observed population of galaxies alone is capable of keeping the Universe ionized, lending support to scenarios in which reionization is driven by star-forming galaxies (e.g. Pawlik et al. 2009; Finkelstein et al. 2012; Cai et al. 2014).
The simulations predict a strong increase in the volume-averaged mean and median hydrogen photoionization rates as the simulation volumes are reionized (bottom left panel of Fig. 2). This signals a rapid build-up of an ionizing background, which sets the equilibrium neutral hydrogen abundance in the reionized IGM (e.g. Gnedin 2000a; Aubert & Teyssier 2010). The median photoionization rate is in good agreement with constraints at z = 6 from observations of, e.g., the Lyman α forest (Bolton & Haehnelt 2007) and quasar near-zones (e.g. Wyithe & Bolton 2011). However, the mean photoionization rate exceeds the median by more than an order of magnitude. The excess in the mean photoionization rate with respect to the observational constraints is similar to that seen in previous simulations of reionization (e.g. Aubert & Teyssier 2010; Finlator et al. 2011).
The optical depth towards reionization, |$\tau _{\rm reion} = \int ^{z_{\rm start}}_{z = 0} n_{\rm e} c\, \mathrm{d}t$|, where ne is the number density of free electrons and zstart ≳ 30 is the redshift at which reionization begins, is an important integral constraint on the reionization history (e.g. Alvarez et al. 2006; Shull & Venkatesan 2008; Ahn et al. 2012). For the computation of the optical depth, we assume a hydrogen mass fraction X = 0.75, and that the fraction of ionized hydrogen is equal to that in our simulations, which assume X = 1. Furthermore, we make the standard assumptions that hydrogen is fully ionized at z < 6, that helium is neutral (singly ionized) whenever hydrogen is neutral (ionized) at z ≥ 3, and that helium is doubly ionized at z < 3 (e.g. Iliev, Scannapieco & Shapiro 2005).
The bottom right panel of Fig. 2 shows that our simulations yield optical depths consistent with the most recent constraints derived from observations of the cosmic microwave background, τreion = 0.066 ± 0.016 (Planck Collaboration XIII 2015). Our simulations lack the resolution and the physics to follow the formation of stars in minihaloes, i.e. haloes with virial temperatures below 104 K. Ionization by these stars is expected to increase the optical depth by ≲0.03 (e.g. Shull & Venkatesan 2008; Ahn et al. 2012; Wise et al. 2014). If these stars evolve into accreting black holes, the optical depth may be further increased due to the pre-ionization of the IGM by X-rays (e.g. Ricotti & Ostriker 2004a). If the additional contribution to ionization from minihaloes and X-ray sources is indeed that high, and if we were to add this contribution to our estimates of the optical depth, then this would yield values in slight excess of the Planck observational estimates. However, consistency with observations may still be achieved by lowering the ISM escape fraction of ionizing photons, which is a free parameter in our simulations. In this case, reionization in our simulations would occur later and yield a lower optical depth (see Fig. 9).
Current cosmological simulations of reionization often have difficulties in simultaneously matching observational constraints on the neutral fraction, the photoionization rate and the optical depth (e.g. Aubert & Teyssier 2010; Finlator et al. 2011). Fig. 2 shows that our simulations are no exception. Many works have argued that these difficulties may signal a significant role by physical processes that are currently not understood or unknown, and that are currently only poorly modelled or lacking altogether in cosmological simulations. Such processes include, among others, an evolving IGM escape fraction (e.g. Alvarez, Finlator & Trenti 2012; Kuhlen & Faucher-Giguère 2012; Ferrara & Loeb 2013; Mitra, Ferrara & Choudhury 2013) and the absorption of photons by Lyman-limit systems (e.g. Bolton & Haehnelt 2013; Mesinger et al. 2015; which our reference simulation begins to resolve). Some works have successfully matched the observational constraints by a careful calibration of parameters (e.g. Ciardi et al. 2012). In Section 4.1 we confirm that calibrating the ISM escape fraction of ionizing photons helps to improve the match with observational constraints. However, it is also important to acknowledge that current observational constraints on the neutral fraction at z ≳ 6.0 are highly model-dependent and too weak to single out reionization scenarios (e.g. Dijkstra 2014; Gnedin 2014). Investigating these issues is beyond the aims of the current work. Here we will focus on how feedback from photoheating and SNe impacts the formation of galaxies and the reionization of the IGM in physically motivated scenarios of reionization.
3.2 Stellar feedback
In this section we investigate how stellar ionizing radiation and SNe impact the formation and evolution of galaxies and the reionization of the IGM. We will compare the simulations listed in Table 1, which include both photoheating and SNe, with simulations in which photoheating and SNe are disabled but which are otherwise identical. We use the suffix noFB to distinguish the latter simulations from the former. We further compare with simulations that include SNe but not photoheating, distinguished by the suffix noPH, and with simulations which include photoheating but not SNe, distinguished by the suffix noSN. We focus on our reference simulation L25N512 to illustrate the physics at play, and we assess the impact of box size and resolution on our conclusions.
3.2.1 Impact on the cosmic SFR history
Fig. 3 quantifies the impact of stellar feedback on the evolution of the total cosmic SFR density in comparisons of our reference simulation L25N512 with simulations that differ only in the inclusion of the stellar feedback processes. The comparison with simulation L25N512-noFB, in which both photoionization heating and SNe were turned off, reveals the strong suppression of star formation by stellar feedback. The comparison with simulations L25N512-noPH, in which only photoheating is turned off, and L25N512-noSN, in which only SNe are turned off, shows that the suppression of the SFR due to SNe is much stronger than the suppression of the SFR due to photoheating.
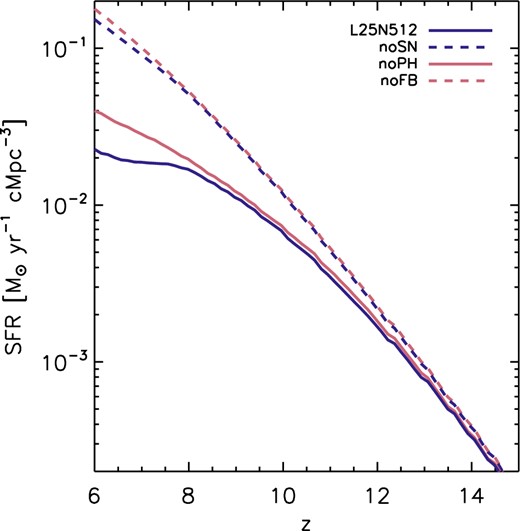
Effect of stellar feedback on the SFR history in the reference simulation L25N512. Shown are SFR densities in the simulations without feedback (noFB; red dashed), with only SN feedback (noPH; red solid), with only photoheating (noSN; blue dashed), and with both SN feedback and photoheating (L25N512; blue solid). SNe strongly reduce the cosmic SFR. On the other hand, photoheating has a comparatively small impact on the cosmic SFR, and this impact is nearly negligible in the absence of SNe.
SNe have a significant impact already at early times, z ≲ 10, long before the IGM in the simulation is substantially ionized. On the other hand, the impact of photoheating becomes noticeable only at z ≲ 8, when the average ionized fraction approaches unity. The belated impact of photoheating on the SFR suggests a stronger role of suppression of star formation due to the illumination of galaxies by the ionizing background than due to the exposure to local ionizing radiation from stars inside the galaxies. However, the impact of photoheating on the cosmic SFR remains comparatively small also after reionization.
Fig. 3 also shows that photoheating suppresses star formation more strongly in the simulation with SNe than in the one without SNe (compare the difference between the two solid curves with the difference between the two dashed curves). On the other hand, SNe suppress star formation more strongly in the simulation with photoheating than in that without (compare the difference between the two blue curves with the difference between the two red curves). Photoheating and SNe thus amplify each other in suppressing the formation of stars. These results are in good agreement with our earlier work in Pawlik & Schaye (2009), in which we first reported this effect in simulations in which the gas was in photoionization equilibrium with a uniform ionizing background instantaneously turned on at z = 9, and in which SN feedback was implemented by kicking gas particles in winds (see also Finlator et al. 2011; Hambrick et al. 2011; Hopkins et al. 2014).
3.2.2 Impact on the UV luminosity function
Another important observable of galaxy formation is the UV luminosity function, i.e. the volume density of galaxies per unit logarithmic UV luminosity. It quantifies the contributions to the cosmic SFR density from galaxies with different SFRs, and therefore helps us to understand the processes that shape the cosmic SFR density discussed above. Fig. 4 shows the UV luminosity function at z ≈ 6–9 in our reference simulation L25N512. We converted SFRs and UV luminosities using SFR/(M⊙ yr−1) = 0.6 × 1.25 × 10−28LUV/( erg s−1 Hz−1) (e.g. Kennicutt 1998; Bouwens et al. 2015), which yields the SFR function (e.g. Smit et al. 2012). The factor 0.6 converts the original relation, which is based on a Salpeter IMF, to a relation assuming the Chabrier IMF used here (see Section 2.3). Luminosities are related to AB magnitudes using −2.5 log10[LUV/(4π102 pc2)] − 48.6. Our reference simulation L25N512 yields a SFR function in good agreement with the observations above the limiting SFR of ≳0.3 M⊙ yr−1 (assuming a Chabrier IMF) currently probed by observations. Small difference exists at z ≳ 9, where observational estimates are characterized by large uncertainties, and at z ≲ 7, especially at SFRs ≳ 2 × 10 M⊙ yr−1, where dust corrections may be significant.
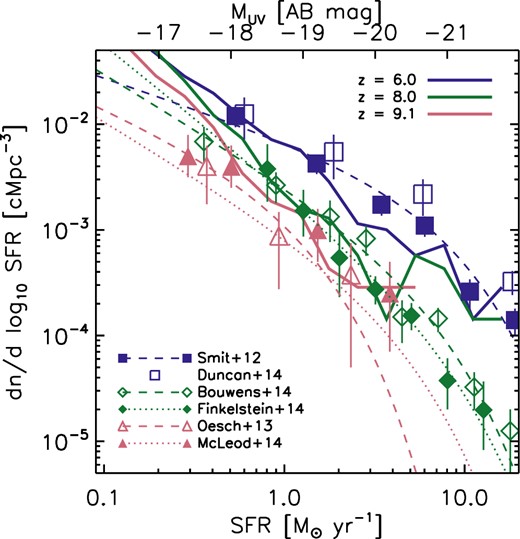
Evolution of the UV luminosity function in the reference simulation L25N512 between z = 6 and 9 (solid curves). Symbols show observational constraints from Smit et al. (2012) at z = 6 (filled squares, corrected for dust) and Duncan et al. (2014, open squares, corrected for dust), from Bouwens et al. (2015, open diamonds) and Finkelstein et al. (2014, filled diamonds) at z = 8 and from Oesch et al. (2013, open triangles) and McLeod et al. (2014, filled triangles, their estimate assuming density evolution) at z ≈ 9. The comparison at z ≈ 7 is included in Fig. 5 for clarity. We have omitted any upper limits reported in these works. Dashed and dotted curves are the corresponding Schechter fits, as indicated in the legend. The simulated UV luminosity function is in good agreement with the observational constraints across the entire range of redshifts.
In the left-hand panel of Fig. 5 we investigate how feedback impacts the UV luminosity function, where we focus for simplicity on a single characteristic redshift z ≈ 7. The comparison of the reference simulation with simulation L25N512-noFB, in which both photoheating and SNe are turned off, shows that suppression of star formation by stellar feedback is a critical element of simulations that attempt to match the observed SFR function. In our reference simulation, reionization heating and SNe suppress star formation at nearly complementary scales. The SFR function in simulation L25N512-noSN, in which only SNe are turned off and which serves to demonstrate the isolated impact of photoheating, approaches that in simulation L25N512-noFB at SFRs ≳ 0.2 M⊙ yr−1. On the other hand, the SFR function in simulation L25N512-noPH, in which only photoheating is turned off and which serves to demonstrate the isolated impact of SNe, approaches that in simulation L25N512-noFB at SFRs ≲ 0.05 M⊙ yr−1.
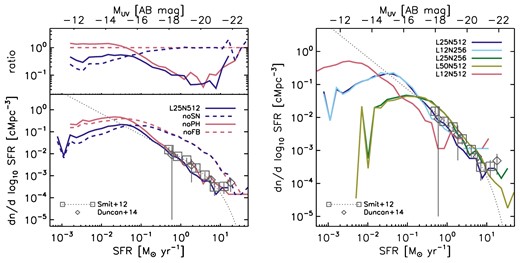
Comparison of simulated and observed SFR functions at z ≈ 7. Squares show the observed dust-corrected SFR function from Smit et al. (2012), which is based on the dust-uncorrected SFR functions from Bouwens et al. (2011). We have divided the observed data, which assumes a Salpeter IMF, by 1.7 to enable comparisons with our simulations, which assume a Chabrier IMF. The grey dotted curve shows the corresponding Schechter fit. Diamonds show the observed dust-corrected SFR function from Duncan et al. (2014, their SED models). Left: effect of stellar feedback in the reference simulation L25N512. The top panel shows the ratio of the SFR functions in the bottom panel and the SFR function in the absence of stellar feedback extracted from simulation L25N512-noFB. Feedback from SNe is critical to matching the observed SFR function. The inefficiency of SNe in suppressing star formation at low SFRs is primarily a numerical artefact of the limited resolution. Photoheating affects the SFR function at SFRs ≲ 0.2 M⊙ yr−1, but this is largely masked by the impact of SNe, which is strong at SFRs ≳ 0.05 M⊙ yr−1. Photoheating thus does not imprint a noticeable characteristic scale in the UV luminosity function. Right: dependence on box size and resolution. At higher resolution, the explosion of massive stars as SNe suppresses star formation more strongly, although the effect is relatively small and therefore all curves are close to each other and to observational estimates. The turnover in the SFR functions at low SFRs is primarily a result of the limited resolution and the lack of low-temperature gas physics.
The inefficiency of photoheating at high SFRs is expected if SFRs correlate positively with halo mass, as is the case in our simulations (Fig. 6), since reionization affects mostly the gas in low-mass haloes (e.g. Barkana & Loeb 1999; Dijkstra et al. 2004; Okamoto, Gao & Theuns 2008). However, the decreased efficiency of SN feedback at low SFRs is likely a numerical artefact of the limited resolution. Indeed, we show in Appendix A that in galaxies with low SFRs, star formation is more strongly suppressed by SNe at higher resolution. Note that our simulations also likely underestimate the local impact of photoheating by stars, especially in the lowest-mass star-forming galaxies (Rahmati et al. 2013b), thus likely raising the relative importance of photoionization by the cosmological background.
![Median SFRs (top) and median baryonic mass fractions fbar (bottom) of galaxies of virial masses Mvir and associated circular velocities vc ≡ (GMvir/rvir)1/2 = 17(M/108 M⊙)1/3[(1 + z)/10]1/2 km s−1 (e.g. equation 3.11 in Loeb 2010). In each row, the left-hand panel shows the impact of stellar feedback in the reference simulation L25N512 at a typical redshift z ≈ 7 and the right-hand panel shows the dependence on redshift in that simulation. In the right-hand panels, to isolate the impact of photoheating, we include results from simulation L25N512-noSN, in which SN feedback was turned off (dashed curves). In the top right panel, we have divided the SFRs by the virial masses of the haloes hosting the galaxies to improve the clarity of the presentation. The dashed vertical lines mark the masses of haloes with virial temperatures Tvir = 104 K. The dotted vertical lines mark the mass of 100 DM particles. The dotted diagonal line in the top right panel marks a SFR of 0.3 M⊙ yr−1, which is the limiting SFR accessible in current observations (assuming a Chabrier IMF; see Fig. 4). The dashed horizontal lines in the bottom row panels mark the cosmic baryon fraction Ωb/(Ωb + ΩDM). The strong suppression of star formation by photoheating and by the explosion of stars as SNe is accompanied by a strong reduction in the baryon fraction. The dependence on resolution is discussed in Fig. A1.](https://oup.silverchair-cdn.com/oup/backfile/Content_public/Journal/mnras/451/2/10.1093/mnras/stv976/3/m_stv976fig6.jpeg?Expires=1750216528&Signature=VadmBibUXbO9SsbyrGax3IsNxvk8~jEhBXxC-kOJyFVNjvt6XXy9KGwipk49hvNDJfEECOWxViyp6zp13jnYtAPxr8BxADsq5FFDaHReNECg2-XyKRZiGBGqCHfXVNIB3HCJxCCeDW1JKLxfHMwlqIAyW1-vwYyUv6-gqGZSzwBtpI7owkc-Sc2LkDtOEuHzv7Pu~msFb19T3NrA6HDYAhNvmDYhK4DZj-c7Gf9X7kKwAwILqfVKHQG~vcTBtvsG3Z0p0TO1C319QjhYnWQc~fk9i29Yfix8hLtyk2okCLMf6KnEtn5Mp2xL233ir~GsJQPech1sxHyaFARsQRumog__&Key-Pair-Id=APKAIE5G5CRDK6RD3PGA)
Median SFRs (top) and median baryonic mass fractions fbar (bottom) of galaxies of virial masses Mvir and associated circular velocities vc ≡ (GMvir/rvir)1/2 = 17(M/108 M⊙)1/3[(1 + z)/10]1/2 km s−1 (e.g. equation 3.11 in Loeb 2010). In each row, the left-hand panel shows the impact of stellar feedback in the reference simulation L25N512 at a typical redshift z ≈ 7 and the right-hand panel shows the dependence on redshift in that simulation. In the right-hand panels, to isolate the impact of photoheating, we include results from simulation L25N512-noSN, in which SN feedback was turned off (dashed curves). In the top right panel, we have divided the SFRs by the virial masses of the haloes hosting the galaxies to improve the clarity of the presentation. The dashed vertical lines mark the masses of haloes with virial temperatures Tvir = 104 K. The dotted vertical lines mark the mass of 100 DM particles. The dotted diagonal line in the top right panel marks a SFR of 0.3 M⊙ yr−1, which is the limiting SFR accessible in current observations (assuming a Chabrier IMF; see Fig. 4). The dashed horizontal lines in the bottom row panels mark the cosmic baryon fraction Ωb/(Ωb + ΩDM). The strong suppression of star formation by photoheating and by the explosion of stars as SNe is accompanied by a strong reduction in the baryon fraction. The dependence on resolution is discussed in Fig. A1.
Dependence on resolution and box size
The right-hand panel of Fig. 5 shows how our results depend on resolution and box size. While our reference simulation yields SFR functions in good agreement with the observations, simulations at lower and higher resolution significantly overpredict and underpredict the observed SFR functions in the range of SFRs in which SN feedback is efficient. This can be understood by noting that the rate at which the SN-heated gas cools and loses energy depends on resolution (equation 17 in Dalla Vecchia & Schaye 2012). At higher resolution, the SN-heated gas can maintain a high ratio of the local radiative cooling time and the sound-crossing time across a resolution element, a requirement for efficient feedback, out to higher densities, increasing the ability of the SN-heated gas to prevent the formation of new stars. Because at higher resolution, the gas fraction in low-mass haloes is more strongly reduced by stellar feedback, also the hierarchically assembling larger-mass haloes grow systematically more baryon-deficient as resolution is increased (see also e.g. Finlator et al. 2011).
The differences between the simulated and observed SFR functions in the high-res and low-res simulations may be reduced by increasing or lowering the fraction fSN of the energy each SN injects. This would be reasonable since our simulations lack the resolution and the physics that is needed to accurately model the radiative losses in the ISM. This strategy would enable one to investigate numerical convergence in simulations that reproduce observational constraints on star formation independent of resolution (e.g. Gnedin 2014; Schaye et al. 2015). The current set of simulations, on the other hand, highlights the dependence on resolution of the SN energy fraction required to match observational constraints on star formation. This dependence demonstrates clearly that current cosmological simulations have limited power in predicting the properties of star-forming galaxies from first principles. Note, however, that the difference in the simulated and observed SFR functions is relatively small, of the order of the difference introduced by uncertainties in the conversion between UV luminosities and SFRs (see discussions in, e.g., Muñoz & Loeb 2011; Boylan-Kolchin, Bullock & Garrison-Kimmel 2014; Bouwens et al. 2015). Therefore, the agreement between simulated and observed SFR functions is still very good.
Finally, we investigate the dependence on box size. The reference simulation overpredicts the abundance of the most intense star-forming galaxies in comparison with observations. This is likely due to the finite size of the box, which biases estimates of the abundance of the most massive and therefore rarest galaxies. The comparison with the small and large box simulations L12N256 and L50N512 supports box size as a limiting factor in accurate determinations of the SFR function at the highest SFRs. Additional processes that may impact models of the SFR function at high SFRs include feedback from massive black holes (e.g. Di Matteo, Springel & Hernquist 2005; Booth & Schaye 2009), which we have ignored here, and obscuration by dust (e.g. Cai et al. 2014; Cen & Kimm 2014). While we compare to observations of dust-corrected SFRs, there are large systematic uncertainties in the amount of dust as well as its properties, especially at the high redshifts of interest here (e.g. Smit et al. 2012; Duncan et al. 2014). It is also important to keep in mind that observational estimates of the SFR function are subject to cosmic variance (e.g. Finkelstein et al. 2012).
The UV luminosity function as a probe of reionization
The reduction of the SFRs of low-mass galaxies due to photoheating may affect the slope of the SFR function at low SFRs. Several (semi-) analytical works have proposed to search for this type of signature of reionization in the SFR function (e.g. Barkana & Loeb 2000; Mashian & Loeb 2013). Because the mass scale below which reionization suppresses star formation depends on the timing of reionization, locating this signature may constrain the reionization history (e.g. Barkana & Loeb 2006; Muñoz & Loeb 2011). Unfortunately, the imprint of photoheating in the SFR function may be quite weak and therefore difficult to detect, because of intrinsic scatter that causes galaxies of the same mass to show different SFRs (e.g. Barkana & Loeb 2000), because of hierarchical assembly that leaves also relatively massive haloes deficient in baryons as they assemble from low-mass photoevaporated progenitors (e.g. Barkana & Loeb 2000; Finlator et al. 2011), and because of the averaging in volumes in which reionization may proceed in a patchy manner (e.g. Barkana & Loeb 2006).
In our simulation L25N512-noSN, which does not include SN feedback and therefore lets us isolate the impact of radiative heating, photoheating indeed causes a pronounced change in the slope of the SFR function at SFRs ≲ 0.2 M⊙ yr−1. However, in simulation L25N512 that includes both photoheating and SN feedback, the change in the slope of the UV luminosity function due to photoheating is strongly masked by the suppression of star formation by SNe at SFRs ≳ 0.05 M⊙ yr−1. In the presence of SNe, the change in the slope of the SFR function occurs at lower SFRs, near the scale at which the lack of low-temperature physics prevents gas cooling and star formation in our simulations. This result is robust to changes in resolution explored here. We thus conclude that if SN feedback is as efficient as suggested by our simulations, detecting the signature of reionization heating in the SFR function will be challenging. However, it is important to keep in mind that our simulations ignore that stars may also form in minihaloes cooling through molecular hydrogen transitions, which would be more susceptible to feedback from photoheating.
The steep rise of the SFR function in the presence of radiative heating and SNe at low SFRs down to the SFRs that our simulations do not accurately resolve is consistent with that seen in previous works (e.g. Finlator et al. 2011; Jaacks et al. 2012; Cai et al. 2014), and with extrapolations of the observed SFR function (e.g. Smit et al. 2012; Bouwens et al. 2015; Finkelstein et al. 2014; Duncan et al. 2014). Because the mass scale below which photoheating affects the SFRs of galaxies is close to the mass scale below which efficient gas cooling requires the presence of molecular hydrogen or metals, quantifying the precise impact of reionization on the UV luminosity function will require more detailed, higher-resolution simulations of galaxy formation that include the relevant gas physics. While this is challenging because it extends the relevant dynamic range to still smaller scales, impressive first steps towards such simulations have already been made (e.g. Hasegawa & Semelin 2013; Gnedin & Kaurov 2014).
3.2.3 Impact on galaxy properties
Inspecting the properties of individual galaxies helps gain insight into the physical origin of the shape of the SFR function discussed above. Fig. 6 shows the median SFRs (top row) and the median baryonic mass fractions fbar ≡ (M⋆ + Mgas)/Mvir (bottom row) of galaxies in our simulations. The left-hand panel in each row shows the impact of feedback in the reference simulation at z ≈ 7, and the right-hand panel shows the evolution with redshift. In the top right panel, we have divided the SFRs by the virial mass of the haloes hosting the galaxies to improve the clarity of the presentation. Our reference simulation predicts that the faintest galaxies accessible by current observations reside in haloes with masses Mvir ∼ 1010 M⊙ (intersection of solid and diagonal dotted curves in the top middle panel), consistent with observational estimates based on matching the shapes of the DM halo mass function and the observed UV luminosity function (e.g. Trenti et al. 2010).
The top left panel of Fig. 6 shows that in our reference simulation, the median SFR at z ≈ 7 drops sharply below Mvir ∼ 2 × 10⁹ M⊙. The comparison with simulation L25N512-noSN in which SNe were turned off shows that this scale is set primarily by feedback from reionization. In the absence of photoheating, star formation continues in haloes with lower masses. However, even without feedback, galaxies in haloes with masses ≲5 × 10⁸ M⊙ do not form stars since gas cooling and condensation is prevented by the finite resolution and the lack of low-temperature coolants, such as molecular hydrogen and metals. SN feedback suppresses star formation strongly across nearly the entire range of galaxy masses. It only becomes inefficient at the lowest masses at which our finite resolution impacts the conversion of gas into stars, and at the highest masses, at which our simulations are also subject to finite box size effects.
Stellar feedback reduces star formation primarily because it reduces the amount of dense gas, both by expelling gas and by limiting the rates at which gas is accreted. In our reference simulation, reionization strongly reduces the gas fractions at halo masses ≲2 × 10⁹ M⊙. Reionization also reduces, though less strongly, the gas fractions in up to ∼10 times more massive galaxies, which assemble in mergers of lower-mass baryon-deficient galaxies and accrete gas from the reionized IGM (e.g. Barkana & Loeb 2000; Finlator et al. 2011; Muñoz & Loeb 2011). SN feedback most strongly impacts the gas fractions at masses ≳109 M⊙ in our reference simulation, again demonstrating that reionization and SN feedback act mostly complementary at the reference resolution. We show in Appendix A that in our high-res simulation, both reionization and SN feedback reduce the baryon fractions more strongly, and SN feedback extends its impact to haloes with masses as low as ≳2 × 10⁸ M⊙.
The scale at which photoheating becomes effective in suppressing star formation and reducing the baryon fractions in our reference simulation evolves significantly only after z ≈ 8, which coincides with the completion of reionization. A similar effect is seen in the evolution of the baryon fractions. This late impact of photoheating suggests a larger role of illumination by the external ionizing background than by localized ionizing sources internal to the galaxies, in agreement with the discussion of the belated impact of radiative heating on the cosmic SFR density above. However, we caution that in our simulations the impact of local ionizing sources may be underestimated due to the finite resolution. At least before reionization, radiative feedback from local sources is expected to dominate over feedback from external illumination. This is indeed seen in simulations of the first stars and the start of reionization, which focus on smaller volumes and therefore can afford a higher resolution and also accurately capture the relevant low-temperature physics, primarily the cooling and chemistry of molecular hydrogen (e.g. Ricotti & Gnedin 2005; Wise & Abel 2008; Pawlik et al. 2013; Jeon et al. 2015).
3.2.4 Impact on reionization
Both SNe and radiative heating may have a strong impact on reionization. We have seen above that SN feedback reduces the SFRs and therefore the ionizing luminosities of galaxies, which makes it more difficult for the galaxies to reionize the Universe. However, SNe may also open low-density channels in the ISM, e.g. by expelling gas in winds, through which ionizing photons may escape more easily (e.g. Dove, Shull & Ferrara 2000; Fujita et al. 2003; Wise & Cen 2009; Paardekooper et al. 2011). This makes it easier for galaxies to reionize the Universe. The net impact of SNe on reionization is the result of the interplay of these two processes, and is therefore difficult to predict.
We have also seen above that radiative heating may help SNe to suppress star formation, which impedes reionization. On the other hand, radiative heating raises the Jeans mass in the IGM, and this reduces the IGM clumping factor and therefore the rate at which the IGM recombines. If recombinations consume a significant number of the ionizing photons that escape into the IGM, then radiative heating will help keeping the ionized gas ionized and thereby facilitate reionization (e.g. Pawlik et al. 2009; Finlator et al. 2012; So et al. 2014; Sobacchi & Mesinger 2014).
Fig. 7 shows that SN feedback has only a small impact on the timing of reionization. In the reference and low-res simulations, the reionization histories with and without SN feedback are nearly identical, and in the high-res simulation, SN feedback delays reionization by Δz ≲ 0.5. That the net impact of SNe on reionization is small suggests that the strong reduction in the SFRs due to SNe – in the high-res simulation by a factor of ∼10 by the end of reionization (Fig. 3) – is partially compensated by an increase, also due to SNe, in the escape fraction of ionizing radiation. A plausible physical mechanism by which this might be achieved is the strong reduction of the baryon fractions by SNe seen in our simulations (Fig. 6). However, the lack of a substantial impact on the reionization history could also be explained if reionization is driven mostly by the lowest-mass galaxies in which SN feedback is less effective in suppressing star formation due to the limited resolution. RT computations of the escape of ionizing photons into the IGM would help to identify which of these mechanisms is dominant, but this is beyond the scope of the current work.
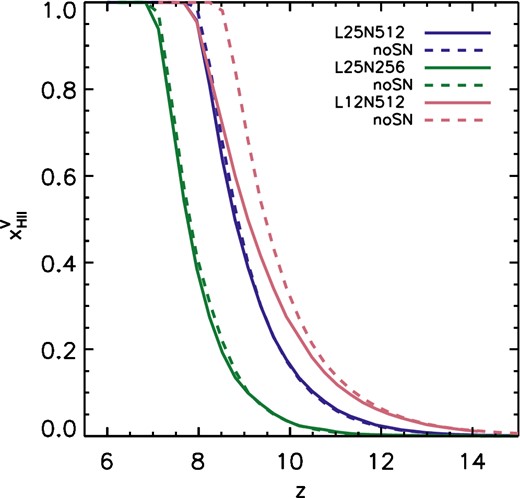
Effect of SNe on the evolution of the volume-weighted mean ionized fraction |$x_{\rm H\,\small {II}}^{\rm V}$| and its dependence on resolution. The solid curves show the reionization histories in simulations including feedback from ionizing radiation and SNe. The dashed curves show the reionization histories in the corresponding simulations in which SN feedback was turned off. The inclusion of SNe leads to at most a small delay in reionization, despite the strong suppression by SNe of the cosmic SFR (Fig. 3).
The left-hand panel of Fig. 8 shows that the reduction in the IGM recombination rate due to radiative heating is strong. We have followed Pawlik et al. (2009) and have equated the IGM clumping factor, CIGM, to C100, which parametrizes the average recombination rate of gas with overdensities ≤100. This enables us to separate recombinations in the IGM from recombinations inside galaxies (see also Miralda-Escudé et al. 2000). The latter are typically parametrized by the ionizing escape fraction. Alternative definitions of the clumping factor are sometimes employed, e.g. by applying additional selection criteria to identify the ionized IGM (e.g. Kohler, Gnedin & Hamilton 2007; Finlator et al. 2012; Shull et al. 2012; Kaurov & Gnedin 2014). However, for typical reionization scenarios, these definitions, which are all designed to achieve the same objective, i.e. locating the ionized gas in the IGM, generally yield very similar results (see e.g. the discussion in Finlator et al. 2012).
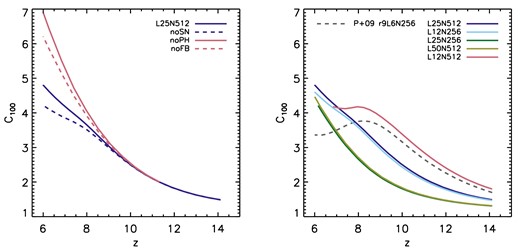
Evolution of the IGM clumping factor C100, which parametrizes the average recombination rate in gas with overdensity ≤100. Left: effect of stellar feedback in the reference simulation L25N512. Photoheating strongly reduces the clumping factor because it increases the Jeans mass in the reionized gas, providing a positive feedback on reionization. SN feedback increases the clumping factor by ∼15 per cent as it moves gas from galaxies to the IGM. Right: dependence on box size and resolution. The dashed curve shows the clumping factor from simulation r9L6N256 in Pawlik et al. (2009), in which the gas was heated by a uniform ionizing background turned on at z ≤ 9. The earlier result is in good agreement with the clumping factor in simulation L12N512, which employs a similar resolution and in which the IGM, on average, is reionized at a similar redshift. The small increase with respect to the earlier work is mostly due to the inclusion of SNe.
Our simulations likely underestimate the clumping factor before reionization, since the Jeans mass in the unheated IGM is unresolved (e.g. Emberson, Thomas & Alvarez 2013). Thus, the positive radiative feedback from photoheating on reionization is also underestimated. Note, however, as shown in Pawlik et al. (2009) that the clumping factor at z ≈ 6 is insensitive to the redshift at which reionization occurs for reionization at z ≳ 8. As already found in Pawlik et al. (2009), SNe move gas from galaxies to the IGM, and this leads to a slight increase in the clumping factor (see also Finlator et al. 2012).
The right-hand panel of Fig. 8 shows that the clumping factor derived from the high-res simulation L12N512 is consistent with that in simulation r9L6N256 of Pawlik et al. (2009), which had similar resolution but assumed that the IGM is heated by a uniform UV background turned on instantaneously at z = 9. This agreement likely results because in our RT simulations, reionization occurs sufficiently rapidly such that differences in the time at which individual regions inside the simulated volume are reionized are small and similar to the time it takes for the IGM to respond dynamically to the increase in the Jeans mass in the simulation in which the gas is instantaneously exposed to a uniform ionizing background. The slight increase in the clumping factor by ∼15 per cent with respect to the earlier work is mostly due to the inclusion of SN feedback, although, as shown in Pawlik et al. (2009), the differences in cosmological parameters also contribute. For reionization occurring at redshifts z ≳ 8, the IGM clumping factor C100 at z ≈ 6 is numerically converged and insensitive to a further increase in resolution and box size (Pawlik et al. 2009).
4 DISCUSSION
In this section we briefly discuss how changes in physical parameters affect the outcome of our simulations and also mention some of the main physical processes our simulations have ignored.
4.1 Variations of physical parameters
Fig. 9 shows how variations in the physical parameters impact the reionization history and the ability of galaxies to form stars. Towards this end we have repeated the small-box simulation L12N256, which has the same resolution as the reference simulation L25N512 but allows for a computationally more efficient exploration of the parameter space, with different values for some of the parameters.
Impact of variations in the physical parameters on the volume-weighted mean neutral fraction (left), the hydrogen photoionization rate (middle), and the median SFRs of galaxies at z ≈ 7 (right, normalized by the virial masses) in simulation L12N256. The vertical dashed line marks the mass corresponding to a virial temperature 104 K, and the vertical dotted line marks the mass of 100 DM particles. Data points are as in Fig. 2. Reducing the sub-resolution escape fraction to 0.6, 0.5, and 0.4 (blue, green, and light green curves) implies that reionization occurs later, which reduces the impact of photoheating on the SFRs. Increasing the energy injected in each photoionization by a factor of 4 (red curves) leads to larger gas temperatures, which reduces recombination rates and increases the scale below which photoheating suppresses SF.
One of the main parameters of reionization simulations is the escape fraction |$f_{\rm esc}^{\rm subres}$| of the unresolved ISM. Decreasing this fraction from 1.0 to 0.6, 0.5 and 0.4 causes reionization to occur at lower redshifts, as expected, at which it extends over longer times, in good agreement with similar parameter studies by Petkova & Springel (2011) and Hasegawa & Semelin (2013). Since photoheating is delayed, low-mass haloes can continue to form stars more efficiently down to lower redshifts. However, the associated increase in the ionizing emissivity is smaller than the reduction due to the decrease in the sub-resolution escape fraction, and so the impact on reionization due to the change in the minimum mass of haloes is small (e.g. Petkova & Springel 2011). In the current simulations, adopting an escape fraction |$f_{\rm esc}^{\rm subres} = 0.4$| yields excellent agreement with observations of the evolution of the ionized fraction and the hydrogen photoionization rate at z = 6 (but observational constraints are weak; see the discussion in Section 3.1).
The amount of energy injected in each photoionization depends on the spectrum of the radiation sources and requires multi-frequency RT simulations for an accurate computation including spectral hardening (e.g. Abel & Haehnelt 1999; Maselli, Ciardi & Kanekar 2009; Pawlik & Schaye 2011). Here we treat this energy as a parameter (e.g. Petkova & Springel 2011). Increasing it implies a slight acceleration in reionization, and a slight decrease in the mean neutral fraction after reionization. This is caused by the increase in the gas temperatures implied by the higher photoheating rates, which in turn decreases the rate at which hydrogen recombines (e.g. Stiavelli, Fall & Panagia 2004; Pawlik et al. 2009; Finlator et al. 2012). Finally, the increased gas temperature increases the negative impact of photoheating on the efficiency of low-mass galaxies to form stars, raising the mass scale below which star formation is strongly suppressed (see also e.g. Petkova & Springel 2011).
Finally, we have carried out a preliminary comparison with results from a new set of simulations of reionization similar to those presented here, which feature increased physical realism and span a wider range of box sizes and resolutions. These simulations will be discussed elsewhere in more detail and include, among others, helium chemistry and cooling/heating, and feedback and metal enrichment from AGB stars, core-collapse and Type Ia SNe, and metallicity-dependent population synthesis. The treatment of helium was made feasible by replacing the explicit chemistry solver described in Section 2.2 with the implicit solver described in Pawlik et al. (2013), which is faster. Moreover, the simulations are designed, by calibrating the sub-resolution escape fraction and the SN energy fraction, to match the observed UV luminosity functions and to exhibit similar reionization histories independent of resolution. A simulation employing the same resolution as our reference simulation here and adopting a sub-resolution escape fraction of |$f^{\rm subres}_{\rm esc} = 0.5$| yields reionization and SFR histories similar to those in the current simulation L12N256 adopting an escape fraction |$f^{\rm subres}_{\rm esc} = 0.6$|.
4.2 Limitations
Our simulations ignored a number of potentially relevant physical processes. Most importantly, perhaps, our simulations ignored the chemistry of and radiative cooling by molecular hydrogen, effectively assuming a soft UV background that prevents the build-up of hydrogen molecules. This approximation fails at the earliest stages of reionization, where it artificially prevents the formation of stars inside low-mass minihaloes (e.g. Greif et al. 2008; Wise, Turk & Abel 2008; Muratov et al. 2013; Pawlik et al. 2013). This early population of stars may preionize the IGM and provide a significant feedback on subsequent star formation and reionization (e.g. Ricotti & Ostriker 2004b; Ahn et al. 2012). Our simulations have also ignored the enrichment with metals that accompanies the explosion of stars as SNe. Metal-enrichment affects the rates at which gas cools and forms stars (e.g. Jappsen et al. 2009; Wiersma, Schaye & Smith 2009), which may be especially important in low-mass minihaloes in which radiative cooling by atomic hydrogen is suppressed. Finally, we have only followed the radiative feedback from the relatively soft ionizing radiation emitted by metal-enriched stars. Other sources of radiation, such as zero-metallicity stars (Pop III stars) or X-ray emitting black holes, may be an important source of ionization and feedback during reionization (e.g. Madau et al. 2004; Ricotti et al. 2005; Alvarez, Wise & Abel 2009; Haiman 2011; Jeon et al. 2014a).
5 SUMMARY
We have carried out a suite of cosmological radiation-hydrodynamical simulations of galaxy formation during reionization. The reference simulation was run in a box of size 25 h−1 cMpc and contained 5123 DM and 5123 baryonic particles, thus resolving atomically cooling haloes with at least ≳10 DM particles. Simulations using both larger and smaller boxes and higher and lower resolution allowed us to investigate the numerical convergence of our results. Simulations in which either SNe or photoionization heating or both are turned off enabled us to isolate and investigate the impact of feedback from star formation. Ionizing photons were transported using accurate and spatially adaptive RT, tracking the growth of ionized regions and the build-up of an ionizing background at the native high resolution at which the hydrodynamics was carried out.
Current cosmological simulations lack both the resolution and the physics to provide an ab initio description of the structure of the interstellar gas and the rate at which the gas cools. This necessitates the use of physically motivated but resolution-dependent parameters to control the energy that each SN injects and the fraction of ionizing photons that escape into the IGM. SFRs and reionization histories are sensitive to these parameters and this impedes the use of cosmological simulations in predicting these quantities from first principles. On the other hand, one may exploit this sensitivity and choose parameters for which simulated SFRs and reionization histories are consistent with current observational constraints, and investigate the implications of such observationally supported models of galaxy formation. Here we have focused on the role of feedback from SNe and photoheating, two processes that critically shape galaxy formation and reionization.
Our reference simulation yields SFR densities and a UV luminosity function in excellent agreement with observational constraints and completes reionization by z ≈ 8. Increasing the resolution leads to a strong increase in the cosmic SFR at high redshifts as it facilitates the condensation of gas into low-mass galaxies. It leads to a mild decrease in the cosmic SFR at late times, when star formation is strongly regulated by stellar feedback. As a consequence, near the end of reionization, our high-res simulation yields a slightly smaller normalization of the UV luminosity function and our low-res simulation yields a slightly larger normalization of the UV luminosity function than our reference simulation and observations. Because of the initial increase in the cosmic SFR, increasing the resolution also increases the redshift at which the IGM is reionized. Increasing the size of the simulation box above 12.5 h−1 cMpc has only a minor impact on the SFR and reionization histories.
Photoheating reduces the baryon fractions and suppresses star formation primarily in haloes with masses below ≲2 × 10⁹ M⊙. SNe, on the other hand, reduce the baryon fractions and suppress star formation primarily in haloes more massive than ≳109 M⊙. Therefore, the currently observable cosmic SFR is more strongly suppressed by SNe than by photoheating, and SN feedback alone is sufficient to match observational constraints on the UV luminosity function. The inefficiency of SNe in the lowest mass galaxies is primarily a consequence of the lack of low-temperature gas physics and the limited resolution. Nevertheless, the feedback from SNe is sufficiently strong to mask the impact of photoheating on the abundance of low-mass atomically cooling star-forming galaxies. We thus do not find a noticeable signature imprinted by reionization heating on the UV luminosity function, although we note that the resolution of our simulations is insufficient to model star-forming minihaloes that would be more strongly affected by photoheating.
Despite the relatively small impact on the cosmic SFR, photoheating is an important feedback process. First, photoheating amplifies the ability of SNe to suppress star formation. This amplification is non-linear and mutual, demonstrating the need to simultaneously account for both feedback processes. Secondly, photoheating smooths out gas density fluctuations in the IGM and thereby strongly reduces the IGM recombination rate. This makes it easier to keep the gas ionized, which facilitates reionization. In contrast, the net impact of SNe on reionization is small. SNe strongly suppress SFRs and slightly increase the IGM recombination rate as gas is moved from the galaxies to the IGM. However, this leads only to a small delay in the timing of reionization, possibly because SNe create additional low-density channels in the ISM through which ionizing photons can escape, which increases the escape fraction of ionizing radiation, or because reionization is driven by the lowest mass galaxies in which SN feedback is inefficient in our simulations.
In summary, our work demonstrates that both photoheating by the stellar radiation that reionizes the Universe and the explosion of massive stars as SNe may have had a strong impact on structure formation and reionization in the first billion years.
We are grateful to Volker Springel for letting us use gadget and the halo finder Subfind. We thank Ali Rahmati, Milan Raicevic, Myoungwon Jeon, Craig Booth, and Volker Bromm for useful discussions, and we thank Benedetta Ciardi for a careful reading of an early draft. We further thank Ali Rahmati for help with executing some of the simulations used in Fig. 9. We thank Rychard Bouwens for providing us with his upwards corrections of UV luminosity densities used in Fig. 2, and we thank Kenneth Duncan for his tables of observed SFRs and UV luminosity functions provided to us in electronic form. Computer resources for this project have been provided by the Gauss Centre for Supercomputing/Leibniz Supercomputing Centre under grant:pr83le. We further acknowledge PRACE for awarding us access to resource Supermuc based in Germany at LRZ Garching (proposal number 2013091919). Some of the simulations presented here were run on Odin at the Rechenzentrum Garching (RZG) and the Max-Planck-Institute for Astrophysics (MPA) and on Hydra at the RZG. This work was sponsored with financial support from the Netherlands Organization for Scientific Research (NWO), also through a VIDI grant and an NWO open competition grant. We also benefited from funding from NOVA, from the European Research Council under the European Unions Seventh Framework Programme (FP7/2007-2013) / ERC Grant agreement 278594-GasAroundGalaxies and from the Marie Curie Training Network CosmoComp (PITN-GA-2009-238356). AHP received funding from the European Union's Seventh Framework Programme (FP7/2007-2013) under grant agreement number 301096-proFeSsoR. CDV benefitted from Marie Curie Reintegration Grant PERG06-GA-2009-256573.
While traphic can treat ionization of helium, in this work we set X = 1, as discussed in Section 2.2.
We refer to this thermal feedback as SN feedback for simplicity of presentation. However, our implementation is agnostic to the physical processes that inject the energy, and therefore may be interpreted as collectively describing all promptly acting feedback processes associated with the formation of stars that are not explicitly treated otherwise. Such processes include stellar winds as well as radiation pressure (for a discussion see e.g. Schaye et al. 2015).
REFERENCES
APPENDIX A: DEPENDENCE ON RESOLUTION
Here we extend the discussion of the galaxy properties in our reference simulation in Section 3.2.3 (Fig. 6) with a brief investigation of the dependence on resolution. Fig. A1 shows that in our high-res simulation, in the absence of SN feedback, reionization suppresses star formation only at masses below ∼5 × 10⁸ M⊙. This is significantly less than at the reference resolution, even though the IGM in the two simulations is reionized at similar times. The decrease in the suppression scale is caused by the increase in the SFRs that, in the absence of feedback, accompanies an increase in resolution, and for which photoheating does not entirely compensate in our simulations. However, the high-res and reference simulations agree closely on the characteristic scale ∼109 M⊙ below which the median SFR is strongly suppressed by the combined action of radiative and SN feedback. In the low-res simulation, star formation is suppressed in haloes as massive as 5 × 10⁹ M⊙, primarily by the limited resolution.
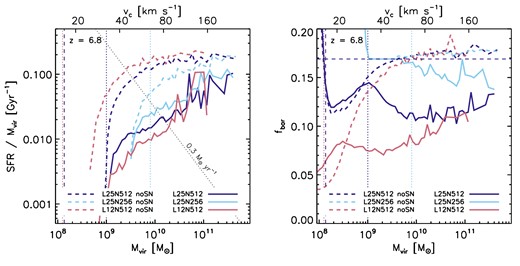
Impact of resolution on the median SFRs (left) and the median baryonic mass fractions fbar (right) of galaxies of virial masses Mvir at z ≈ 7. The meaning of the dashed and dotted lines is as in Fig. 6.
