


Abstract
In order to clarify a possible role of small-scale dynamo in formation of solar magnetic field, we suggest an observational test for small-scale dynamo action based on statistics of anti-Hale sunspot groups. As we have shown, according to theoretical expectations the small-scale dynamo action has to provide a population of sunspot groups which do not follow the Hale polarity law, and the density of such groups on the time-latitude diagram is expected to be independent on the phase of the solar cycle. Correspondingly, a percentage of the anti-Hale groups is expected to reach its maximum values during solar minima. For several solar cycles, we considered statistics of anti-Hale groups obtained by several scientific teams, including ours, to find that the percentage of anti-Hale groups becomes indeed maximal during a solar minimum. Our interpretation is that this fact may be explained by the small-scale dynamo action inside the solar convective zone.
1 INTRODUCTION
Solar magnetic activity is widely believed to be associated with dynamo action somewhere in the solar convective shell. Identification of particular details of solar dynamo with surface manifestations of solar dynamo accessible for observations remains however a disputable problem. The point is that many important details of dynamo action being hidden in solar interior cannot be observed directly, and we have to learn about them basing on indirect tracers. The link between a particular parameter important for a solar dynamo model and observable tracers of solar activity may be quite complicated, so adding new tests for comparison between concepts of solar dynamo and observations is a very attractive and simultaneously highly non-trivial undertaking.
Recently a new physical entity – solar small-scale magnetic field – was suggested for observational verification of solar dynamo concepts. Solar magnetic field obviously contains some small-scale details which hardly can be included in the global solar magnetic field produced by traditional mean-field dynamo models. Of course, more detailed dynamo models based on direct numerical simulations of non-averaged magnetohydrodynamic-equations give dynamo-driven magnetic configurations much more complicated than those produced by the mean-field models. This fact is in agreement with theoretical expectations from mean-field models because certain terms in mean-field equations appear as a result of averaging of magnetic fluctuations.
The point however is that, apart from the mean-field (or global) dynamo based on a joint action of solar differential rotation and mirror-asymmetric convection, the dynamo theory (in the framework of average description in terms of correlation tensor, see e.g. a review by Zeldovich, Ruzmaikin & Sokoloff (1990), as well as in direct numerical simulations, see e.g. a review by Brandenburg, Sokoloff & Subramanian (2012) predicts an additional mechanism of magnetic field self-excitation, so-called small-scale dynamo which produces small-scale magnetic field, i.e. magnetic fluctuations. In other words, the dynamo theory suggests that the total dynamo-driven magnetic field |$\boldsymbol H$| can contain the following contributions: mean magnetic field |$\boldsymbol B$|, small-scale magnetic field |$\boldsymbol b$| connected with the mean field |$\boldsymbol B$|, and small-scale magnetic field |$\boldsymbol h$| generated independently of |$\boldsymbol B$|. Theoretical distinction between |$\boldsymbol b$| and |$\boldsymbol h$| was known quite a long time ago (see e.g. Brandenburg & Subramanian 2005). However, a general presumption was that it is more or less hopeless to distinguish between |$\boldsymbol b$| and |$\boldsymbol h$| observationally. As a result, the relationship between |$\boldsymbol b$| and |$\boldsymbol h$| was very rare addressed in dynamo theories. A naive theoretical expectation was that both sources of small-scale magnetic field contribute somehow in magnetic fluctuations (as soon as fluctuations are ubiquitous in cosmic phenomena), however any attempt to distinguish between them hardly can be a fruitful undertaking.
Modern progress in solar magnetic field observations (e.g. Ishikawa et al. 2007; Lites et al. 2008, a review by de Wijn et al. 2009; Abramenko et al. 2010; Martinez Gonzalez et al. 2012, to mention a few) makes it possible to explore in detail various solar small-scale magnetic structures which often look quite specific in comparison with mean solar magnetic field. A natural naive expectation appears that we clearly see imprints of the small-scale dynamo action, i.e. the field |$\boldsymbol h$|. The fundamental conceptual progress here occurs due to the papers by Stenflo (2012, 2013). He critically examined ‘the relative contributions of these two qualitatively different dynamos to the small-scale magnetic flux’ with the following conclusion: ‘the local dynamo does not play a significant role at any of the spatially resolved scales, nearly all the small-scale flux, including the flux revealed by Hinode, is supplied by the global dynamo’.
We appreciate the importance of the clear and convincing statement of the problem formulated by Stenflo (2012, 2013). The point however is that, generally speaking, the small-scale dynamo can act in the solar interior and contribute very little into surface observables. On the contrary, certain versions of the dynamo theory (e.g. Cattaneo & Tobias 2014) predict that ‘large-scale dynamo action can only be observed if there is a mechanism that suppresses the small-scale fluctuations’. So, we deal with a fundamental physical problem and it looks reasonable to spend efforts in order to find tiny surface spores of the small-scale dynamo action in the solar interior.
In this paper, we suggest that an imprint of the small-scale dynamo action in solar interior can be hidden in statistics of sunspot groups which violate the Hale polarity law. The law states that in odd, for example, cycles, bipolar groups in the Northern (Southern) hemisphere have a positive (negative) magnetic polarity of the leading sunspot. We refer to the groups, which violate this law as anti-Hale groups. The key issue of the suggested test is that observations (as well as direct numerical simulations) deal with the total magnetic field |$\boldsymbol H$| while the underlying physical problem is formulated in terms of the statistical quantities originated from the mean-field approach. And it is far from straightforward how to make inferences about the later in terms of the observed |$\boldsymbol H$|. In other words, we need an explicit description of how we separate various contributions to the total magnetic field. In statistical studies, such a description is referred as a probabilistic model.
2 PROBABILISTIC MODEL FOR THE MAGNETIC FIELD
The start point of the observational test suggested is as follows.
It is well known that through a solar cycle, the polarity of sunspot groups follows the so-called Hale polarity law, i.e. leading sunspots have opposite polarities in Northern and Southern hemispheres. Besides, from cycle to cycle, the leading-spot polarity changes. The Hale polarity rule reflects symmetry of the mean solar magnetic field. We recall that in the framework of dynamo studies the number of sunspot groups is believed to be related to the mean-field strength.
Of course, there are few sunspot groups which do not follow the Hale polarity rule. Suppose that anti-Hale groups can be considered as a result of some magnetic fluctuations which break symmetry of the mean magnetic field. Suppose also that the amplitude of fluctuations is governed by the mean-field strength, as it should be if the small-scale dynamo does not work. Then we have to expect that the number of sunspot groups which follow the Hale polarity law should be proportional to the number of anti-Hale groups, and the relative number (the percentage) of the anti-Hale groups should be cycle independent.
In contrast, if there is a substantial source of magnetic fluctuations independent on the mean field, then the number of anti-Hale groups has to contain a cycle-independent component. In this case, the relative number of anti-Hale groups has to be enhanced during each solar minimum. This expectation admits an observational verification (at least in principle) and looks reasonable at least in the first sight. The point however is that realization of the above scheme is not a trivial task. Below we present the key features of our approach in the most simple form as a toy model of relationship between the sunspots polarity and two contributors to magnetic fluctuations.
Let us consider a given solar hemisphere in a given solar cycle and assume that according to the Hale polarity law toroidal component of the mean magnetic field (which determines polarity of sunspot groups) is directed, say, westwards. Let the magnetic field be organized in tubes of two types: the first type are tubes produced by the mean field and the second type tubes are associated with the small-scale dynamo action. For the sake of simplicity, we adopt that the tubes are directed longitudinally, i.e. oriented along the equator.
Let the tubes of the first type contain the magnetic field of two components. The first component, |$\bar{\boldsymbol B}$|, is a non-random flux directed westwards. The number density of the tubes is denoted as n1, so that |$n_1 \bar{\boldsymbol B}$| is the mean field |$\boldsymbol B$|. The number density n1 is modulated by 11-year cycle, which results in the 11-year modulation of |$\boldsymbol B$|. At the same time, |$\bar{\boldsymbol B}$| is time-independent. We presume that sunspot formation is a threshold phenomenon with a threshold magnetic field strength, |$\hat{B}$|, slightly exceeding the magnitude of |$\bar{\boldsymbol B}$|.
The other magnetic field component is a random (say, Gaussian) magnetic field |$\boldsymbol b$| which is directed longitudinally as well, however its mean value vanishes, and the field is directed with the equal probabilities west- or eastwards. The rms value of this field, |$\bar{b}$|, is proportional to |$\bar{B}$|. If |$\boldsymbol b$| is directed westwards and |$\bar{\boldsymbol B} + {\boldsymbol b}$| exceeds |$\hat{B}$|, then a magnetic tube arises on the solar surface and creates a sunspot group which follows the Hale polarity law. If, however, the field |$\boldsymbol b$| is directed eastwards and, by chance, it is so strong that |$|\boldsymbol b| - |\bar{\boldsymbol B}|$| exceeds |$\hat{B}$|, then the tube arises as well, but the newcomer violates the Hale polarity law. A simple estimates (Khlystova & Sokoloff 2009; Sokoloff & Khlystova 2010) show that if |$\bar{b}/\bar{B} \approx 1$|, the number of anti-Hale groups should be a few per cent of the total number of sunspot groups.
Note that in order to explain why sunspots arise at solar minima (when the mean magnetic field is low), we have to suppose that |$\bar{B}$| is time-independent and the mean-field cyclic modulation comes from the modulation of n1.
The tubes of the second type contain a random (say, Gaussian) magnetic field |$\boldsymbol h$| with a cycle-independent rms value |$\bar{h}$| and zero mean value. They do not contribute to the mean magnetic field. When |$|\boldsymbol h|$| exceeds |$|\hat{B}|$|, a tube arises, and the polarity orientation depends on the occasional tube's orientation: a Hale polarity law group appears if |$\boldsymbol h$| was directed westward, and an anti-Hale group appears if |$\boldsymbol h$| was directed eastward.
Obviously, the number of anti-Hale groups originated from the first-type tubes depends on the cycle (as soon as the total number of sunspots diminishes at solar minima), while that originated from the second-type tubes is cycle independent. On the contrary, the percentage of anti-Hale groups originated from the first-type tubes does not depend on the cycle, while the percentage of that produced by the second-type tubes should reach its maximum value at the solar minima because the total number of sunspots is lowered at that times. Thus, exploring a presence/absence of cyclic modulation of the anti-Hale groups, we can shed light on a relationship between the small-scale field |$\boldsymbol h$|, originated from the small-scale dynamo, and the small-scale field |$\boldsymbol b$|, produced by the mean-field dynamo action.
The above model is an obvious oversimplification. We only include the features that are ultimately required to illustrate our observational test. Further steps will be to admit that the magnetic tubes might be directed not exactly longitudinally, to include temporal growth of magnetic field in a given tube due to the dynamo action, etc.
3 DATA
The Mount Wilson Observatory (MWO) has carried out magnetic observations of sunspot groups throughout a century. On the basis of those observations, the catalogue of magnetic classes of sunspot groups was compiled, which contains the information on number of anti-Hale sunspot groups within certain time intervals. Unfortunately, the digital format of the complete MWO catalogue does not exist yet.
Monthly catalogues for 1920–1958, which include the magnetic classification of sunspot groups, had been published in each issue of the Publications of the Astronomical Society of the Pacific1 starting with a paper titled: ‘Summary of Mount Wilson Magnetic Observations of Sun-Spots for May and June’ (1920). From 1962 to 2009, the catalogue data had been published in the Solar-Geophysical Data, however, there were gaps in the information on anti-Hale sunspot groups. There is a digital MWO catalogue covering the time interval from 1962 to 2004. This one is available at the website of the National Geophysical Data Center,2 however the information on anti-Hale groups is presented for the 1989–2004 time interval only.
Note that in the MWO catalogue, normal and anti-Hale sunspot groups are determined by the sign of magnetic field in the leading sunspots and by the group's tilt relative to the E–W direction. This method works well for a majority of bipolar groups. However, uncertainties can appear in some cases. Thus, the tilt of the sunspot axis can be misaligned with the tilt of magnetic polarities, and as a result, a normal group with a rare unusual tilt can be classified as an anti-Hale one; groups of a singular sunspot cannot be classified; besides, in some cases, the identification of a group as an anti-Hale one is ambiguous because the group can change the polarity orientation during its evolution. To frame a group from its neighbours sometimes is not a unique procedure (see for example, the magnetic complex AR NOAA 09393/09394). We acknowledge the above shortcomings, however we decided to use the catalogue data.
Richardson (1948) studied in detail anti-Hale sunspot groups from 1917 to 1945 using the MWO catalogue data published in Hale & Nicholson (1938) and in Publications of the Astronomical Society of the Pacific.1 He examined the anti-Hale sunspot groups on the original records. Table 5 in his paper gives yearly numbers of normal and anti-Hale sunspot groups in the Northern and Southern hemispheres separately for the 15th, 16th and 17th solar cycles. Richardson normalized the data: the number of sunspot groups observed at MWO during a year was multiplied by 365 and divided by the number of observation days in a year, which resulted in non-integer numbers of anti-Hale groups in his table 5. The data from this table for 1917–1945 were used in the present study.
During periods of cycles overlapping, the high-latitude groups are thought to belong to new cycle, and therefore, they have the opposite (to the old cycle) magnetic polarity of the leading sunspots. These groups must be marked as normal, not anti-Hale ones. Having this in mind, Richardson introduced the cycle separation of groups, so that during the cycles overlapping, the low-latitude groups belong to the old cycle, whereas the high-latitude groups belong to the new cycle. The mark ‘anti-Hale’ was attributed depending on the cycle. Fig. 1 of Richardson (1948) demonstrates this for anti-Hale sunspot groups. We follow this rule in the present study.

Time-latitude distribution anti-Hale sunspot groups for 1989–2004. Top: all sunspot groups which were marked as anti-Hale in MWO catalogue. Bottom: anti-Hale sunspot groups after our checking. White (black) dots indicate groups with the positive (negative) magnetic field in the leading sunspots. Dotted lines correspond to the boundaries between 22 and 23 solar cycles in accordance with method of McClintock, Norton & Li (2014).
To obtain the annual number of normal (anti-Hale) groups from table 5 from Richardson (1948), we combined the normal (anti-Hale) groups of both hemispheres. Besides, for years of cycles overlapping (1922–1924, 1933–1935, 1943–1945), we combined low-latitude normal (anti-Hale) groups of old cycle with high-latitude normal (anti-Hale) groups of new cycle. As a result of these efforts, our first data set, named hereinafter as the 1917–1945 data set, was compiled.
Our second data set was compiled on the basis of the above mentioned 1989–2004 MWO data. In detail, these data were observed from 1989 January 1 to 2004 August 31. They are available at the website of the National Geophysical Data Center.2 There, for anti-Hale groups, the sign ‘+’ is added to the magnetic class, according to the catalogue description.3 Total 354 groups were marked as anti-Hale groups. (Note, that during the time period under study, the data have gaps, namely, 1995 November, 1998 December and 2002 January to March.) We scrutinized each (out of 354) group marked as ‘anti-Hale’. Using the data about the magnetic polarity in sunspots,4 we determined the polarity of leading spots. The time-latitude diagram was compiled (Fig. 1, top frame). Following the method used by McClintock et al. (2014), we separated wings of activity waves to determine the boundaries between cycles (dashes lines in Fig. 1). The diagram shows that there are certain mistakes in attributing the ‘anti-Hale’ property (e.g. black dots are present in the midst of white, and visa versa; two high-altitude sunspot groups of the new cycle were wrongly marked as anti-Hale groups in 1996). This forced us to re-examine all groups on the diagram by means of full disc magnetograms of different observatories available at the DPD website5 (Győri, Baranyi & Ludmány 2011). We found that about one-half of identifications were erroneous. The mis-identifications are associated predominantly with long-lived spots in decaying active regions with formation of small spots or pores of opposite polarity to the west from the main spot, or mis-identifications of boundaries of sunspot groups in decaying activity complexes. The corrected data set 1989–2004 was used to explore the anti-Hale statistics in the next section (Fig. 1, bottom frame).
In our study, we also consider the results of McClintock et al. (2014). The authors analysed magnetic tilt angles of sunspot groups along with information on the magnetic polarities of leading spots. Their statistics of anti-Hale bipolar sunspot regions for 1974–2012 was obtained from the data of Li & Ulrich (2012), who determined sunspot magnetic tilt angles from MWO sunspot records and daily averaged magnetograms, as well as from Solar and Heliospheric Observatory/Michelson Doppler Imager (SOHO/MDI) magnetograms.
4 CYCLIC VARIATIONS IN THE PERCENTAGE OF THE ANTI-HALE GROUPS
The results for the 1917–1945 data set are shown in Fig. 2. The upper panel shows the annual average of sunspot groups and demonstrates 11-year solar activity cycle. The lower panel represents the annual average percentage of anti-Hale groups. The percentage of anti-Hale groups tends to be enhanced during the cycles’ minima. The similar result was obtained for the 1989–2004 data set, Fig. 3. We found that the observed enhancement of the percentage becomes less pronounced when we average data over time intervals longer than one year. On the contrary, averaging over shorter time intervals seem to be interesting, and it is considered below.

Annual average sunspot groups data for 1917–1945. Top: time variations of the total number of sunspot groups divided by 30 (thick line) and the numbers of anti-Hale groups (thin line). Bottom: the percentage of anti-Hale groups. Error bars show standard deviations.
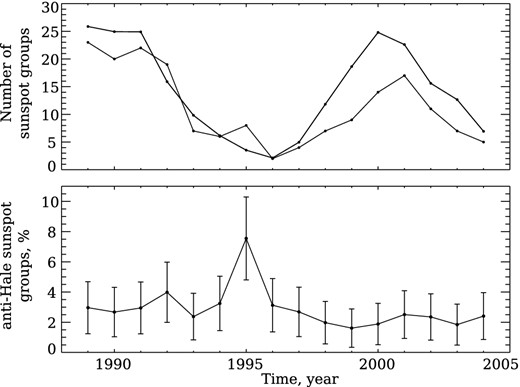
Annual average sunspot groups data for 1989–2004. Notations are the same as in Fig. 2.
Thus, Fig. 4 presents results for the 1989–2004 data set as derived from three different temporal averaging routines. Namely, the two top frames (a) show the outcome from one-month averaging, the two middle frames (b) present the result of two-month averaging, and, finally, the two bottom frames (c) refer to the three-month averaging outcome. Data gaps in 1995 November, in 1998 December and in 2002 from January to March are visible. The data show that during the time intervals of active Sun, the percentage of anti-Hale groups predominantly does not exceed the 7 per cent level (the dashed horizontal lines on the percentage frames), however, during the minimum between the 22nd and 23rd cycles, the value of percentage reaches up to 15–25 per cent for different averaging intervals. From Fig. 4 one can conclude that the relative number of anti-Hale groups overcomes the 7 per cent-level when the total number of sunspot groups becomes low (below approximately 20, the level marked with the dashed line on the top frame of Fig. 4).
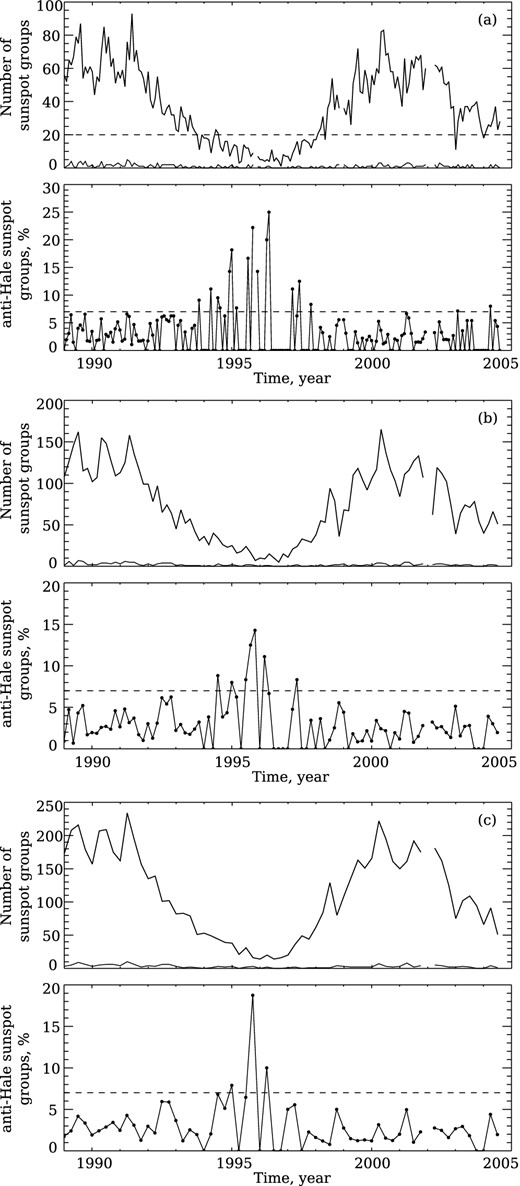
Statistics of sunspot groups for 1989–2004: (a) – monthly average; (b) – two-month average; (c) – three-month average. For each pair of frames, the top frame shows the total number of sunspot groups (thick line), and the number of anti-Hale groups (thin line), whereas the bottom frame shows the percentage of anti-Hale groups.
We compare the above results with findings of McClintock et al. (2014) who also reported an enhancement of percentage of anti-Hale groups near the ends of solar activity cycles (Fig. 5). Slight differences between our results and that reported by McClintock and colleagues are visible, however we presume that they might be due to different applied routines to outline a sunspot group. Note, that the local peak in the percentage of anti-Hale groups in 1995 is present in both studies, compare Fig. 3 (bottom frame) and Fig. 5 (top frame). Thus, an enhancement of the relative number of anti-Hale groups during the solar minima can be regarded as a solid result.
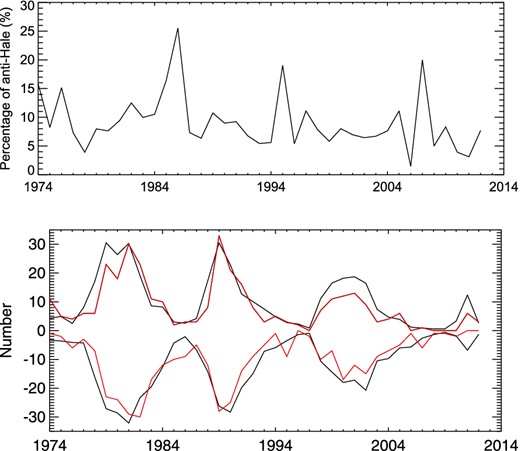
Top: time variations of the percentage of bipolar anti-Hale groups. Bottom: time variations of the number of bipolar sunspot regions divided by 10 (black) and the number of anti-Hale regions (red). Positive (negative) numbers refer to Northern (Southern) hemisphere. Courtesy of McClintock and co-authors (McClintock et al. 2014).
5 CONCLUSION AND DISCUSSION
We demonstrate that the relative number (the percentage) of sunspot groups which violate the Hale polarity law (anti-Hale groups) do increase during the minima of 11-year solar activity cycles. In accordance with the probabilistic model for the magnetic fields, suggested in Section 2, an increase of the relative number of anti-Hale groups during the solar minima implies the small-scale dynamo at work, because the small-scale dynamo provides a cycle-independent income in the number of anti-Hale groups and the total number of groups becomes lower during the solar minimum. In other words, the observed statistics of anti-Hale groups give a hint that small-scale dynamo is active in the solar interior.
This conclusion is compatible with the inferences made by Stenflo (2012, 2013), who considers the small-scale dynamo as a very negligible contributor to the total solar magnetic flux because the anti-Hale groups are associated with a tiny part of solar magnetic flux only (see table 1 in Wang & Sheeley 1989).
We stress however that a verification of this hint in the framework of other approaches remains highly desirable. The point is that the link between small-scale magnetic field in solar interior and statistics of anti-Hale groups is very far from straightforward, and it is problematic to exclude firmly alternative interpretations of the result obtained. In particular, in McClintock et al. (2014), it is supposed that the enhancement of the relative number of anti-Hale groups could be associated with the solar activity at low latitudes via interaction across the equator. We appreciate this option and its importance for solar dynamo, however we suppose that it is insufficient to explain the observed effect because, during solar minima, anti-Hale groups were observed at both low and intermediate/high latitudes (see Fig. 1 and time-latitude diagrams in Sokoloff & Khlystova 2010; McClintock et al. 2014).
ACKNOWLEDGEMENTS
DS and AK are grateful for the RFBR financial support under the grant 15-02-01407. AK thanks the support of the ISTP SB RAS project II.16.3.1 under the Program of Fundamental Research of SB RAS. Efforts of VA were supported by the Program of the Presidium of Russian Academy of Sciences no. 21.
