


Abstract
Galaxies and the dark matter haloes that host them are not spherically symmetric, yet spherical symmetry is a helpful simplifying approximation for idealized calculations and analysis of observational data. The assumption leads to an exact conservation of angular momentum for every particle, making the dynamics unrealistic. But how much does that inaccuracy matter in practice for analyses of stellar distribution functions, collisionless relaxation, or dark matter core-creation? We provide a general answer to this question for a wide class of aspherical systems; specifically, we consider distribution functions that are ‘maximally stable’, i.e. that do not evolve at first order when external potentials (which arise from baryons, large-scale tidal fields or infalling substructure) are applied. We show that a spherically symmetric analysis of such systems gives rise to the false conclusion that the density of particles in phase space is ergodic (a function of energy alone). Using this idea we are able to demonstrate that: (a) observational analyses that falsely assume spherical symmetry are made more accurate by imposing a strong prior preference for near-isotropic velocity dispersions in the centre of spheroids; (b) numerical simulations that use an idealized spherically symmetric setup can yield misleading results and should be avoided where possible; and (c) triaxial dark matter haloes (formed in collisionless cosmological simulations) nearly attain our maximally stable limit, but their evolution freezes out before reaching it.
1 INTRODUCTION
Spherical symmetry is a foundational assumption of many dynamical analyses. The primary motivation is simplicity, since few astronomical objects are actually spherical. For example, observations and simulations both suggest that gravitational potential wells generated by dark matter haloes are typically triaxial (e.g. Dubinski & Carlberg 1991; Cole & Lacey 1996; Jing & Suto 2002; Kasun & Evrard 2005; Hayashi, Navarro & Springel 2007; Loebman et al. 2012; Schneider, Frenk & Cole 2012). Characterizing dark matter haloes by spherically averaged densities and velocities (e.g. Dubinski & Carlberg 1991; Navarro, Frenk & White 1996; Taylor & Navarro 2001; Stadel et al. 2009) at best tells only part of the story. At worst, it could be severely misleading.
The question of whether baryonic processes can convert dark matter cusps into cores (Pontzen & Governato 2014) provides one motivation for a detailed study of the relationship between spherical and near-spherical dynamics. To explain why, we need to look forward to some of our results. Later in this paper, we cut a dark matter halo out of a cosmological simulation, then match it to an exactly spherical halo with an identical density and velocity anisotropy profile. This gives us two easy-to-compare equilibrium structures – the first triaxial, the second spherical – to perform a dynamical comparison. We expose each to the same time-varying gravitational potential, mimicking the effects of stellar feedback (there are no actual baryons in these runs). After 1 Gyr, the triaxial halo's averaged density profile flattens into a convincing dark matter core, but the spherical halo maintains its cusp (see Fig. 1).
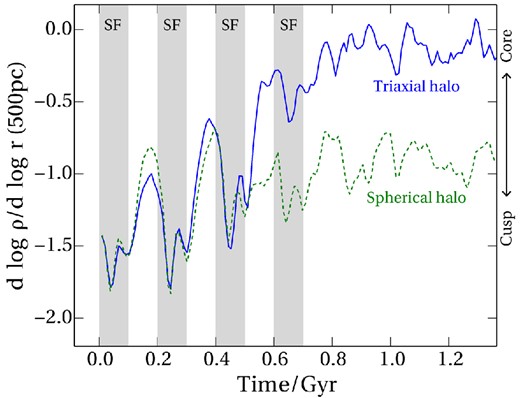
One motivation for studying the relationship between spherical and aspherical dynamics is that the conversion of a dark matter cusp into a core by baryonic processes is qualitatively different in the two cases. Here we show the inner log density slope from a numerical experiment on two haloes. One is spherical (dashed line) and the other triaxial (solid line) but their spherically averaged properties are initially identical. An external potential has been added at the centre during the times indicated by the grey bands, with the fluctuations mimicking stellar feedback. The triaxial halo develops a clear core, whereas the spherical halo almost maintains its central density cusp. A complete description and analysis is given in Section 3.5.
This example, which is fully explored in Section 3.5, illustrates how it is dangerous to use spherically symmetric simulations to infer anything about dynamics – even spherically averaged dynamics – in the real universe. A spherical system does not evolve in the same way as the spherical averages of a triaxial system.
Ignoring asphericity can also lead to observational biases (e.g. Hayashi & Navarro 2006; Corless & King 2007). From a dynamical standpoint, the nature of orbits in triaxial potentials is fundamentally different from those in spherical potentials: although the total angular momentum of any self-gravitating system must always be conserved, it is only in the spherical case that this conservation holds for individual particles. Conversely, a large fraction of dark matter particles near the centre of cosmological haloes will be on box orbits which do not conserve their individual angular momenta (de Zeeuw & Merritt 1983; Merritt & Valluri 1996; Holley-Bockelmann et al. 2001; Adams et al. 2007). One practical consequence is that asphericity may be responsible for filling the loss cones of supermassive black holes at the centre of the corresponding galaxies (Merritt & Poon 2004).
Finally, it is known that asphericity plays a fundamental role in setting the equilibrium density profile during gravitational cold collapse (e.g. Huss, Jain & Steinmetz 1999). The underlying process is known as the radial orbit instability (ROI; Henon 1973; Saha 1991; Huss et al. 1999; MacMillan, Widrow & Henriksen 2006; Bellovary et al. 2008; Barnes, Lanzel & Williams 2009; Maréchal & Perez 2009); a related effect was discussed by Adams et al. (2007). The name arises because particles on radial orbits are perturbed on to more circular trajectories. At the same time, the density distribution becomes triaxial. Even in the case of a uniform spherical collapse, this symmetry-breaking process is still triggered, presumably by numerical noise; the tangential component of forces must be unphysically suppressed for the system to remain spherical (Huss et al. 1999; MacMillan et al. 2006).
Despite all this, assuming spherical symmetry is very tempting because it makes life so much easier. Defining spherically averaged quantities is a well-defined and sensible procedure even if we actually have the full distribution function in hand (as in simulations): departures from spherical symmetry are sufficiently small that different averaging procedures lead to consistent results (Saha & Read 2009). Additionally, when an aspherical halo is in equilibrium, we have shown numerically that a ‘sphericalized’ version of it is also in equilibrium (see appendix B of Pontzen & Governato 2013). This is helpful because it allows one to make a meaningful analysis in spherical coordinates, even when the system is aspherical. But it breaks down when out-of-equilibrium processes are included, as in the stellar-feedback-driven core-creation example above.
The present paper formalizes the idea of spherical analysis performed on aspherical systems and follows through the consequences. We will study equilibrium distribution functions in nearly, but not exactly, spherically symmetric potentials, and focus on maximally stable systems (which we define as being stable against all possible external linear perturbations). We will find that, in spherical coordinates, such systems appear to be ‘ergodic’ (meaning that their distribution functions depend on energy alone, following the terminology of Binney & Tremaine 2008) because the individual particles move randomly in angular momentum while maintaining a near-constant energy. It is important to emphasize that this describes the appearance of the system when analysed in a spherical coordinate system and the true system need not be chaotic for the result to hold, provided any isolating integrals are not closely related to angular momentum.
The formal statement of this idea is derived in Section 2. A brief overview of the required background is given in Appendix A, and a second-order derivation of the evolution is given in Appendix B. Section 3 outlines the practical consequences, starting by recasting and extending the phenomenology of the ROI. We describe an immediate implication for observational studies of aspherical systems, namely a new way to break the anisotropy degeneracy. Finally we return to the motivating problem above and explain why triaxial systems can undergo cusp–core transitions more easily than spherical systems. Section 4 concludes and points to open questions and future work.
2 ASPHERICAL DYNAMICS IN SPHERICAL COORDINATES
In this section we consider an aspherical system which is maximally stable against external linear perturbations. We assume that an observer of this system analyses it assuming spherical symmetry. We will show that this observer (falsely) concludes that the system is ergodic, i.e. that the density of particles in phase space is a function of energy alone. The derivation requires the use of action-angle coordinates; a crash course is provided in Appendix A.
2.1 Single particles
The extent of the migration will depend on the nature of the potential in which a particle orbits. To quantify this requires going beyond linear perturbation theory and is the subject of ‘KAM theory’ after Kolmogorov (1954), Arnold (1963) and Moser (1962); see e.g. Binney & Tremaine (2008), Goldstein, Poole & Safko (2002), Lichtenberg & Lieberman (1992) for introductions. Colloquially the result is that for any given small perturbation the migration of typical orbits is also small. Arnold diffusion offers the most famous route to more significant diffusion through action space (see Lichtenberg & Lieberman 1992); but in our case, there is a more immediate reason why the KAM result does not in fact hold. Specifically, KAM theory relies on the frequencies |$\boldsymbol {\Omega }(\boldsymbol {J})$| being non-degenerate – i.e. that any change in the action leads also to a change in the frequencies, thus shutting off resonant migration. In smooth potentials, Ω is almost a function of energy alone (see Appendix A3) and so the migration can be substantial.
Overall, we informally expect particles to redistribute themselves randomly within the action shell of fixed background energy until they are evenly spread, implying a distribution function that appears ergodic in a spherical analysis. This does not imply the orbits are chaotic in the traditional sense; it is only because we are analysing an aspherical system in spherical coordinates that the phenomenon arises. With this in mind, we now turn to a more formal demonstration of the result.
2.2 The distribution function
So far, we have discussed how a single particle orbiting in a mildly aspherical potential does not conserve its spherical actions (e.g. angular momentum). We informally suggested that a population will appear to ‘randomize’ the spherical actions at fixed energy. We now show more formally that a distribution function of particles subject to aspherical perturbations will be most stable when it is spread evenly on surfaces of constant H0.
This is the core result claimed at the start of the section: f0 = f0(H0), i.e. the distribution function implied by a spherical analysis appears to be ergodic. It is not a necessary condition for achieving equilibrium, since for any given aspherical system certain |$\delta H_{\boldsymbol {n}_{\perp }}$| will be zero. Rather, the result should be read as applying to the maximally stable distribution function – a distribution function that can self-stabilize under any linear perturbation to its potential.
We again emphasize that the distribution function f0 is fictional. There is no sense in which the true distribution function, f, is actually ergodic. The statement is about how the system appears to be when it is analysed using spherically averaged quantities, equation (9). Yet, it establishes a way in which we can understand these spherically averaged quantities in a systematic way – the system is most stable if it appears ergodic, regardless of what the underlying dynamics is really up to. In the remainder of this paper we will refer to such systems as ‘spherically ergodic’ (SE).
2.3 Testable predictions
We have established that systems which appear to be ergodic in a spherical analysis are maximally stable. Now we need to devise a connection to observable or numerically measurable quantities.
Intuitively, a SE system (in the sense defined in the previous section) should therefore be approximately isotropic. However one has to handle that expectation with a little care because the true population f is not ergodic and the measured velocity dispersions, even in spherical polar coordinates, may inherit information from f that is not present in f0.
The most familiar action is the specific scalar angular momentum j. Because it is a scalar for each particle, averages over this quantity do not express anything about a net spin of the halo but rather about the mix of circular and radial orbits, just like the traditional velocity anisotropy. Radially biased populations have 〈j〉 ≃ 0 whereas populations on circular orbits have 〈j〉 = jc, where jc is the maximum angular momentum available at a given energy. So, velocity anisotropy can be conveniently represented in terms of the mean scalar angular momentum.
3 EXAMPLE APPLICATIONS
So far, we have motivated and derived a formal result that aspherical systems are most stable when they appear ergodic in spherical coordinates. We derived one practical consequence for the angular momentum distribution, equation (17), which in an approximate sense states that the velocity distribution will appear isotropic. We are now in a position to test whether numerical simulations actually tend towards this maximally stable limit in a variety of situations, beginning with cosmological collisionless dark matter haloes.
3.1 Cosmological dark matter haloes
Let us re-examine the three high-resolution, dark-matter-only zoom cosmological simulations used in the analysis of Pontzen & Governato (2013). The three each have several million particles in their z = 0 haloes which correspond in turn to a dwarf irregular, L⋆ galaxy and cluster. The force softening ϵ, virial radius r200 (at which the mean density enclosed is 200 times the critical density) and virial masses M200 are 65, 170, 690 pc; 98, 301, 1430 kpc and 2.8 × 10¹⁰, 8.0 × 10¹¹, 8.7 × 10¹³ M⊙ respectively. For further details see Pontzen & Governato (2013).
The upper panel of Fig. 2 shows the anisotropy for our cosmological haloes. To compare the three directly, we scale the radius by rmax (respectively 27, 57 and 340 kpc), the radius at which the circular velocity (GM(< r)/r)1/2 reaches its maximum, vmax (=56, 150 and 610 km s−1). We restrict attention to the region well within the virial radius; here, the anisotropy β(r) typically lies between the purely radial and isotropic cases (e.g. Bellovary et al. 2008; Navarro et al. 2010).
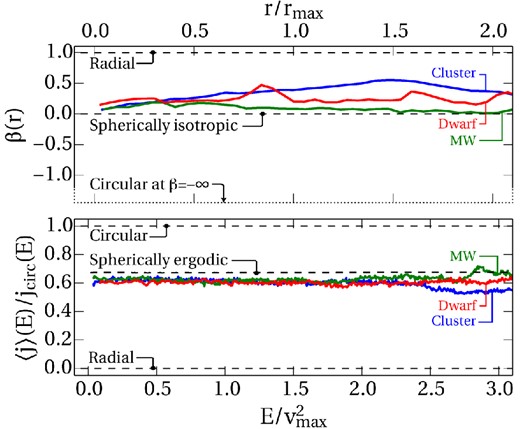
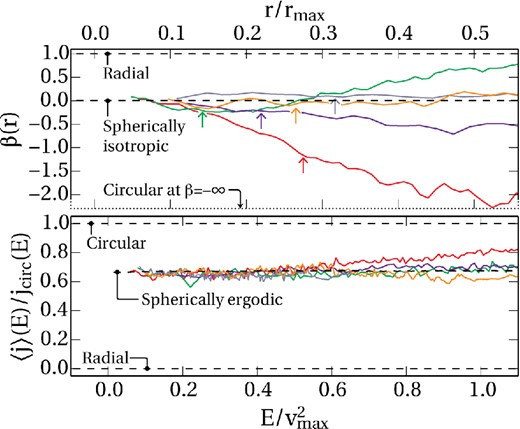
The velocity anisotropy of the inner parts of three sample high-resolution cosmological dark matter haloes (simulated without baryons), plotted as a function of radius (upper panel) and in energy shells (lower panel). The upper panel shows the classic velocity anisotropy β(r) defined in the text, for which a purely radial population has β = 1 and a population on circular orbits β = −∞. The lower panel shows our alternative in energy space which can be more precisely related to the theoretical arguments presented in Section 2; here 〈j〉(E)/jcirc = 0 for radial orbits and 1 for circular orbits, and approximately 2/3 for an isotropic population. Both panels show that the haloes have near-isotropic orbits with a slight radial bias. The range of the two plots is roughly comparable, but we caution that the mapping from r to E is not unique (see Fig. 3).
We plot 〈j〉(E)/jcirc(E) in bins containing 1000 particles each in the lower panel of Fig. 2. To facilitate comparison with the top panel, a population on purely radial orbits would have β = 1 and 〈j〉/jcirc = 0, whereas a purely circular distribution function corresponds to β = −∞ or 〈j〉/jcirc = 1. Isotropic, purely spherical populations have β(r) = 0 and 〈j〉/jcirc ≃ 2/3 as discussed at the end of Section 2.3. When compared against each other in this way, the two panels agree well: the populations are on near-isotropic orbits with a slight radial bias.
That said, a detailed comparison as a function of radius is hard because particles at a given radius r have a wide spread of energies E. Fig. 3 illustrates this relationship for the ‘MW’ halo. The density shows the probability of a particle at radius r also having specific energy E, p(E|r). The minimum E at each r is set by Φ(r), which gives the energy of a particle at apocentre (solid line). A more typical E is given by the energy of a circular orbit at r (dashed line), and this gives some intuition for mapping results from the top panel of Fig. 2 on to the bottom panel. However, any E exceeding Φ(r) is theoretically possible. So β at any given radius actually represents an average over particles of many different energies.
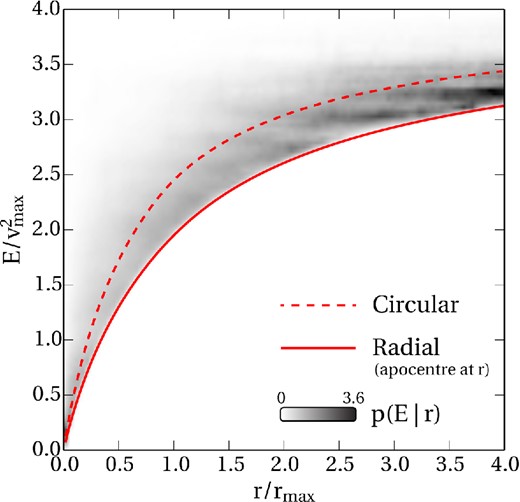
The relationship between r/rmax and E/vmax2 for circular orbits (dashed line), radial orbits at apocentre (solid line) and particles in the ‘MW’ run (density shows the number of particles with energy E at each radius r). The mapping between energy and radius is fuzzy, so that anisotropy at high E can easily contaminate β(r) at small r.
Before moving on, we should remind ourselves that 〈j〉(E) was just one of many possible tests for SE populations that follow from equation (15); we chose it because it ties most closely to the better-known β(r) statistic. Therefore, a population close to the dashed lines in Fig. 4 could in principle look far from being ergodic by other measures. For example, instead of being evenly spread in angular momentum, the individual particles could all cluster tightly around the mean value j ≃ 2jc/3. We have checked for all results in this paper that the particles really do spread evenly through j/jc between zero and one [noting that there is a degeneracy factor arising from the jz direction, so that p(j) ∝ j]. However for simplicity, all our figures focus on the 〈j〉(E) relation.
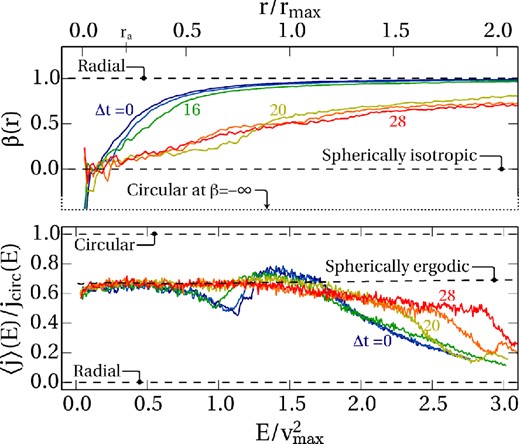
The β(r) velocity anisotropy (upper panel) and its equivalent in energy space 〈j〉(E) (lower panel, as Fig. 2) for the evolution over time of a halo that is initially in equilibrium, but unstable against the ROI. The initial conditions are represented by the dark blue line, t = 0; there is a delay of 12tdyn before any significant evolution can be seen (light blue line). Subsequent lines are shown every 4tdyn. Once the instability kicks in and generates aspherical perturbations, there is a rapid evolution towards the predicted SE limit (lower panel).
3.2 The classical radial orbit instability
Having established that, loosely speaking, 〈j〉(E) represents the anisotropy in energy shells in the same way that β(r) does in radial shells, we can return to our prediction (Section 2.3) for the former quantity, which is shown by the dashed line in the lower panel of Fig. 2. The prediction is almost, but not quite, satisfied in cosmological dark matter haloes. Since the condition is only reached in a maximally stable object, approximate agreement is an acceptable situation.
Because cosmological haloes initially form from near-cold collapse, the ROI (van Albada 1982; Barnes, Hut & Goodman 1986; Saha 1991; Weinberg 1991) is invoked to explain how the radially infalling material gets scattered on to a wider variety of orbits (MacMillan et al. 2006; Bellovary et al. 2008; Barnes et al. 2009), isotropizing the velocity dispersion. Most tellingly, numerical experiments by Huss et al. (1999); MacMillan et al. (2006) show that suppressing the instability (by switching off non-radial forces) results in a qualitatively different density profile as the end-point of collapse. We will now show that the isotropization of velocity dispersion during the ROI can be interpreted in terms of an evolution towards stability in the terms of Section 2. A similar analysis can be applied to populations on initially tangentially biased orbits (Barnes et al. 1986), but we will focus here on the radial case since it is of more cosmological relevance (see Introduction).
Consider what happens to a halo that is intentionally designed to be unstable. First, we will show the classic ROI at work by constructing a spherical halo with particles that are on radially biased orbits. We initialize our particles such that they solve the Boltzmann equation and so are stable in exact spherical symmetry. In practice, however, the strong radial bias means that any slight numerical noise will trigger the ROI. By initializing an unstable equilibrium in this way, we avoid confusion from violent relaxation processes associated with out-of-equilibrium collapse (Lynden-Bell 1967).
Our expectation that numerical noise triggers the ROI is borne out by the numerical experiment. The upper panel of Fig. 4 shows the radial anisotropy β(r) over time. We have defined a single dynamical time, tdyn, at the peak of the velocity curve so that tdyn ≡ rmax/vmax. The six solid lines show the population at t = 0, 12, 16, 20, 24 and 28 dynamical times. At first, β(r) appears stable, but suddenly after 16 tdyn it becomes considerably more isotropic. (This time-scale is sensitive to the particle resolution, although quite weakly; with half the number of particles, each double the mass, the instability sets in around 2 tdyn earlier.) At the same time, asphericity in the potential develops. To demonstrate this, we determine the inertia tensor of the entire density distribution and calculate the ratio of the principal axes; at t = 0, the ratio is 1.0 by construction. By 16 tdyn the ratio is 1.8. It stabilizes at around 26 tdyn with a ratio of 4.3.
This is symptomatic of the classic ROI in action. We can follow the same process from our energy/angular-momentum standpoint in the bottom panel of Fig. 4. The initial conditions (Δt = 0) have a kink in them, with most regions of energy space appearing radially biased but some showing a slight circular preference (around E ≃ 1.5vmax2). We verified that this is an artefact of the Opsikov–Merritt construction and is consistent with the radial β(r) being radially biased everywhere; recall Fig. 3 shows that the relationship between r and E is non-trivial.
As time progresses, the 〈j〉(E) distribution correctly tends towards the SE limit, as predicted. The SE limit is attained to good accuracy for energies E < vmax2 by Δt = 20 tdyn. At larger energies, it is likely difficult to achieve SE because of the long time-scales and weak gravitational fields involved. Like 〈j〉, β(r) at 28 tdyn shows an isotropic distribution at the centre (r → 0); but β(r) > 0 everywhere for r > 0.1 rmax. We verified that this continuing radial bias throughout the halo is produced by a number of high-energy, loosely bound particles plunging through, i.e. the high-E particles from the lower panel in Fig. 4 pervade all radii in the upper panel.
Let us briefly recap: what we have so far discussed provides a new view of an existing phenomenon. We have recast the ROI and its impact on spherically averaged quantities as an evolution towards an analytically derived maximally stable class of distribution functions. Viewed in energy shells instead of radial shells, the distinction between the regions that reach the SE limit and the slowly evolving, loosely bound regions that remain radially biased is considerably clearer. Now, because our underlying analytic result is derived without requiring the population to be self-gravitating, we can now go further and consider a different version of the ROI – and show that it continues to operate even when a system is in a completely stable equilibrium.
3.3 The continuous radial orbit instability
Our next target for investigation is to broaden the conditions: according to the results of Section 2, a subpopulation of particles should undergo something much like the ROI even when the global potential is completely stable. A suitable name for this phenomenon would seem to be the ‘continuous ROI’, since it continues indefinitely after the global potential has stabilized.
We perform another numerical experiment to demonstrate the effect. First, to avoid confusion from cosmological infall and tidal fields, we create a stable, isolated, triaxial cosmological halo by extracting from our cosmological run a region of 3r200 around our ‘Dwarf’. We then evolve this isolated region for 2 Gyr to allow any edge effects to die away, and verify that the density profile out to r200 is completely stable. As before we define a dynamical time for the system of tdyn ≡ rmax/vmax = 470 Myr.
After the 2 Gyr ≃ 4tdyn has elapsed, we select all particles with j < 0.2 jcirc. These particles are, at the moment of selection, on preferentially radial orbits. We trace our particles forward through time, measuring 〈j〉(E) in each snapshot. The results are shown in Fig. 5 for various times between Δt = 0.0 and 4.0 tdyn after selection. Over this period, the mean angular momentum significantly increases towards the SE limit at every energy. The changes are much faster at low energies where the particles are tightly bound and the local dynamical time is short compared to the globally defined tdyn.
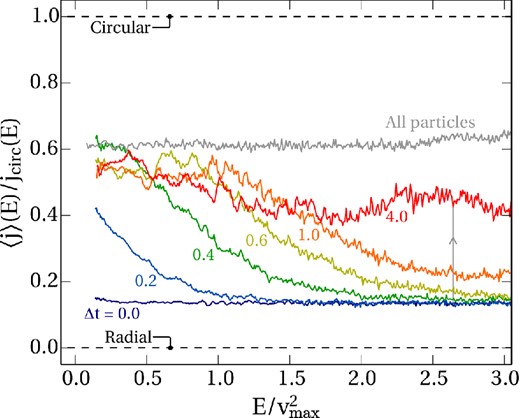
The mean angular momentum of particles as a function of energy, like the lower panel of Fig. 4 – but now for a subpopulation in a dark matter halo that is globally in equilibrium. At Δt = 0, we select particles on predominantly radial (j/jcirc < 0.2) orbits; at later times, the subpopulation mean evolves back towards the population mean. The lines from bottom to top show the state at selection and after 0.2, 0.4, 0.6, 1.0 and 4.0 tdyn, respectively.
The evolution is rapid until 4 tdyn after which the 〈j〉(E) remains near-static (except at E > 2.5vmax2 where it continues to slowly rise). Eventually the subpopulation has 〈j〉(E) ≃ 0.5jcirc(E) independent of E. This establishes that particles at low angular momentum within a completely stable, unevolving halo, automatically evolve towards higher angular momentum. After a few dynamical times, their angular momentum becomes comparable to that of a randomly selected particle from the full population, although with a continuing slight radial bias.
One can understand this incompleteness in a number of equivalent ways. Within our formal picture, it arises from the fact that only certain |$\delta H_{\boldsymbol {n}}$| are non-zero in equation (12). More intuitively, the continuing process of subpopulation evolution is being driven by particles on box orbits that change their angular momentum at near-fixed energy – but not all particles are on such orbits, and so some memory of the initial selection persists. We explicitly verified that particles selected on circular orbits also mix back into the population; the global equilibrium is maintained by particles diffusing in both directions in the angular momentum space.
3.4 Observations of dwarf spheroidal galaxies
In the previous section, we established that subpopulations on initially radially biased orbits evolve towards velocity isotropy even if the global potential is stable. We explained this in terms of our earlier calculations, and now turn to how the results might impact on observations.
An important current astrophysical question is how dark matter is distributed within low-mass galaxies: this can discriminate between different particle physics scenarios (Pontzen & Governato 2014). The smallest known galaxies, dwarf spheroidals surrounding our Milky Way, in principle provide a unique laboratory from this perspective. But determining the distribution of dark matter is a degenerate problem because of the unknown transverse velocities of the stellar component (e.g. Charbonnier et al. 2011). Furthermore, the use of spherical analyses seems inappropriate since the underlying systems are known to be triaxial (e.g. Bonnivard et al. 2015).
This is exactly the kind of situation we set up in our initial calculations (Section 2): an aspherical system being analysed in spherical symmetry. We have shown that the results apply both to tracer and self-gravitating populations. So, we can go ahead and apply it to the stars in observed systems: the stellar population of a dwarf spheroidal system will be maximally stable if it appears ergodic in a spherical analysis. This implies a strong prior on what spherical distribution functions are actually acceptable and therefore, in principle, lessens the anisotropy degeneracy.
This idea warrants exploration in a separate paper; here we will briefly test whether the idea is feasible by inspecting some simulated dwarf spheroidal satellite systems. In particular we use a gas-dynamical simulation of ‘MW’ region (see above) using exactly the same resolution and physics as Zolotov et al. (2012); see that work for technical details (although note the actual simulation box is a different realization).
We analyse all satellites with more than 104 star particles, which gives us objects lying in the ranges 5.4 × 10⁷ < M⋆ < 4.9 × 10⁸ M⊙, 28 < vmax < 60 km s−1 and 4.6 < rmax < 9.6 kpc. We first verified that these do not host rotationally supported discs; we then calculated β(r) profiles between 3ϵ ≃ 0.5 kpc and 0.6 rmax. The stellar half-light radius is 0.15 < r1/2/rmax < 0.3, so our calculations extend into the outer edges of each visible system.
The results are shown in the upper panel of Fig. 6, with arrows indicating r1/2. The outer regions display a range of different behaviours from strongly radial to circular. However, in each case the β(r) is nearly isotropic as r → 0. This is consistent with a view in which the centres have achieved stability while the outer parts are being harassed by the parent tides and stripping.
The β(r) (upper panel) and 〈j〉(E) (lower panel) relations for the stellar populations of dwarf satellites around a Milky Way-like central. In the upper panel arrows indicate the location of r1/2, the radius enclosing half the stellar mass. The profile is plotted exterior to 3ϵ where ϵ is the softening length. Because of the tidal interaction with the parent galaxy, the outer parts of each object are out of equilibrium and display biases ranging from strongly radial to circular. The lower panel shows the same populations in energy space. At low energies, tightly bound particles are now seen to be close to the SE limit. At higher energies, a spread is seen but not as large as would naively be expected from the β(r) relation.
The picture is reinforced by considering the 〈j〉(E) statistic (lower panel of Fig. 6). Here, stars on tightly bound orbits (small E) are very close to the SE limit. In the less-bound regions, the agreement worsens. However, a quantitative analysis using the approximate relation (21) shows that the 〈j〉(E) relation stays much closer to the SE limit than the β(r) relation naively implies. This is probably because the shape of β(r) is in part determined by out-of-equilibrium processes, coupled to the multivalued relationship between r and E (Fig. 3).
In any case these results suggest that we should adopt priors on spherical Jeans or Schwarzschild analyses that strongly favour near-isotropy in the centre of spheroidal systems – or, more accurately, strongly favour near-ergodicity for tightly bound stars. In future work we will expand on these ideas and apply them to observational data, since they could lead to a substantial weakening of the problematic density–anisotropy degeneracies.
3.5 Dark matter cusp–core transitions
In Pontzen & Governato (2012, hereafter PG12) we established that dark matter can be redistributed when intense, short, repeated bursts of star formation repeatedly clear the central regions of a forming dwarf galaxy of dense gas (see also Read & Gilmore 2005; Mashchenko, Couchman & Wadsley 2006). The resulting time-changing potential imparts net energy to the dark matter in accordance with an impulsive analytic approximation. This type of activity has now been seen or mimicked in a large number of simulations, allowing glimpses of the dependency of the process on galactic mass, feedback type and efficiency (Governato et al. 2012; Martizzi et al. 2012; Peñarrubia et al. 2012; Zolotov et al. 2012; Garrison-Kimmel et al. 2013; Teyssier et al. 2013; Di Cintio et al. 2014; Oñorbe et al. 2015).
We based our PG12 analysis on 3D zoom cosmological simulations, but our analytic model assumed exact spherical symmetry. By definition, in the analytic model all particles conserve their angular momentum at all times. Taken at face value, energy gains coupled to constant angular momentum would leave a radially biased population in the centre of the halo.
The top panel of Fig. 7 shows the measured velocity anisotropy in the inner 5 kpc for the zoom simulations in PG12 at z = 0; the solid line shows the feedback simulation which has developed a core, whereas the dotted line shows the dark-matter-only simulation which maintains its cusp. The difference between the two cases is the opposite to that naively expected: the centre of the cored halo has a more isotropic velocity dispersion than the centre of the cusped halo. The lower panel shows the equivalent picture in energy space [noting that Φ(0) = 0 and Φ(5 kpc) = 3 790 km2 s−2]. For clarity only a small fraction of the 0 < j/jcirc < 1 interval is now plotted; the differences between the cusped (dotted) and cored (solid) lines are relatively small, but significant. At all energies the cored profile has more angular momentum than the cusped profile; in fact, it lies right on the SE limit (dashed line) whereas the cusped profile is biased by around 0.06 to radial orbits.1
![The velocity anisotropy [β(r), upper panel] and angular momentum [〈j〉(E), lower panel] for cusped and cored haloes from PG12; note the much-expanded y-axis scales relative to previous figures, which are required to highlight the differences. The cored cases (solid lines) are almost perfectly SE (lower panel) and hence isotropic (upper panel). This contrasts with the cusped case (dotted lines) which has a slight but significant radial bias (seen as high β in the upper panel and low j in the lower panel).](https://oup.silverchair-cdn.com/oup/backfile/Content_public/Journal/mnras/451/2/10.1093/mnras/stv1032/2/m_stv1032fig7.jpeg?Expires=1749937546&Signature=NptEXO5p2A3yZohS7lyZI4lDGJntAcvLKv4RSol8E4jywnY1B59BBjM7q0893FkR5fTtPwZ883qti7qoM27ejWaUxtSXt-iREKaHuIe7WypwmT4rp4dugpFY~ayd-ptnUQ7CoS830iC5uGV~DS4cCVwKoMFer6ptBhTRGdT6JZ1IKZxSLYrLYxrZtK3gCdRF8A16vqruAY4Bpy3toyq6SZmOGQmio26blqqd2ultOQJ4nV05Ky8owbnTExYef4vAaC5OxKI29J4YCZDo9YhsM~I6TDgAAd-Xdtr0sRgxfNPgpp21fQCsW~cMXA0dMj9XRx8eKoThKbdRIhBUZWdHpw__&Key-Pair-Id=APKAIE5G5CRDK6RD3PGA)
The velocity anisotropy [β(r), upper panel] and angular momentum [〈j〉(E), lower panel] for cusped and cored haloes from PG12; note the much-expanded y-axis scales relative to previous figures, which are required to highlight the differences. The cored cases (solid lines) are almost perfectly SE (lower panel) and hence isotropic (upper panel). This contrasts with the cusped case (dotted lines) which has a slight but significant radial bias (seen as high β in the upper panel and low j in the lower panel).
While the PG12 model correctly describes the energy shifts, it misses the angular momentum aspect of core-creation, which has been emphasized elsewhere (e.g. Tonini, Lapi & Salucci 2006). We will now show that a complete description of cusp–core transitions involves two components: energy gains consistent with PG12, and re-stabilization of the distribution function consistent with the description of Sections 2.2 and 3.3. We again use the ramses code to follow isolated haloes with particle mass 2 × 10⁴ M⊙; however we adapted the code to add an external, time-varying potential to the self-gravity. The time-stepping is calculated adaptively for each particle based on the cell crossing and free-fall times and so is automatically adjusted in the modified potential.
We took our stabilized, isolated, triaxial dark matter halo extracted as described in Section 3.3 and created a sphericalized version of it as follows. For each particle we generate a random rotation matrix following an algorithm given by Kirk (1992), then multiply the velocity and position vector by this matrix. Finally, we verified that the final particles are distributed evenly in solid angle, and that the spherically averaged density profile and velocity anisotropy are unchanged. The triaxial and spherical haloes are both NFW-like and stable over more than 2 Gyr when no external potential is applied.
For our science runs, we impose an external potential corresponding to 108 M⊙ gas in a spherical ball 1 kpc in radius, distributed following ρ ∝ r−2; this implies a potential perturbation of ΔΦ = −700 km2 s−2 at 500 pc, for instance. The potential instantaneously switches off at 100 Myr, back on at 200 Myr, off at 300 Myr and so forth until it has accomplished four ‘bursts’. The period and the mass in gas are motivated by figs 1 and 2 of PG12 and fig. 7 of Teyssier et al. (2013). We also tried imposing potentials with different regular periods and with random fluctuations, none of which altered the behaviour described below.
The top two panels of Fig. 8 show the time-dependent behaviour of the central, most-bound 0.1 per cent of particles. The triaxial and spherical halo results are illustrated by solid and dashed lines, respectively. The top panel shows how the coupling of the external potential is similar; in particular, it results in a mean increase in specific energy of ΔE ≃ 200 km2 s−2 for particles in both cases. The final shift in the spherical case is slightly larger than that in the triaxial case, a difference which is unimportant for what follows (it would tend to create a larger core if anything).
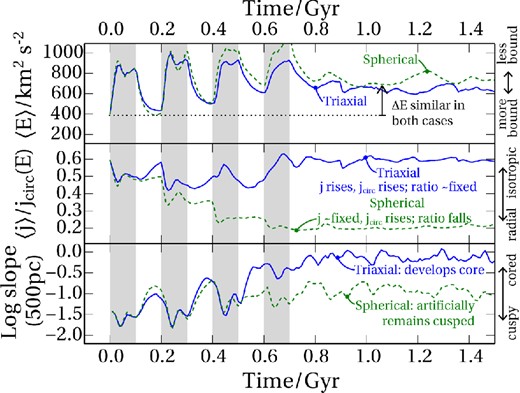
The PG12 mechanism is reproduced by adding an external potential (to mimic ‘gas’) to a DM-only simulation for the time intervals indicated by the grey bands. We measure the response of a completely spherical halo (dotted lines) and a realistically triaxial halo (solid lines) as described in the text. In both cases we track the mean energy (top panel) and angular momentum (middle panel) of the 0.1 per cent of particles that start out most bound. We also measure the log slope of the density profile at each time output (bottom panel). The energy shift (top) predicted by PG12 is found to hold in both cases. In the spherical case, the angular momentum remains constant up to discreteness effects; it therefore drops relative to the circular angular momentum (middle panel). Conversely, in the triaxial case, the continuous ROI causes the angular momentum to rise in proportion to jcirc. Only when the angular momentum is allowed to rise does a significant core form, meaning that the spherical case unphysically suppresses core formation (lower panel).
The middle panel displays the mean specific angular momentum j of the same particles as a fraction of the circular angular momentum jcirc(E). In the spherical case (dashed line), this quantity drops significantly because j is fixed but jcirc is rising over time (since it increases with E). By contrast in the triaxial case j/jcirc returns to its original value, meaning that j has risen by the same fraction as jcirc(E). This is dynamic confirmation of the discussion earlier in this section: the spherically symmetric approach predicts an increasing bias to radial orbits – whereas in the realistic aspherical case, the stability requirements quickly erase this bias.
The bottom panel of Fig. 8 shows the measured density slope α = dln ρ/dln r at 500 pc for the two experiments. Both start at α ≃ −1.5; the triaxial case correctly develops a core (with α ≃ −0.1) whereas the completely spherical case maintains a cusp (with α ≃ −0.9). This discrepancy is causally connected to the angular momentum behaviour: the mean radius of a particle increases with increasing angular momentum j, even at fixed energy E, so a typical particle migrates further outwards in the triaxial case compared to the spherical.
We can therefore conclude that asphericity is a pre-requisite for efficient cusp–core transitions. However there is a subsidiary issue worth mentioning. After about 3 Gyr we find that the spherical halo autonomously does start increasing 〈j〉/jcirc and the dark matter density slope becomes shallower. This is because the potential fluctuations have generated a radially biased population which is unstable, and a global ROI is triggered by numerical noise over a sufficiently long period (as in Section 3.2).
In fact, with ‘live’ baryons rather than imposed fluctuations, there are aspherical perturbations which accelerate the re-equilibration process further and renew a global ROI (Section 3.2), encouraging the entire population towards spherical ergodicity. As we saw in Fig. 7, the cored halo from PG12 has an almost perfectly SE population for E < 3 000 km2 s−2 (unlike the cusped case). We verified that this is also true of Teyssier et al. (2013). Generating a core through potential fluctuations seems to complete a relaxation process that otherwise freezes out at an incomplete stage during collisionless collapse.
4 CONCLUSIONS
Let us return to the original question: how much do inaccuracies inherent in the spherical approximation really matter in practical situations? The answer is, unfortunately, that ‘it depends’; but we can now distinguish two cases as a rule of thumb.
For dynamical calculations or simulations, the inaccuracy matters a great deal. Neglecting the aspherical part of the potential unphysically freezes out the ROI and related effects, so can lead to qualitatively incorrect behaviour.
For the analysis of observations or simulations in equilibrium, the assumption is far more benign – it is, in fact, extremely powerful when handled with care. The underlying aspherical system and the fictional spherical system both appear to be in equilibrium; the mapping between the two views yields striking insight into (for example) spheroidal stellar distribution functions and dark matter halo equilibria.
These conclusions are based on the fact that, when aspherical systems are analysed in spherical coordinates, there is an attractor solution for the spherically averaged distribution function f0 – namely, it tends towards being ergodic (i.e. f0 is well-approximated as a function of energy alone). We demonstrated this using Hamiltonian perturbation theory (see Section 2 and Appendix B), and subsequently used the term ‘spherically ergodic’ to describe a distribution function f with the property that its spherical average f0 is ergodic in this way.
The result follows because the orbits do not respect spherical integrals-of-motion such as angular momentum. Note, however, that the physical orbits may still possess invariants in a more appropriate set of coordinates. The apparent chaotic behaviour and tendency of particles to spread evenly at each energy is a helpful illusion caused by adopting coordinates that are only partially appropriate.
In Section 3 we showed that the idea has significant explanatory power. First, we inspected the selection of equilibrium in triaxial dark matter haloes (Section 3.1) which led us to consider the classical ROI (Section 3.2). We demonstrated that the instability naturally terminates very near our SE limit (lower panel, Fig. 4). Particles at high energies have long dynamical times which causes them to freeze out: they evolve towards, but do not reach, the SE limit. Because these high-energy particles often stray into the innermost regions (Fig. 3), the velocity anisotropy β(r) continues to display a significant radial bias at all r after the instability has frozen out. Moreover in the case of self-consistently formed cosmological haloes (Fig. 2), even at low energies there is a slight radial bias. The bias is only erased when a suitable external potential is applied (e.g. during baryonic cusp-core transformations), forcing the system to stabilize itself against a wider class of perturbations than it can self-consistently generate (Fig. 7); we will return to this issue momentarily.
One novel aspect of our analysis compared to previous treatments of the ROI is that it applies as much to tracer particles as to self-gravitating populations. As a first example, in Section 3.3 we demonstrated how a subset of dark matter particles chosen to be on radially biased orbits mix back into the population (Fig. 5). This is the case even for haloes that, as a whole, are in stable equilibrium; therefore we referred to the phenomenon as a ‘continuous’ ROI.
The same argument implies that stars undergo the ROI as easily as dark matter particles. In particular, without a stable disc to enforce extra invariants, dwarf spheroidal galaxies likely have stellar populations with a near-SE distribution (Section 3.4; Fig. 6). This provides a footing on which to base spherical Jeans or Schwarzschild analyses of observed systems: it implies an extra prior which can be formulated loosely as stating that β(r) → 0 as r → 0. Such a prior could be powerful in breaking the degeneracy between density estimates and anisotropy (e.g. Charbonnier et al. 2011), in turn tightening limits on the particle physics of dark matter (Pontzen & Governato 2014).
As a final application, we turned to the question of the baryonic processes that convert a dark matter cusp into a core (Section 3.5). Angular momentum is gained by individual particles during the cusp-flattening process (Tonini et al. 2006) but our earlier work (especially PG12) has focused primarily on the energy gains instead. In Fig. 8 we see that, in spherical or in triaxial dark matter haloes, time-dependent perturbations (corresponding to the behaviour of gas in the presence of bursty star formation feedback) always lead to a rise in energy. However, in the spherical case the mean angular momentum as a fraction of jcirc drops because the angular momentum of each particle is fixed, whereas jcirc rises with E. Only in the triaxial case does 〈j〉/jcirc stay constant, indicating a re-isotropization of the velocities. We tied the increase in 〈j〉 to the continuous ROI which always pushes a population with low 〈j〉/jcirc back towards the SE limit (Section 3.3). The consequence is that – in realistically triaxial haloes – the final dark matter core size will be chiefly determined by the total energy lost from baryons to dark matter, with little sensitivity to details of the coupling mechanism.
Although the PG12 model can be completed neatly in this way, other analytic calculations or simulations based on spherical symmetry will need to be considered on a case-by-case basis. In our exactly spherical test cases (Fig. 8), core development is substantially suppressed. This certainly cautions against taking the results of purely spherical analyses at face value. On the other hand, any slight asphericity is normally sufficient to prevent the unphysical angular-momentum lock-up – in particular, we verified that the simulations in Teyssier et al. (2013) were unaffected by this issue because their baryons settle into a flattened disc. The analytic result is generic, so the exact shape and strength of the asphericity is a secondary effect in determining the final spherically averaged distribution function f0.
That said, to understand the way in which f0 actually evolves towards the SE limit (and perhaps freezes out before it gets there) requires going to second order in perturbation theory, as shown in Appendix B. At this point it may also become important to incorporate self-gravity, i.e. the instantaneous connection between δf and δH. This approach has been investigated more fully elsewhere, leading to a different set of insights regarding the onset of the ROI (e.g. Saha 1991) as opposed to its end state. The present work actually suggests that the ROI can be cast largely as a kinematical process, and that the self-gravity is a secondary aspect; it would be interesting to further understand how these two views relate. But of more immediate practical importance is to apply the broader insights about dwarf spheroidal stellar equilibria to observational data, something that we will attempt in the near future.
All simulation analysis made use of the pynbody suite (Pontzen et al. 2013). We are grateful to the anonymous referee for helpful comments. AP acknowledges conversations with James Binney, Simon White, Chervin Laporte and Chiara Tonini as well as support from the Royal Society and, during 2013 when a significant part of this work was undertaken, the Oxford Martin School. JIR acknowledges support from SNF grant PP00P2_128540/1. FG acknowledges support from HST GO-1125, NSF AST-0908499. NR is supported by STFC and the European Research Council under the European Community's Seventh Framework Programme (FP7/2007-2013)/ERC grant agreement no 306478-CosmicDawn. JD's research is supported by Adrian Beecroft and the Oxford Martin School. This research used the DiRAC Facility, jointly funded by STFC and the Large Facilities Capital Fund of BIS.
The dashed line for the isotropic j/jcirc in the lower panel is calculated using the cored potential. However the dependence on potential is very weak, as discussed in Section 3; calculating it instead with the cusped potential leads to differences of less than one per cent at every energy.
REFERENCES
APPENDIX A: BACKGROUND
A1 A brief review of actions
Although the complexity of expression (A8) appears to make using the actions cumbersome, the great simplification it brings to the equations of motion in the background (i.e. equation A3) makes the perturbation theory tractable. For that reason we have used the action-angle coordinates in our analytic derivation, Section 2, but avoided them when discussing results from simulations in Section 3.
A2 Perturbed trajectories in the harmonic oscillator case
Section 2 used Hamiltonian perturbation theory to discuss the behaviour of particles in aspherical potentials. To connect this more firmly with the equations of motion, it can be helpful to study orbits in a specific potential and connect the solutions with the more general statements made by the perturbation theory. In this Appendix, we use the harmonic oscillator as such an illustrative example.
On the other hand, the angular momentum does change significantly. We can see this as follows: each of x, y and z undergoes oscillation at the frequencies ω0, (1 + ϵ)1/2ω0 and (1 − δ)1/2ω0, respectively. Assuming these new frequencies are not commensurate, the relative phases between the different oscillations slowly shift until at some point all three separated oscillators reach x = 0, y = 0 and z = 0 at the same moment. At this point, since the velocity remains finite, the angular momentum has become zero. It may take a number of dynamical times before this happens, but (for example) at the centre of dark matter haloes the dynamical time is very short compared to the Hubble time so angular momentum conservation is effectively destroyed.
All the above is illustrated in Fig. A1. The left panel contrasts the orbits for a spherical harmonic oscillator (dashed line) and an aspherical oscillator (solid line) projected in the (x, y) plane. The latter obeys equation (A9) with ϵ = δ = 0.1 (and the former with ϵ = δ = 0). The orbits for the spherical case are closed because the frequencies are identical, so the relative phase of the x and y part of the motion remains fixed. Orbits in the aspherical potential are more complex as the relative phase of the Cartesian components gradually changes; in fact, a particle will sometimes plunge through the centre of the potential. This is known as a ‘box orbit’. In more general triaxial potentials, a variety of orbit types are possible (e.g. Merritt & Valluri 1996); the importance of these will be considered momentarily.
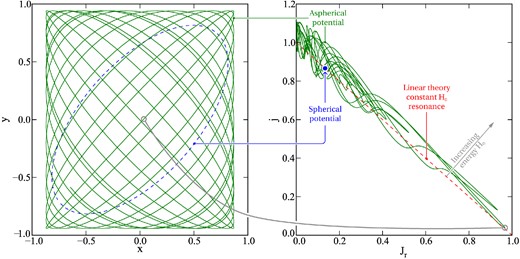
An example orbit in a 3D anisotropic harmonic oscillator. Left: the solid line shows a portion of the orbit projected into the x-y plane. The equivalent orbit in an isotropic potential is closed and given by the blue dashed line. Right: the orbit analysed in terms of Jr and j, the actions for the spherical background Hamiltonian. Because ΔH is bounded (see text) the particle has to stay within a narrow band in the Jr-j plane, corresponding to the linear theory resonance (dotted line). The blue dot shows the action for the orbit in the spherical potential (for which the actions are by definition fixed).
The same portion of the orbit is illustrated in the right panel, but now projected into the spherical actions plane (Jr, j). For the spherical case, Jr and j are exactly conserved by construction and the orbit appears as a single point. In the aspherical case (solid line), Jr and j are not even approximately conserved over more than a dynamical time. However, even then, the orbit remains close to the dashed line of constant H0, as required by equation (A11) and more generally by equation (8). From this figure, it is intuitively plausible that the particle is equally likely to be found anywhere along the constant H0 contour, which is the essential result of Section 2.2.
The harmonic oscillator orbits discussed above are all box orbits. More general triaxial potentials support other orbit types (loop orbits, for example, which are much more tightly constrained; or chaotic orbits, which are even less tightly constrained than box orbits). However the Hamiltonian analysis in the main text is general for all these types of possible orbit. The fraction of different orbit types will determine how fast and how far particles diffuse along the contour. In realistic cosmological dark matter haloes, most orbits in the central regions are indeed of the box or chaotic type (Zorzi & Muzzio 2012). Even with the baryonic contribution to the gravitational force included (which partially sphericalizes the central potential), the large majority of particles remain on the same class of orbit as the dark progenitor (Valluri et al. 2010) so long as feedback is strong enough to prevent long-lived central baryon concentrations developing (Bryan et al. 2012).
A3 The action space of dark matter haloes
The action-angle space of our equilibrium ‘Dwarf’ dark-matter-only halo is illustrated in Fig. A2, along with some particle orbits (solid lines) over 1.5 Gyr ≃ 3 tdyn. The Hamiltonian is a function of Jr and j only for any spherical potential, and so we have suppressed the third action jz. As expected, the particles explore the space, approximately running along the H0 contours, giving rise to the continuous ROI described in Section 3.3. The contours of H0 give a great deal of dynamical information, because the background frequencies are defined by |$\boldsymbol {\Omega }_0 \equiv \mathrm{\partial} H_0 / \mathrm{\partial} \boldsymbol {J}$|. These frequencies are at the core of perturbation theory through equation (6), but they also determine the higher-order behaviour as follows.
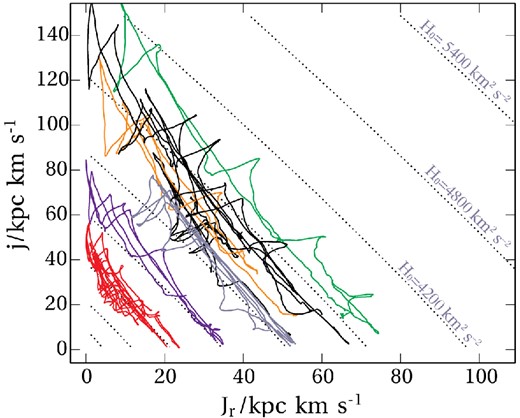
Orbits in the action space of the equilibrium ‘Dwarf’ cosmological halo. Dotted contours of constant spherical specific energy H0 are spaced at 600 km2 s−2. (For this halo |$v_{\mathrm{max}}^2 \simeq 3\,100\,\mathrm{km}^2\,\mathrm{s}^{-2}$|.) The straightness of these contours is part of the reason that orbits can efficiently explore the space, as described in the text.
The first step to understanding the behaviour of resonances is to move to secular perturbation theory (e.g. section 2.4 of Lichtenberg & Lieberman 1992). Secular analysis splits resonant orbits into two classes, known as accidentally and intrinsically degenerate. The intrinsic case refers to the situation where the resonance condition applies globally; in other words, that |$\boldsymbol {n} \cdot \boldsymbol {\Omega }_0$| is near-constant along lines of constant H0. Suppose, conversely, that |$\boldsymbol {\Omega }_0$| did vary along these directions; then, since |$\boldsymbol {\Omega }_0$| is defined by the normal to the H0 contours (|$\boldsymbol {\Omega }_0 = \mathrm{\partial} H_0/\mathrm{\partial} \boldsymbol {J}$|), this would imply a significant curvature of the dotted lines in Fig. A2. Since there is no such curvature, we can read off that the frequencies do not change and the dynamics is in the intrinsically degenerate regime, giving rise to large-scale migrations. [The same property also means that the approximation Ωr = Ωr(H0) used in reaching equation (18) will be extremely accurate.] We have established using numerical investigations that this intrinsic degeneracy property is generic to any spherical action space with smooth potentials, rather than being specific to cosmological haloes.
APPENDIX B: THE EVOLUTION OF f0
In the main text (Section 2), we showed that a distribution function f is maximally stable to linear perturbations if its sphericalized part f0 appears ergodic, f0 = f0(H0). However we did not discuss the actual evolution of f0 to see whether this limit is likely to be achieved.
