-
PDF
- Split View
-
Views
-
Cite
Cite
Ashley J. Ross, Will J. Percival, Marc Manera, The information content of anisotropic Baryon Acoustic Oscillation scale measurements, Monthly Notices of the Royal Astronomical Society, Volume 451, Issue 2, 01 August 2015, Pages 1331–1340, https://doi.org/10.1093/mnras/stv966
Close - Share Icon Share
Abstract
Anisotropic measurements of the Baryon Acoustic Oscillation (BAO) feature within a galaxy survey enable joint inference about the Hubble parameter H(z) and angular diameter distance DA(z). These measurements are typically obtained from moments of the measured two-point clustering statistics, with respect to the cosine of the angle to the line of sight μ. The position of the BAO features in each moment depends on a combination of DA(z) and H(z), and measuring the positions in two or more moments breaks this parameter degeneracy. We derive analytic formulae for the parameter combinations measured from moments given by Legendre polynomials, power laws and top-hat Wedges in μ, showing explicitly what is being measured by each in real-space for both the correlation function and power spectrum, and in redshift space for the power spectrum. The large volume covered by modern galaxy samples means that the correlation function can be well approximated as having no correlations at different μ on the BAO scale, and that the errors on this scale are approximately independent of μ. Using these approximations, we derive the information content of various moments. We show that measurements made using either the monopole and quadrupole, or the monopole and μ2 power-law moment, are optimal for anisotropic BAO measurements, in that they contain all of the available information using two moments, the minimal number required to measure both H(z) and DA(z). We test our predictions using 600 mock galaxy samples, matched to the Sloan Digital Sky Survey-III Baryon Oscillation Spectroscopic Survey CMASS sample, finding a good match to our analytic predictions. Our results should enable the optimal extraction of information from future galaxy surveys such as extended Baryon Oscillation Spectroscopic Survey, Dark Energy Spectroscopic Instrument and Euclid.
1 INTRODUCTION
The clustering of galaxies contains the imprint of the Baryon Acoustic Oscillation (BAO) scale, at a fixed comoving distance ∼150 Mpc (see e.g. Eisenstein 2005 for a review). The apparent location of the position of the feature along the line of sight (los) depends on the value of the Hubble parameter, H(z), and its apparent location transverse to the los depends on the angular diameter distance, DA(z). Thus, measurements of the clustering of galaxies along and transverse to the los allows simultaneous measurement of DA(z) and H(z) (see e.g. Hu & Haiman 2003; Padmanabhan & White 2008).
The Sloan Digital Sky Survey-III (SDSS-III; York et al. 2000) (Eisenstein et al. 2011) Baryon Oscillation Spectroscopic Survey (BOSS; Dawson et al. 2013) has provided galaxy samples large enough to robustly measure BAO scale information along and transverse to the los and thus independently measure DA(z) and H(z). Two methods have been applied to BOSS data that isolate the BAO information: ‘Wedges’ (Kazin, Sánchez & Blanton 2012; Kazin et al. 2013) and ‘Multipoles’ (Xu et al. 2013) and results using both methodologies are presented in Anderson et al. (2014).
As measurements become statistically more precise, there is an increased pressure on the analysis pipeline to ensure the extraction of information is robust. The elements of the pipeline requiring careful consideration include the models to be fitted to the data, the statistical procedure to be applied, accurate estimation of systematic errors and a precise knowledge of what is actually being measured. In this paper, we focus on the latter issue for anisotropic BAO measurements, considering the information content of moments of two-point statistics. Recently, studies such as Taruya, Saito & Nishimichi (2011), Font-Ribera et al. (2014) and Blazek et al. (2014) have also studied the information content of anisotropic clustering measurements. In our study, we build on these results by focusing purely on the DA(z) and H(z) information that can be measured via the BAO position, thereby enabling an alternative and simplified analytic treatment. Further, we focus primarily on post-‘reconstruction’ clustering measurements (Eisenstein et al. 2007), where the large-scale clustering amplitudes are expected to be isotropic. In this case, we show that moments based on polynomials of the cosine of the angle to the los (μ) are complete for any non-degenerate set of two moments that includes zero- and second-order terms. We then compare the precision of DA(z) and H(z) measurements one obtains using the Wedges and Multipoles methodology, both based on analytical predictions and empirical measurements.
Our paper is structured as follows: after developing general formulae in Section 2, we assume that information is equally distributed with respect to μ ≡ cos(θlos), equivalent to a spherically symmetric distribution and matching empirical results, and in Section 3 we predict the variance and covariance expected on DA(z) and H(z) measurements for two simple combinations of measurements: one in which a combination of the spherically averaged clustering and clustering averaged over a μp window are used, and another using Wedges split at an arbitrary μd. In Section 4, we describe how the BAO scale can be fitted using the different methodologies. In Section 5, we measure the BAO scale using 600 mock BOSS samples and compare the results obtained using each methodology, and to the results of Anderson et al. (2014). Where applicable, we assume the same fiducial cosmology as in Anderson et al. (2014): Ωm = 0.274, h = 0.7, Ωbh2 = 0.0224.
2 THE ANISOTROPIC BAO SIGNAL
In this section, we describe our formalizm for considering measurements of the projected BAO scale including an isotropic dilation and the anisotropic Alcock–Paczynski effect (Alcock & Paczynski 1979). We present our formalizm in configuration space, but our derivations are equally valid in Fourier space and therefore applicable to P(k, μ) measurements.
In real-space, the correlation function for galaxies in a thin slice in μ can be written A(μ)ξ(r′/α(μ)), where A(μ) alters the amplitude, but not the shape or BAO position. If redshift-space distortion (RSD) have been removed during a ‘reconstruction’ (Eisenstein et al. 2007) step, this also holds. Pre-reconstruction in redshift space, we need to adjust the template to be fitted to allow for correlation function shape changes (Jeong et al. 2014). If α ≠ 1, equation (5) describes a shift in the mean position of the BAO in the moment, which we denote αF, together with a ‘broadening’ of the BAO bump, which is now the superposition of α(μ), which varies as given in equation (4). For cosmological models close to the fiducial cosmology used to calculate the correlation function, the broadening is small and is degenerate with the non-linear BAO damping. Consequently information from the BAO feature width is commonly neglected, with the primary measurement being the BAO position αF. Information from the broadening was included in the anisotropic BAO measurements of Anderson et al. (2014), where models of the moments were calculated by integrating directly over ξ(r, μ). The additional constraints available from the observed shape of the BAO feature mean that the contours from any single moment in |$\alpha ^2_{||}$| and |$\alpha ^2_{\perp }$| are closed, but this closure of the contours is not important when fitting to multiple moments, which generally break this degeneracy much more strongly.
In the following, we consider particular forms for the function F(μ). The analysis should be valid for both power spectrum and correlation function analyses.
2.1 Fitting the monopole
Post-reconstruction, it is standard to ‘approximately remove’ the RSD based on the estimate of the potential obtained, leaving a clustering signal whose amplitude is approximately independent of μ (e.g. Padmanabhan et al. 2012; Burden et al. 2014). Spherical averaging to give the monopole means that there is no β-dependent term, and the dependence of the monopole will revert to the real-space value. Note that in this case, or in real-space, all equations are valid for both the correlation function and the power spectrum.
2.2 Fitting power-law moments
The Legendre polynomials form an orthogonal basis and are the standard approach to measuring anisotropic clustering. However, using such bases, we can have F(μ) < 0 for some μ, and consequently, the recovered clustering signal cannot be considered as a sum of the clustering signals in different directions (equation 6 no longer holds). The interpretation of these moments is therefore complicated as the BAO information is not compressible into a single stretch value.

Straight-line curves denote the degeneracy direction between |$\alpha ^2_{||}$| and |$\alpha ^2_{\perp }$| for various (single) clustering moments. Black dashed curves denote power-law moments |$\int _0^1\mathrm{d}\mu \mu ^p\xi (\mu )/\int _0^1\mathrm{d}\mu \mu ^p$|, which we denote μpξ, and red dotted curves denote Wedges. The solid ellipses denote the 1σ and 2σ contours for the optimal combination of two moments, as derived in the following section.
As the Legendre multipoles are simply linear combinations of power-law moments, the combination of the monopole and quadrupole will contain the same information as the combination of the monopole and the p = 2 power-law moment. Consequently, BAO fits to either the monopole and quadrupole or to the μ0 and μ2 moments will provide the same information and, similarly, including either or hexadecapole and μ4 moment will add the same information.
2.3 Fitting wedges
Fig. 1 displays the degeneracy directions between |$\alpha ^2_{||}$| and |$\alpha ^2_{\perp }$| for the two wedges split at μd = 0.5 using red dotted curves. The wedge with μ < 0.5 constrains |$\alpha ^2_{\perp }$| almost exclusively and the μ > 0.5 moment has a similar degeneracy as the μ2 power-law moment.
2.4 Fitting the quadrupole
3 ERRORS ON MEASURED MOMENTS
If we can model the distribution of signal-to-noise of modes as a function of μ, we can predict the possible constraints one may obtain on α|| and α⊥. In redshift space, on large-scales the modes have signal to noise that varies with μ, with the linear (1 + βμ2)2 term increasing the amplitude of the power spectrum, which reduces the impact of the shot noise along the los. Although the amplitude of the modes are usually renormalized with the removal of the RSD during the reconstruction process, the signal to noise remains μ-dependent, as the ‘RSD removal’ is effectively a renormalization of the redshift-space modes, rather than a removal of signal (Burden et al. 2014).
The window function will also affect the signal to noise as a function of μ in the correlation function by varying the pair numbers, and in the power spectrum by reducing the number of independent modes. However, for samples such as BOSS CMASS, the window has a negligible effect, and the statistical distribution of pairs is close to being isotropic except on very large scales. On small scales, the BAO damping is asymmetric, and radial effects such as the Fingers-of-God (FoG) become important. Thus, we might expect the distribution of signal to noise to be a complicated function of μ.
We investigate the amount of BAO information as a function of μ empirically, using the methods described in Section 4, and the post-reconstruction mock catalogues for the BOSS CMASS sample, described in Section 5. We split the data into broad bins in μ and find the mean uncertainty and variance for BAO measurements in these bins. We present this information in Table 1, which shows that the BAO information is close to having an even distribution in μ for the correlation function. Minima for the recovered uncertainty and standard deviation on the measured BAO scale are found in the 0.4 < μ < 0.6 bin. A potential explanation is that between 0 < μ < 0.5, the effects of linear RSD boost the BAO signal, but at larger μ effects such as FoG remove information and reduce the signal to noise. Regardless, this minimum is shallow: the difference in recovered uncertainty is at most 15 per cent and the results therefore justify our choice to treat the information as constant in μ.
BAO measurements on mocks as a function of μ. 〈α〉 is the mean recovered stretch parameter (the relative BAO scale in that μ window), 〈σ〉 is the mean recovered uncertainty on α, and S is the standard deviation of the recovered α.
| μ range . | 〈α〉 . | 〈σ〉 . | S . | # . |
|---|---|---|---|---|
| 0 < μ < 0.2 | 0.998 | 0.022 | 0.021 | 0 |
| 0.2 < μ < 0.4 | 1.000 | 0.021 | 0.021 | 1 |
| 0.4 < μ < 0.6 | 0.999 | 0.019 | 0.019 | 2 |
| 0.6 < μ < 0.8 | 1.001 | 0.021 | 0.020 | 3 |
| 0.8 < μ < 1.0 | 1.003 | 0.022 | 0.021 | 4 |
| μ range . | 〈α〉 . | 〈σ〉 . | S . | # . |
|---|---|---|---|---|
| 0 < μ < 0.2 | 0.998 | 0.022 | 0.021 | 0 |
| 0.2 < μ < 0.4 | 1.000 | 0.021 | 0.021 | 1 |
| 0.4 < μ < 0.6 | 0.999 | 0.019 | 0.019 | 2 |
| 0.6 < μ < 0.8 | 1.001 | 0.021 | 0.020 | 3 |
| 0.8 < μ < 1.0 | 1.003 | 0.022 | 0.021 | 4 |
One may also worry about correlation between the clustering at different μ. For the power spectrum and an infinite volume, one expects no correlation between the clustering measured at different μ. Once a survey window is applied, correlations will be induced, but for a survey the size of BOSS we expect these correlations to be small at the BAO scale. We measure the correlation between the BAO measurements in the five μ bins described in Table 1 and we display the correlation matrix in Fig. 2. We find the magnitude of correlations is at most 0.15, and we expect the power spectrum to be significantly less correlated than the correlation function. We therefore ignore any correlations between the BAO information at different μ in our analytical derivations that follow.
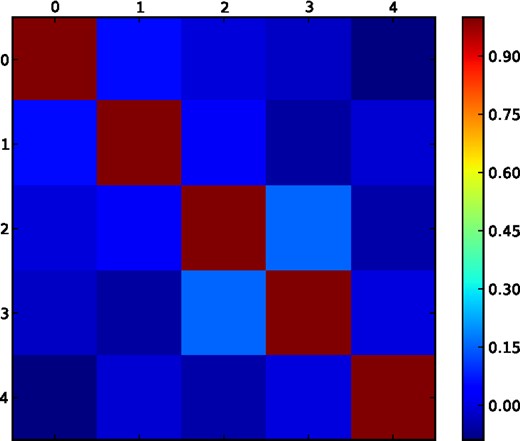
The correlation matrix of the five BAO measurements made in 0.2 thick μ bins obtained from 600 BOSS CMASS mocks, as described in Table 1 (and numbered in the same manner).
The results we presented in this section suggest that, to a good approximation, one can treat the distribution in μ of BAO information in the post-reconstruction data release 11 (DR11) BOSS CMASS sample as the same as that of an infinite real-space volume. However, the distribution for any given survey may vary based on the particular survey geometry, satellite velocities of the galaxy population (which smear the BAO feature at high μ), and the magnitude of the boost in clustering amplitude due to linear RSD effects (which boosts the high μ signal).
3.1 Complete sets of estimators
3.2 Predicted errors
For a general power-law moment, F(μ) = (1 + p)μp, equation (26) yields |$\sigma ^2_p = \frac{(p+1)^2}{1+2p}\sigma ^2_0$|. The covariance between an isotropic weighting and an arbitrary one is |$\sigma _{0,F} = \sigma ^2_0$|. This implies that, in our formulation, introducing a measurement over a second window in μ as well as the monopole, does not provide extra information on the total stretch, it only provides a way to determine the radial and transverse components of the stretch.
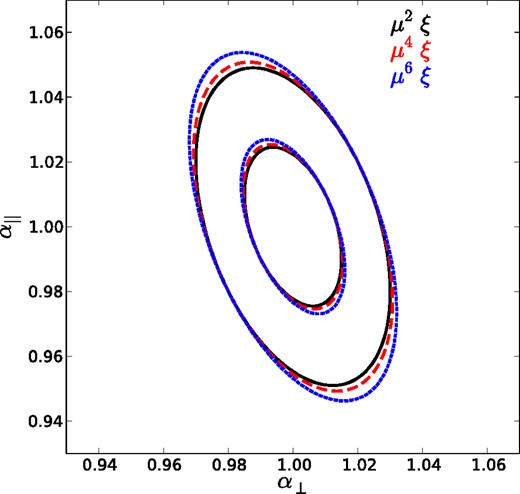
Ellipses showing the 1σ and 2σ contours for α|| and α⊥, expected when combining the monopole with a power-law weighted moment |$\int _0^1\mathrm{d}\mu \mu ^p\xi (\mu )/\int _0^1\mathrm{d}\mu \mu ^p$|, which we denote μpξ, for p = 2, 4, 6 (black, red, blue).
We evaluate equations (31) and (32) for 0 < μd < 1 and compare the results to those recovered from the combination of α0, α2 (equivalent to the information in the monopole and quadrupole). The results are shown in Fig. 4. One can see that variance is minimized at μd = 0.64, but that the α0, α2 combination always performs better. We display similar information in Fig. 5, except that we now plot the correlation C||, ⊥. Its magnitude is also minimized at μd = 0.64 and is always greater than that of the α0, α2 combination.
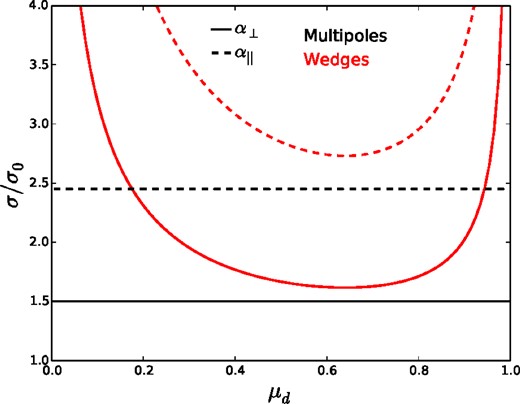
Red curves display the predicted uncertainty in α|| (dashed) and α⊥ (solid) recovered using Wedges, as a function of the split in μ. The black curves display the predicted uncertainty for the combination of either the monopole and quadrupole, or the monopole and a μ2 window.
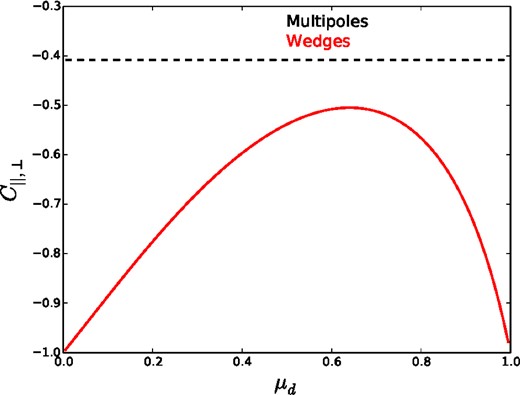
The solid red curve displays the predicted correlation between α|| and α⊥ recovered using Wedges, as a function of the split in μ. The dashed black curve displays the predicted uncertainty for the combination of either the monopole and quadrupole, or the monopole and a μ2 window.
Table 2 summarizes the predictions we make for the recovered uncertainty on α||, α⊥ and its correlation. One can see that the predicted uncertainties on α|| and α⊥ and their covariance are worse, by close to 10 per cent for each, for Wedges than for the combination of ξ0 and ξ2. We illustrate this same information in Fig. 6, where the expected 1σ and 2σ contours are displayed for Multipoles (black, solid) and Wedges split at μd = 0.64 (red, dashed) are displayed. The major-axes of the ellipses are nearly aligned and it is along this direction that Wedges provide less-optimal constraints.
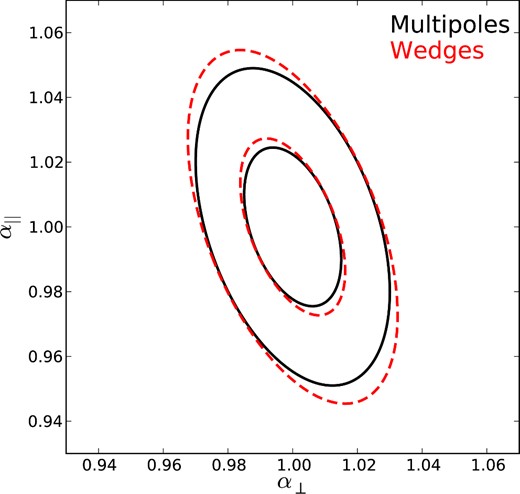
Ellipses showing the 1σ and 2σ contours for α|| and α⊥, expected when using multipoles (or μ0 and μ2 power-law moments; black) and when using Wedges split at μd = 0.64.
The predicted uncertainty on the radial and transverse stretch, σ|| and σ⊥, relative to the uncertainty on the spherically averaged stretch, and their correlation, C||, ⊥. S denotes the standard deviation recovered from BAO fits to the mocks. S||, ⊥ denotes the correlation as recovered from the scatter of the BAO fits to the mocks. ‘W’ represents Wedges, and ‘M’ denotes the usage of ξ0, ξ2. Compared to our predictions, the fits to the mocks are less precise but the overall trends agree. We discuss this further in subsequent sections.
| Method . | σ|| . | σ⊥ . | C||, ⊥ . | S|| . | S⊥ . | S||, ⊥ . |
|---|---|---|---|---|---|---|
| M | 2.45σ0 | 1.50σ0 | −0.41 | 2.79σ0 | 1.58σ0 | −0.49 |
| W, μd = 0.5 | 2.85σ0 | 1.67σ0 | −0.54 | 2.98σ0 | 1.73σ0 | −0.56 |
| W, μd = 0.64 | 2.73σ0 | 1.62σ0 | −0.50 | 3.00σ0 | 1.66σ0 | −0.54 |
| Method . | σ|| . | σ⊥ . | C||, ⊥ . | S|| . | S⊥ . | S||, ⊥ . |
|---|---|---|---|---|---|---|
| M | 2.45σ0 | 1.50σ0 | −0.41 | 2.79σ0 | 1.58σ0 | −0.49 |
| W, μd = 0.5 | 2.85σ0 | 1.67σ0 | −0.54 | 2.98σ0 | 1.73σ0 | −0.56 |
| W, μd = 0.64 | 2.73σ0 | 1.62σ0 | −0.50 | 3.00σ0 | 1.66σ0 | −0.54 |
4 BAO FITTING
5 EMPIRICAL RESULTS
We use pthalo (Manera et al. 2013) mock galaxy catalogues (mocks) to empirically test our analytical derivations. The mocks we use were created to match the SDSS-III (Eisenstein et al. 2011) DR11 BOSS (Dawson et al. 2013) CMASS sample. The imaging (Fukugita et al. 1996; Gunn et al. 1998) and spectroscopic data (Smee et al. 2013) were obtained using the SDSS telescope (Gunn et al. 2006) and reduced as described in Bolton et al. (2012)
Fig. 7 displays the mean ξ0 recovered from these mocks post-reconstruction (black curve) compared to the mean |$3\int _0^1{\rm d}\mu \mu ^2\xi (\mu )$| moment (red curve). In principle, they should appear identical, as RSD have been removed in the reconstruction. However, differences are observed that are similar to the differences observed in post-reconstruction Wedges (see e.g. fig. 19 of Anderson et al. 2014).
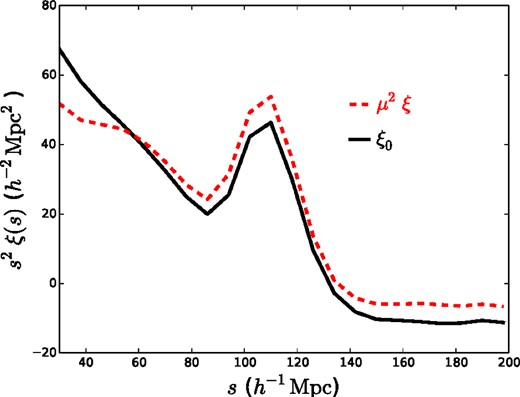
The mean ξ0 and |$3\int _0^1{\rm d}\mu \mu ^2\xi (\mu )$|, denoted μ2ξ, recovered from post-reconstruction DR11 CMASS mocks.
We measure the los, α||, and transverse, α⊥, BAO scale information for each of the 600 mocks using three different pairs of observables:
the combination of ξ0 and ξ2, as described by equations (43) and (44); we denote these results as ‘M’ (for Multipoles)
the combination of ξW1 and ξW2 Wedges split at μd = 0.5; we denote these results as ‘W, μd = 0.5 arcmin
the combination of ξW1 and ξW2 Wedges split at μd = 0.64; we denote these results as ‘W, μd = 0.64 arcmin.
For both Wedges, we use the model described by equations (41) and (42).
Our results are shown in Table 3, where we also display the results from Anderson et al. (2014), denoted with ‘A14’. One can see that our implementation of Wedges split at μd = 0.5 and Multipoles generally match closely with Anderson et al. (2014), though variations of up to 10 per cent are found for some standard deviations and mean uncertainties.
The statistics of BAO scale measurements recovered from the DR11 mock samples. ‘A14’ results are taken from Anderson et al. (2014). All values are recovered from the distribution of the fits to the 600 mocks; 〈〉 denote the mean values, S denotes standard deviation, and C||, ⊥ the denotes the correlation between the maximum likelihood values of α||, α⊥.
| Publication . | Method . | 〈α⊥〉 . | 〈σ⊥〉 . | S⊥ . | 〈α||〉 . | 〈σ||〉 . | S|| . | C||, ⊥ . |
|---|---|---|---|---|---|---|---|---|
| Anderson et al. (2014) | M | 0.9999 | 0.0137 | 0.0149 | 1.0032 | 0.0248 | 0.0266 | – |
| W, μd = 0.5 | 0.9993 | 0.0161 | 0.0153 | 1.0006 | 0.0296 | 0.0264 | – | |
| This work | M | 0.9987 | 0.0150 | 0.0145 | 1.0017 | 0.0232 | 0.0257 | −0.49 |
| W, μd = 0.5 | 0.9992 | 0.0159 | 0.0157 | 1.0010 | 0.0274 | 0.0274 | −0.56 | |
| W, μd = 0.64 | 0.9980 | 0.0153 | 0.0152 | 1.0032 | 0.0274 | 0.0276 | −0.54 |
The uncertainties and standard deviations are slightly worse than our analytic predictions, as can be seen by comparing the three left-hand columns to the three right-hand columns in Table 2. The discrepancies are greatest for α|| and for Multipoles; the recovered standard deviation on α|| is 14 per cent larger than expected for Multipoles, which is likely related to the fact that the correlation between α⊥ and α|| is 20 per cent larger than expected. Despite not matching our quantitative predictions, the Multipoles fits still match our qualitative predictions: they recover the smallest standard deviations, mean uncertainties and correlation between α|| and α⊥.
The Wedges split at μd = 0.5 produce the results closest to our analytic predictions; the recovered α⊥, α||, and their correlation are all between 3 and 5 per cent greater than predicted. We find that Wedges split at μd = 0.64 results in only a small improvement in the variance of α⊥ and the correlation between α⊥ and α|| while producing a slight increase in the variance of α||. The μd = 0.5 Wedges recover the least biased mean α⊥ and α|| of the three methods we apply, though the difference in the bias compared to the Multipoles results is negligibly small (at most 0.034σ).
The results of our fits to the mocks are illustrated in Fig. 8, where we take the standard deviations and correlations of α|| and α⊥ for the different fitting techniques we apply and assume Gaussian statistics. Compared to Fig. 6, one can see that the ellipses are all more elongated (reflecting the increased uncertainty on α|| over those predicted). Similar to our predictions, the Multipoles ellipse is significantly smaller than the Wedges ellipses.
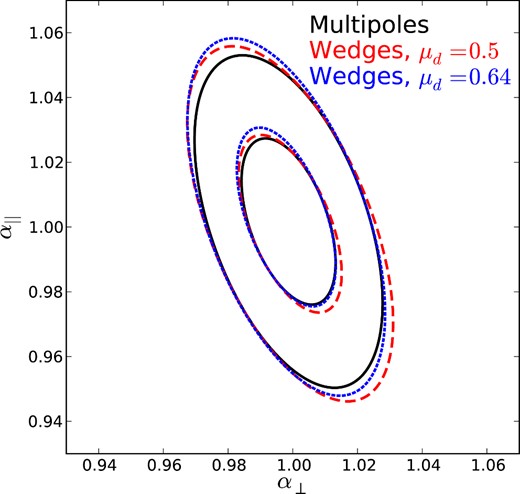
Ellipses showing the recovered standard deviation and correlations between the α|| and α⊥ for the different fitting techniques we apply, produced assuming these statistics describe a multivariate-Gaussian likelihood distribution.
Table 4 lists the correlations we find between the three different treatments we consider for α|| and α⊥, and the standard deviation obtained when averaging the measurements accounting for the correlation. The correlations are all greater than 0.85, and differences from 1 are caused mainly by the relative precision achieved in each method. Thus, there is negligible gain achieved by averaging the measurements, as one can see that there is at best a 1 per cent gain in the precision over that achieved by using only the Multipoles results.
Correlations between the recovered α⊥ or α|| for different methods and the expected uncertainty when averages are taken incorporating the correlation. C denotes correlation and SC denotes the standard deviation after combining the two measurements, accounting for the correlation.
| Methods . | C|| . | C⊥ . | SC, || . | SC, ⊥ . |
|---|---|---|---|---|
| Wedges μd = 0.5; Multipoles | 0.85 | 0.86 | 0.0254 | 0.0144 |
| Wedges μd = 0.64; Multipoles | 0.89 | 0.90 | 0.0256 | 0.0144 |
| Methods . | C|| . | C⊥ . | SC, || . | SC, ⊥ . |
|---|---|---|---|---|
| Wedges μd = 0.5; Multipoles | 0.85 | 0.86 | 0.0254 | 0.0144 |
| Wedges μd = 0.64; Multipoles | 0.89 | 0.90 | 0.0256 | 0.0144 |
6 CONCLUSIONS
We have derived analytic formulae that describe the relative importance of angular and radial dilation measured from moments of two-point clustering statistics, with respect to the cosine of the angle to the los μ. We have derived formulae for an arbitrary window, F, that weights information with respect to μ, and have provided solutions for the cases where F(μ) is a power law (Section 2.2), a ‘Wedge’ where F(μ) is 1 for given range of μ and zero otherwise (Section 2.3), and where the window is the second-order Legendre polynomial (i.e. the clustering observable is the quadrupole moment; Section 2.4). We have presented results in real-space, valid for both the correlation function, and in Fourier space for moments of the power spectrum. These formulae extend the commonly used assumption that isotropically averaged BAO provide a measurement of DV(z) to other moments and allow for RSD when using power spectrum moments.
In Section 3, we derive the expected uncertainty of, and covariance between, α⊥ and α|| obtained from a pair of clustering measurements calculated for two different F(μ) assuming that information is evenly distributed in μ (as is approximately the case for the BOSS CMASS galaxy sample). We show that the optimal, maximum likelihood solution is the combination of the monopole and quadrupole, or equivalently the monopole and F(μ) = μ2. We show that a third power-law window only adds degenerate information and should not increase the statistical precision on DA(z) and H(z). We then find the optimal combination Wedges, which we find are those split at μd = 0.64. For this optimal Wedge, we predict the uncertainties on and correlations between DA(z) and H(z) are between 8 and 11 per cent larger than for the combination of the monopole and quadrupole.
Our results differ from those of Taruya et al. (2011), Kazin et al. (2012), as both studies found that including the hexadecapole significantly decreased the recovered uncertainty on DA(z) and H(z). The key difference in our study is that we derive our results for post-reconstruction galaxy clustering measurements, where the Legendre polynomial moments are expected to be zero, except for the monopole. Thus, in our analytic formulation (supported by our empirical results), the inclusion of the quadrupole does not increase the total amount of BAO scale information (the covariance between the BAO information in the p = 2 moment and in the monopole is the same as the variance expected for the p = 2 moment), it simply allows for the information to be optimally projected into the DA(z), H(z) basis (and therefore does increase the total amount of cosmological information), and thus there is no additional information in the hexadecapole. In redshift space, as studied by Taruya et al. (2011), Kazin et al. (2012), the quadrupole and hexadecapole are expected to be non-zero and thus do contribute to the total amount of BAO information.
In our derivations, we consider only the μ-dependent dilation at a particular scale and assume the information at particular μ is independent. Such an assumption may be more appropriate in k-space, where P(k, μ1) and P(k, μ2) are expected to be independent (not accounting for any survey window function), but we test our derivations using the redshift-space correlation function, where ξ(s, μ1) and ξ(s, μ2) are not independent. Despite these assumptions, the results we recover from test on mock samples closely match our predictions, especially for α⊥, as presented in Section 5.
Using the set of mock catalogues produced for the BOSS DR11 analysis, we find that, as predicted, in terms of the recovered uncertainty of, standard deviation of, and covariance between α|| and α⊥, fitting to Multipoles produces the optimal results of the three cases we test, matching our analytic predictions. We also find, as predicted, Wedges split at μd = 0.64 are optimal compared to Wedges split at μd = 0.5, although the decrease in uncertainty is small (<5 per cent). We find that the correlation between Multipoles and Wedges is large enough that there is a negligible gain in information(1 per cent reduction in the standard deviation) when the results are combined.
We find a slight trend where the methods that depend most strongly on clustering measurements at high μ are the most biased. The bias is small, as the largest bias, found for the μd = 0.64 Wedge, is only 0.13σ. This trend is thus likely due to inaccuracies in our modelling of the BAO feature at high μ, where the non-linear RSD signal is strongest. If the modelling as a function of μ can be improved in future analyses, we expect the trend in bias will decrease and that the recovered uncertainties and correlations will be a closer match to our predictions for Multipoles. We therefore believe that improving the μ dependence of the post-reconstruction BAO template should be a priority for future BAO studies, and that by doing so, the precision of the measurements made using Multipoles will increase.
Our analysis provides further support for the future use of BAO to make robust cosmological measurements. We have carefully considered the meaning of BAO measurements made from moments of two-point functions, providing an optimal approach. Both this work, and the recent work of Zhu, Padmanabhan & White (2014) who considered radial weighting of BAO measurements, are testing and optimizing the BAO measurement methodology, increasing our understanding in line with the increasing statistical precision afforded by future surveys. Our results, and the conclusions we draw, are specific to the case where information is evenly distributed in μ. Thus, interesting possible extensions include extending the methodology to more general cases with different distributions of information with μ (e.g. Ly α or redshift-space measurements determined without using reconstruction), and allowing for correlations in μ in the covariance matrix of ξ(r) required for small surveys. Such studies are likely to find that more than two moments are required to capture the full information content of the BAO signal.
AJR acknowledges support from the University of Portsmouth and The Ohio State University Center for Cosmology and AstroParticle Physics. WJP acknowledges support from the UK STFC through the consolidated grant ST/K0090X/1, and from the European Research Council through the Darksurvey grant. We thank the anonymous referee, Daniel Eisenstein and Nikhil Padmanabhan for helpful comments, Ariel Sanchez for comparisons with Wedges results, and Antonio Cuesta for providing all of the pair-counts we used in our mocks analysis.
Mock catalogue generation and BAO fitting made use of the facilities and staff of the UK Sciama High Performance Computing cluster supported by the ICG, SEPNet and the University of Portsmouth.
Funding for SDSS-III has been provided by the Alfred P. Sloan Foundation, the Participating Institutions, the National Science Foundation, and the US Department of Energy Office of Science. The SDSS-III website is http://www.sdss3.org/.
SDSS-III is managed by the Astrophysical Research Consortium for the Participating Institutions of the SDSS-III Collaboration including the University of Arizona, the Brazilian Participation Group, Brookhaven National Laboratory, Cambridge University, Carnegie Mellon University, Case Western University, University of Florida, Fermilab, the French Participation Group, the German Participation Group, Harvard University, UC Irvine, Instituto de Astrofisica de Andalucia, Instituto de Astrofisica de Canarias, Institucio Catalana de Recerca y Estudis Avancat, Barcelona, Instituto de Fisica Corpuscular, the Michigan State/Notre Dame/JINA Participation Group, Johns Hopkins University, Korean Institute for Advanced Study, Lawrence Berkeley National Laboratory, Max Planck Institute for Astrophysics, Max Planck Institute for Extraterrestrial Physics, New Mexico State University, New York University, Ohio State University, Pennsylvania State University, University of Pittsburgh, University of Portsmouth, Princeton University, UC Santa Cruz, the Spanish Participation Group, Texas Christian University, Trieste Astrophysical Observatory University of Tokyo/IPMU, University of Utah, Vanderbilt University, University of Virginia, University of Washington, University of Wisconson and Yale University.
This is the general formula for covariance between the means of two Gaussian random variables with arbitrary F(μ) weighting and variance |$\sigma _0^2$| for F(μ) = 1. It does not depend on the definition of α or μ.
In the limit of infinite Wedges, the predicted uncertainties will clearly converge to that of the monopole and quadrupole


