


Abstract
High-resolution 2D hydrodynamical simulations describing the evolution of the hot interstellar medium (ISM) in axisymmetric two-component models of early-type galaxies well reproduced the observed trends of the X-ray luminosity (LX) and temperature (TX) with galaxy shape and rotation, however they also revealed the formation of an exceedingly massive cooled gas disc in rotating systems. In a follow-up of this study, here we investigate the effects of star formation in the disc, including the consequent injection of mass, momentum and energy in the pre-existing ISM. It is found that subsequent generations of stars originate one after the other in the equatorial region; the mean age of the new stars is >5 Gyr, and the adopted recipe for star formation can reproduce the empirical Kennicutt–Schmidt relation. The results of the previous investigation without star formation, concerning LX and TX of the hot gas, and their trends with galactic shape and rotation, are confirmed. At the same time, the consumption of most of the cold gas disc into new stars leads to more realistic final systems, whose cold gas mass and star formation rate agree well with those observed in the local Universe. In particular, our models could explain the observation of kinematically aligned gas in massive, fast-rotating early-type galaxies.
1 INTRODUCTION
Early-type galaxies (ETGs) are embedded in hot gaseous haloes produced mainly by stellar winds, and heated to X-ray temperatures by Type Ia supernovae (SNIa) explosions and by the thermalization of stellar motions (Fabbiano 1989; Ciotti et al. 1991; David, Forman & Jones 1991; O'Sullivan, Forbes & Ponman 2001). The thermalization is due to the interaction between the stellar and SNIa ejecta and the pre-existing hot interstellar medium (ISM; e.g. Mathews 1989; Parriott & Bregman 2008). Recent high-resolution 2D hydrodynamical simulations of hot gas flows (Negri, Ciotti & Pellegrini 2014a; Negri et al. 2014b, hereafter N14) showed that the presence of ordered rotation in the stellar component can alter significantly the ISM evolution with respect to that shown by fully velocity dispersion supported systems of same total mass and mass distribution. First, it is found that the rotation field of the ISM in rotating galaxies is very similar to that of the stars, with a consequent negligible heating contribution from thermalization of the ordered motions. Secondly, conservation of angular momentum in the ISM of rotating galaxies results in the formation of a centrifugally supported cold equatorial disc, with the consequent reduction of both the X-ray luminosity LX and temperature TX of the hot ISM. These results compared well with observations, which show a dependence of LX and TX on the galactic shape and internal dynamics: LX is observed to be high only in round and slowly rotating galaxies, and is limited to lower values for flatter, fast-rotating ones (Eskridge, Fabbiano & Kim 1995; Pellegrini, Held & Ciotti 1997; Sarzi et al. 2010, 2013; Li et al. 2011; Pellegrini 2012); TX of slowly rotating systems is consistent just with the thermalization of the stellar random kinetic energy, estimated from σe (the stellar velocity dispersion averaged within one effective radius Re), while fast-rotating systems show TX values below 0.4 keV, and not scaling with σe (Sarzi et al. 2013, see also Pellegrini 2011, Posacki, Pellegrini & Ciotti 2013).
A major outcome of the previous simulations is that cold material can be accumulated in considerable amounts, during the lifetime of rotating galaxies. The cold gas typically settles in the equatorial plane, where it forms an extended disc (of 0.5–10 kpc radius), that can be as massive as ≃1010 M⊙, in the largest galaxies. This result brings in a few important questions: Are these cold discs observed? Do they become, as seems natural, a site for star formation (hereafter SF)? Is SF observed? What is the impact of SF in the disc on LX and TX? In recent years, evidence has been accumulating that ETGs host significant quantities of cold gas, in the form of atomic and molecular hydrogen (Morganti et al. 2006; Combes, Young & Bureau 2007; di Serego Alighieri et al. 2007; Grossi et al. 2009; Young et al. 2011); approximately 50 per cent of massive ETGs (of stellar mass M* ≳ 1010 M⊙) contain 107–109 M⊙ of H i and/or H2 (Cappellari et al. 2011; Davis et al. 2011, 2013; Serra et al. 2012, 2014; Young et al. 2014). A large, systematic investigation of the ATLAS3D sample of ETGs with the Westerbork Synthesis Radio Telescope found that ≃40 per cent of galaxies outside Virgo, and ≃10 per cent of galaxies inside it, are detected in H i, with |$M_{\rm H\,\small {I}}\gtrsim 10^7$| M⊙; the majority (2/3) of the detections consists of settled configurations, where the cold gas is in discs or rings. Small discs (size of a few kpc), confined within the stellar body, share the same kinematics of the stars; large discs (up to 5 × 10⁹ M⊙) extend to tens of kpc, and in half of the cases are kinematically misaligned with the stars (Serra et al. 2012). In particular, fast-rotating Virgo galaxies have kinematically aligned gas, and the most massive (M* ≳ 8 × 10¹⁰ M⊙) fast-rotating ETGs always have kinematically aligned gas, independent of environment; this alignment leads to hypothesize that the gas has been internally generated (Davis et al. 2011, 2013). The H i discs/rings around slowly rotating ETGs, instead, are usually not fully settled, which suggests an external origin (in mergers, or in accretion from satellite galaxies, or from the intergalactic medium); an external origin was considered likely also for those ETGs showing stellar/gas kinematic misalignment. Interestingly, while H i is more ubiquitous, molecular gas is detected only in fast rotators across the entire ATLAS3D sample (Davis et al. 2011, 2013; Young et al. 2011, 2014).
Besides giving indication about its origin through its morphology and kinematics, the observed cold gas seems also to provide material for SF. Low level SF activity is present in approximately one-third of ETGs (Yi et al. 2005; Suh et al. 2010; Ko et al. 2014); Sarzi et al. (2006) showed ongoing SF signatures in the optical spectra of at least ∼10 per cent of nearby ETGs. In the ATLAS3D sample, galaxies with H i within ∼1 Re exhibit ongoing SF in ∼70 per cent of the cases, ∼5 times more frequently than galaxies without H i (Serra et al. 2012). Interestingly, as for molecular gas, some degree of SF and young stellar populations are detected only in fast rotators, in the ATLAS3D sample (Kuntschner et al. 2010; Sarzi et al. 2013). Integral-field spectroscopy showed that ETGs host frequently a rotating stellar component younger and more metal rich than the bulge (Krajnović et al. 2008). The presence of this component, and the occurrence of SF, imply an important role for the cold gas during the evolution of ETGs (Khochfar et al. 2011; Cappellari et al. 2013; Naab et al. 2014).
Finally, the cold gas content of ETGs is also an important prediction of Λ cold dark matter hydrodynamical simulations of galaxy formation, that include cold gas evolution (e.g. Martig et al. 2013), and accretion via various processes during the secular evolution of galaxies (Oser et al. 2010, see also Lagos et al. 2014, Dubois et al. 2013).
In conclusion, the cold gas has become a tool to gain insight into recent (and less recent) galaxy evolution. In order to correctly interpret the variety of observational results, and to use them properly as constraints for different scenarios for the origin of the structure and SF history of ETGs, it is crucial to establish what is the relative importance of the various gas production processes (internal and external to galaxies), gas depletion ones (AGN and SF-driven outflows, environmental stripping), and gas consumption ones (SF). Cold gas is usually thought to come from accretion from the surrounding medium or satellites, as well as from gas-rich mergers; in the cases of the giant central-dominant galaxies in groups or clusters it can also come from cooling of hot gas (Edge et al. 2010; McDonald et al. 2011). The numerical investigation of N14 showed an additional internal contribution of cold gas, coming from the evolution of the passive stellar population, that can be substantial, or even too large with respect to observed values. A natural sequel of the N14 work should address the questions of whether this gas can possibly lead to SF, when SF takes place, and what is the fate of the cold discs, whether they are consumed or they are continuously replenished by cooling hot gas. In this paper, we add SF to the simulations of N14, and we explore the ISM evolution including the removal of cold gas, and the injection of mass, momentum and energy appropriate for the newly (and continuously) forming stellar population. In this way we aim at establishing whether (i) the N14 results for the general trends of the hot gas properties with galaxy shape and stellar kinematics still hold; (ii) the formation of stars can reduce the amount of cold gas in the simulations, thus bringing it more in agreement with observed values; (iii) a significant channel for SF, previously neglected, should be taken into consideration for rotating systems, and whether this can account for the low-level SF activity currently seen to be ongoing.
This paper is organized as follows. In Section 2, we describe the main ingredients of the simulations, such as the galaxy models and the input physics. In Section 3, we present and discuss the results of the simulations. In Section 4, we summarize the conclusions.
2 THE SIMULATIONS
N14 performed a large set of 2D hydrodynamical simulations with the zeusmp2 code to fully explore the large parameter space of realistic (axisymmetric) galaxy models, characterized by different stellar mass, intrinsic flattening, distribution of dark matter, and internal kinematics. The galaxy flattening was either fully supported by ordered rotation, originating the set of models that are isotropic rotators, or by tangential anisotropy, originating the set of fully velocity dispersion supported models. These two extreme configurations were built adopting the Satoh decomposition, respectively, with Satoh parameter k = 1 and 0. The galaxy models were tailored to reproduce the observed properties and scaling laws of ETGs (see also Posacki et al. 2013). In this work, we perform hydrodynamical simulations for a representative subset of rotating models already investigated by N14 (Section 2.1), including SF in the simulations (as described in Section 2.2 below), but keeping the code (numerical set-up, grid properties) in all equal to that used by N14 (see N14 for details). Also, a less extreme value of k = 0.1 is explored. A logarithmically spaced numerical mesh (R, z) of 960×480 gridpoints is employed, with a resolution of 90 pc in the first 10 kpc from the centre.
2.1 The galaxy models
N14 built axisymmetric two-component galaxy models where the stellar component has two different intrinsic flattening, corresponding to the E4 and E7 shapes, while the dark matter halo is spherical. The luminous matter is described by the deprojection (Mellier & Mathez 1987) of the de Vaucouleurs (1948) law, generalized for ellipsoidal axisymmetric distributions; the dark matter profile is the (Navarro, Frenk & White 1997) one, with the dark mass Mh amounting at ≃20 times the total stellar mass M*. For any fixed galaxy mass and shape (E4 or E7), N14 built two models: the first one, called ‘FO-built’, when seen face-on has the same Re of the spherical E0 counterpart, thus its stellar mass distribution becomes more and more concentrated than in the E0 model, as it gets flatter; the second one, called ‘EO-built’, when seen edge-on has the same circularized Re of the E0 counterpart, which makes its stellar mass distribution to expand with increasing flattening.
In this work, we re-simulate a few flat (E4 and E7) rotating models (isotropic rotators, with k = 1) of N14 including SF in them. In order to explore the effects of SF at the high and low ends of the galaxy mass range explored by N14, we choose four flat models with luminosity-weighted stellar velocity dispersion within Re/8 of σe8 = 300 km s−1 for the parent spherical model (and we call these high-mass models, ‘HM’ models), and four with σe8 = 200 km s−1 for the E0 counterpart (low-mass models, ‘LM’ models). In N14, the first set was found to host inflows, with the creation of a massive, centrifugally supported cold gaseous disc, while the second set was found in a global wind, or close to the transition to it. In a global wind, the gas has very low density and positive velocity (directed outwards) through most of the galaxy (e.g. Mathews & Baker 1971).1 In addition, we re-simulated two intermediate-mass models (again E4 and E7), with σe8 = 250 km s−1 for the E0 counterpart. For these two models, we also built a moderately rotating stellar kinematical configuration (k = 0.1), not explored by N14. The main structural properties of the ten re-simulated models, identical to those presented in N14, are listed in Table 1; the two new models with k = 0.1 differ from the intermediate-mass models only in the σe8 value, which is given in the notes to the table.
Main properties of the galaxy models.
| Name | LB | Re | M* | Mh | σe8 | fDM | c |
|---|---|---|---|---|---|---|---|
| (1011L⊙) | (kpc) | (1011 M⊙) | (1011 M⊙) | (km s−1) | |||
| (1) | (2) | (3) | (4) | (5) | (6) | (7) | (8) |
| EO4|$^{200}_{\rm {IS}}$| | 0.26 | 4.09 | 1.25 | 25 | 166 | 0.63 | 37 |
| EO7|$^{200}_{\rm {IS}}$| | 0.26 | 4.09 | 1.25 | 25 | 124 | 0.66 | 37 |
| FO4|$^{200}_{\rm {IS}}$| | 0.26 | 4.09 | 1.25 | 25 | 178 | 0.59 | 37 |
| FO7|$^{200}_{\rm {IS}}$| | 0.26 | 4.09 | 1.25 | 25 | 150 | 0.57 | 37 |
| EO4|$^{250}_{\rm {IS}}$| | 0.62 | 7.04 | 3.35 | 67 | 207 | 0.62 | 28 |
| EO7|$^{250}_{\rm {IS}}$| | 0.62 | 7.04 | 3.35 | 67 | 154 | 0.66 | 28 |
| EO4|$^{300}_{\rm {IS}}$| | 1.32 | 11.79 | 7.80 | 160 | 248 | 0.64 | 22 |
| EO7|$^{300}_{\rm {IS}}$| | 1.32 | 11.79 | 7.80 | 160 | 185 | 0.68 | 22 |
| FO4|$^{300}_{\rm {IS}}$| | 1.32 | 11.79 | 7.80 | 160 | 266 | 0.60 | 22 |
| FO7|$^{300}_{\rm {IS}}$| | 1.32 | 11.79 | 7.80 | 160 | 224 | 0.59 | 22 |
Notes. (1) Model name: ‘EO’ or ‘FO’ indicate the procedure (EO-building or FO-building) applied to the spherical (E0) model to obtain the shape indicated by the number (E4 or E7 shapes); the superscript indicates σe8 of the corresponding E0 model; the subscript ‘IS’ indicates the kinematical configuration of the isotropic rotator (for example, FO4|$^{200}_{\rm {IS}}$| is an E4 isotropic rotator, FO-built from a spherical model with σe8 = 200 km s−1). (2) Luminosities in the B band. (3) Effective radius (for an FO view for FO-built models, and an EO view for EO-built models). (4) Total stellar mass of the original (old) stellar population. The first four models are LM models, the next two are intermediate mass models, and the last four are HM models. (5) Total dark matter mass. (6) Luminosity-weighted average of the stellar velocity dispersion within a circular aperture of radius Re/8; for non-spherical models, σe8 is the edge-on viewed value. (7) Dark matter fraction enclosed within a sphere of radius Re. (8) Concentration parameter of the dark matter profile.
The properties listed above, for the EO4250 and EO7250 models with k = 0.1, are not reported, since they are equal to those of the EO4|$^{250}_{\rm {IS}}$| and EO7|$^{250}_{\rm {IS}}$| ones, except for σe8, which is, respectively, 223 km s−1 for the EO4|$^{250}_{k\rm {=0.1}}$| model, and 184 km s−1 for the EO7|$^{250}_{k\rm {=0.1}}$| model.
2.2 Star formation in the code
We employed two different schemes for SF, a passive (pSF) one and an active (aSF) one. In the pSF, only cold gas removal from the numerical mesh is allowed; in the aSF, we also consider the injection of mass, momentum and energy from the newly forming stellar population, for simplicity limiting in this work to the evolution of stars more massive than 8 M⊙ (ending with SNII explosions); note however that for reasonable stellar initial mass functions (IMF) these massive stars are major contributors to the total mass return rate. We describe below the main inputs and sinks of mass and energy for the gas flow, due to both the original stellar population (of total mass M*) and the newly forming stars, and the corresponding equations of hydrodynamics solved by the code.
2.2.1 The mass injection and sink terms
The mass inputs are stellar winds and SNIa's ejecta produced during the passive evolution of the original stellar population of the galaxy (at a rate per unit volume, respectively, of |$\dot{\rho }_*$| and |$\dot{\rho }_{\rm Ia}$|, for which we adopt the standard recipes coming from the stellar evolution theory; e.g. N14), and the Type II supernovae ejecta produced by the newly born stellar population (at a rate of |$\dot{\rho }_{\rm II}$|, calculated as detailed below).
2.2.2 The energy injection and sink terms
2.2.3 The hydrodynamical equations
In the pSF scheme, the source terms |$\dot{\rho }_{\rm II}$| and |${\dot{E}}_{\mathrm{II}}$| are zero, thus they either do not enter the hydrodynamical equations above and they do not contribute to |$\dot{E}$|. In the more realistic aSF, |$\dot{\rho }_{\rm II}$| and |${\dot{E}}_{\mathrm{II}}$| are non-zero. Most galaxy models are simulated with pSF and aSF; for each of the two schemes, we adopted two values of the SF efficiency in equations (1) and (8), ηSF = 10−1 and ηSF = 10−2 (see Section 3 below).
We tested that the code conserves the total mass and energy; the total mass at any time t is |$M_\mathrm{gas} +M_\mathrm{esc} = M_\mathrm{inj} +M_\mathrm{inj}^{\rm II}-M_*^{\rm new}$|, where Mgas is the gas mass within the simulation box, Mesc is the cumulative escaped mass out of the simulation box, until that time; Minj, |$M_\mathrm{inj}^{\rm II}$|, and |$M_*^{\rm new}$| are the cumulative masses, respectively, injected by the passively evolving stellar population, injected by SNII events due to the newly born stellar population, and of the new stars. The values of these masses at the end of the simulations are given in Tables 2–5. Finally, the radiative cooling is implemented by adopting a modified version of the cooling law of Sazonov et al. (2005), with a lower limit for the ISM temperature of T = 104 K. The total X-ray emission in the 0.3–8 keV band (LX), and the emission weighted temperature in the same band (TX), are calculated as volume integrals over the whole computational grid, using as weight the emissivity in the 0.3–8 keV band of a hot, collisionally ionized plasma (see N14 for more details).
Relevant quantities at t = 13 Gyr for the rotating models (k = 1) with σe8=300 km s−1.
| Name | SF | ηSF | Minj | Mesc | Mgas | Mhot | Mc | |$M_*^{\rm new}$| | |$M_\mathrm{inj}^{\rm II}$| | |$\langle t\rangle _*^{\rm new}$| | |$M_*^{\rm ew}/\langle t\rangle _*^{\rm new}$| | SFR | LX | LSNIa | LSNII | TX |
|---|---|---|---|---|---|---|---|---|---|---|---|---|---|---|---|---|
| (109 M⊙) | (109 M⊙) | (109 M⊙) | (109 M⊙) | (109 M⊙) | (109 M⊙) | (109 M⊙) | (Gyr) | (M⊙ yr−1) | (M⊙ yr−1) | (1040 erg s−1) | (1040 erg s−1) | (1040 erg s−1) | (keV) | |||
| (1) | (2) | (3) | (4) | (5) | (6) | (7) | (8) | (9) | (10) | (11) | (12) | (13) | (14) | (15) | (16) | (17) |
| EO4|$^{300}_{\rm {IS}}$| | × | – | 69.38 | 14.10 | 56.04 | 6.52 | 49.8 | – | – | – | – | – | 1.34 | 47.7 | – | 0.68 |
| EO7|$^{300}_{\rm {IS}}$| | × | – | 65.46 | 15.87 | 50.24 | 6.13 | 44.5 | – | – | – | – | – | 1.04 | 45.0 | – | 0.56 |
| FO4|$^{300}_{\rm {IS}}$| | × | – | 71.81 | 11.93 | 60.92 | 6.11 | 54.7 | – | – | – | – | – | 1.35 | 49.4 | – | 0.68 |
| FO7|$^{300}_{\rm {IS}}$| | × | – | 71.93 | 11.14 | 61.82 | 5.07 | 56.7 | – | – | – | – | – | 0.90 | 49.5 | – | 0.59 |
| EO4|$^{300}_{\rm {IS}}$| | P | 0.01 | 70.53 | 13.85 | 14.87 | 6.86 | 7.93 | 41.81 | – | 5.02 | 8.33 | 2.24 | 1.47 | 48.5 | – | 0.69 |
| EO7|$^{300}_{\rm {IS}}$| | P | 0.01 | 66.56 | 15.68 | 17.02 | 6.50 | 10.4 | 33.86 | – | 5.34 | 6.34 | 2.10 | 1.07 | 45.8 | – | 0.58 |
| FO4|$^{300}_{\rm {IS}}$| | P | 0.01 | 72.94 | 11.75 | 14.15 | 6.23 | 7.85 | 47.04 | – | 4.90 | 9.6 | 2.47 | 1.38 | 50.2 | – | 0.68 |
| FO7|$^{300}_{\rm {IS}}$| | P | 0.01 | 73.01 | 10.83 | 16.13 | 5.07 | 10.9 | 46.06 | – | 4.98 | 9.25 | 2.54 | 0.89 | 50.2 | – | 0.55 |
| EO4|$^{300}_{\rm {IS}}$| | P | 0.1 | 70.53 | 13.89 | 8.23 | 6.90 | 1.24 | 48.41 | – | 4.36 | 11.10 | 1.99 | 1.54 | 48.5 | – | 0.68 |
| EO7|$^{300}_{\rm {IS}}$| | P | 0.1 | 66.56 | 15.77 | 7.82 | 6.45 | 1.31 | 42.96 | – | 4.42 | 9.72 | 1.66 | 1.04 | 45.8 | – | 0.59 |
| FO4|$^{300}_{\rm {IS}}$| | P | 0.1 | 72.94 | 11.71 | 7.73 | 6.40 | 1.22 | 53.50 | – | 4.25 | 12.59 | 2.12 | 1.50 | 50.2 | – | 0.68 |
| FO7|$^{300}_{\rm {IS}}$| | P | 0.1 | 73.01 | 10.87 | 6.86 | 5.30 | 1.47 | 55.29 | – | 4.19 | 13.2 | 2.03 | 0.92 | 50.2 | – | 0.58 |
| EO4|$^{300}_{\rm {IS}}$| | A | 0.01 | 70.53 | 13.83 | 15.98 | 6.95 | 8.97 | 50.89 | 10.17 | 5.12 | 9.94 | 3.08 | 1.56 | 48.5 | 11.5 | 0.69 |
| EO7|$^{300}_{\rm {IS}}$| | A | 0.01 | 66.56 | 15.71 | 18.53 | 6.22 | 12.3 | 40.38 | 8.07 | 5.47 | 7.38 | 2.67 | 0.99 | 45.8 | 10.2 | 0.58 |
| FO4|$^{300}_{\rm {IS}}$| | A | 0.01 | 72.94 | 11.79 | 15.06 | 6.27 | 8.73 | 57.60 | 11.51 | 4.94 | 11.66 | 3.21 | 1.44 | 50.2 | 11.9 | 0.68 |
| FO7|$^{300}_{\rm {IS}}$| | A | 0.01 | 73.01 | 10.86 | 17.79 | 5.36 | 12.4 | 55.45 | 11.08 | 5.07 | 10.94 | 3.09 | 0.94 | 50.2 | 11.8 | 0.57 |
| EO4|$^{300}_{\rm {IS}}$| | A | 0.1 | 70.53 | 13.95 | 8.55 | 7.05 | 1.42 | 60.03 | 12.00 | 4.43 | 13.55 | 2.51 | 1.65 | 48.5 | 9.83 | 0.69 |
| EO7|$^{300}_{\rm {IS}}$| | A | 0.1 | 66.56 | 15.89 | 8.23 | 6.58 | 1.58 | 53.03 | 10.60 | 4.50 | 11.78 | 2.07 | 1.13 | 45.8 | 7.76 | 0.58 |
| FO4|$^{300}_{\rm {IS}}$| | A | 0.1 | 72.94 | 11.89 | 8.04 | 6.61 | 1.36 | 66.25 | 13.24 | 4.29 | 15.44 | 2.65 | 1.65 | 50.2 | 10.1 | 0.70 |
| FO7|$^{300}_{\rm {IS}}$| | A | 0.1 | 73.01 | 11.04 | 7.40 | 5.72 | 1.59 | 68.21 | 13.63 | 4.23 | 16.13 | 2.49 | 1.09 | 50.2 | 9.42 | 0.57 |
Notes. (1) Model name. (2) SF scheme adopted (×= noSF, P = pSF, A = aSF). (3) SF efficiency. (4)–(5) Cumulative mass injected by the evolution of the original stellar population, and mass escaped from the numerical grid, respectively. Differences in Minj for models of same LB are accounted for by different sampling of the stellar density profile over the numerical grid. (6) Total ISM mass retained within the galaxy. (7)–(8) ISM mass with T > 106 K, and T < 2 × 10⁴ K, respectively. (9) Mass of the new stars. (10) Cumulative mass ejected by type II SNe. (11)–(13) Mean formation time of the new stars, mean SFR, and SFR at the end of the simulations. (14) ISM X-ray luminosity in the 0.3–8 keV band. (15)–(16): SNIa and SNII kinetic energy input per unit time (Section 2.2.2). (17) ISM X-ray emission weighted temperature in the 0.3–8 keV band.
Relevant quantities at t = 13 Gyr for the rotating models (k = 1) with σe8=200 km s−1.
| Name | SF | ηSF | Minj | Mesc | Mgas | Mhot | Mc | |$M_*^{\rm new}$| | |$M_\mathrm{inj}^{\rm II}$| | |$\langle t\rangle _*^{\rm new}$| | |$M_*^{\rm new}/\langle t\rangle _*^{\rm new}$| | SFR | LX | LSNIa | LSNII | TX |
|---|---|---|---|---|---|---|---|---|---|---|---|---|---|---|---|---|
| (109 M⊙) | (109 M⊙) | (109 M⊙) | (109 M⊙) | (109 M⊙) | (109 M⊙) | (109 M⊙) | (Gyr) | (M⊙ yr−1) | (M⊙ yr−1) | (1040 erg s−1) | (1040 erg s−1) | (1040 erg s−1) | (keV) | |||
| (1) | (2) | (3) | (4) | (5) | (6) | (7) | (8) | (9) | (10) | (11) | (12) | (13) | (14) | (15) | (16) | (17) |
| EO4|$^{200}_{\rm {IS}}$| | × | – | 11.92 | 9.76 | 2.39 | 0.15 | 2.24 | – | – | – | – | – | 0.0007 | 10.2 | – | 0.50 |
| EO7|$^{200}_{\rm {IS}}$| | × | – | 11.93 | 10.34 | 1.84 | 0.24 | 1.57 | – | – | – | – | – | 0.002 | 10.2 | – | 0.49 |
| FO4|$^{200}_{\rm {IS}}$| | × | – | 12.00 | 3.32 | 8.80 | 1.73 | 6.97 | – | – | – | – | – | 0.449 | 10.3 | – | 0.37 |
| FO7|$^{200}_{\rm {IS}}$| | × | – | 11.96 | 3.41 | 8.69 | 1.36 | 7.16 | – | – | – | – | – | 0.248 | 10.2 | – | 0.32 |
| EO4|$^{200}_{\rm {IS}}$| | P | 0.01 | 12.07 | 4.32 | 3.28 | 1.63 | 1.57 | 4.47 | – | 6.61 | 0.68 | 0.45 | 0.110 | 10.3 | – | 0.39 |
| EO7|$^{200}_{\rm {IS}}$| | P | 0.01 | 12.09 | 10.43 | 0.34 | 0.27 | 3.99E-2 | 1.32 | – | 3.84 | 0.34 | 0.02 | 0.003 | 10.3 | – | 0.50 |
| FO4|$^{200}_{\rm {IS}}$| | P | 0.01 | 12.14 | 6.65 | 0.68 | 0.43 | 2.19E-1 | 4.80 | – | 4.20 | 1.14 | 0.08 | 0.006 | 10.4 | – | 0.40 |
| FO7|$^{200}_{\rm {IS}}$| | P | 0.01 | 12.08 | 2.98 | 3.12 | 1.57 | 1.40 | 5.99 | – | 5.39 | 1.11 | 0.37 | 0.163 | 10.3 | – | 0.36 |
| EO4|$^{200}_{\rm {IS}}$| | P | 0.1 | 12.07 | 4.65 | 2.00 | 1.77 | 7.31E-2 | 5.42 | – | 5.74 | 0.94 | 0.12 | 0.086 | 10.3 | – | 0.40 |
| EO7|$^{200}_{\rm {IS}}$| | P | 0.1 | 12.09 | 10.07 | 0.32 | 0.29 | 0.00 | 1.71 | – | 2.37 | 0.72 | 0.00 | 0.003 | 10.3 | – | 0.51 |
| FO4|$^{200}_{\rm {IS}}$| | P | 0.1 | 12.14 | 3.75 | 3.64 | 2.88 | 8.98E-4 | 4.74 | – | 3.28 | 1.45 | 0.08 | 0.587 | 10.4 | – | 0.43 |
| FO7|$^{200}_{\rm {IS}}$| | P | 0.1 | 12.08 | 5.79 | 0.49 | 0.40 | 1.98E-2 | 5.81 | – | 3.43 | 1.69 | 0.04 | 0.010 | 10.3 | – | 0.50 |
| EO4|$^{200}_{\rm {IS}}$| | A | 0.01 | 12.07 | 9.40 | 0.27 | 0.17 | 9.92E-2 | 3.00 | 0.60 | 3.90 | 0.77 | 0.05 | 0.001 | 10.3 | 0.18 | 0.54 |
| EO7|$^{200}_{\rm {IS}}$| | A | 0.01 | 12.09 | 9.70 | 0.47 | 0.24 | 2.09E-1 | 2.40 | 0.48 | 4.39 | 0.55 | 0.06 | 0.002 | 10.32 | 0.24 | 0.49 |
| FO4|$^{200}_{\rm {IS}}$| | A | 0.01 | 12.14 | 6.77 | 0.98 | 0.72 | 1.86E-1 | 5.47 | 1.09 | 4.11 | 1.33 | 0.09 | 0.011 | 10.4 | 0.36 | 0.43 |
| FO7|$^{200}_{\rm {IS}}$| | A | 0.01 | 12.08 | 3.09 | 3.77 | 1.42 | 2.19 | 6.53 | 1.30 | 5.27 | 1.24 | 0.69 | 0.460 | 10.3 | 2.58 | 0.29 |
| EO4|$^{200}_{\rm {IS}}$| | A | 0.1 | 12.07 | 7.77 | 0.29 | 0.28 | 7.34E-4 | 5.02 | 1.00 | 3.72 | 1.35 | 0.00 | 0.002 | 10.3 | 0.01 | 0.53 |
| EO7|$^{200}_{\rm {IS}}$| | A | 0.1 | 12.09 | 8.27 | 0.80 | 0.62 | 5.66E-2 | 3.78 | 0.76 | 5.34 | 0.71 | 0.06 | 0.012 | 10.3 | 0.24 | 0.44 |
| FO4|$^{200}_{\rm {IS}}$| | A | 0.1 | 12.14 | 6.00 | 1.48 | 1.19 | 8.70E-4 | 5.81 | 1.16 | 3.10 | 1.88 | 0.01 | 0.041 | 10.4 | 0.05 | 0.44 |
| FO7|$^{200}_{\rm {IS}}$| | A | 0.1 | 12.08 | 3.82 | 3.82 | 3.28 | 2.55E-3 | 5.57 | 1.11 | 2.92 | 1.91 | 0.11 | 0.982 | 10.3 | 0.40 | 0.41 |
Note. All quantities as in Table 2.
Relevant quantities at t = 13 Gyr for the rotating models (k = 1) with σe8=250 km s−1 (aSF only).
| Name | SF | ηSF | Minj | Mesc | Mgas | Mhot | Mc | |$M_*^{\rm new}$| | |$M_\mathrm{inj}^{\rm II}$| | |$\langle t\rangle _*^{\rm new}$| | |$M_*^{\rm new}/\langle t\rangle _*^{\rm new}$| | SFR | LX | LSNIa | LSNII | TX |
|---|---|---|---|---|---|---|---|---|---|---|---|---|---|---|---|---|
| (109 M⊙) | (109 M⊙) | (109 M⊙) | (109 M⊙) | (109 M⊙) | (109 M⊙) | (109 M⊙) | (Gyr) | (M⊙ yr−1) | (M⊙ yr−1) | (1040 erg s−1) | (1040 erg s−1) | (1040 erg s−1) | (keV) | |||
| (1) | (2) | (3) | (4) | (5) | (6) | (7) | (8) | (9) | (10) | (11) | (12) | (13) | (14) | (15) | (16) | (17) |
| EO4|$^{250}_{\rm {IS}}$| | × | – | 31.68 | 8.28 | 23.84 | 4.02 | 19.8 | – | – | – | – | – | 0.76 | 23.9 | – | 0.55 |
| EO7|$^{250}_{\rm {IS}}$| | × | – | 30.63 | 11.42 | 19.71 | 3.42 | 16.3 | – | – | – | – | – | 0.33 | 23.1 | – | 0.55 |
| EO4|$^{250}_{\rm {IS}}$| | A | 0.1 | 32.14 | 8.39 | 4.84 | 4.41 | 0.40 | 23.64 | 4.72 | 4.35 | 5.43 | 0.86 | 1.01 | 24.2 | 3.25 | 0.57 |
| EO7|$^{250}_{\rm {IS}}$| | A | 0.1 | 31.10 | 11.42 | 4.47 | 4.31 | 0.16 | 19.01 | 3.80 | 4.13 | 4.60 | 0.42 | 0.66 | 23.4 | 1.57 | 0.58 |
| EO4|$^{250}_{\rm {IS}}$| | A | 0.01 | 32.14 | 8.28 | 7.17 | 4.06 | 3.08 | 20.87 | 4.17 | 5.06 | 4.12 | 1.14 | 0.82 | 24.2 | 4.31 | 0.56 |
| EO7|$^{250}_{\rm {IS}}$| | A | 0.01 | 31.10 | 11.18 | 6.92 | 4.00 | 2.90 | 16.24 | 3.24 | 5.32 | 3.05 | 0.93 | 0.51 | 23.4 | 3.55 | 0.52 |
Note. All quantities are as in Table 2.
Relevant quantities at t = 13 Gyr for the mildly rotating models (k = 0.1) with σe8=250 km s−1 (aSF only).
| Name | SF | ηSF | Minj | Mesc | Mgas | Mhot | Mc | |$M_*^{\rm new}$| | |$M_\mathrm{inj}^{\rm II}$| | |$\langle t\rangle _*^{\rm new}$| | |$M_*^{\rm new}/\langle t\rangle _*^{\rm new}$| | SFR | LX | LSNIa | LSNII | TX |
|---|---|---|---|---|---|---|---|---|---|---|---|---|---|---|---|---|
| (109 M⊙) | (109 M⊙) | (109 M⊙) | (109 M⊙) | (109 M⊙) | (109 M⊙) | (109 M⊙) | (Gyr) | (M⊙ yr−1) | (M⊙ yr−1) | (1040 erg s−1) | (1040 erg s−1) | (1040 erg s−1) | (keV) | |||
| (1) | (2) | (3) | (4) | (5) | (6) | (7) | (8) | (9) | (10) | (11) | (12) | (13) | (14) | (15) | (16) | (17) |
| EO4|$^{250}_{k=0.1 }$| | × | – | 32.14 | 8.63 | 23.51 | 4.78 | 18.7 | – | – | – | – | – | 5.82 | 24.2 | – | 0.69 |
| EO7|$^{250}_{k=0.1 }$| | × | – | 31.10 | 12.94 | 18.17 | 3.44 | 14.7 | – | – | – | – | – | 2.20 | 23.4 | – | 0.69 |
| EO4|$^{250}_{k\rm {=0.1}}$| | A | 0.1 | 32.14 | 8.46 | 5.13 | 5.04 | 0.086 | 23.20 | 4.64 | 4.28 | 5.42 | 1.01 | 6.33 | 24.2 | 3.76 | 0.67 |
| EO7|$^{250}_{k\rm {=0.1}}$| | A | 0.1 | 31.10 | 13.06 | 3.63 | 3.56 | 0.065 | 18.01 | 3.60 | 4.03 | 4.47 | 0.45 | 2.78 | 23.4 | 1.76 | 0.68 |
| EO4|$^{250}_{k\rm {=0.1}}$| | A | 0.01 | 32.14 | 8.58 | 5.28 | 4.84 | 0.442 | 22.84 | 4.56 | 4.46 | 5.12 | 0.91 | 6.39 | 24.2 | 3.69 | 0.66 |
| EO7|$^{250}_{k\rm {=0.1}}$| | A | 0.01 | 31.10 | 12.96 | 4.14 | 3.48 | 0.656 | 17.50 | 3.50 | 4.22 | 4.14 | 0.63 | 2.51 | 23.4 | 2.32 | 0.68 |
Note. All quantities are as in Table 2.
3 RESULTS
Each simulation starts with the galaxy empty of gas, when the age of the original stellar population is 2 Gyr, and the ISM evolution is followed for the next 11 Gyr. Tables 2–5 list for all models the main quantities of interest at the end of the simulations; the tables also list the same quantities for the corresponding models without SF taken from N14 (hereafter ‘noSF’ models). First (Section 3.1), we present the main results focusing on the two sets of re-simulated models with largely differing values for the galaxy mass (i.e. the two sets with E0 counterpart of σe8 = 200 and 300 km s−1, the LM and HM models). In Section 3.2, we concentrate on the intermediate mass models (run only for the aSF), where this time k is equal to 1 or lower (k = 0.1). In Sections 3.3 and 3.4, we discuss the consumption of cold gas mass and the formation of new stars. Finally, we investigate the relationship between the adopted recipe for SF (equation 1) and the Kennicutt–Schmidt relation (Section 3.5).
3.1 Comparison between noSF and SF models
In a short summary, for noSF models, N14 found that rotation in LM galaxies favours the establishment of global winds, with the consequent reduction of LX; in medium-to-high mass galaxies the conservation of angular momentum lowers the hot gas density in the central galactic region, leading again to a reduction of LX, and also of TX (because the external and colder regions weight more in the computation of TX). In LM galaxies, instead, TX can become higher if rotation triggers a wind, due to the decrease of the ISM density, and the additional heating due to the high meridional velocities of the escaping material (see equation 7).
The first important result here is that when SF is added (both in the pSF and aSF modalities), the hot ISM evolution remains substantially similar to that found by N14 without SF, for models of the same mass. As a consequence of the insensitivity of the general behaviour to the addition of SF, the values of LX and TX for the models with SF, and their trends with the main galactic structural properties, are on average very similar to those found by N14. Therefore, the conclusions of N14 about the importance of shape and rotation in determining LX and TX, also as a function of galaxy mass, are confirmed. Fig. 1 demonstrates this result by plotting the final LX and TX values for the same rotating galaxy models evolved with noSF and with SF (with ηSF = 0.01): the distribution of the points in the noSF and SF panels is very similar (and the analogous figure with the ηSF = 0.1 models produces the same conclusions). In particular, LX of HM models is only marginally sensitive to the presence of SF, while in LM models SF can introduce variations of LX; however, these keep within the (large) range of LX values already found in N14 without SF. Thus, SF adds another cause of spread for LX, at lower galaxy masses. Fig. 2 shows the resulting LX versus TX for the aSF models, compared with the same quantities derived recently from Chandra data for the hot gas of ETGs (Boroson et al. 2011; Kim & Fabbiano 2015). From the latter two samples, we have selected only ETGs of morphological type later than E3, for a proper comparison with our models. Overall, the simulation results agree well with the observed X-ray properties of real ETGs (except perhaps for the most X-ray luminous models that may be slightly hotter than observed).
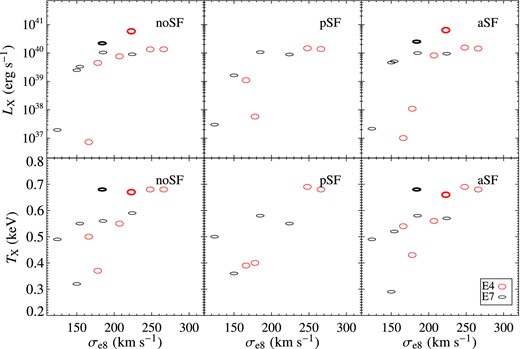
Top panels: ISM X-ray luminosity LX in the 0.3–8 keV band at 13 Gyr as a function of σe8, for the selection of 10 models from N14 re-simulated here (Table 1), plus two models with σe8 = 250 km s−1 for the E0 counterpart, and k = 0.1 (shown with thicker ellipses). The three panels (from left to right) refer to the same models without SF (from N14), with passive SF, and with active SF (with ηSF = 0.01). Bottom panels: the same for the X-ray emission weighted temperature TX in the 0.3–8 keV band at 13 Gyr. All LX and TX values are given in Tables 2–5. See Section 3.1 for more details.
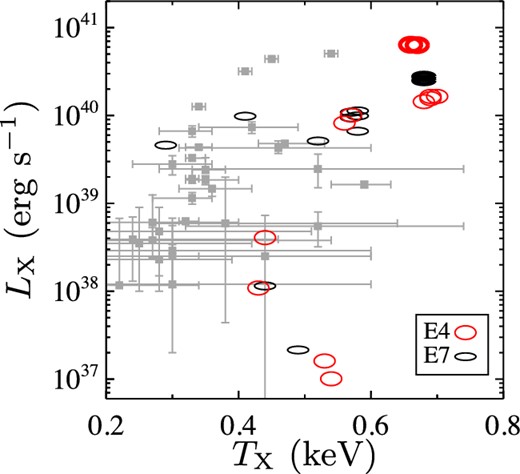
LX as a function of TX for aSF models listed in Tables 1–5 (open ellipses, as in Fig. 1), compared with Chandra data for the hot gas of ETGs taken from Boroson, Kim & Fabbiano (2011) and Kim & Fabbiano (2015, grey squares with error bars). From the latter two samples, we selected only ETGs of morphological type later than E3, for a proper comparison with our models.
The reason for variations in LX linked with SF in LM models is given by anticipations or delays in the most conspicuous features of their typical flow behaviour: N14 found (and the present simulations confirm) that the ISM in rotating models experiences periodic cooling episodes, where the gas injected by the stellar population accumulates until the radiative losses become catastrophic. In these episodes, the ISM quickly cools, emitting a large part of its internal energy as radiation; peaks in LX and throats in TX are then produced, as apparent in Fig. 5. The tenuous hot atmosphere left after a major cooling is then replenished by the new mass injection from the stellar population. In correspondence of the formation of these significant amounts of cold material (with short cooling times) SF is enhanced, and peaks in pace with LX, as discussed in Section 3.4. On the contrary, very little variations of the flow due to SF are seen in HM galaxies. Figs 3 –5 give particular examples of the general similarity in the hydrodynamical evolution of noSF and SF models, by plotting in parallel the ISM evolution for the noSF, pSF, and aSF cases; at the same time, the figures point out how this similarity is very close for HM models (see Fig. 4, for the HM model EO7|$^{300}_{\rm IS}$|), while some differences can be present in LM ones (see Fig. 3, for the LM model EO7|$^{200}_{\rm IS}$|). Notably, the hot ISM evolution in the HM models is practically identical with and without SF (see also Fig. 5): a massive cold disc forms early, and afterwards, even when it is mostly consumed by SF (see Section 3.3 below), around the disc the hot ISM evolution proceeds almost unaltered by the energy and mass injection from SNII's. Less massive models, instead, are sensitive to the inclusion of SF, similarly to what found in previous studies where they showed to be very sensitive to any change in the galaxy properties (e.g. the mass distribution, the stellar population inputs, the stellar kinematics; Ciotti et al. 1991, N14). As shown by Figs 3 and 5, for the EO7|$^{200}_{\rm IS}$| galaxy, at around 4 Gyr the noSF and the pSF models have already past their major cooling episode (see the peak in LX in Fig. 5) followed by the onset of a wind, and the equatorial outflow becomes stronger and stronger thereafter (see how the purple regions become more and more extended in Fig. 3, starting from 4.6 Gyr, and the sharp and steady decline in LX in Fig. 5). The aSF model, instead, has its major cooling catastrophe much later, as shown by the prominent dark green region in Fig. 3 at ≃8 Gyr, which emits a conspicuous amount of radiation in the X-ray band, thus prompting the corresponding peak in LX in Fig. 5. This delay in the major cooling episode, preceding the onset of a wind, is due to the newly formed stars that inject mass, and most importantly heat, in the ISM; thanks to this heat the galaxy can remain hot gas rich until ≃8 Gyr, when finally the major cooling takes place. pSF, where mass is not injected instead, corresponds to an evolution very similar to that without SF.
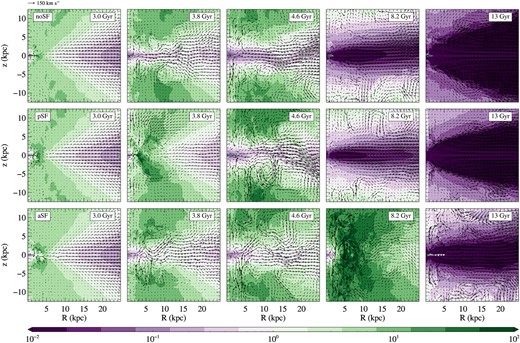
Meridional sections of the heating over cooling time ratio for the LM EO7|$^{200}_\mathrm{IS}$| model, at a selection of representative times (indicated as galaxy ages in the top right of each panel). The heating time is |$t_\mathrm{heat}=E/\dot{E}$| (where |$\dot{E}$| is the source term given in equation 7); the cooling time is defined in Section 2.2.1. From left to right, each column refers to the noSF, pSF, and aSF (with ηSF = 0.1) models, respectively. Arrows describe the meridional velocity field; their length is proportional to the modulus of the gas velocity in the (z, R) plane, according to a scale shown in the bottom-left corner. See Section 3.1 for more details.
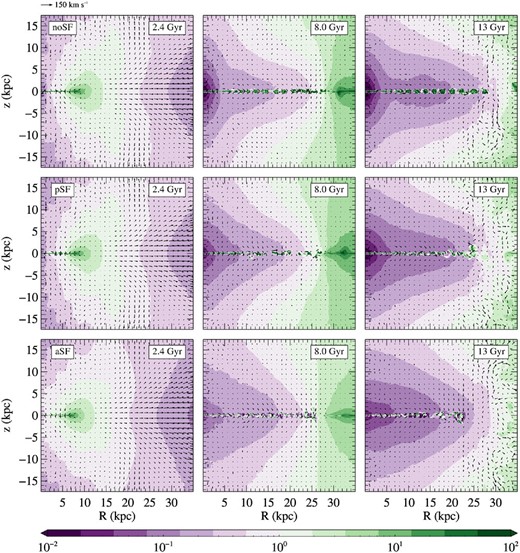
Meridional sections of the heating over cooling time ratio for the HM EO7|$^{300}_\mathrm{IS}$| model. From top to bottom, each row refers to the noSF, pSF, and aSF (with ηSF = 0.1) models, respectively. Arrows describe the velocity field, as in Fig. 3. Note the large cold disc, that does not completely disappear with SF. See Section 3.1 for more details.
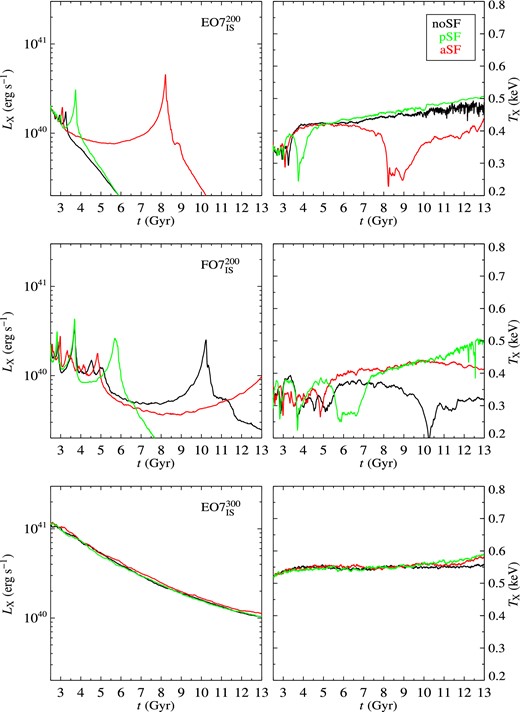
Time evolution of the X-ray luminosity LX and X-ray emission weighted temperature TX for the EO7|$^{200}_\mathrm{IS}$| (top panels), FO7|$^{200}_\mathrm{IS}$| (middle panels), EO7|$^{300}_\mathrm{IS}$| (bottom panels) models. The black, green, and red lines refer to the noSF model, and to the passive and active SF schemes, respectively, with ηSF = 0.1. The FO7|$^{300}_\mathrm{IS}$| model has an evolution almost identical to that of EO7|$^{300}_\mathrm{IS}$| shown here. See Section 3.1 for more details.
A complementary illustration of the different behaviour between the HM and the LM galaxies is given by Fig. 5, that shows the LX and TX evolution for the same models of Figs 3 and 4, plus another set of three models representative of the LM class, the FO7|$^{200}_{\rm IS}$| ones. In LM models, a number of cooling episodes (peaks in LX) typically take place, possibly terminated by a major one that is followed by the onset of a wind and the clearing of the ISM from the galaxy (as in N14). The galaxy mass distribution in the FO7|$_{\rm IS}^{\rm 200}$| models (middle panels of Fig. 5), is more concentrated than in the EO7|$^{200}_{\rm IS}$| ones, thus the last major peak in LX is delayed with respect to what happens for the EO7|$^{200}_{\rm IS}$| models. Thus, in the FO7|$_{\rm IS}^{\rm 200}$| galaxy, aSF produces a delay in the major cooling episode that is even longer than for the EO7|$_{\rm IS}^{\rm 200}$| aSF model, to the point that it does not take place within the present epoch. pSF instead produces its anticipation with respect to what shown in the noSF case (Fig. 5), due to pSF subtracting gas and leaving a lower density region, radiating less and more easy to push out of the galaxy.
A final, general result is also that the evolution of a model with SF is more and more different from that of its corresponding noSF model, when increasing ηSF.
For illustration purposes, Fig. 6 shows a meridional section of the density distribution of the newly formed stars at the end of the simulations, for the models in Fig. 5. One can notice the more extended and massive disc in HM models, where it is also quite independent of the pSF or aSF scheme. On the contrary, in LM models, the disc is much less extended, and it can become larger (for the EO7|$^{200}_\mathrm{IS}$| model) or smaller (for the FO7|$^{300}_\mathrm{IS}$| model) when switching from the pSF to the aSF scheme; this is another evidence of the high sensitivity of the flow evolution to any change in the input parameters, at low galaxy masses.
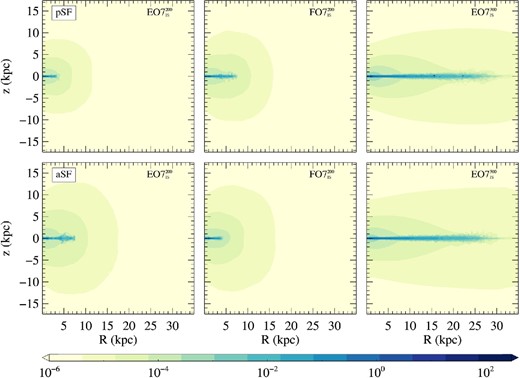
Meridional sections of the density distribution of the new stars formed up to 13 Gyr (in units of M⊙ pc−3), for the same models of Figs 5 and 8: EO7|$^{200}_\mathrm{IS}$| (left-hand panels), FO7|$^{200}_\mathrm{IS}$| (middle panels), and EO7|$^{300}_\mathrm{IS}$| models (right-hand panels). Top and bottom panels refer, respectively, to pSF and aSF simulations, with ηSF = 0.1.
3.2 Intermediate mass ETGs
Here, we present the results for two representative models, of E4 and E7 shapes, with intermediate galaxy mass (σe8 = 250 km s−1 for the E0 counterpart, see Table 1), that have been run with the same kinematic configuration of the LM and HM models presented previously (k = 1, isotropic rotator), and also with a lower rotation (k = 0.1). For these, only aSF has been considered, with ηSF = 0.01 and ηSF = 0.1. The final values for the most relevant quantities of these eight models are presented in Tables 4 and 5.
The E4 models with k = 1 show the same smooth evolution of the HM models, i.e. no or very small oscillations in LX and TX (see the dashed lines in Fig. 7, similar to those in Fig. 5); in fact, the evolution of the hot gas is similarly not affected by SF. The E7 models with k = 1, instead, show oscillations in LX and TX, similar to those of the EO7|$^{200}_{\rm IS}$| and FO7|$^{200}_{\rm IS}$| models, but fewer and less pronounced (see the solid lines in Fig. 7, to be compared with those in Fig. 5). In the aSF model the final LX is larger than for the noSF case, as found for the FO7|$^{200}_{\rm IS}$| models (Section 3.1).
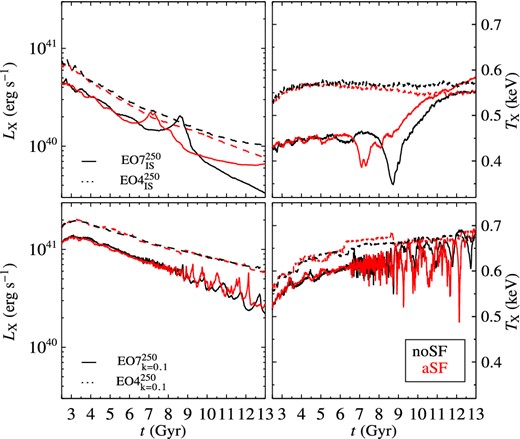
Time evolution of the X-ray luminosity LX and X-ray emission weighted temperature TX for the EO4|$^{250}_\mathrm{IS}$| and EO7|$^{250}_\mathrm{IS}$| models (top panels), and for the EO4|$^{250}_{k=0.1}$| and EO7|$^{250}_{k=0.1}$| models (bottom panels). For the aSF models, ηSF = 0.1. See Section 3.2 for more details.
In models with rotational velocities reduced by a factor of 10 (k = 0.1), LX and TX increase largely, as expected from the results of N14 showing a larger LX and TX in non-rotating galaxies (k = 0). Again the E4 models show no oscillations in LX and TX, while the E7 models show numerous small oscillations in LX and TX, that increase in amplitude with time increasing (Fig. 7). The cold gas disc is much less extended: its radius is ≲ 1 kpc for k = 0.1, and ≲ 10 kpc for k = 1 (slightly larger for flatter shape, and for lower ηSF).
3.3 Mass exchange between the cold disc and the new stars
The second main result of the new simulations is that most of the cold gas disc is consumed by SF, both for pSF and aSF. This result, of general validity, is shown for the particular models of Fig. 5 in Fig. 8, where the cold gas mass Mc of the noSF models (black solid line) is at the end very close to that of the new stars |$M_*^{\rm new}$| (dashed lines). For example, the EO7|$_\mathrm{IS}^{\rm 200}$| model in the noSF case has a cold disc extending out to a 2.5 kpc radius, of Mc = 1.6 × 10⁹ M⊙, while the corresponding pSF model at the end has no cold disc, and a mass in new stars of |$M_*^{\rm new}\simeq 1.7\times 10^9$| M⊙ (a bit more gas has cooled in the pSF case than in the noSF case). Similarly, this same galaxy model, with aSF and ηSF = 0.1, at the end has a cold disc of just Mc ≃ 5.7 × 10⁷ M⊙, and |$M_*^{\rm new}\simeq 3.8\times 10^9$| M⊙. This |$M_*^{\rm new}$| is larger (approximately double) than for the pSF case, a fact that is partly accounted for by the injected mass from the new stars in the aSF model,2 and mostly by the delay in the final cooling episode after which a galactic wind is established (Fig. 5); this delay keeps the galaxy gas-rich and star forming for a longer time (which is proved also by the lower escaped mass Mesc in the aSF than in the pSF case, see Table 3).
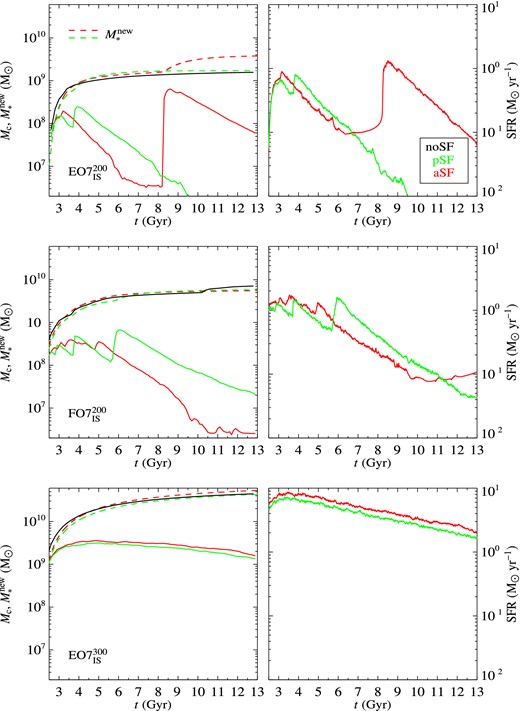
Left-hand panels: time evolution of the cold gas mass Mc (solid lines), and of the cumulative mass in newly formed stars |$M_*^{\rm new}$| (dashed lines). Right-hand panels: time evolution of the SFR rates. The models are the same of Fig. 5. The black line refers to the noSF model, green, and red lines refer to pSF and aSF, respectively, with ηSF = 0.1. Note how Mc is much reduced in the SF models (green and red solid lines) with respect to the noSF models (black lines), and how at the same time |$M_*^{\rm new}$| (dashed lines) reaches close to the noSF Mc values. See Section 3.3 for more details.
In general, the LM models with SF show a final Mc that can range from 0 to 109 M⊙, but is typically ≲ 108 M⊙ (Fig. 9 and Table 3). The final mass in the newly formed stellar disc is of the order of |$M_*^{\rm new}\simeq$|a few ×109 M⊙; thus, the |$M_*^{\rm new}$| values reach almost those of the Mc of the corresponding noSF models (Table 3; Fig. 9). temperature below 2× 10⁴K.

Top panels: final values of the cold gas mass, for the models in Tables 2–5 without SF (left-hand panel), and with aSF, for the two different ηSF values adopted here. Middle and bottom panels: final values of the stellar mass in newly formed stars |$M_*^{\rm new}$|, of the SFR normalized to the original M*, and of the mean formation time of the new stars |$\langle t\rangle _*^{\rm new}$|, calculated from the beginning of the simulation, for the same models with aSF in the top panels. All values are given in Tables 2–5. See Sections 3.3 and 3.4 for more details.
Also in the HM models, similarly to what found for the LM models, |$M_*^{\rm new}$| at the end of the simulations is of the order of the Mc values of the noSF models. A larger massive disc remains in the HM models, though, even when including SF (e.g. Figs 8 and 9). Their final Mc is ≃109 M⊙, for ηSF = 0.1 (≃1/50 of Mc without SF), and (8–12) × 109 M⊙, if ηSF = 0.01 (Mc ≃ 1/5 of Mc without SF), independently of pSF or aSF. As found for the LM galaxies, in the aSF models |$M_*^{\rm new}$| is larger than in the pSF ones, and can be even larger than Mc of the noSF models (Figs 8 and 9). This time, though, the difference is lower, of ≃20 per cent, and corresponds to secondary SF sustained by the material injected by the new stars. The final mass in the newly formed stellar disc is of the order of |$M_*^{\rm new}\simeq$|a few× 1010 M⊙ (Table 2). However, it must be noted that the structural properties of the HM models may not be very realistic: ETGs of this mass with the isotropic rotator kinematics are quite unlikely, since they are not observed to rotate this much (Emsellem et al. 2011). Real massive galaxies will have less rotation than adopted here with k = 1, and then they will have less cold gas and less new stars.
More realistic massive and rotating ETGs are those of Section 3.2, with aSF. For these, if k = 1, the final cold gas mass is again largely reduced when introducing SF, by a factor of ≃ 50 (E4) and ≃ 100 (E7), when ηSF = 0.1. At 13 Gyr, Mc is few× 109 M⊙ for ηSF = 0.01, and few× 108 M⊙ for ηSF = 0.1; |$M_*^{\rm new}$| is ≃2 × 10¹⁰ M⊙, for both ηSF values. If k = 0.1, the final Mc is reduced even more than for the k = 1 models (Fig. 9), for both the E4 and E7 shapes: Mc is a few ×108 M⊙ (ηSF = 0.01), and ≲ 108 M⊙ (ηSF = 0.1). Note that the final cold mass Mc, without SF, is similarly large for the k = 1 and 0.1 models (Tables 4 and 5; Fig. 9), but it is instead lower for the k = 0.1 models than for the k = 1 ones, when adding SF; one could conclude that in the k = 0.1 models SF is more efficient, because it takes place in a cold disc which is smaller and denser, or that the evolution is different, if less gas overall cooled (the heating was more efficient). The second hypothesis is supported by the finding that, at the end of the simulations, |$M_*^{\rm new}$| is similar for k = 1 and 0.1 (e.g. 2.4 and 2.3 × 10¹⁰ M⊙ for the E4 models, respectively, with k = 1 and 0.1, for ηSF = 0.1), and similarly larger than Mc of the corresponding noSF models (e.g. 2.0 and 1.9 × 10¹⁰ M⊙, for the E4 models, respectively, with k = 1 and 0.1).
In conclusion, SF seems to be an important mechanism to solve the worrisome feature of massive cold gas discs in rotating ETGs without SF. In addition, we found the following trends, at the end of the simulations (see also the top two rows of panels of Fig. 9): Mc increases with M*, and has a large spread for LM models, that increases for larger ηSF; Mc/M* is roughly constant with M*, with a spread reaching down to values much lower than this constant for LM models; at any M*, Mc decreases when ηSF increases. |$M_*^{\rm new}$| and |$M_*^{\rm new}/M_*$| increase with M*, with a spread for LM models, and are roughly independent of ηSF. This latter result means that more massive ETGs have been overall more efficient in forming stars from recycled material, considering their past ≃11 Gyr.
3.4 The SF history
SF is not only responsible for the final mass budget of Mc and |$M_*^{\rm new}$|, but also for the rate of SF (SFR), its evolution, and the (fiducial) age of |$M_*^{\rm new}$|; that is, for the SF history that we discuss here. SF shows a different evolution in LM and HM galaxies, in pace with their different ISM evolution (see Fig. 8). In LM galaxies, where major cooling episodes take place recursively, the SFR peaks suddenly in correspondence of these cooling events due to the increased density of cold gas, and declines right after, going eventually to practically zero either if the cold gas reservoir is completely consumed or the cooling episode is followed by a global wind (Section 3.1). Thus, in general LM galaxies have a larger and peaked SFR in their past (reaching 1–2 M⊙ yr−1), when the rate of stellar mass losses due to the original stellar population was much larger, and a low SFR ( ≲ 0.1 M⊙ yr−1) at the present epoch. Typical values at 13 Gyr can be as low as zero, and at most as high as 0.45 M⊙ yr−1 (Table 3). These values compare well with the current rates estimated for the ATLAS3D sample, that range from ≈0.01 and 3 M⊙ yr−1, with a median value of 0.15 M⊙ yr−1 for ETGs of σe8 comparable to those of the LM models run here (Davis et al. 2014). HM galaxies, instead, show a more regular and steady production of cold gas, and so is their SFR (Fig. 8); at 13 Gyr, their SFR is 2–3 M⊙ yr−1 (Table 2; but we recall these models are not realistic). In the intermediate mass models (Section 3.2), the SFR is larger for the E4 models without oscillations in LX than for the E7 ones. Overall, the SFR at 13 Gyr is similar for k = 1 and 0.1: for k = 1, the SFR ranges from 0.42 to 1.1 M⊙ yr−1 (i.e. it is larger than for the LM models of same k = 1); when k = 0.1, the SFR ranges from 0.45 to 1.0 M⊙ yr−1. Fig. 9 summarizes the present epoch SFR behaviour, as a function of M*, for the aSF models. To compare models of different mass, the plotted quantity is the SFR normalized to M*. This quantity is ∼(1–4) × 10−3 Gyr−1, quite independent of ηSF, for the intermediate mass and HM models; it can be largely varying for the LM models (from 4 × 10⁻⁴ to 6 × 10⁻³ Gyr−1, for ηSF = 0.1, and from 8 × 10⁻⁵ to ∼10−3 Gyr−1, for ηSF = 0.01). On average, the present epoch SFR/M* increases with M*, a result similar to that of the previous Section 3.3, where we found that the integration over time of the SFR, that is |$M_*^{\rm new}$|, and |$M_*^{\rm new}/M_*$|, increase with M*.
For the aSF, for ηSF = 0.01, the upper envelope of the more recent formation times (largest |$\langle t\rangle _*^{\rm new}$| values) is ≃ 5.5 Gyr, roughly independent of M*, while the lower envelope (lowest |$\langle t\rangle _*^{\rm new}$| values) increases with M*. A similar trend is shown by the HM and intermediate mass models, for ηSF = 0.1, but shifted towards lower |$\langle t\rangle _*^{\rm new}$| values ( ≲ 4.5 Gyr); the spread of |$\langle t\rangle _*^{\rm new}$| for LM models keeps instead large, extending to even lower |$\langle t\rangle _*^{\rm new}$| values of ≃ 3 Gyr. The decrease of |$\langle t\rangle _*^{\rm new}$| for larger ηSF, i.e. for a more efficient SF, obtained here from hydrodynamical simulations provides support to the similar conclusion drawn in galaxy formation models focused on chemical evolution: these assume that the efficiency of SF is an increasing function of mass, which for them has – among others – the consequence that smaller galaxies continue to form stars for longer periods, while more massive galaxies host an older stellar population (e.g. Matteucci 1994).
It is interesting that |$\langle t\rangle _*^{\rm new}$| decreases slightly, or remains similar, when switching from pSF to aSF; in fact, one could expect a more extended SF, due to the injection of material from the new stars, for the aSF. Evidently, the net results of the injection of both mass and energy is to produce the bulk of SF at roughly the same time, for the pSF and aSF schemes; only, the final mass in new stars is larger for aSF.
The mean age of the newly formed stars in Gyr is 13|$-t_0-\langle t\rangle _*^{\rm new}$|. This age is in any case larger than ∼5.5 Gyr, for the aSF.
3.5 The SF recipe and the Kennicutt–Schmidt relation
From equation (1) it follows that SF is favoured in regions of high density, and relatively short tSF. These conditions are naturally present in low-temperature regions; accordingly, the simulations show that most of the SF takes place where the gas temperature is ≲ 2 × 10⁴K, i.e. in the cold rotating disc.
Quite obviously, our results depend somehow on the adopted prescription for the SF, while a realistic, physically consistent, description of SF is not available. Yet, it is interesting to ask at what level our implementation of SF recovers some basic observational features of SF. More than half a century ago Schmidt (1959) conjectured that the rate of SF should vary as a power law of the gas density, and later Kennicutt (1998) suggested the parametrization in terms of mass surface densities |$\Sigma _{\rm SFR} = A\Sigma _\mathrm{cold\, gas}^N$|, valid for star-forming galaxies, with N ≃ 1.4–1.5 (Kennicutt & Evans 2012). We investigate here what scaling (if any) the adopted SF recipe of equation (1) produces in terms of ΣSFR versus Σgas, when implemented in the simulations.
Fig. 10 shows for a few representative models at the end of the simulation the relationship between ΣSFR and Σgas, calculated separately for the hotter (T > 2 × 10⁴K) and colder (T ≤ 2 × 10⁴K) phases of the gas; ΣSFR is the face-on projection of |$\dot{\rho }_\mathrm{SF}$|. The figure shows for comparison a recent scaling for the Kennicutt–Schmidt relation, derived by Davis et al. (2014) for the ATLAS3D sample of molecular gas-rich ETGs (this has a slope of N = 1.4). Fig. 10 tells that SF in the gas takes place basically in two regimes, and by far most of it is due to cold gas. The behaviour of the cold gas shows two remarkable features: the first is that a scaling similar to that of the Kennicutt–Schmidt relation is followed quite closely by the blue (cold gas) points; the second is that even the normalization is reasonably well reproduced by our scheme of ‘active SF’, when ηSF = 0.01 (models with ηSF = 0.1 correspond instead to a normalization that is too large). In particular, the cold gas in the logΣSFR–logΣgas plane follows a trend best fitted by a line of slope of ≃ 1.4–1.5, a fact that can be explained as follows. SF in the cold gas is most likely regulated by the dynamical time-scale tdyn, being tcool very short at such temperatures and densities; thus, one roughly expects that |$\dot{\rho }_{\rm SF} \propto \rho ^{1.5}$|. A slope for the ΣSFR–Σgas relation close to the empirical one then follows when neglecting the difference between volume and surface density, which is not unreasonable considering that the cold disc resides mainly in a thin region above and below the equatorial plane, extending vertically for just a couple of gridpoints (<200 pc; see also Kennicutt & Evans 2012). For the hotter gas, the red points in Fig. 10 are invariably fitted by a steeper line, with slope ≃ 2; this is explained by a longer cooling time than the dynamical time, and then by |$\dot{\rho }_{\rm SF} \propto \rho ^{2}$|.
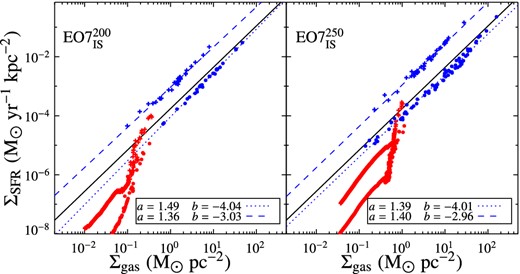
Projected SFR versus mass surface density of the gas (at T < 2 × 10⁴K, for the blue symbols, and at T > 2 × 10⁴K, for the red ones), for two aSF models: EO7|$^{200}_{\rm IS}$| on the left, and EO7|$^{250}_{\rm IS}$| on the right. Full circles refer to ηSF = 0.01 and crosses to ηSF = 0.1. The lower ηSF = 0.01 coefficient for the SF recipe (equation 1) reproduces better the empirical Kennicutt–Schmidt scaling, that is shown by the solid line (with a slope of N = 1.4, and normalized as in Davis et al. (2014) for their ATLAS3D sample of molecular gas-rich ETGs). The blue dotted and dashed lines show the best fits for the cold gas only (coefficients in the frames in the lower right corners). See Section 3.5 for more details.
Overall, Fig. 10 proves that the recipe of equation (1) is very reasonable for SF, and, together with the chosen range of normalization for ηSF, it provides a scaling close to that observed for normal to starburst galaxies. These considerations add strength to the overall results obtained in this study.
4 CONCLUSIONS
In this work, we have explored the effects of SF on the evolution of rotating hot gas flows in ETGs; our previous (N14) high-resolution 2D hydrodynamical simulations of such flows, run for axisymmetric two-component models, were successful in producing the observed LX and TX of flat and rotating ETGs, but also revealed the formation of very massive cooled gas discs. To study the SF effects, we performed hydrodynamical simulations using the same numerical code of N14, where SF with a Salpeter IMF is inserted, following a simple recipe depending on the gas density, and the cooling and dynamical time-scales of the ISM (equation 1), with two possible values for the efficiency of SF (ηSF = 0.01 and 0.1). We considered the new stellar generations to be passive (a pure sink of gas), or active (the new stars contribute mass and energy to the gas flow, via stellar winds and SNIIs). The new simulations have been run for a subsample of the N14 models, of high, intermediate and low galaxy masses, of E4 and E7 shapes, with the ordered stellar rotation described by the isotropic rotator, or with the rotational velocities reduced by a factor of 10.
It is found that subsequent generations of stars are formed from the cold gas that accumulates in the equatorial plane, and that most of the extended and massive cold disc found by N14 is consumed by this process. In particular, the main conclusions are summarized as follows.
Remarkably, both for the passive and the active SF implementation, we confirm the results of the previous investigation without SF, concerning the trends of LX and TX of the hot ISM with galactic rotation. As found by N14, LX is lowered by rotation: in low-mass ETGs this happens because rotation favours the establishment of global winds, and in medium-to-high mass ETGs because rotation lowers the hot gas density in the central galactic region. The average temperature TX is also lower in intermediate/high mass ETGs, when rotation is important, due to the lower contribution of the central regions (usually hotter and denser in non-rotating systems), while it can be higher in low-mass ETGs, if rotation triggers a wind, due to the thermalization of meridional winds.
The robustness of the N14 results even after the addition of SF is explained differently for HM and LM galaxies. In HM galaxies, the evolution of the hot ISM is only marginally sensitive to the presence of SF, and LX and TX evolve smoothly as without SF: a massive cold disc forms early, it is mostly consumed by SF, and around it the hot ISM evolution proceeds almost unaltered by SF (even in presence of energy and mass injection by SNII's). In less massive models, instead, the evolution of LX is not smooth, but shows many peaks corresponding to major cooling episodes, as in N14. The time-occurrence of the peaks depends on SF, thus SF can induce variations of LX at a certain chosen epoch; however, these keep within the already large range of LX values typical of these masses, even without SF, being the gas flow very sensitive to many factors (as already found previously, e.g. Ciotti et al. 1991, N14).
For what concerns the global gas mass budget, at the end of the simulations the cold gas mass left in the equatorial disc Mc on average increases with M*, with a larger spread for LM models; at fixed M*, Mc is lower for lower stellar ordered rotation, and for larger ηSF. In addition, the ratio Mc/M* is roughly constant with M*, with a spread reaching down to values much lower than this constant for LM models. In any case, |$M_\mathrm{c}\lesssim 2\times 10^9$| M⊙ for galaxies with M* ≤ 4 × 10¹¹ M⊙. Typical values for Mc are ≲ a few × 107 M⊙ for LM galaxies (with the maximum rotational level of k = 1), with exceptions of Mc ≃ 109 M⊙; and a few × 107 M⊙ (if k = 0.1) to 3 × 10⁹ M⊙ (if k = 1) for ETGs of intermediate mass. These values compare well with those recently observed (Serra et al. 2012, 2014; Young et al. 2014). In particular, they can explain the observation that massive, fast-rotating ETGs often have kinematically aligned gas, independent of environment (Davis et al. 2011, 2013).
The mass in newly formed stars |$M_*^{\rm new}$|, and the ratio |$M_*^{\rm new}/M_*$|, increase with M*, again with a large spread for LM models, and are roughly independent of ηSF. This result means that more massive (rotating) ETGs have been overall more efficient in forming stars via recycling of their stellar mass losses, during the past ≃ 10 Gyr. The mass in secondary generations of stars is (1 − 6) × 109 M⊙ (if k = 1) for LM models, and ≃2 × 10¹⁰ M⊙ (for both k = 1 and 0.1) for intermediate mass models. These should reside mostly in a disc, as most fast rotator ETGs possess, and be related to the birth of a younger, more metal-rich discy stellar component that is indeed observed (Krajnović et al. 2008; Cappellari et al. 2013). They should not be recognized as a ‘young’ stellar population in an absolute sense, though, since most of |$M_*^{\rm new}$| formed a few Gyr ago, as can be evaluated from the evolution of their SFR.
The time evolution of the SFR depends on the mass of the galaxy. LM galaxies (M* = 1.25 × 10¹¹ M⊙) have a larger and peaked SFR in their far past (reaching 1–2 M⊙ yr−1), when the rate of stellar mass losses due to the original stellar population was much larger, and when major cooling episodes were frequent. In fact, the average age of the new stars of LM models ranges from 5 to 8 Gyr (for the aSF scheme). At the present epoch, their SFR is low ( ≲ 0.1 M⊙ yr−1 typically), with the full range of values going from zero to ≃ 0.7 M⊙ yr−1. These results agree nicely with the low degree of SF and young stellar populations that is detected only in fast rotators, in the ATLAS3D sample (Kuntschner et al. 2010; Sarzi et al. 2013); also, they compare well with the current estimated rates, whose median value is ≈0.15 M⊙ yr−1 (Davis et al. 2014). More massive galaxies, instead, show a more regular and steady production of cold gas, and so is their SFR; the average age of their new stars ranges from 5.5 to 7.0 Gyr (in the aSF scheme). At 13 Gyr the SFR is ≃ (0.4–1) M⊙ yr−1, larger than for LM models, and somewhat larger than observed (e.g. McDermid et al. 2015); this could be fixed by assuming a lower ηSF, or a lower ordered stellar rotation, at larger galaxy masses (Fig. 9). Thus, our models may still be rotating too much and producing too much cold gas, at galaxy masses >2 × 10¹¹ M⊙. The current SFR/M*, instead, remains quite constant from LM to intermediate mass models, with a larger spread for LM models (as already found for other properties).
Finally, the SF recipe adopted for this work proved to be a reasonable one, given that it reproduces the slope of the Kennicutt–Schmidt relation, and even the normalization if ηSF ≃ 0.01.
Overall, we can suggest an origin (mostly) in the SF from cooling hot gas, for the presence of cold gas phases kinematically aligned with the stars, and for the low-level degree of SF, all features detected only in fast rotators in the ATLAS3D sample.
In the perspective of the galaxy evolution, we finally recall that the precise knowledge of the amount of gas flowing towards the galactic centre is of great importance for a proper study of feedback effects from the central black hole in rotating galaxies (e.g. Novak, Ostriker & Ciotti 2011; Gan et al. 2014). A major implication of this work is the fact that, if the gas produced by stellar evolution forms new stars, the amount of gas in principle available for fuelling the central supermassive black hole is much lowered. Of course, such fuelling would be impossible in presence of rotation and absence of viscosity. Disc instabilities, though, could break axial symmetry, and allow for the gas infall on to the black hole, possibly escaping SF. Phenomenologically, the effect of gravitational instabilities in the disc can be modelled as an effective gravitational viscosity (e.g. Bertin & Lodato 2001; Hopkins & Quataert 2011; Rafikov 2015), that favours accretion of cold gas towards the centre. Indeed, viscosity (that could be due for example to magnetorotational instability) is another ingredient not present in the current simulations, but that could affect the disc evolution. As the code is axisymmetric, we cannot follow the complex physics of (non-axisymmetric) disc instabilities that could be present. Although self-gravity of the gas is not considered in our simulations, yet for some models at a selection of times we computed the fiducial value of the radial profile of the stability parameter |$Q(R)= c_\mathrm{s} k_R/\pi G\Sigma _\mathrm{c}$|, where kR is the local epicyclic frequency of the galaxy, and cs and Σc are, respectively, the vertically mass-averaged values of the ISM sound velocity, and the surface density of the cold rotating gas. The Q values were computed for a layer Δz ≃ 200 pc thick above and below the galaxy equatorial plane; these Q turned out to be quite independent of the adopted thickness value Δz, being dominated by the cold disc. These fiducial Q values maintained invariably larger than unity (indicating stability) when SF is allowed, while Q < 1 on a central ≃kpc-size region, in absence of SF. From this preliminary and qualitative analysis, it follows that SF andQ-instability are both present in the gaseous rotating discs. The relevant question is then if and what of the two processes is dominant in the disc. In a future work, we plan to extend further the present investigation by implementing in the code the cooperating effects of SF and mass discharge from the disc to the centre. In this new study, we will also consider the neglected late-time mass return from the newly born stellar population, that is the mass injected by stars of mass <8 M⊙; this input could be modelled with the method described in Calura et al. (2014).
We acknowledge Giuseppe Lodato and Jerry Ostriker for useful discussions, and Silvia Posacki for providing the galaxy models of N14. LC and SP were supported by the MIUR grant PRIN 2010-2011, project ‘The Chemical and Dynamical Evolution of the Milky Way and Local Group Galaxies’, prot. 2010LY5N2T.
In fact the phase of the gas flow (that can range from a wind to an inflow) is basically determined by the different relative importance of SN heating in galaxies of different mass, as already thoroughly discussed in Ciotti et al. 1991.
We recall that, in the aSF scheme, the mass injected back into the ISM by the new stars can itself condense and produce new stars, that in turn contribute to the computation of |$M_*^{\rm new}$|.
