


Abstract
In this paper, we discuss the influence of gravitational instabilities in massive protostellar discs on the dynamics of dust grains. Starting from a smoothed particle hydrodynamics simulation, we have computed the evolution of the dust in a quasi-static gas density structure typical of self-gravitating disc. For different grain size distributions, we have investigated the capability of spiral arms to trap particles. We have run 3D radiative transfer simulations in order to construct maps of the expected emission at (sub-)millimetre and near-infrared wavelengths. Finally, we have simulated realistic observations of our disc models at (sub-)millimetre and near-infrared wavelengths as they may appear with the Atacama Large Millimetre/submillimetre Array (ALMA) and the High-Contrast Coronographic Imager for Adaptive Optics (HiCIAO) in order to investigate whether there are observational signatures of the spiral structure. We find that the pressure inhomogeneities induced by gravitational instabilities produce a non-negligible dynamical effect on centimetre-sized particles leading to significant overdensities in spiral arms. We also find that the spiral structure is readily detectable by ALMA over a wide range of (sub-)millimetre wavelengths and by HiCIAO in near-infrared scattered light for non-face-on discs located in the Ophiuchus star-forming region. In addition, we find clear spatial spectral index variations across the disc, revealing that the dust trapping produces a migration of large grains that can be potentially investigated through multiwavelength observations in the (sub-)millimetric. Therefore, the spiral arms observed to date in protoplanetary disc might be interpreted as density waves induced by the development of gravitational instabilities.
1 INTRODUCTION
The physical and chemical evolution of protostellar discs plays a crucial role in the planet formation process. According to the most widely accepted scenario of planet formation, the ‘core accretion’ model, in the high-density environment of a circumstellar disc, micron-sized dust grains are expected to grow via collisional agglomeration to kilometre-sized planetesimals (Testi et al. 2014). In recent years, the investigation on the dust evolution in protostellar discs has been the subject of several theoretical (e.g. Brauer, Dullemond & Henning 2008; Birnstiel, Dullemond & Brauer 2010) and laboratory studies (e.g. Blum et al. 2000; Blum & Wurm 2008) aimed at understanding dust dynamics and its growth. The general picture that emerges from these investigations is that the growth from submicron-sized particles to larger objects is a complex process that contains many physical challenges (Zsom & Dullemond 2008; Okuzumi 2009; Birnstiel, Dullemond & Brauer 2010; Laibe, Gonzales & Maddison 2012).
Since the dust-to-gas mass ratio in protostellar discs is much lower than unity (typical value of ∼10−2), the dynamics of dust particles is heavily affected by the aerodynamic drag force that arises from the velocity difference between dust particles and the surrounding gas. For standard disc geometries, the pressure in the circumstellar disc tends to decrease outwards leading the gas to orbit at sub-Keplerian velocities. On the other hand, since the dust is not affected by the gas pressure, a freely orbiting dust particle feels only centrifugal forces and gravity, and therefore, orbits at Keplerian velocity to a first approximation. As a result, the drag force removes the dust angular momentum leading to an inward drift at a rate that depends on the size of particles (Weidenschilling 1977). The radial velocity induced by gas drag is high enough to produce a rapid depletion of millimetre-sized particles in the outer disc before they can become large enough to decouple from the gas and, thus, preventing the growth of planetesimals required for the formation of the planetary cores. This is what is known as radial drift barrier, and it still represent one of the main unsolved problem of the early phases of planet formation (Weidenschilling 1977; Nakagawa, Sekiya & Hayashi 1986; Klahr & Henning 1997; Brauer et al. 2008).
In addition, the growth of solid particles has to circumvent another hurdle closely linked to the sticking efficiency of colliding dust grains. It is expected that, while low-velocity collisions result in grain growth, high-velocity impacts between particles are destructive (Poppe, Blum & Henning 1999; Blum et al. 2000; Blum 2006). From laboratory and numerical studies, it has been shown that, as particles become larger, they tend to collide at higher impact velocities. Therefore, it is expected that the velocities of millimetre-sized objects in the outer disc are larger than the critical threshold for sticking, so that collisions lead to fragmentation and thus prevent dust particles from forming larger bodies (Brauer et al. 2008). As a result, the growth of dust particles towards metre sizes needs to overcome two obstacles: the rapid depletion of material due to the radial drift and the particle fragmentation produced by destructive collision.
From an observational point of view, evidence that grains in discs are significantly larger than those in the diffuse interstellar medium (ISM) has been obtained from a variety of observational techniques (see the reviews by Natta et al. 2007 and Testi et al. 2014). Multiwavelength (sub-)millimetre observations (e.g. Testi et al. 2001, 2003; Ricci et al. 2010; Guilloteau et al. 2011; Perez et al. 2012) of protostellar discs have shown that grain growth is efficient enough to quickly produce millimetre-sized particles which are retained in the outer disc for a relatively long time. Therefore, how to theoretically explain the retention of millimetre-sized particles in the outer regions of disc remains an open question.
Several ideas of plausible mechanisms aimed at slowing down the rapid inward drift have been proposed, such as vortices, planet–disc interactions, snowlines, zonal flows or dead zones (e.g. Klahr & Henning 1997; Youdin & Shu 2002; Johansen, Youdin & Klahr 2009; Johansen, Klahr & Henning 2011; Pinilla et al. 2012). The common feature of these mechanisms is to create long-lived radial and/or azimuthal inhomogeneities in the gas density structure in order to ‘trap’ particles into the overpressure regions as discussed initially by Haghighipour & Boss (2003a, 2003b). Some observational support for particle trap has been obtained from recent high angular resolution observations at millimetre wavelength using the Atacama Large Millimetre/submillimetre Array (ALMA) that suggested the presence of a particle trap by an anticyclonic vortex that creates dust segregation of small and large particles, as for example the case of IRS 48 (van der Marel et al. 2013).
In this paper, we discuss the influence of the spiral density waves induced by gravitational instabilities (GI) on the dust dynamics. It is believed that in the early stage of star formation (Class 0/Class I objects), the disc could be massive enough to have a non-negligible dynamical effect on the evolution of the overall system. The disc self-gravity may affect the disc dynamics through the propagation of density waves that lead to the formation of a prominent spiral structure (Lodato & Rice 2004, 2005; Durisen et al. 2007; Cossins, Lodato & Clarke 2009; Forgan et al. 2011). In this context, it is expected that the density inhomogeneities induced by the development of GI affect both the dynamics and the growth of the dust grains. Recent work has already suggested that grain growth may be accelerated by concentrating the grains in the peak of the self-gravitating structures, possibly overcoming the issue of the rapid grain migration (Rice et al. 2004, 2006; Gibbons, Rice & Mamatsashvili 2012; Gibbons, Mamatsashvili & Rice 2014). Moreover, the dust retention in spiral arms implies low relative velocities between particles, which suggests that collisions are more likely to be constructive (Gibbons et al. 2012, 2014).
In addition, the dust migration towards spiral arms can produce macroscopic features that can be identified through high angular resolution observations. Spiral and non-axisymmetric structures in protostellar discs have been observed recently in transitional discs by imaging the distribution of scattered light at near-infrared wavelengths (Muto et al. 2012; Garufi et al. 2013; Grady et al. 2013) and by high-resolution ALMA observations of molecular line emission (Fukagawa et al. 2006; Christiaens et al. 2014). For such evolved discs, one generally expects the disc not to be massive enough to be self-gravitating, and thus the more common explanation for the origin of the spiral is the dynamical interaction with an embedded planet. None the less, it is worth remarking that disc mass estimates suffer from systematic errors, mostly due to uncertainties in the dust opacity and the assumption of a constant dust-to-gas ratio. Therefore, it is still debatable if these observed spirals are or not produced by planet–disc interactions (Juhasz et al. 2014). Moreover, Dipierro et al. (2014, see also Cossins, Lodato & Testi 2010) have found that, assuming that the dust is perfectly mixed with the gas, spiral structures of a variety of non-face-on self-gravitating circumstellar discs models with different properties in mass and radial extension are readily detectable by ALMA over a wide range of wavelengths. One of the aims of the present work is to improve the observational predictions of self-gravitating circumstellar discs presented in Cossins et al. (2010) and Dipierro et al. (2014) by including the treatment of dust dynamics (in particular, by relaxing the hypothesis that gas and dust are perfectly mixed) and a more detailed procedure for the generation of emission maps.
In this work, by combining the results of hydrodynamic dust and gas simulations with 3D Monte Carlo radiative transfer calculations (using radmc-3d), we study if the occurrence of local pressure maxima induced by GI can trap dust particles and investigate the detectability of these inhomogeneities at near-infrared and (sub-)millimetre wavelengths.
The paper is organized as follows: in Section 2, we describe the details of the hydrodynamic simulations. In Section 3, we describe the results of the simulations of the dust dynamics and present the observational predictions of our disc models. Finally, in Section 4 we discuss the significance of our results.
2 GAS AND DUST DISC MODELS
The simulations presented here calculate the evolution of the dust surface density in a quasi-static gaseous self-gravitating disc. The system comprises two components discs: a gas disc, characterized by a spiral surface density structure induced by GI, and a dusty disc that evolves under the action of drag forces and turbulent mixing induced by the gas–dust aerodynamical coupling. The self-gravitating gas disc model has been taken from a snapshot of a three-dimensional smoothed particle hydrodynamics (SPH) simulation performed by Lodato & Rice (2004). This model can be considered as representative of a self-gravitating gas disc in a quasi-steady state characterized by a spiral surface density structure produced by a combined effect of self-gravity and cooling. We compute the dust surface density evolution in such fixed gaseous background in the radial direction along different azimuthal cuts across the disc. Afterwards, starting from the resulting surface density structure we create 3D models using a representative estimator for the tickness of the dusty disc. We carry out 3D radiative transfer simulations in order to create the expected emission maps at (sub-)millimetre and near-infrared wavelengths of our models which are used to simulate realistic observations.
2.1 Gas disc model
All simulations described above are essentially scale-free. In order to consider a gas disc model with realistic properties in mass and radial extension, we modify the length and the mass scale of the data output of the SPH simulations such that the radial extent of the disc is 150 au with a disc mass equal to 0.25 M⊙. As shown in Lodato & Rice (2004), the initial phase of disc evolution is governed by a rapid cooling until the GI becomes effective, providing a source of effective heating through both compression and shocks. In approximately one thermal time, the disc settles into a quasi-steady state developing spiral density waves that propagate across the disc. Once the thermal equilibrium state is reached, the gas disc is characterized by a spiral structure (shown in Fig. 1) where the heating generated through GI balances the external cooling. This structure remains quasi-steady, evolving secularly on the viscous time-scale (105–106 yr in this case). Individual spiral arms are recurrent structures evolving on the dynamical time-scale (∼103 yr in the outer disc).

Gas surface density structure of a 0.25 M⊙ disc around a 1 M⊙ star that has reached a long-lived, self-gravitating state .
Fig. 2 shows the volume density, temperature and pressure gradient along a slice across the disc. It can be noticed that all the gradients are characterized by a similar trend and are null at the same radial positions. Therefore, the overdensity regions, which correspond to the arm regions, are characterized by relatively higher temperatures while in the interarm region the temperature is lower (see also fig. 3 of Dipierro et al. 2014). This is due to the increase in the pressure caused by a shock driving a compression of gas and, as a consequence, a growth of the temperature. In the interarm regions, the increase in the pressure provides an expansion of gas parallel to the shock and, as a consequence, a decrease of the temperature (Cossins et al. 2009). Moreover, since the pressure depends on the volume density and the sound speed, the peaks of the pressure gradient are higher than those related to the temperature and volume density profile.
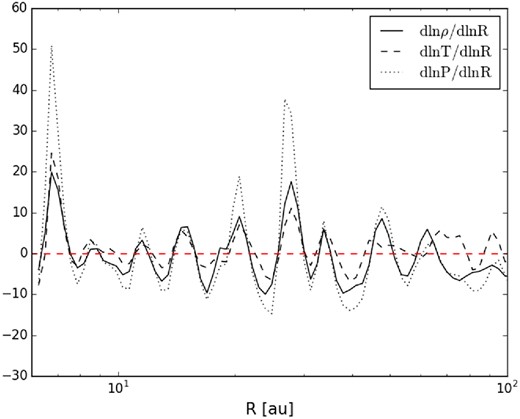
Gas volume density, temperature and pressure gradient along a slice across the disc.
2.2 Dust evolution model
Generally, it is expected that a gravitationally unstable disc cannot be treated as a viscous disc because gravity can affect the transport mechanism over long distances. In this context, a number of numerical simulations have been recently carried out with the aim to test the locality of transport provided by GI. Lodato & Rice (2004), Cossins et al. (2009) and Forgan et al. (2011), using an α-like approach, have compared the dissipation power provided by GI with the expectations based on a viscous theory of disc. They have found that for disc-to-star mass ratio Mdisc/M⋆ ≲ 0.25, the GI is well described using a viscous approach.
In this work, the dust evolution for each grain size in our sample is computed using the numerical method adopted in Birnstiel, Dullemond & Brauer (2010). All the simulations performed here are evolved for one outer orbital period: 103 yr. Such time-scale is long enough to ensure that the drag forces and turbulent diffusion affect the dust density structure but short enough that we do not expect a significant evolution of the spiral structure. We cut the disc into 720 radial directions. For each cut, we compute the gas pressure needed in equation (3). We then solve, for each cut, equation (5) using 100 radial cells, so as to obtain the 2D surface density of the dust.
2.3 Initial conditions
Moreover, the dust size distribution is characterized by the value of the power-law exponent q that depends on the dust dynamics and the processes of grain coagulation and fragmentation that occur in the disc. While the typical value in the ISM is qism = 3.5 (Mathis, Rumpl & Nordsiecj 1977), in a protoplanetary disc if coagulation (fragmentation) processes dominate over fragmentation (coagulation), a lower (higher) value for q than the ISM one is expected.
In order to cover a wide range for the initial dust size distributions, we perform simulations using different values for the fragmentation threshold velocity and the power-law exponent. We consider two values for the fragmentation threshold velocity: vfrag = [10, 30] m s− 1 and three values for the power-law exponent: q = [3.0, 3.5, 4.0].
2.4 Monte Carlo radiative transfer simulation
We calculate the expected emission maps of the self-gravitating disc model adopted here using the 3D radiative transfer code radmc-3d1. We focus on images at H band (1.65 μm) and ALMA band 6 (220 GHz), band 7 (345 GHz), band 8 (460 GHz) and band 9 (680 GHz). Our aim is to compute High-Contrast Coronographic Imager for Adaptive Optics (HiCIAO) scattered light images in H-band polarized intensity and ALMA (sub-)millimetre images in order to study the detectability of the peculiar spiral structure induced by GI both in scattering and thermal dust emission.
It is known that the scattering intensity is closely linked to the behaviour of the scattering phase function of dust grains. While small grains scatter photons uniformly, the scattering phase function of large grains is dominated by forward scattering. Therefore, since large grains scatter stellar photons mostly into the disc, tracing larger grains by analysing scattering images of non-edge-on discs results challenging (Mulders et al. 2013). Thus, polarized scattering images at short wavelengths trace small (0.1–10 μm) dust grains at the surface of the disc (where stellar photons get absorbed or scattered). At (sub-)millimetre wavelengths, since the disc is generally optically thin in the vertical direction, the emission probes the mid-plane disc surface density in large grains (0.1–10 mm), due to their high opacity at these wavelengths (Dullemond et al. 2007; Williams & Cieza 2011).
Starting from the dust temperature structure of the model, the expected emission maps are computed via ray tracing assuming that the disc is non-face-on (inclination angle of 30°). The polarized intensity image (PI = |$\mathrm{\sqrt{Q^2+U^2}}$|) is calculated starting from the full Stokes vector (I,Q,U,V) computed by radmc-3d. The full-resolution (sub-)millimetre images directly produced by radmc-3d are used as input sky models to simulate realistic ALMA observations using the Common Astronomy Software Application (casa) ALMA simulator. The HiCIAO images are computed by convolving the full-resolution images in H band with a measured HiCIAO point spread function (PSF) taken from the acorns-adi seeds Data Reduction Pipeline software (Brandt et al. 2013).
3 RESULTS
In this section, we present results of the dust simulations and the observational predictions of the resulting disc models. We will focus on the level of the arm–interarm contrast induced by gas–dust coupling for small and large grains and how the dust evolution and observational signatures change with different initial grain size distributions.
3.1 Dust density structure
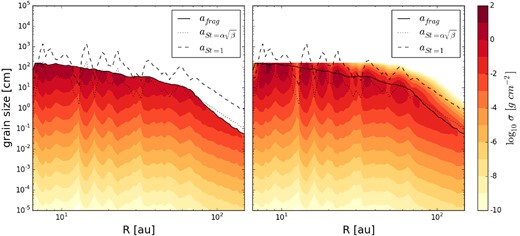
Dust density distribution at the beginning (left) and at the end (right) of simulation (t = 103 yr) along a slice across the disc. The simulation starts from an initial size distribution with exponent q = 3.5 and a fragmentation velocity equal to 30 m s− 1. The dashed line represents the particle size corresponding to a Stokes number of unity while the dotted line show the particle size where |${\rm St} = \alpha \sqrt{\beta _{\rm {cool}}}$|. The solid line shows the fragmentation barrier, i.e. the maximum value of the initial grain size distribution (see equation 7).
In Fig. 4, we show the final surface density rendered images of the dust for all whole disc. In order to show the differential distribution from different ranges of dust grain size, the upper panels show the surface density integrated in size in the range [1 μm, 100 μm] (left) and [1 cm, 100 cm] (right). As expected, the dust density distribution for particles with Stokes number close to unity (see the upper-right panel of Fig. 4) shows the highest concentration in spiral arms. In this case, the spiral arms are very thin and display a strong contrast between arm and interarm regions, while the structure shown by smaller particles is broader and essentially follows the gas structure (see Fig. 1). Note that beyond ∼50 au the density of large particles drops because we have crossed the fragmentation threshold. The lower panels of Fig. 4 show the total dust density distribution (left) and the dust-to-gas ratio (right). It can be noticed that the dust transport process in a self-gravitating accretion discs quickly modify the radial and azimuthal distribution of the dust-to-gas ratio. Starting from an initial uniform dust-to-gas ratio (10−2), dust particles migrate quickly towards pressure maxima leading to a creation of a spiral structure in the dust-to-gas ratio. The local density of particles in interarm regions reaches levels a factor of ∼10−2 times that of the initial dust density. It is worth noting that the evolution of the dust-to-gas ratio shows a remarkable depletion of dust grains from the interarm regions since larger particles are more subject to radial drift due to the lower gas density in interarm regions that produce a better coupling between dust and gas (see equation 2).
![The upper panels show the surface density at the end of simulation (t = 103 yr) integrated in size in the range [1 μm, 100 μm] (left) and [1 cm, 100 cm] (right). The lower panels show the total dust density distribution (left) and the dust-to-gas ratio (right) at the end of simulation.](https://oup.silverchair-cdn.com/oup/backfile/Content_public/Journal/mnras/451/1/10.1093/mnras/stv970/2/m_stv970fig4.jpeg?Expires=1750457114&Signature=OcA~O2U0ihxCNcuMSubUordS7RZEBg3R6Lzm9UlEQxloUKtgZi5r5k18dUIjSQ9W2bXHDrFYAVhG3TgE4SGr0OSC9jAsV~gPZoOiFOxlXaIXu4y83o8aoBcq-8l1FSa-4xR2t8YyU9jNeAv8gxCjrr98Q7RyBYfHEsCCZ5DAOc3T2p~UM40etbM8oJ~s6lFK5gg~Q2Ny1G~sNpkmI00oowuaoMNFUMOS0ijsfigApGMJjXkyevvrTD-k3G6QMCIUT0DK18ll7x~TrWSiRi3MVsASYW2qic03JZMbMpfe7jDF-b47ZP~sN3A0~QxHeozl4LtyhLFKGJCGxeiEKrOzXw__&Key-Pair-Id=APKAIE5G5CRDK6RD3PGA)
The upper panels show the surface density at the end of simulation (t = 103 yr) integrated in size in the range [1 μm, 100 μm] (left) and [1 cm, 100 cm] (right). The lower panels show the total dust density distribution (left) and the dust-to-gas ratio (right) at the end of simulation.
3.1.1 Influence of fragmentation velocity
In order to cover a wide range of initial dust density distribution, we run the same simulations, but we now change the value of the fragmentation threshold velocity. As mentioned above, dust aggregates are able to grow by collisions with velocities up to a value that depends on the material properties (Blum & Wurm 2008; Wada et al. 2009).
In Fig. 5, we show the initial (left) and the final (right) dust density distribution along a slice across the disc using a fragmentation velocity equal to 10 m s− 1 and an initial size distribution with exponent q = 3.5. If the velocity at which particles fragment decreases from 30 to 10 m s− 1, grains are not expected to grow to large sizes so that the condition St ∼ 1 is not expected to be met anywhere in the disc. In this case, the efficiency of the dust trapping is reduced since most of the particles are characterized by a Stokes number less than unity. As a result, variations in the dust-to-gas ratio are being smeared out by the turbulent diffusion and the radial drift has only a minor effect in the dust dynamics.
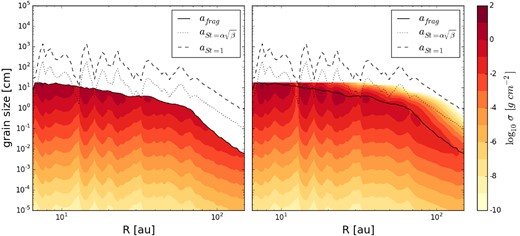
Dust density distribution at the beginning (left) and at the end (right) of simulation (t = 103 yr) along a slice across the disc. The simulation starts from an initial size distribution with exponent q = 3.5 and a fragmentation velocity equal to 10 m s− 1. The dashed line represents the particle size corresponding to a Stokes number of unity while the dotted line show the particle size where |${\rm St} = \alpha \sqrt{\beta _{\rm {cool}}}$|. The solid line shows the fragmentation barrier, i.e. the maximum value of the initial grain size distribution (see equation 7).
3.1.2 Influence of the initial power-law grain size distribution
As mentioned above, the grain coagulation and fragmentation processes can affect the size distribution quite significantly. If the fragmentation process dominates over coagulation, a constant replenishment of smaller grains occurs in the disc producing a steeper size distribution, approaching n(a) ∝ a−4. In this case, most of the mass will be concentrated in small grains which are less affected by the radial drift towards pressure maxima. By contrast, if the grain coagulation dominates over fragmentation, the resulting grain size distribution is expected to be flatter (e.g. n(a) ∝ a−3). In this case, the grain coagulation process would produce large grains which migrate quickly towards pressure maxima. Fig. 6 shows the radial dependence of the final dust-to-gas mass ratio along a slice across the disc for two values of the power-law exponent of the grain size distribution and using a value of the fragmentation velocity equal to 30 m s− 1. For q = 3, the radial distribution of dust is strongly affected by the migration towards pressure maxima induced by gas drag since most of the dust mass is in large grains. As expected, a steeper size distribution reduce the concentration but only marginally, so that the dust-to-gas ratio in the interarm regions is slightly enhanced with respect to the previous case.
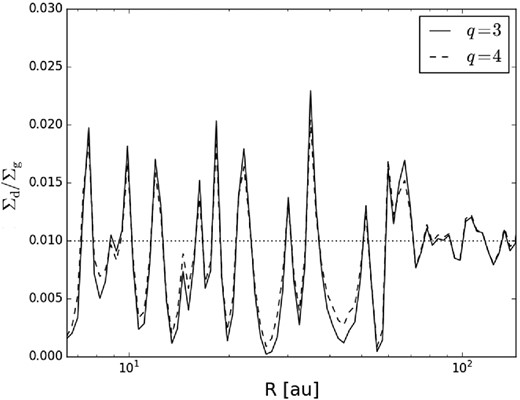
Dust-to-gas mass ratio at the end of the simulation (t = 103 yr) along a slice across the disc for two values of the power-law exponent of the grain size distribution: q = 3, 4. The dotted line shows the initial dust-to-gas ratio.
3.2 Observational predictions
In this section, we present results from simulated ALMA and HiCIAO observations of the sky models computed via radmc-3d simulations starting from the disc models obtained from hydro simulations. We translate hydro simulations into model observations using the method explained in Section 2.4. Once having computed the expected full-resolution emission maps, we simulate realistic ALMA and HiCIAO images at (sub-)millimetre and near-infrared wavelengths. The synthetic images are analysed in terms of the ability to spatially resolve the spiral features of our models with the aim to test the detectability of gravitationally induced spiral density waves.
3.2.1 ALMA simulated observations
The resulting emission maps at (sub-)millimetre wavelength are used as input sky models for the ALMA simulator (version 4.1) in order to produce realistic ALMA observations of self-gravitating disc models. The selection of observing parameters is chosen to ensure enough spatial resolution and sensitivity to resolve and detect spiral arms in the intermediate and external region of the discs. Assuming a perfect calibration of the visibility measurements, the computation of ALMA simulated observations include the effects of thermal noise from the receivers and atmosphere. The signal atmospheric corruption effects into the visibilities measurements are evaluated taking into account the atmospheric transparency computed using the Atmospheric Transmission at Microwaves (atm) code (Pardo, Cernicharo & Serabyn 2001) starting from average site conditions and input values for the ground temperature and the precipitable water vapour (PWV) provided by the user. All the sources are located in the Ophiuchus star-forming region (∼140 pc) and are observed with a transit duration of 1 h.
First, we focus on a representative disc model obtained from a given set of model parameters. In Fig. 7, we show ALMA simulated observations at different observing wavelengths of the disc models obtained starting from an initial dust grain size distribution with exponent q = 3.5 and a fragmentation velocity equal to 30 m s− 1. The observation parameters adopted in the images presented here and the measured total fluxes are summarized in Table 1. It can be noticed that the spiral structure is readily detectable by ALMA over a wide range of wavelengths. Note that relative intensity between the spiral arms and the external region decreases with increasing frequency. This variation is linked to the optical regime of the spiral arms at different frequencies. It can be shown that, while the interarm regions are optically thin, the arm regions became optically thick for frequencies ≳ 345 GHz. Thus, for ν ≳ 345 GHz, the radiation coming from the central protostar is more likely to be captured by the arm regions, producing a fainter emission from the outer regions.
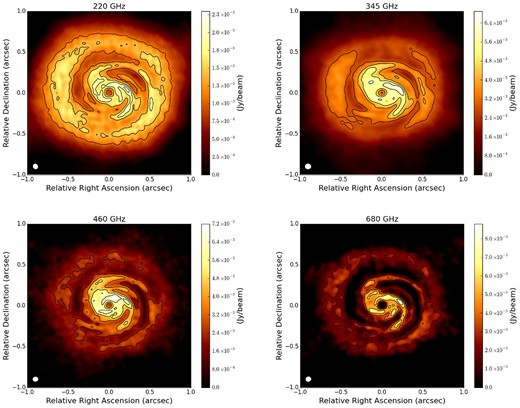
ALMA simulated images of the self-gravitating disc model obtained starting from an initial dust grain size distribution with exponent q = 3.5 and a fragmentation velocity equal to 30 m s− 1. Observing frequencies are reported at the top of each image. Contours are 4, 6, 8, 10 × the corresponding rms noise. The white colour in the filled ellipse in the lower-left corner indicates the size of the half-power contour of the synthesized beam (see Table 1 for details).
Atmospheric conditions, beam size, total flux and rms for the simulated observations shown in Fig. 7.
| Frequency | PWV | Beam size | Total flux | rms |
|---|---|---|---|---|
| (GHz) | (mm) | (arcsec × arcsec) | (Jy) | (mJy beam−1) |
| 220 | 2.75 | 0.063 × 0.055 | 0.71 | 0.18 |
| 345 | 1.26 | 0.070 × 0.063 | 0.93 | 0.49 |
| 460 | 1.26 | 0.062 × 0.054 | 1.12 | 0.84 |
| 680 | 0.47 | 0.062 × 0.057 | 1.31 | 1.15 |
In addition, as already noted by Dipierro et al. (2014), while the original density structure of the disc is characterized by a relatively large number of arms (see Fig. 1), the ALMA image shows a spiral pattern with two spiral arms since the smaller sized arms have been smeared out by the limited resolution of the observations.
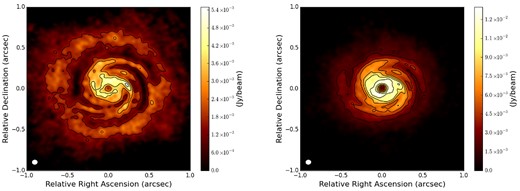
Comparison of ALMA simulated images at 460 GHz of disc models obtained from simulations with an initial dust grain size distribution with power-law exponent q = 3 (left) and q = 4 (right) and a fragmentation velocity equal to 30 m s− 1. Contours are 4, 6, 8, 10 × the corresponding rms noise: 0.78 mJy beam−1 (left) and 0.72 mJy beam−1 (right). The white colour in the filled ellipse in the lower-left corner indicates the size of the half-power contour of the synthesized beam: 0.062 arcsec × 0.054 arcsec.
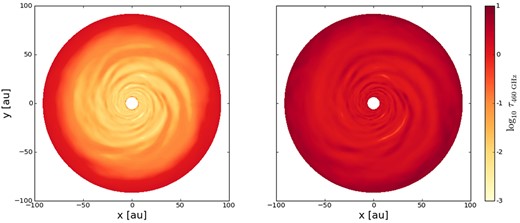
Comparison of optical depth maps at 460 GHz of disc models obtained from simulations with an initial dust grain size distribution with power-law exponent q = 3 (left) and q = 4 (right).
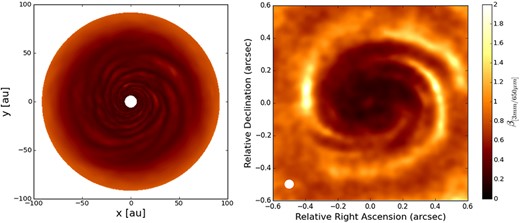
The β parameter computed from (left) the model data and from (right) two simulated ALMA observations at 650 μm and 3 mm of the disc model obtained starting from an initial dust grain size distribution with exponent q = 3 and a fragmentation velocity equal to 30 m s− 1. The white colour in the filled ellipse in the lower-left corner of the right-hand panel indicates the size of the half-power contour of the synthesized beam: 0.054 arcsec × 0.052 arcsec.
3.2.2 Polarized H-band scattered light images
In this subsection, we show synthetic HiCIAO H-band polarized intensity image of the disc model obtained starting from an initial dust grain size distribution with exponent q = 3.5 and a fragmentation velocity equal to 30 m s− 1. As previously mentioned, the polarized intensity images essentially trace the gas disc structure since small dust grains are less subject to the radial drift. The calculated scattered light image convolved with the measured HiCIAO PSF is shown in Fig. 11. The H-band image reveals an asymmetry in brightness between the far (top) and near (low) disc regions. This is due to forward scattering of starlight by large dust particles in a non-face-on disc (inclination of 30°). In addition, the outer ring-like structure is very bright since the density of smaller particles increases with radius due to the lower value of the fragmentation threshold size in outer disc regions (see Fig. 3). Moreover, the significative brightness of the outer ring is also caused by the fact that scattered light is mostly determined by the curvature of the disc surface that, due to the flaring of the disc, is very enhanced in the outer regions. However, due to the higher brightness of the inner regions and the instrument resolution, the spiral structure is not readily detected. The spiral arms and cavities clearly detected in (sub-)millimetre ALMA images (see Fig. 7) are smeared out and are thus marginally visible in the HiCIAO H-band image. It is worth remarking that the shape of the HiCIAO PSF is characterized by large sidelobes which produce a decrease of the dynamic range in the convolved images and, consequently, a decrease of the detected contrast between arm and interarm regions.
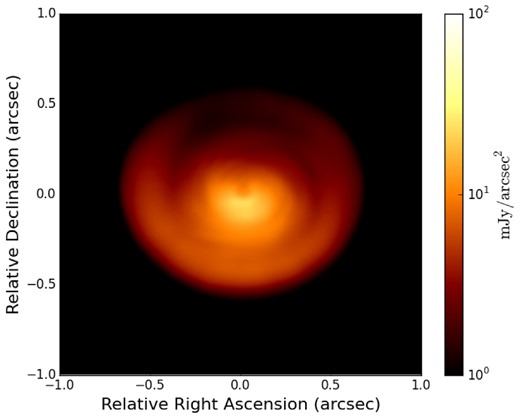
Synthetic HiCIAO H-band polarized intensity image of the non-face-on disc model (inclination of 30°) obtained starting from an initial dust grain size distribution with exponent q = 3.5 and a fragmentation velocity equal to 30 m s− 1.
We also consider a new set of simulations with a gas disc model two times bigger. In Fig. 12, we present the synthetic HiCIAO H-band polarized intensity image of this specific disc model with two different inclinations: 10° (left) and 30° (right). A remarkable improvement of the detection of spiral arms can be noticed with comparison to the model previously considered (see Fig. 11), due to the fact that the HiCIAO PSF is small enough to preserve spiral features in scattering images. As expected, the asymmetry in brightness between the far (top) and near (low) disc regions due to the forward scattering of starlight by large dust particles becomes more prominent with increasing angle of inclination. In addition, since the separation between arm and interarm regions decreases with increasing angle of inclination, the detected spiral structure results sharper for face-on discs. Moreover, the contrast between arm and interarm region appears lower in scattering emission than in thermal emission. This is caused mostly by the smaller contrast in dust density of smaller particles with respect to larger particles between arm and interarm regions. All these effects makes it more challenging to observe the spiral structures in inclined disc through scattering intensity observations.
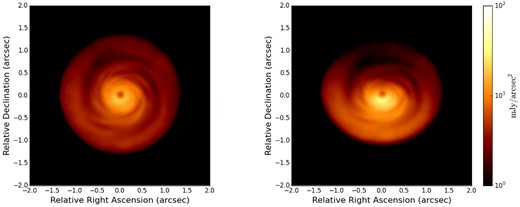
Synthetic HiCIAO H-band polarized intensity image of a disc model two times bigger than the model of Fig. 11 (i.e. Rout = 300 au) with two different inclinations: 10° (left) and 30° (right).
4 SUMMARY AND CONCLUSIONS
In this paper, by combining hydrodynamical and dust evolution models, we investigate the influence of GIs on the dynamics of dust grains. Using representative grains size distributions, we model the dust grains dynamics under the action of systematic and random motion induced by the gas–dust aerodynamical coupling. Once having computed the resulting 2D dust density distribution, we perform 3D Monte Carlo radiative transfer simulation in order to make predictions of self-gravitating discs for future observations.
The spiral density waves induced by GI produce a remarkable effect on the dust dynamics leading to the formation of significant dust overdensities in the spiral arms regions. The dynamical effect produced by the occurrence of pressure bumps in discs closely depends on the size of the particles. We found that, assuming that particles are able to grow through collisions with velocities up to 10 and 30 m s− 1, the dust density structure of centimetre-sized particles is affected by the presence of the spiral overdensities. While smaller particles closely trace the overall gaseous spiral structure, larger particles experience the highest concentration in density maxima. The influence of the dust trapping mechanism has been tested by computing the dust-to-gas ratio. Since most of the mass is concentrated in the largest grains, the dust transport process modifies the radial and azimuthal distribution of the dust-to-gas ratio leading to a creation of a spiral structure.
The observational predictions of the resulting models show that the resolution capabilities and sensitivity of ALMA are sufficient to spatially resolve the peculiar spiral structure of gravitationally unstable discs with an acceptable signal-to-noise ratio for non-face-on discs located in the Ophiuchus (∼ 140 pc) star-forming region. Through multiwavelength (sub-)millimetre observations, we have investigated whether the density enhancement of the larger dust grains into spiral arm regions produces signatures in the spectral index map that can be detected using ALMA. We find that the migration of larger grains into spiral arms region produces clear variations in the spectral index that can be interpreted in terms of different level of grain growth between arm and interarm regions.
In addition, our simulations show that the development of GI can create strong enough surface density perturbation that could be detected in near-infrared scattered light with HiCIAO. Therefore, the spiral arms observed to date in protoplanetary disc in polarized scattered light (Muto et al. 2012; Garufi et al. 2013; Grady et al. 2013) might be the result of spiral density perturbations induced by the development of GIs. There are several scenarios that have been proposed to explain the occurrence of spirals in protoplanetary discs (Boccaletti et al. 2013). The more widely accepted one is based on tidal interaction of stellar encounter or embedded protoplanets. However, Juhasz et al. (2014) have shown that planets by themselves cannot induce density perturbation that can be observed in near-infrared scattered light with current telescope for sources at the distance comparable to Ophiuchus star-forming region (∼140 pc). Therefore, the development of GI can be considered a valid theoretical explanation of the spiral structure observed to date in protostellar disc. Moreover, in contrast to the spiral density perturbations due to planet–disc interaction ( Dong, Zhu & Whitney 2014; Juhasz et al. 2014), the gravitationally induced density waves have a remarkable effect on the dust dynamics and produce clear observational signatures at (sub-)millimetre wavelengths.
The simulations presented here contain a number of simplifications that need to be addressed. First, since the lifetime of the individual spiral features in self-gravitating discs is of the order of Ω−1, the approximation of a stationary gas density structure for as long as one outer orbital period appears to be simplistic (Clarke & Lodato 2009). Moreover, in this work we neglect the grain growth and fragmentation processing that occur in the disc. This can be considered an acceptable approximation since the time-scale of our simulations is shorter than the typical grain growth time-scale (Brauer et al. 2008; Okuzumi et al. 2011) in the intermediate and outer part of the disc. In addition, it is expected that the occurrence of long-lived non-axisymmetric structures in the disc affects the azimuthal dynamics of dust grains leading to an additional systematic drift motion of the dust particles towards the pressure maximum (Nakagawa et al. 1986; Birnstiel, Dullemond & Pinilla 2013). Assuming azimuthal and radial trapping simultaneously would lead to stronger concentrations of dust in pressure traps.
The influence of time-dependent density perturbations induced by GI and the drift caused by azimuthal pressure gradients will be the topic of future works.
The authors are grateful to C. P. Dullemond for making radmc-3d available. We thank the referee for useful suggestions. We also thank Attila Juhasz for support in solving some problems with radmc-3d. GD acknowledges Leiden Observatory for hosting and providing CPU time in the Sterrewacht workstations. GD and GL acknowledge financial support from PRIN MIUR 2010-2011, project ‘The Chemical and dynamical evolution of the Milky Way and Local Group Galaxies’, prot. 2010LY5N2T. PP is supported by Koninklijke Nederlandse Akademie van Wetenschappen (KNAW) professor prize to Ewine van Dishoeck. This work was partly supported by the Italian Ministero dell'Istruzione, Università e Ricerca through the grant Progetti Premiali 2012 – iALMA (CUP C52I13000140001).
