


Abstract
Irradiation of samples of pure solid methane at 3 K with far-ultraviolet light from a synchrotron yielded products CH3, C2H2, C2H4 and C2H6 that were quantitatively identified through their infrared absorption spectra. The greatest wavelengths at which products CH3, C2H4, C2H6 and C2H2 were generated were 140, 140, 175 and 190 nm, respectively. Cassini spacecraft has observed the condensed methane on Titan. The observation demonstrates the existence of pure condensed methane in astro-environments. Information about the dissociation of CH4 at a low temperature with photons of varied energy has implications for astrophysical environments.
1 INTRODUCTION
The hydrocarbon most abundant in space is methane, followed by C2H6, C2H2 and C2H4, which are believed to be produced from methane induced by photons, electrons and other energetic particles (Yung & DeMore 1999). Methane is the simplest non-radical hydrocarbon in space, has been proposed as a precursor in the synthesis of complicated organic molecules and is believed to play a key role in the formation of prebiotic molecules (Markwick et al. 2000). The photochemistry of methane in the gaseous phase has been thus extensively investigated (Wang & Liu 1998; Cook et al. 2001; Romanzin et al. 2005; Gans et al. 2011). In cold outer space, methane exists in condensed phases; for example, at the temperatures of Pluto, Triton and other trans-Neptunian objects that are typically less than 40 K, methane occurs there in a solid form (Quirico et al. 1999; Olkin et al. 2007; Tegler et al. 2010). At the Infrared Space Observatory, infrared spectra of solid methane were recorded from ∼30 protostars (White et al. 2000; Gürtler et al. 2002; Alexander et al. 2003), the galactic centre (Chiar et al. 2000) and an external galactic nucleus (Spoon et al. 2001). The chemistry of methane in a condensed phase might differ appreciably from that of gaseous methane; varied sources of radiation to destroy CH4 molecules might produce varied daughter species in space. Because far-ultraviolet radiation is one driving force to dissociate methane in astronomical environments, the photochemistry of methane in condensed phases warrants attention.
The photon flux of solar radiation from 400 to 700 nm is 103–106 times that from 200 to 100 nm (Rottman 1981; Mount & Rottman 1983); the latter range includes mostly emission lines, such as H Lyman-α at 121.6 nm, superimposed on a continuum rapidly decreasing with decreasing wavelength. The energy of photons at 121.6 nm, much greater than that for visible light, is enough to break almost any chemical bond in any molecule. Light of wavelength less than 200 nm is hence likely to be an important driving force to generate chemical compounds in not only our Solar system but also other spatial environments. The interaction of galactic cosmic rays with interstellar molecules generates secondary fields of vacuum-ultraviolet (VUV) radiation, the so-called cosmic-ray-induced photons (Cecchi-Pestellini & Aiello 1992); this radiation can subsequently induce the photolysis of molecules in interstellar clouds or those in other astrophysical environments.
Kaiser & Roessler (1998) irradiated solid methane with 9.0 MeV α-particles and with 7.3 MeV protons; the major products were C2H2, C2H4 and C2H6. Baratta et al. (2003) exposed pure solid methane ice to argon ions of energy 60 keV, and identified species C2H2, C2H4, C2H6 and C3H8 from infrared absorption spectra. Bennett et al. (2006) bombarded solid methane with energetic electrons and focused on the identification of species CHx (x = 1–4) and C2Hx (x = 2–6). de Barros et al. (2011) bombarded a layer of methane ice with oxygen ions of energy 220 MeV, and detected species including CH3, C2H2, C2H4, C2H6 and C3H8 according to their infrared spectra. Using a lamp based on a microwave discharge of flowing hydrogen, Gerakines, Schutte and Ehrenfreund (1996) conducted experiments with UV photolysis of pure solid CH4 at 10 K; they observed products CH3, C2H4, C2H6, C3H4, C3H8 and other unidentified species.
Photons in far-ultraviolet light and energetic particles incident on molecular solids analogously induce varied effects in astrophysical environments. The photolysis of CH4 with far-ultraviolet light undoubtedly serves as an initial process in the evolution of hydrocarbons in space. Our present investigation concerned the products of photolysis of solid methane at 3 K using far-ultraviolet light from a synchrotron. The photochemistry of methane in this solid phase differs from that of gaseous methane, which has implications for astrophysical environments.
2 EXPERIMENTS
The apparatus for photolysis of solid samples is similar to that described previously (Wu et al. 2008, 2010, 2012; Lin et al. 2014). Gaseous methane was deposited on a KBr window before photolysis with radiation at a selected wavelength; a closed-cycle refrigerator system (Janis RDK-415) cooled the KBr substrate to 3 K. A turbomolecular pump backed by a scroll pump evacuated the chamber to a pressure less than 4 μPa. The source of far-UV radiation was an undulator with periodically spaced permanent magnets (90 mm, U90) attached to the storage ring of an electron accelerator (energy 1.5 GeV) at National Synchrotron Radiation Research Center (NSRRC) in Taiwan. Harmonics from the undulator were suppressed through absorption by Ar at pressure 1.33 kPa and a filter – crystalline LiF for 121.6 nm, CaF2 for 130, 140 and 155 nm, silica (Suprasil) for 165 and 175 nm, and quartz for 185, 190 and 200 nm.
At the selected wavelength, the samples of solid methane were photolyzed for periods 10 s, 30 s, 1 min, 5 min, 10 min, 30 min and another 30 min sequentially; the total duration of irradiation was 76 min and 40 s. The photon doses of each irradiation period were measured with a gold mesh (95 per cent transmission). IR absorption spectra were recorded at various stages of experiments with an interferometric infrared spectrometer (Bomem, DA8) equipped with a KBr beamsplitter and a HgCdTe detector (cooled to 77 K) to cover the spectral range 500–4000 cm−1; 400–600 scans at resolution 0.2–0.5 cm−1 were made at each stage of the experiment.
CH4 (99.999 per cent, Matheson Gases), CD4 (isotopic purity 99 per cent, Cambridge Isotopic Laboratory), 13CH4 (isotopic purity 99.9 per cent, Cambridge Isotopic Laboratory), C2H2 (99.0 per cent, Matheson Gases), C2H4 (99.99 per cent, Matheson Gases) and C2H6 (99.995 per cent, Matheson Gases) were used without further purification.
3 RESULTS AND DISCUSSION
3.1 Infrared absorption of solid isotopic methanes
Fig. 1 presents infrared absorption spectra of isotopic solid methanes at 3 K. For comparison, the spectrum of a gaseous sample of 12CH4 shows vibrational–rotational bands with centres near 1306.4 cm−1, assigned to fundamental angular deformational mode ν4, and near 3018.9 cm−1, associated with stretching mode ν3. Fig. 1(a) shows that the corresponding feature for ν3 of pure solid 12CH4 is amalgamated into one prominent line with maximum absorption at 3008.9 cm−1 and width 5.9 cm−1, and a shoulder about 3021.2 cm−1; the feature for ν4 of pure solid 12CH4 that possesses a total width about 8.2 cm−1 exhibits a partially resolved doublet at 1301.5 and 1296.8 cm−1 with a shoulder at 1294.5 cm−1, as shown in the inset. For pure solid 13CH4 at 3 K, the feature in Fig. 1(b) for ν3 shifts to 2998.8 cm−1 with a shoulder about 3010.8 cm−1, whereas the ν4 mode comprises a doublet at 1293.0 and 1288.9 cm−1 with a shoulder at 1286.3 cm−1. For pure solid 12CD4 at 3 K, the absorption in Fig. 1(c) associated with mode ν3 comprises a single line at 2252.0 cm−1; the ν4 mode shows a multiplex with maximum intensity at 990.6 cm−1.
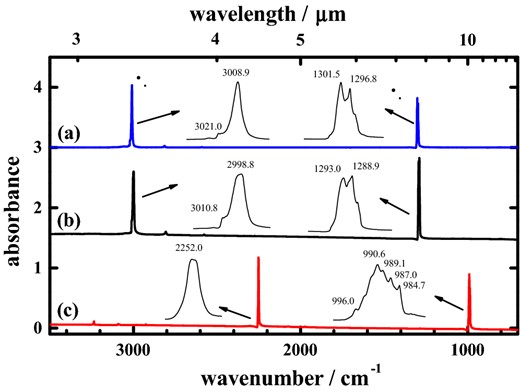
Absorption spectra of pure (a) 12CH4 (ordinate scale offset +3.0), (b) 13CH4 (ordinate scale offset +1.5), (c) and 12CD4, all at 3 K; resolution 0.5 cm−1 from 600 co-added interferograms.
Features in IR absorption spectra of methane vary with the physical conditions of the sample. For example, the lines associated with mode ν4 of 12CH4 dispersed in solid neon with molar ratio 1000 at 3 K (Ogilvie et al. 2011) are fitted with 38 components, some having widths as small as 0.05 cm−1, in the range 1311–1305 cm−1; whereas the corresponding lines of 12CH4 in pure solid methane show a partially resolved doublet with a total width about 8.2 cm−1. As methane molecules dispersed in neon at molar ratio 1:1000 are effectively separated from one another, the absorption spectra of pure solid methane show the effects of interacting molecules.
3.2 Spectra of C2H2/CH4 = 1/250, C2H4/CH4 = 1/250 and C2H6/CH4 = 1/250
According to previous work on irradiated solid methane, the major products generated are stable products C2H2, C2H4 and C2H6 (Gerakines et al. 1996; Kaiser & Roessler 1998; Baratta et al. 2003; Bennett et al. 2006; de Barros et al. 2011). The wavenumbers of these species in solid methane might shift slightly from the corresponding wavenumbers of lines of the same molecules in a pure solid state or in the gaseous phase, which would perturb their identification in solid methane. To verify these shifts, we recorded separately the infrared spectra of solid 12CH4 samples at 3 K containing 12C2H2 or 12C2H4 or 12C2H6 in trace proportion, 1/250, displayed in Fig. 2; the characteristic lines recorded and their assignments are listed in Table 1.
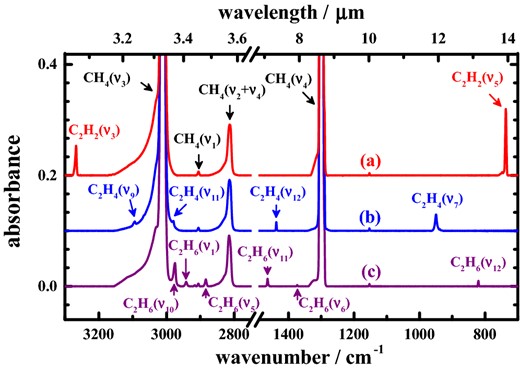
Absorption spectra of (a) 12C2H2/12CH4 = 1/250 (ordinate scale offset +0.2), (b) 12C2H4/12CH4 = 1/250 (ordinate scale offset +0.1), (c) 12C2H6/12CH4 = 1/250, all samples at 3 K; resolution 0.5 cm−1 from 600 co-added interferograms.
Characteristic wavenumbers and assignments of vibrational modes of lines of 12C2H6, 12C2H4 and 12C2H2 at molar ratio 1/250 in solid 12CH4 at 3 K.
| Species | Wavenumber/cm−1 |
|---|---|
| 12CH4 | 1296.5 (ν4), 2589.7 (2ν4), 2811.6 (ν2+ν4), 2905.7 (ν1), 3009.7 (ν3), 4201.1 (ν1 + ν4), 4300.1 (ν3 + ν4), 4528.4 (ν2 + ν3) |
| 12C2H2 | 736.6 (ν5), 3267.0 (ν3) |
| 12C2H4 | 949.7 (ν7), 1437.3 (ν12), 2979.4 (ν11), 3093.9 (ν9) |
| 12C2H6 | 820.2 (ν12), 1373.3 (ν6), 1463.9 (ν11), 2883.9 (ν5) |
| 2916.5 (2ν8), 2942.0 (ν1), 2975.7 (ν10) |
From our separate experiments with 12C2H2:12CH4 = 1:250, 12C2H4:12CH4 = 1:250 and 12C2H6:12CH4 = 1:250, we derived the ratios of absorption of 12C2H2, 12C2H4 and 12C2H6 dispersed in solid 12CH4. According to Fig. 2, the vibrational modes of greatest absorbance are ν5 of 12C2H2 at 736.6 cm−1, ν7 of 12C2H4 at 949.7 cm−1 and ν10 of 12C2H6 at 2975.7 cm−1. When we integrated the intensities of these lines to compare the normalized values, we derived the ratios of their absorptions, as listed in Table 2; these normalized values allow us to generate absolute yields relative to that of C2H2, which we employed in our analysis. Among these lines, mode ν5 of 12C2H2 at 736.6 cm−1 possesses the greatest absorption coefficient; the ratios of mode ν7 of 12C2H4 at 949.7 cm−1 and mode ν10 of 12C2H6 at 2975.7 cm−1 are 56.2 and 72.5 per cent, respectively. We calculated the A-factors of vibrational modes (Jamieson et al. 2005) at the B3LYP/aug-cc-pVTZ level of density-functional theory (Frisch et al. 2009) to obtain 196 km mol−1 for the A-factor of mode ν5 of 12C2H2, 97.1 km mol−1 for mode ν7 of 12C2H4 and 129 km mol−1 for mode ν10 of 12C2H6. Dobbs & Dixon (1994) calculated the A-factor of mode ν7 of 12C2H4 as 96.7 km mol−1, consistent with our value. According to these calculated A-factors of mode ν5 of 12C2H2, the ratios of mode ν7 of 12C2H4 and mode ν10 of 12C2H6 are 49.5 and 65.7 per cent, respectively. The discrepancies between calculated and experimental values of ratios are less than 10 per cent.
Calculated A-factors/km mol−1 and experimental values of characteristic absorption lines of CH3, C2H4, C2H6 and C2H2.
| Species | Mode | ν/cm−1 | Theory | Experiment | ||
|---|---|---|---|---|---|---|
| A-factor | Ratio | Area/cm−1 | Ratio | |||
| CH3 | ν2 | 609.0 | 73.9 | 37.7 | – | – |
| C2H2 | ν5 | 736.6 | 196 | 100.0 | 0.0785 ± 8.3 per cent | 100 ± 8.3 |
| C2H4 | ν7 | 949.7 | 97.1 | 49.5 | 0.0441 ± 8.7 per cent | 56.2 ± 8.7 |
| C2H6 | ν10 | 2975.7 | 129 | 65.7 | 0.0569 ± 3.5 per cent | 72.5 ± 3.5 |
3.3 Absorption spectra of products from solid isotopic methanes at 3 K after photolysis at 121.6 nm
On irradiation of a sample of solid methane at 3 K with light of wavelength 121.6 nm, the intensity of all infrared absorption lines of precursor methane at 3 K uniformly decreased for the first 2 min, continuously, but at a rate decreasing with increasing duration of irradiation. After irradiation for 76 min total as an accumulation of several smaller periods and as limited by the total available duration of experiments, the intensities of lines of CH4 decreased by ∼24 per cent; the extent of depletion was derived from a comparison of the ratios of net absorbance at a particular duration with those of the original sample.
Through their characteristic infrared absorption lines, our experiments with methane containing 12C, 13C, H and D enabled a definitive identification of photolysis products, apart from H, H2, C and C2 that have no absorption in the mid-infrared region. Fig. 3 shows partial difference spectra of isotopic samples for solid methane after photolysis at 121.6 nm for 76 min. These difference spectra were derived on subtracting the spectra recorded after irradiation from the spectra before irradiation; in these spectra, lines pointing upwards indicate production, whereas those pointing downwards indicate destruction. After photolysis, many new features appeared, shown in Fig. 3; the wavenumbers of these lines and their assignments appear in Table 3.
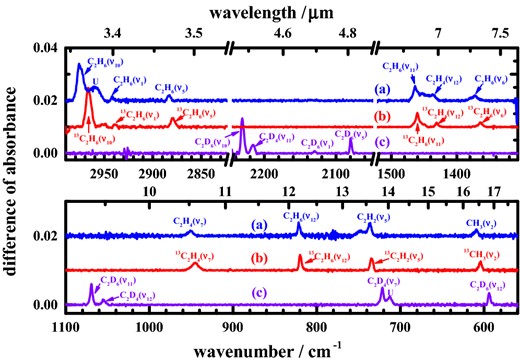
Difference spectra of solid methane at 3 K after irradiation at 121.6 nm for 76 min (a) 12CH4 (ordinate scale offset +0.02); (b) 13CH4 (ordinate scale offset +0.01); (c) 12CD4; resolution 0.5 cm−1, from 600 co-added interferograms.
Products of photolysis at 121.6 nm of pure solid isotopic methanes at 3 K and their absorption lines.
| 12CH4 | 13CH4 | 12CD4 | |||
|---|---|---|---|---|---|
| Species | Wavenumber/cm−1 | Species | Wavenumber/cm−1 | Species | Wavenumber/cm−1 |
| 12CH3 | 609.0 (ν2) | 13CH3 | 604.1 (ν2) | 12CD3 | – |
| 12C2H2 | 736.6 (ν5), 3267.4 (ν3) | 13C2H2 | 734.5 (ν5) | 12C2D2 | 2425.5 (ν3) |
| 12C2H4 | 949.7 (ν7), 1437.3 (ν12) | 13C2H4 | 944.8 (ν7), 1431.1 (ν12) | 12C2D4 | 721.5 (ν7), 1055.1 (ν12), 2215.8 (ν11) |
| 12C2H6 | 820.3 (ν12), 1373.3(ν6) | 13C2H6 | 819.9 (ν12), 1364.5(ν6) | 12C2D6 | 593.8 (ν12) |
| 1463.9 (ν11), 2883.9 (ν5) | 1460.2 (ν11), 2879.5 (ν5) | 1069.1 (ν11), 2079.9 (ν5) | |||
| 2942.0 (ν1), 2976.1 (ν10) | 2939.4 (ν1), 2966.3 (ν10) | 2129.6 (ν1), 2230.8 (ν10) | |||
| Ua | 2958.5 | Ua | 712.6 | ||
Note.aUnidentified line.
We identified three stable products – C2H2, C2H4, C2H6 – and CH3 radicals, in their various isotopic species, upon photolysis of pure solid methane at 121.6 nm based on our survey data as mentioned above. Irradiation of pure solid 12CH4 produced characteristic lines of 12C2H2 at 736.6 (ν5) and 3267.4 cm−1 (ν3), of 12C2H4 at 949.7 (ν7) and 1437.3 cm−1 (ν12), and of 12C2H6 at 820.3 (ν12), 1373.3 (ν6), 1463.9 (ν11), 2883.9 (ν5), 2942.0 (ν1) and 2976.1 cm−1 (ν10). A line at 609.0 cm−1 after irradiation of pure solid 12CH4 is characteristic of 12CH3 radicals, vibrational mode ν2, but of no other likely compound or identifiable species, and is confirmed by both a shift to 604.1 cm−1 for 13CH3 after analogous photolysis of 13CH4 and the result of quantum-chemical calculations (Gaussian 09, MP2/aug-cc-pvqz). For 12CD3, ν2 shifts to about 460 cm−1 beyond our range of detection. A summary of wavenumbers of absorption lines and assignments, including isotopic variants, appears in Table 3.
3.4 Temporal profiles of photolysis at 121.6 nm
To assess the temporal depletion of precursor methane and the formation of the varied photolysis products, we photolyzed the methane samples for periods 10 s, 30 s, 1 min, 5 min, 10 min, 30 min and another 30 min sequentially; the total duration of irradiation is accordingly 76 min and 40 s. The temporal profiles of the depletion ratio for CH4 and of formation for CH3, C2H2, C2H4 and C2H6 upon photolysis at 121.6 nm are displayed in Fig. 4. As the integrated photon flux from our synchrotron is constant over time, the photon dose is linearly proportional to the duration of exposure to the light from the synchrotron.
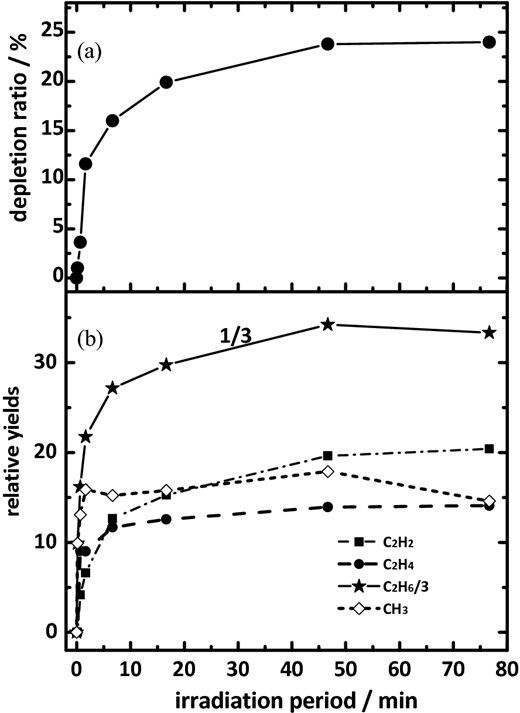
For pure CH4 at 3 K irradiated at 121.6 nm; (a) temporal profile of depletion ratio for CH4; (b) temporal profiles of the formation of CH3, C2H2, C2H4 and C2H6. The relative yield of C2H6 is divided by 3.
The depletion of methane amounted to about 24 per cent at 121.6 nm after 76 min, as shown in Fig. 4(a); although it is almost linear in the initial period of photolysis, it became non-linear after about 2 min. Little further depletion of methane occurred after 46 min. Fig. 4(b) displays temporal profiles of the formation of photolysis products CH3, C2H2, C2H4 and C2H6 at 121.6 nm. The temporal profile of relative yield for the formation of CH3 increased in the initial 2 min and decreased a little afterwards. The yields of C2H2 and C2H4 increased rapidly in the initial irradiation periods up to 10 min and approached plateau values. For C2H6, the yield increased smoothly to 46 min and decreased afterwards.
These temporal profiles of formation for photoproducts indicate that photochemically initiated secondary reactions occurred under the conditions of our experiments. According to Fig. 4, the depletion of methane and the formation of products remained nearly constant after 76 min. This result might indicate that the depletion of methane and the abundance of photolysis products were near that of a steady state after irradiation for 76 min.
3.5 Photolysis products versus wavelength
The wavelength of light to which solid methane is exposed might affect the nature or proportions of the products of photolysis. To test this possibility, we subjected samples of pure solid CH4 to photolysis at wavelengths 130, 140, 155, 165, 175, 185, 190 and 200 nm. Fig. 5 shows partial difference absorption spectra of pure solid methane irradiated at these wavelengths; the absorption lines of CH3, C2H2, C2H4 and C2H6 are marked to clarify these photolysis products.
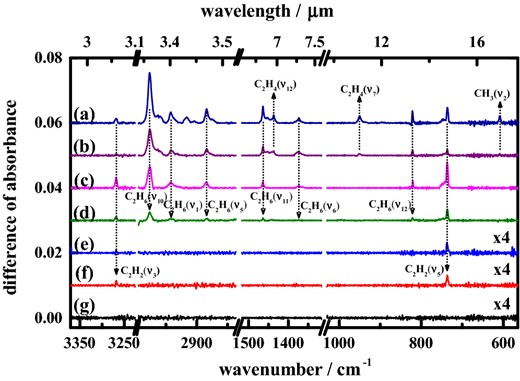
Difference spectra of solid methane after irradiation at 3 K at wavelengths (a) 130, (b) 140, (c) 165, (d) 175, (e) 185, (f) 190 and (g) 200 nm; the curves of (e), (f) and (g) are enlarged four times.
Upon examination of the spectra in Fig. 5, we found that the same four products – CH3, C2H2, C2H4 and C2H6 – were produced upon photolysis at 130 nm as at 121.6 nm. The temporal depletion of methane and the temporal profiles of photolysis products at 130 nm (see supplementary information) are similar to those at 121.6 nm. The products and their proportions altered at wavelengths greater than 130 nm. After irradiation at 140 nm, the signal of C2H6 remained, but the signals of C2H2 and C2H4 decreased substantially and of CH3 persisted with minute intensity. Upon photolysis at 155 and 165 nm, we detected no CH3 and C2H4, but the relative intensity of C2H2 increased to become comparable with that of C2H6. Upon excitation at 175 nm, both C2H2 and C2H6 survived, but only a weak signal of C2H2 lingered upon irradiation at 185 and 190 nm. No product was observed after irradiation at 200 nm. The largest wavelengths at which products CH3, C2H4, C2H6 and C2H2 of photolysis of solid methane were detected were 140, 140, 175 and 190 nm, respectively.
Based on the ratios of characteristic absorptions for various products, we derived the relative yields of these products at various wavelengths. According to the survey experiments, the ratios of absorptions A(C2H2, ν5) : A(C2H4, ν7) : A(C2H6, ν10) are 100 : 56.2 : 72.5, as listed in Table 2. For the absorption of CH3, a direct calibration for CH3 is impracticable from a survey experiment as mentioned above; we instead estimated its relative value for mode ν2 using calculated A-factor 73.9 km mol−1 and derived the ratio to be 37.7, also listed in Table 2. Among the photolysis products, C2H2 was detected at the greatest wavelength; we adopted its absorption at 736.6 cm−1 as 100 upon photolysis of CH4 at 165 nm for comparison. Although our quantities of methane deposited were the same in all experiments, the photon doses at various wavelengths were not kept constant. We hence could not directly derive the relative yields of photolysis products at various wavelengths, but only their relative abundances, as listed in Table 4.
Relative abundances of products of photolysis of CH4 for 76 min at various wavelengths, relative photon doses (RPD) and depletion of CH4.
| λ/nm | 121.6 | 130 | 140 | 155 | 165 | 175 | 185 | 190 | 200 |
| RPDa | 39.0 | 246 | 169 | 36.6 | 100 | 72.0 | 59.1 | 38.9 | 29.6 |
| D(CH4)b | 24 | 35 | 4.8 | 2 | 6 | < 0.5 | < 0.5 | < 0.5 | 0 |
| CH3 | 113 | 20.9 | <0.8 | 0 | 0 | 0 | 0 | 0 | 0 |
| C2H2 | 158 | 25.6 | 14.0 | 42.6 | 100 | 60.5 | 11.6 | 18.6 | 0 |
| C2H4 | 109 | 30.2 | 6.2 | 0 | 0 | 0 | 0 | 0 | 0 |
| C2H6 | 775 | 130 | 112 | 113 | 123 | 56.6 | 0 | 0 | 0 |
Notes.aRelative photon dose: total dose at 165 nm is 4.45 × 10¹⁸ photons, taken as 100.
bD(CH4) = depletion ratio of CH4 in %.
3.6 Comparison with the photochemistry of methane dispersed in neon
The efficiency of photolysis of methane and the nature of the products depended on the wavelength selected for irradiation. Our photolysis of pure solid methane at 121.6 nm at 3 K generated four identifiable products – CH3, C2H2, C2H4 and C2H6 – that we identified according to their characteristic infrared absorption lines. In contrast, our preceding experiments (Lin et al. 2014) on photolysis at 121.6 nm of methane dispersed in solid neon at 3 K, at ratios 1:100 to 1:10 000, yielded many more products, comprising CH3, C2H2, C2H3, C2H4, C2H6, C4H2, C4H4, C5H2 and C8H2, CnH (n = 1–5), and carbon chains Cn (n = 3–20); not only the production but also the yield of carbon agglomerates increased with a decreasing initial concentration of methane dispersed in solid neon. For example, at CH4:Ne = 1:100, the products with 121.6 nm were stable molecules C2H2, C2H4, C2H6, C4H2 and radicals CH3, C2H3, C3H, C4H, C5H, C6, whereas at CH4:Ne = 1:10 000, the 30 products included stable molecules C2H2, C2H4, C2H6, C4H2, C4H4, oxides CO and C5O, hydride radicals CH, CH3, C2H3, C2H, C3H, C4H, C5H, C5H2, C8H2, and carbon chains C3, C4, C5, C6, C7, C8, C9, C10, C11, C12, C14, C16, C18 and C20 (Lin et al. 2014). The photolysis of methane in a solid sample is thus affected to a large extent by the environment of the methane molecules.
The comparison with the photochemistry of methane dispersed in neon exposes another disparity regarding a dissociation threshold. No product of photolysis of methane was detectable on irradiation of methane dispersed in neon at wavelength larger than 150 nm, whereas methane was photolyzed to produce C2H2 at 190 nm in a pure solid state. A novel finding in our present work is that the largest wavelengths at which products C2H6, C2H4 and C2H2 were generated were 175, 140 and 190 nm, respectively, through a radiative process: the greatest molecular disruption occurred with the photons of least energy.
3.7 Mechanism of photochemical decomposition of pure solid methane
The standard enthalpies of reaction at 300 K and the corresponding thresholds of wavelength for the dissociation of gaseous methane into other atomic and molecular species in their ground electronic states, plus excited methylene, are listed in Table 5.
Standard enthalpies of reaction at 300 K and the corresponding thresholds of wavelength for the dissociation of gaseous methane into other atomic and molecular species in their ground states, except CH2 also in excited state.
| ΔrHo/kJ mol−1 | λthreshold/ nm | ||
|---|---|---|---|
| CH4 + hv → CH3 + H | 442 | 270.5 | (1a) |
| |$\phantom{{\rm CH}_4 + hv} \to {\rm CH}_{\rm 2} {\rm X} + {\rm H}_2$| | 466.5 | 256.4 | (1b) |
| |$\phantom{{\rm CH}_4 + hv}\to {\rm CH}_2 \;a + {\rm H}_2$| | 518.6 | 230.7 | (1c) |
| |$\phantom{{\rm CH}_4 + hv} \to {\rm CH}_2 \,{\rm X} + 2{\rm H}$| | 902.5 | 132.5 | (1d) |
| |$\phantom{{\rm CH}_4 + hv} \to {\rm CH} + {\rm H} + {\rm H}_{\rm 2}$| | 887 | 134.8 | (1e) |
| |$\phantom{{\rm CH}_4 + hv} \to {\rm CH} + 3{\rm H}$| | 1323 | 90.4 | (1f) |
| |$\phantom{{\rm CH}_4 + hv} \to {\rm C} + 2{\rm H}_2$| | 791.5 | 151.1 | (1g) |
| |$\phantom{{\rm CH}_4 + hv} \to {\rm C} + 4{\rm H}$| | 1664 | 71.9 | (1h) |
According to Table 5, CH4 might therefore dissociate at wavelengths greater than 110 nm according to equations (1a)∼(1e) and (1g). The most abundant product of photolysis of gaseous methane at 121.6 or 118.2 nm is the CH2 radical in its excited singlet state, a, whereas only a small fraction of CH2 is formed in its ground triplet state, X (Gans et al. 2011). In the solid state, all six channels might hence be open. In our experiments, CH4 might thus be photolyzed via equations (1a)∼(1e) and (1g) at 121.6 and 130 nm, via equations (1a), (1b), (1c) and (1g) at 140 nm, and via equations (1a), (1b) and (1c) at wavelengths greater than 152 nm.
In pure solid methane, primary photolysis products C, CH and CH2 are not detected; as they are generated with extra energy upon excitation with far-UV light, these species are highly reactive and might react with a CH4 molecule to form molecules C2H2, C2H4 and C2H6 as follows:
In contrast, as we detected CH3 directly, its reactivity with CH4 might be less than CH and CH2. We recorded the absorption of CH3 at wavelengths 121.6, 130 and 140 nm, but not at 155, 165, 175, 185, 190 and 200 nm in this work. This result is consistent with our previous work, in which the absorption of CH3 was observed from CH4 dispersed in solid neon at wavelengths 121.6, 130 and 140 nm, but not at wavelength greater than 150 nm (Lin et al. 2014). Including this work, the largest wavelength to form CH3 from solid methane is 140 nm and corresponding energy is 8.57 eV, which is 4.27 eV greater than its minimum dissociation energy of 4.58 eV (270.5 nm) in the gaseous phase. In the solid state, impeded by the surrounding CH4 molecules, CH3 as a fragment might be constrained typically to remain at or near its site of origin, and to recombine with an H atom, unless either fragment has sufficient kinetic energy to escape to become isolated separately. On photodissociation of solid methane at a wavelength beyond 140 nm, isolated CH3 might thus not be formed, whereas the formation of CH3 at wavelengths less than 140 nm produces some energetic CH3 radicals with extra energy, even above 4 eV; as result, these energetic CH3 might react with CH4 as follows:
Reactions (1)–(7) hence account for the four identified products – CH3, C2H2, C2H4 and C2H6 – produced on irradiation of pure solid methane at 121.6, 130 and 140 nm.
For wavelengths greater than 154 nm, photolysis of methane can produce radicals CH2 through reaction channels (1b) and (1c) (Bach et al. 1993). Primary photoproduct CH2 might subsequently react with an adjacent CH4 molecule in the solid state to generate C2H6, C2H4 and C2H2 via reaction (4) depending on its energy; during the photolysis, the generated CH2 possesses atypical extra energy from upon different wavelength. As we observed C2H2 and C2H6 at 155, 165 and 175 nm, and only C2H2 at 185 and 190 nm, reaction (4b) does not seem to occur to form C2H4 for a wavelength larger than 154 nm; reaction (4a) appears not to produce C2H6 for wavelengths larger than 175 nm.
After photolysis of solid methane at 185 or 190 nm, the appearance of absorption lines at 736.6 and 3267.4 cm−1 with intensities in the observed proportion, as are clear in Fig. 5, serves as an absolutely unambiguous signature for the production of C2H2. The signals of C2H2 are weak, resulting from less than 0.5 per cent depletion of precursor CH4. According to the first law of photochemistry, the appearance of detectable products on exposure of methane samples to light at 185 or 190 nm is proof of the absorption by the sample at those wavenumbers, even though that absorption is undoubtedly weak. The possibility of the photolysis being caused by stray light of appreciably smaller wavelength is completely excluded because of the quartz filter that was applied for photolysis at 185 and 190 nm; in any case, such stray light would have generated detectable products other than C2H2, according to our own definitive observations. The temporal profile of the formation of C2H2 represented by the integrated area of absorption line at 736.6 cm−1 upon photolysis of pure solid CH4 at 190 nm is displayed in Fig. S2 (see supplementary information); the weak signals of C2H2 appear to increase steadily with time up to 76 min. On detailed examination, the temporal profiles of the formation of C2H2 at 185 and 190 nm (Fig. S2, supplementary information) differ from those at 121.6 (Fig. 4) and 130 nm (Fig. S1, supplementary information); this phenomenon might indicate that the mechanism of the formation of C2H2 at 185 and 190 nm differs from that at other and smaller wavelengths. Reactions (2), (3), (4), (5) and (7) might be inapplicable for a photolysis wavelength greater than 175 nm.
As another possibility in solid methane upon photolysis, if two adjacent or near CH4 molecules produce two CH2 through separate excitation by photons, these two CH2 could react and produce C2H2. The energy of two energetic CH2 radicals is large in the self-reaction system. Due to the lack of a way to release the excess energy, this self-reaction might not form stabilized adduct C2H4 in the reaction system; dissipating the excess energy through product H2, reaction (8) can thus proceed. This reaction can occur at all wavelengths to a minor extent, but it can become dominant when, according to the lack of their products, reactions (2)–(7) do not occur at 185 and 190 nm.
3.8 Photochemical decomposition of methane clusters
From our previous works, the far-UV absorption of gaseous methane possesses an apparent onset about 145 nm (8.55 eV), whereas the value of methane dispersed in neon shifts to about 150 nm (Lin et al. 2014). Fig. 6 displays absorption spectrum of pure solid CH4 at 10 K in the spectral region 106–220 nm at resolution 0.2 nm. The far-UV absorption of pure solid methane extends to 190 nm; this indicates that the absorption beyond 150 nm is associated with the methane clusters.
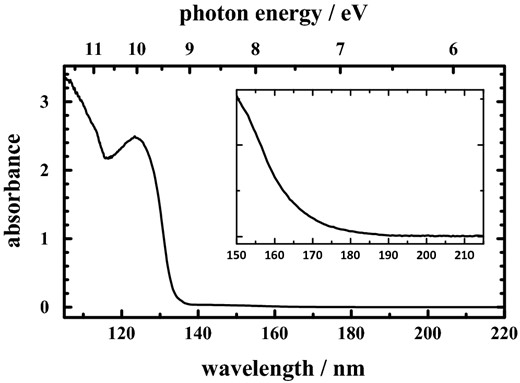
VUV absorption spectrum of pure solid CH4 at 10 K in the spectral region 106–220 nm at resolution 0.2 nm. The inset displays the enlarged scale beyond 150 nm.
For wavelengths larger than 150 nm, irradiation of sample CH4/Ne (1/1000) produces no photoproduct (Lin et al. 2014); an isolated CH4 molecule (or CH4 monomer) in solid neon is hence inert at wavelengths greater than 150 nm. However, we observed C2H2 and C2H6 from pure solid methane upon irradiation at wavelengths larger than 150 nm; this effect indicates that at these wavelengths products C2H2 and C2H6 might be formed not from the CH4 monomer, but from a cluster. As mentioned above, the infrared absorption spectra of methane reveal a significant intermolecular interaction in the pure solid state; this interaction yields infrared absorption of pure solid CH4 extended to broad lines, as shown in Fig. 1. For example, the ν4 band of pure solid CH4 exhibits a partially resolved doublet at 1301.5 and 1296.8 cm−1 with a shoulder at 1294.5 cm−1; this doublet possesses a total width about 8.2 cm−1. Such a width reflects the interaction between molecules, two or more at a time, in the lattice.
After irradiation with far-UV light, the difference absorption spectra show patterns depending on the excitation wavelength. For example, Fig. 7 displays two typical difference IR absorption spectra of solid methane at 3 K after irradiation at wavelengths 121.6 and 185 nm in the region 1270–1320 cm−1. Upon excitation at 121.6, 130 and 140 nm, the spectra are similar in Fig. 7(b), which develops three downward lines at about 1302, 1297 and 1294 cm−1. In contrast, Fig. 7(a) shows two upward lines about 1302 and 1297 cm−1 and one downward line at 1294 cm−1; upon irradiation with light of wavelength greater than 150 nm, the spectra possess the same pattern as this curve. The downward line in the difference absorption spectra means depletion of the absorption line. The species associated with downward lines 1302, 1297 and 1294 cm−1 were all depleted at 121.6, 130 and 140 nm. As mentioned above, the CH4 monomer is not susceptible to photolysis for wavelengths beyond 150 nm; the depletion line at 1294 cm−1 in Fig. 7(a) is associated not with a single CH4 molecule but with some aggregate, likely a CH4 dimer constituting two methane molecules in close proximity. Such a CH4 dimer can certainly be dissociated in the far-UV region; its photolysis would yield products involving either two methane molecules in less close proximity or less interacting, or molecules containing two carbon atoms, as observed. The former process results in regenerated CH4 monomer and decreased CH4 dimer. Accordingly, the upward lines 1302 and 1297 cm−1 might be contributed by the CH4 monomer, whereas the downward line 1294 cm−1 belongs to the CH4 dimer.
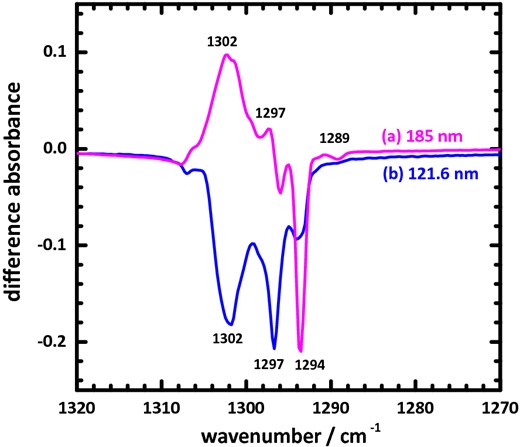
Difference of IR absorption spectra of solid methane at 3 K after irradiation with wavelengths (a) 185 and (b) 121.6 nm in the region 1270–1320 cm−1.
Any mechanism of any reaction is purely speculative, including that above. We emphasize that the highly effective filters that we employ in these experiments absolutely preclude the indicated photochemical processes as a result of stray light of smaller wavelength. Under these conditions, a mechanism involving the photolysis of interacting molecules in solid methane, likely two at a time, becomes plausible.
3.9 Implications for photochemistry in space
Methane is observed in space objects at concentrations such as 1.6 per cent on Titan (Hirtzig et al. 2009), 4.7 per cent for young stellar objects (Öberg et al. 2008) and 0.2∼1.45 per cent for comets (Brooke et al. 2003; Magee-Sauer et al. 2008). Like water clouds on Earth, methane may exist as clouds in these astronomical objects; the cycling of methane clouds subsequently condenses methane into lakes or oceans in astronomical environments, similar to water on Earth. Radar images from spacecraft Cassini on Titan indicated more than 75 radar-dark patches that are attributed to lakes of liquid methane (Stofan et al. 2007); this evidence demonstrates the existence of pure condensed methane in astro-environments. Consistent with the melting point of methane about 90 K, methane is known to exist in a solid form in outer space at less than 40 K (Quirico et al. 1999; Olkin et al. 2007; Tegler et al. 2010). Our photochemical experiments on pure solid methane are thus applicable to astronomical environments. Shemansky et al. reported that the number densities of CH4, C2H2, C2H4 and C2H6 are 1.90 × 10¹⁷, 1.11 × 10¹⁶, 8.2 × 10¹⁵ and 7.3 × 10¹⁵ molecules per mL, respectively, on Titan (Shemansky et al. 2005). In this work, we observed stable molecules C2H2, C2H4 and C2H6 upon excitation at 121.6, 130 and 140 nm, C2H2 and C2H6 at 155, 165 and 175 nm, and only C2H2 at 185 and 190 nm; our results might be linked to this observation.
4 CONCLUSION
With light of wavelength 120–200 nm selected from a synchrotron source, we irradiated samples of pure solid methane at 3 K. After irradiation, four distinct products – CH3, C2H2, C2H4 and C2H6 – were identified according to their characteristic infrared absorption lines. The distribution among these products depended on the wavelength of irradiation. We observed all four products upon excitation at 121.6, 130 and 140 nm, C2H2 and C2H6 at 155, 165 and 175 nm, and only C2H2 at 185 and 190 nm. No product was observed after irradiation at 200 nm. The largest wavelengths at which products CH3, C2H4, C2H6 and C2H2 were detected were 140, 140, 175 and 190 nm, respectively. We compare our result with previous work (Lin et al. 2014) on irradiation of methane dispersed in solid Ne at 3 K. Information about the dissociation of CH4 at low temperature with photons of varied energy has implications for astrophysical environments.
National Science Council of Taiwan (grant NSC 102-2113-M-213-005-MY3) and NSRRC provided support for this research.
REFERENCES
SUPPORTING INFORMATION
Additional Supporting Information may be found in the online version of this paper:
Figure S1. For pure CH4 at 3 K irradiated at 130 nm, (a) temporal profile of depletion ratio for CH4; (b) temporal profiles of formation of CH3, C2H2, C2H4 and C2H6. The relative yield of C2H6 is divided by 3.
Figure S2. Temporal profile of formation of C2H2 represented by the integrated area of absorption line at 736.6 cm−1 upon photolysis of pure solid CH4 at 190 nm (Supplementary Data).
Please note: Oxford University Press are not responsible for the content or functionality of any supporting materials supplied by the authors. Any queries (other than missing material) should be directed to the corresponding author for the paper.
