


Abstract
We determine the radial abundance distributions across the discs of 14 irregular galaxies of the types Sm and Im (morphological T types 9 and 10) as traced by their H ii regions. The oxygen and nitrogen abundances in H ii regions are estimated through the Te method or/and with the counterpart method (C method). Moreover, we examine the correspondence between the radial abundance gradient and the surface brightness profile. We find that irregular galaxies with a flat inner profile (flat or outwardly increasing surface brightness in the central region) show shallow (if any) radial abundance gradients. On the other hand, irregular galaxies with a steep inner profile (with or without a bulge or central star cluster) usually show rather steep radial abundance gradients. This is in contrast to the widely held belief that irregular galaxies do not usually show a radial abundance gradient.
INTRODUCTION
The radial distribution of gas-phase oxygen abundances traced by H ii regions has been investigated in the discs of many spiral galaxies (Vila-Costas & Edmunds 1992; Zaritsky, Kennicutt & Huchra 1994; van Zee et al. 1998; Pilyugin, Vílchez & Contini 2004; Moustakas et al. 2010; Gusev et al. 2012; Pilyugin, Grebel & Kniazev 2014a; Sánchez et al. 2014). It was found that almost all spiral galaxies show radial abundance gradients in the sense that their inner H ii regions (i.e. those closer to the galactic centres) have higher oxygen abundances than the outer ones.
The radial distribution of abundances across the discs of irregular galaxies is less well studied. Pagel et al. (1978) analysed spectra of a number of H ii regions in the Small and Large Magellanic Clouds. They determined the abundances in H ii regions through the effective temperature (Te) method using their own measurements together with the spectral measurements by other authors and examined the spatial distributions of abundances in those galaxies. Pagel et al. (1978) concluded that any radial abundance gradient in present-day abundances is small or absent in the Large Magellanic Cloud and is conspicuously absent in the Small Magellanic Cloud. In the Small Magellanic Cloud, stellar metallicity determinations also support the absence of a radial gradient, although there is a large metallicity spread of ∼0.6 dex in [Fe/H] for a given age (Glatt et al. 2008; Cignoni et al. 2013).
Roy et al. (1996) studied the oxygen abundance distributions in the discs of the dwarf irregular galaxy NGC 2366 and the dwarf Seyfert I galaxy NGC 4395 using imaging spectrophotometry with narrow-band filters in the lines of H α, H β, [O iii] λ5007 and [N ii] λ6584. They used the line ratio [O iii]/[N ii] as an abundance indicator (O3N2 calibration). They found that there is no global oxygen abundance gradient across the discs of those galaxies.
Hunter & Hoffman (1999) obtained emission-line long-slit spectra of 189 H ii regions in a sample of 65 Im, Sm, and blue compact dwarf galaxies. They estimated the oxygen abundances in H ii regions using the line ratio [O iii]/[N ii] (O3N2 calibration) and the combination of R23 = [O iii]+[O ii] and [O iii]/[O ii] (two-dimensional R23 calibration) when the oxygen line [O ii] λ3727 was measured. Hunter & Hoffman (1999) examined the radial abundance distribution in discs of eight Sm and Im galaxies for which they measured at least three H ii regions. They found that the oxygen abundances within a given galaxy generally vary by about 0.2 dex, but they did not detect a trend in oxygen abundances with radius except for the Sm galaxy DDO 204.
Kniazev et al. (2005) measured oxygen abundances with the direct method in three H ii regions in each of the dwarf irregulars Sextans A and Sextans B. While they found Sex A to be chemically homogeneous, one of the three H ii regions in Sex B turned out to be about twice as metal rich than the other two, and the abundances of other heavy elements suggest an enrichment by a factor of ∼2.5 as compared to the other two H ii regions. Kniazev et al. (2005) attribute this to inhomogeneous chemical enrichment.
van Zee & Haynes (2006) carried out long-slit spectroscopy of 67 H ii regions in 21 dwarf irregular galaxies. Oxygen abundances for 25 H ii regions were derived through the direct Te method; the abundances in other H ii regions were estimated using strong line calibrations. van Zee & Haynes (2006) considered the oxygen abundances as a function of radius for 12 irregular galaxies with three or more observations and found that the abundances are very similar (within the formal errors) within each galaxy with the possible exception of the galaxy UGC 12894. van Zee & Haynes (2006) noted that the radial trend in oxygen abundances (three points) in the UGC 12894 may be artificial because the abundances of the inner and outer H ii regions were obtained via different methods (through the strong line calibration for two inner H ii regions and through the Te method for outer H ii region).
Similarly, Lee, Zucker & Grebel (2007) obtained oxygen abundances for 35 H ii regions in eight dwarf galaxies in the Centaurus A group and in 13 H ii regions in closer dwarfs. Some of their measurements use the direct Te method, while the majority of the abundance determinations are based on strong-line calibrations. Although the results for individual H ii regions in a given galaxy tend to vary, Lee et al. point out that the variations are within the uncertainties of the strong-line method. In one of the dwarf irregulars of the Cen A group, AM 1318 − 444, one of the H ii regions is considerably more oxygen rich than the others. Lee et al. argue that the measured line intensity ratios suggest that this emission nebula is a supernova remnant. They also note that radial gradients may exist in some of their targets such as in the Sm NGC 3109 or NGC 5264, but that more and deeper data are needed to establish this.
It is the current belief that irregular galaxies generally do not show radial abundance gradients in their young populations and are chemically homogeneous. This implies that there is a ‘spiral versus irregular dichotomy’ in the sense that there is a sudden change from spiral (radial abundance gradients are usually present) to irregular galaxies (typically no gradients). However, other properties (e.g. gas fraction, global metallicity) vary smoothly in transition from spirals to irregulars (Zaritsky et al. 1994; Pilyugin & Ferrini 2000; Garnett 2002; Pilyugin et al. 2007, among others).
The measurements of the abundance gradients in the discs of irregular galaxies often encounter the following difficulty. Reliable oxygen abundances in a number of H ii regions in the disc of a galaxy should be determined in order to evaluate the existence of an abundance gradient. Abundance determinations using the direct Te method require high-precision spectroscopy including the weak auroral lines [O iii] λ4363 or/and [N ii] λ5755. Unfortunately, these weak auroral lines are usually only detected in the spectra of a few (if any) of the brightest H ii regions in a given irregular galaxy. The oxygen abundances in the other H ii regions are then estimated using the strong-line method pioneered by Pagel et al. (1979) and Alloin et al. (1979). The principal idea of the strong-line method is to establish the relation between the (oxygen) abundance in an H ii region and some combination of the intensities of strong emission lines in its spectrum (such a relation is usually called a ‘calibration’). Different calibrations were suggested. A prominent characteristic of the calibrations is that they are not applicable across the whole range of metallicities of H ii regions but only within a limited interval (usually only at high or at low metallicities). The oxygen abundances of irregular galaxies typically lie within or near the transition zone in the R23–O/H diagram (from 12 + log(O/H) ∼ 7.9 to ∼8.3) where calibrations cannot be used or where they provide abundances with large uncertainties.
We recently suggested a new method (the ‘C method’) for abundance determinations in H ii regions, which can be used over the whole range of metallicities of H ii regions and which provides oxygen and nitrogen abundances on the same metallicity scale as the classic Te method (Pilyugin, Grebel & Mattsson 2012; Pilyugin et al. 2013). Using this method, we examined the abundance gradients in the discs of 130 late-type galaxies including several irregular galaxies (Pilyugin et al. 2014a). In that study, radial abundance gradients were found in irregular galaxies. Here we will focus on the investigation of the abundance gradients in a sample of irregular galaxies ( Sm and Im, morphological T types 9 and 10). Since there is a relation between oxygen abundance and disc surface brightness in spiral galaxies (e.g. Pilyugin et al. 2014b), we will also examine the relation between radial abundance distributions and surface brightness profiles of the discs of irregular galaxies.
The paper is structured as follows. The spectral and photometric data are reported in Section 2. The radial abundance gradients are determined in Section 3. The discussion and conclusions are given in Section 4, followed by a summary (Section 5).
THE DATA
Our sample
We have selected a sample of irregular Sm and Im galaxies with morphological T types of 9 and 10 according to the RC3 catalogue (de Vaucouleurs et al. 1991). It should be noted that the morphological classification of some galaxies is not robust. The morphological T types in different sources can differ by up to 1. We only consider irregular galaxies with available spectra for four and more H ii regions. The validity of the radial abundance is defined not only by the quantity and quality of the spectra but also by the distribution of the measured H ii regions along the galactic radius. We reject galaxies where the measured H ii regions cover less than ∼1/3 of the optical radius of a galaxy. For example, for this reason we rejected the galaxy UGC 5666 (a.k.a. IC 2574 or DDO 81). More than 10 spectra are available for this galaxy (Miller & Hodge 1996; Croxall et al. 2009), but the measured H ii regions cover only a small fraction of the optical radius of the galaxy, which prevents a reliable investigation of a radial abundance gradient.
Our final list includes 14 irregular galaxies with optical radii of R25 ≳ 2 kpc. Table 1 lists the general characteristics of each galaxy. Column 1 contains the order number. Columns 2–4 give the galaxy's name. We list the number of a galaxy according to the New General Catalogue (NGC, column 2), the Uppsala General Catalog of Galaxies (UGC, column 3), and one other widely used name (column 4). The morphological type of the galaxy (morphological type code T) from the RC3 is reported in column 5. The right ascension (RA) and declination (Dec.) (J2000.0) of each galaxy are given in columns 6 and 7. The right ascension and declination are obtained from our photometry (see Section 2.3) or taken from the NASA/IPAC Extragalactic Database (NED).1 The position angle (PA), axis ratio (b/a), and inclination are listed in columns 8–10. The isophotal radius R25 in arcmin and in kpc of each galaxy is reported in columns 11 and 12, respectively. The adopted distance d taken from Karachentsev, Makarov & Kaisina (2013) or from the NED is reported in column 13. The NED distances use flow corrections for Virgo, the Great Attractor, and Shapley Supercluster infall. The references to sources for geometrical parameters (first reference) and for distances (second reference) are given in column 14.
The adopted properties of our galaxies.
| n | Name | T | RA | Dec. | PA | b/a | Inclination | R25 | R25 | d | Reference | ||
|---|---|---|---|---|---|---|---|---|---|---|---|---|---|
| NGC | UGC | Other | type | (deg) | (arcmin) | (kpc) | (Mpc) | ||||||
| 1 | 2023 | DDO 25 | 10 | 02:33:18.20 | 33:29:28.0 | 1.00 | 0 | 0.83 | 2.24 | 9.30 | RC3; K13a | ||
| 2 | 2216 | 10 | 02:44:21.14 | 00:40:37.6 | 13 | 0.41 | 66 | 0.40 | 4.25 | 36.50 | Here; NED | ||
| 3 | 1156 | 2455 | 10 | 02:59:42.30 | 25:14:16.2 | 25 | 0.74 | 42 | 1.66 | 3.76 | 7.80 | RC3; K13 | |
| 4 | 2537 | 4274 | 9 | 08:13:14.66 | 45:59:32.7 | 5 | 0.95 | 18 | 1.07 | 3.80 | 12.20 | Here; K13 | |
| 5 | 4305 | DDO 50 | 10 | 08:19:04.98 | 70:43:12.1 | 15 | 0.79 | 37 | 3.97 | 3.92 | 3.39 | RC3; K13 | |
| 6 | 3738 | 6565 | 10 | 11:35:48.81 | 54:31:25.8 | 167 | 0.66 | 49 | 1.43 | 2.04 | 4.90 | Here; K13 | |
| 7 | 6980 | 10 | 11:59:06.20 | 24:28:20.3 | 159 | 0.48 | 61 | 0.23 | 3.55 | 53.10 | Here; NED | ||
| 8 | 4214 | 7278 | NGC 4228 | 10 | 12:15:39.19 | 36:19:36.6 | 126 | 0.89 | 27 | 3.18 | 2.72 | 2.94 | Here; K13 |
| 9 | 4395 | 7524 | 9 | 12:25:48.88 | 33:32:48.7 | 135 | 0.64 | 50 | 4.08 | 5.47 | 4.61 | Here; K13 | |
| 10 | 7557 | 9 | 12:27:11.24 | 07:15:47.1 | 148 | 0.80 | 37 | 1.14 | 4.54 | 13.70 | Here; NED | ||
| 11 | 4449 | 7592 | 10 | 12:28:11.01 | 44:05:38.1 | 48 | 0.56 | 56 | 3.07 | 3.76 | 4.21 | Here; K13 | |
| 12 | CGCG 071−090 | 10 | 12:58:52.80 | 13:09:08.8 | 172 | 0.60 | 53 | 0.49 | 1.98 | 13.90 | Here; NED | ||
| 13 | 9614 | 10 | 14:56:47.70 | 09:30:33.4 | 21 | 0.77 | 40 | 0.50 | 7.23 | 49.70 | Here; NED | ||
| 14 | 12709 | DDO 219 | 9 | 23:37:24.05 | 00:23:30.7 | 150 | 0.73 | 43 | 0.73 | 7.86 | 37.00 | Here; NED | |
aK13 – Karachentsev et al. (2013).
Emission line intensities in the H ii region spectra
We use the emission line intensities in published spectra of H ii regions from different works for abundance determinations. We have searched for spectra of H ii regions with measured H α, H β, [O iii] λ5007, [N ii] λ6584, and [S ii] λ6717+λ6731 lines. The lines [O ii] λ3727+λ3729 and [O iii] λ4363 are also available in a number of spectra. We have taken the dereddened line intensities as reported by the authors. If only the measured fluxes are given then the measured emission-line fluxes were corrected for interstellar reddening in the same way as in Pilyugin et al. (2014a). These spectroscopic data form the basis for the abundance determinations. The references to the spectroscopic data sources are listed in Table 2.
The derived parameters of the radial oxygen and nitrogen abundance distributions in our target galaxies.
| Galaxy | R25 | 12+log(O/H)|$_{R_{0}}$| | O/H gradient | σ(O/H) | 12+log(N/H)|$_{R_{0}}$| | N/H gradient | σ(N/H) | References |
|---|---|---|---|---|---|---|---|---|
| (kpc) | (dex R|$_{25}^{-1}$|) | (dex) | (dex R|$_{25}^{-1}$|) | (dex) | ||||
| UGC 02023 | 2.24 | 8.08 ± 0.07 | −0.082 ± 0.128 (0.150) | 0.052 | 6.72 ± 0.12 | −0.137 ± 0.208 (0.252) | 0.085 | 10, 18 |
| UGC 02216 | 4.25 | 8.07 ± 0.02 | −0.040 ± 0.043 (0.300) | 0.026 | 6.69 ± 0.05 | −0.056 ± 0.091 (0.560) | 0.054 | 16 |
| NGC 1156 | 3.76 | 8.16 ± 0.04 | −0.124 ± 0.112 (0.138) | 0.080 | 6.84 ± 0.07 | −0.232 ± 0.202 (0.260) | 0.145 | 8, 10, 14 |
| NGC 2537 | 3.80 | 8.35 ± 0.01 | −0.071 ± 0.034 (0.031) | 0.014 | 7.28 ± 0.03 | −0.237 ± 0.113 (0.124) | 0.046 | 1, 6, 8, 16 |
| UGC 04305 | 3.92 | 7.83 ± 0.04 | −0.140 ± 0.078 (0.085) | 0.101 | 6.31 ± 0.05 | −0.182 ± 0.090 (0.108) | 0.116 | 3, 4 |
| NGC 3738 | 2.04 | 8.10 ± 0.02 | −0.110 ± 0.103 (0.128) | 0.028 | 6.71 ± 0.04 | −0.144 ± 0.173 (0.201) | 0.046 | 1, 8, 10 |
| UGC 06980 | 3.55 | 8.06 ± 0.07 | −0.150 ± 0.112 (0.124) | 0.056 | 6.62 ± 0.05 | −0.145 ± 0.077 (0.089) | 0.038 | 7, 16 |
| NGC 4214 | 2.72 | 8.20 ± 0.05 | 0.049 ± 0.124 (0.122) | 0.090 | 6.89 ± 0.06 | 0.037 ± 0.148 (0.189) | 0.108 | 8, 10, 11, 16 |
| NGC 4395 | 5.47 | 8.32 ± 0.04 | −0.343 ± 0.072 (0.066) | 0.064 | 7.14 ± 0.07 | −0.629 ± 0.119 (0.085) | 0.104 | 5, 13, 16, 17 |
| UGC 07557 | 4.54 | 8.32 ± 0.06 | −0.176 ± 0.118 (0.176) | 0.057 | 7.15 ± 0.14 | −0.361 ± 0.280 (0.413) | 0.135 | 15 |
| NGC 4449 | 3.76 | 8.26 ± 0.01 | −0.207 ± 0.034 (0.063) | 0.028 | 7.03 ± 0.03 | −0.369 ± 0.053 (0.122) | 0.051 | 1, 2, 8, 9, 12 |
| 13, 16 | ||||||||
| CG071−090 | 1.98 | 8.19 ± 0.02 | −0.344 ± 0.060 (0.074) | 0.026 | 6.86 ± 0.02 | −0.525 ± 0.074 (0.104) | 0.032 | 7, 16 |
| UGC 09614 | 7.23 | 8.18 ± 0.09 | −0.218 ± 0.128 (0.198) | 0.063 | 6.88 ± 0.14 | −0.389 ± 0.195 (0.262) | 0.096 | 7, 16 |
| UGC 12709 | 7.86 | 8.48 ± 0.08 | −0.358 ± 0.113 (0.136) | 0.084 | 7.31 ± 0.15 | −0.546 ± 0.210 (0.217) | 0.156 | 16 |
References: 1 – Berg et al. (2012), 2 – Böker et al. (2001), 3 – Croxall et al. (2009), 4 – Egorov, Lozinskaya & Moiseev (2013), 5 – Esteban et al. (2009), 6 – Gil de Paz et al. (2000), 7 – Haurberg, Rosenberg & Salzer (2013), 8 – Ho, Filippenko & Sargent (1997), 9 – Hunter, Gallagher & Rautenkranz (1982), 10 – Hunter & Hoffman (1999), 11 – Kobulnicky & Skillman (1996), 12 – Lequeux et al. (1979), 13 – McCall, Rybski & Shields (1985), 14 – Moustakas & Kennicutt (2006), 15 – Romanishin, Strom & Strom (1983), 16 – SDSS (York et al. 2000), 17 – van Zee et al. (1998), 18 – van Zee & Haynes (2006).
Surface brightness profiles
We constructed radial surface brightness profiles in the infrared W1 band (with an isophotal wavelength of 3.4 μm) using the publicly available photometric maps obtained in the framework of the Wide-field Infrared Survey Explorer (WISE) project (Wright et al. 2010). The conversion of the photometric map into the surface brightness profile is discussed in Pilyugin et al. (2014b). Parameters such as the galaxy centre, the position angle of the major axis, and the axis ratio are obtained through fitting of the isophotes by ellipses.
We also constructed radial surface brightness profiles in the SDSS g and r bands using the photometric maps of SDSS data release 9 (Ahn et al. 2012). To estimate the optical isophotal radius R25 of a galaxy, the surface brightnesses in the SDSS filters g and r were converted to B-band brightnesses, and the AB magnitudes were reduced to the Vega photometric system using the conversion relations and solar magnitudes of Blanton & Roweis (2007).
Swaters & Balcells (2002) reported surface brightness profiles in the R band for a large number of galaxies. Fig. 1 shows the comparison between our measured surface brightness profiles in the SDSS r band (solid line) and R-band profiles (open circles) from Swaters & Balcells (2002). Our surface brightness profiles within the optical isophotal radius R25 agree satisfactorily well with those of Swaters & Balcells (2002).
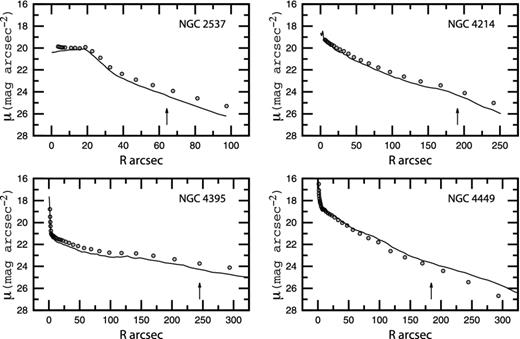
Comparison between the measured surface brightness profiles in the SDSS r band (line) obtained here and profiles in the R band (open circles) from Swaters & Balcells (2002). The arrow marks the optical isophotal radius R25.
All surface brightness measurements were corrected for Galactic foreground extinction using the AV values from the recalibration of the maps of Schlegel, Finkbeiner & Davis (1998) by Schlafly & Finkbeiner (2011) and the extinction curve of Cardelli, Clayton & Mathis (1989), assuming a ratio of total to selective extinction of RV = AV/EB − V = 3.1. The AV values given in the NED were adopted. To transform the surface brightness measurements to solar units, we used the magnitude of the Sun in the W1 band, which we obtained from its magnitude in the V band and from its colour (V − W1)⊙ = 1.608 taken from Casagrande et al. (2012).
The radial profiles in the SDSS g and r bands were used to estimate the isophotal R25 radius of each galaxy. The obtained radial profiles were reduced to a face-on galaxy orientation. Note that the inclination correction is purely geometrical, and it does not include any correction for inclination-dependent internal obscuration. The values of the optical radius R25 determined here are listed in Table 1. There are no SDSS photometric maps for several galaxies of our sample. The optical radii R25 (as well as the position angle of the major axis and the inclination angle) for those galaxies were taken from the RC3 (de Vaucouleurs et al. 1991).
The observed surface brightness profile of an irregular galaxy can be fitted by an exponential (Swaters & Balcells 2002; Herrmann, Hunter & Elmegreen 2013). There are bulges, bars, or nuclear star clusters at the centres of some irregular galaxies. A bulge or a nuclear star cluster can be fitted with a general Sérsic profile. A profile showing an increase of (optical) surface brightness in the central part of a galaxy (with or without bulge-like component) will be referred to as a steep inner profile below. Irregular galaxies with a steep inner profile are presented in Fig. 2.
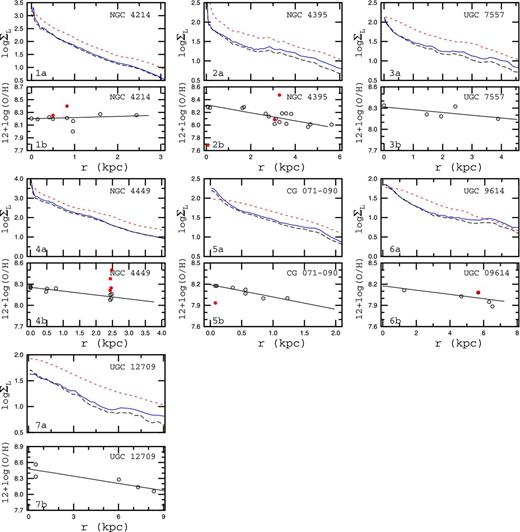
Surface brightness profiles and radial distributions of oxygen abundances for irregular galaxies with steep inner profiles. Each galaxy is presented in two panels. Each upper panel Na shows the surface brightness profiles in the SDSS g band as a light-grey (blue) solid line, in the SDSS r band as a dark (black) long-dashed line, and in the WISEW1 band as a dark-grey (red) short-dashed line. Each lower panel Nb shows the oxygen abundance in individual H ii regions as a function of radius. The dark (black) open circles show (O/H)|$_{C_{{\rm NS}}}$| abundances and the grey (red) filled circles indicate the (O/H)|$_{T_{\rm e}}$| abundances. The solid line represents the inferred linear abundance gradient.
It is known that the surface brightnesses in some irregular galaxies are flat or even increase out to a region of slope change where they tend to fall off (Swaters & Balcells 2002; Taylor et al. 2005; Herrmann et al. 2013). Such surface brightness profiles can be formally fitted by an exponential disc with a bulge-like component of negative brightness. Such profiles will be referred to as flat inner profiles below. Irregular galaxies with flat inner profiles are presented in Fig. 3.

To define the type of surface brightness profile we use our surface brightness profiles in the SDSS r band or R-band profiles from Swaters & Balcells (2002). It should be noted that the shapes of the surface brightness profiles of the same galaxy in the different photometric bands do not necessarily coincide with each other.
ABUNDANCES
Abundance determination
We determine the Te-based oxygen (O/H)|$_{T_{\rm e}}$| and nitrogen (N/H)|$_{T_{\rm e}}$| abundances in H ii regions where the auroral line [O iii] λ4363 is detected using the equations of the Te method from Pilyugin, Vílchez & Thuan (2010) and Pilyugin et al. (2012).
A new method (called the ‘C method’) for oxygen and nitrogen abundance determinations from strong emission lines has recently been suggested (Pilyugin et al. 2012, 2013). Here, the strong lines R3 = [O iii] λλ4959, 5007, N2 = [N ii] λλ6548, 6584 and S2 = [S ii] λλ6717, 6731 are used in the determinations of the oxygen (O/H)|$_{C_{\rm NS}}$| and nitrogen (N/H)|$_{C_{\rm NS}}$| abundances in individual H ii regions of our target galaxies.
Radial abundance gradients
The deprojected radii of the H ii regions were computed using their coordinates and geometrical parameters (position angle of the major axis and galaxy inclination) listed in Table 1.
The statistical error of the gradient listed in column 4 comes from the best-fitting procedure. We also estimate the bootstrapped error of the gradient in the following way. The measured H ii regions in a galaxy are numbered from 1 to n. We then produce n random integer numbers using a random number generator, and form a bootstrapped subsample of H ii regions choosing the corresponding H ii regions from the original sample of H ii regions. The amount of H ii regions in the bootstrapped subsample is adopted to be equal to the amount of the H ii regions in the original sample. Thus, some H ii regions from the original sample can be repeatedly included in the bootstrapped subsample while other H ii regions from the original sample will not at all be included in the bootstrapped subsample. If a bootstrapped subsample involves less than three different H ii regions then this subsample is rejected. The abundance gradient for the bootstrapped subsample is determined through the best fit, and the error of the original gradient, i.e. the difference between the values of the gradients for the bootstrapped subsample and for the original sample of H ii regions is obtained. We considered k = 105 bootstrapped subsamples and determined the bootstrapped error of the gradient as |$[(\sum {\rm difference}^2_j)/k]^{1/2}$|. This bootstrapped error of the oxygen abundance gradient is given in Table 2, column 4 in parenthesis.
The statistical and bootstrapped errors of the oxygen abundance gradients are close to each other except in the case of the galaxy UGC 2216 where the bootstrapped error exceeds dramatically the statistical error. This is caused by the following. The radial abundance gradient in the UGC 2216 is strongly biased by an H ii region at a galactocentric distance of 4.43 kpc. When the bootstrapped subsample does not contain this point then the value of the radial abundance gradient is very uncertain since in this case the gradient is determined from measurements at close galactocentric distances. As a result, the bootstrapped error of the radial abundance gradient for this galaxy is quite large.
The radial oxygen abundance gradients in irregular galaxies obtained here are based mainly (or only) on oxygen abundances (O/H)|$_{C_{\rm NS}}$| estimated through strong emission lines using the CNS method. Figs 2 and 3 show that the scatter in the (O/H)|$_{C_{\rm NS}}$| abundances around the general radial trend is often lower than the scatter in the (O/H)|$_{T_{\rm e}}$| abundances. Five galaxies from our present sample are in the list of galaxies considered in our previous study (Pilyugin et al. 2014a). The values of gradients obtained here are slightly different from those reported in our previous study for the following reasons. First, in our current work we obtain and use new parameters for our target galaxies such as inclination, position angle of the major axis, and optical isophotal radius. Furthermore, in Pilyugin et al. (2014a) the oxygen and nitrogen abundances were estimated via the CON method for H ii regions with available measurements of the [O ii] λλ3727, 3729 emission line, and with the CNS method for the other H ii regions. In our current study, the oxygen and nitrogen abundances were estimated through the CNS method for all H ii regions, and Te-based abundances are added.
DISCUSSION AND CONCLUSIONS
Fig. 2 shows the surface brightness profiles and radial distributions of the oxygen abundances for the irregular galaxies with steep inner profiles. Each galaxy is presented in two panels. Each upper panel Na shows the surface brightness profiles in the SDSS g band as a light-grey (blue) solid line, in the SDSS r band as a dark (black) long-dashed line, and in the WISEW1 band as a dark-grey (red) short-dashed line. Each lower panel Nb shows the oxygen abundance in individual H ii regions (open circles) as a function of radius. The linear best fit to those data is indicated by a solid line. Fig. 2 shows that irregular galaxies with steep inner profiles have appreciable radial abundance gradients.
Fig. 3 shows the surface brightness profiles and radial distributions of the oxygen abundances for irregular galaxies with flat inner profiles. Inspection of Fig. 3 shows that the radial abundance gradients in the irregular galaxies with flat inner profiles are shallower than the gradients in irregular galaxies with steep inner profiles.
Thus, our data suggest that there is a relation between the radial abundance gradient in an irregular galaxy and its surface brightness profile. Panel a of Fig. 4 shows the radial oxygen abundance gradient as a function of optical radius R25 for our sample of irregular galaxies. The dark (black) open circles mark irregular galaxies with steep inner photometric profiles. The dark-grey (red) open squares denote galaxies with flat inner profiles. The dark (black) dotted line is the arithmetic mean of the gradients for galaxies with steep inner photometric profiles, whereas the dark-grey (red) dashed line is the mean for galaxies with flat inner photometric profiles. The light-grey (green) solid line is the arithmetic mean of the gradients for all our galaxies (both those with steep and those with flat inner profiles). Since the numbers of galaxies in our samples are small even one deviant galaxy may appreciably change the arithmetic mean for the sample. Indeed the arithmetic mean of the gradients for galaxies with steep inner photometric profiles is changed by ∼0.05 dex |$R_{25}^{-1}$| when the deviating galaxy NGC 4214 (with a positive gradient 0.049 dex |$R_{25}^{-1}$|) is excluded from consideration.

The panel a shows the oxygen abundance gradient as a function of optical radius R25. The dark (black) open circles mark irregular galaxies with steep inner photometric profiles. The dark-grey (red) open squares denote galaxies with flat inner photometric profiles. The dark (black) dotted line is the arithmetic mean of the gradients for galaxies with steep inner profiles, the dark-grey (red) dashed line for galaxies with flat inner profiles, and the light-grey (green) solid line the total sample. Panel b shows the same as panel a but for the nitrogen abundance gradients. Panel c shows the oxygen abundance gradients with bootstrapped errors. On the right-hand side of the panel, the mean values of the gradients for the sample of galaxies with steep inner photometric profiles, the filled dark (black) circle, for the sample of galaxies with flat inner photometric profiles, the filled dark-grey (red) square, and for total sample, the light-grey (green) asterisk, and their 95 and 68 per cent confidence intervals are shown. Panel d shows the same as panel c but for the nitrogen abundance gradients.
Panel b of Fig. 4 shows the same as panel a but for the nitrogen abundance gradients. Comparison between panels a and b shows that the general picture is similar for oxygen and nitrogen abundance gradients, i.e. the irregular galaxies with flat inner photometric profiles have shallower nitrogen abundance gradients as compared to galaxies with steep inner photometric profiles.
Panel c of Fig. 4 shows the radial oxygen abundance gradients with bootstrapped errors (reported in Table 2 in parenthesis). The filled dark (black) circle on the right-hand side of the panel shows the mean value of the gradients within its 95 and 68 per cent confidence intervals for the sample of galaxies with steep inner photometric profiles. To estimate the confidence interval of the mean value of the gradients of the sample of galaxies the bootstrap method is used. We create 105 bootstrapped subsamples from the original sample of gradients keeping the size of each bootstrapped subsample equal to the size of the original sample, and modifying the value of the original gradient of each galaxy by introducing a random error. This error is randomly chosen from a set of errors that follow a Gaussian distribution scaled to the standard deviation corresponding to the bootstrapped error of abundance gradient (reported in Table 2 in parenthesis). We consider the distribution of the mean values of the abundance gradients for those 105 bootstrapped subsamples and determine the 95 and 68 per cent confidence intervals of the mean abundance gradient for the sample of galaxies. The filled dark-grey (red) square shows such a mean value of the abundance gradients for the sample of galaxies with flat inner photometric profiles, and the light-grey (green) asterisk shows the one for the total sample of galaxies. Panel d of Fig. 4 shows the same as panel c but for the radial nitrogen abundance gradients.
The difference between the mean values of the oxygen abundance gradients for galaxies with steep and flat inner photometric profiles is estimated in a similar way and amounts to −0.126 dex |$R_{25}^{-1}$| within the 95 per cent confidence interval (−0.306, 0.059). The difference between the mean values of the nitrogen abundance gradients is −0.236 dex |$R_{25}^{-1}$| within the 95 per cent confidence interval (−0.540, 0.073). The difference between the mean values of the abundance gradients in irregular galaxies with steep and flat inner photometric profiles exists (is less than 0) at 91 per cent confidence level for oxygen abundance gradients and at 94 per cent confidence level for nitrogen abundance gradients.
Thus, our data suggest that (i) there are radial abundance gradients in irregular galaxies, and (ii) there is a difference between radial abundance gradients in irregular galaxies with steep and flat inner photometric profiles with a probability higher than 90 per cent.
It should be noted that here the abundances are determined through the C and Te methods. The C method is based on the abundances derived via the Te method and, consequently, produces the abundances on the same metallicity scale as the Te method. If the abundances derived using the Te method are not correct for some reason (e.g. because of small-scale temperature fluctuations within an H ii region, Peimbert 1967, or if the energies of the electrons in an H ii region do not follow a Maxwell distribution, Dopita et al. 2013) then our abundances should be revised. Furthermore, the absolute metallicity scale of H ii regions varies up to ∼0.7 dex depending on the calibration used (Kewley & Ellison 2008). As was noted above, a prominent characteristic of the previous calibrations is that they are not applicable across the whole range of metallicities of H ii regions but only within a limited interval. The oxygen abundances of irregular galaxies typically are within or near the transition zone in the R23–O/H diagram where previous calibrations cannot be used or where they provide abundances with large uncertainties. Therefore the Te- and C-based abundances are preferable for irregular galaxies.
It is known (e.g. Searle & Sargent 1972; Pagel 1997) that the radial distribution of oxygen abundances in the disc of a galaxy is controlled by the variation of the astration level (or gas mass fraction μ) with radius and by the mass exchange between a galaxy and the surrounding medium (via galactic winds and/or gas infall/merging) and between different parts of a galaxy. Taking into consideration the radial variation of the astration level, one may expect that physical gradients (expressed in dex kpc−1) in irregular galaxies can be even steeper than those in spiral galaxies. The metallicities in irregular galaxies are typically lower than the ones in spiral galaxies since irregular galaxies are less massive and less evolved. The simple model for the chemical evolution of galaxies predicts that the oxygen abundance O/H varies with gas mass fraction μ more strongly at low metallicity. Thus a similar change of μ along the radial direction would result in a larger change of O/H in irregular galaxies than in spiral galaxies.
Radial mixing of gas flattens the abundance gradient in the disc of a galaxy. Radial mixing of gas can be caused by interacting or merging galaxies (e.g. Rupke, Kewley & Barnes 2010a; Rupke, Kewley & Chien 2010b) and by galactic fountains (galactic winds and subsequent gas infall). The arguments pro and contra galactic wind-dominated evolution of irregular galaxies are discussed in many studies devoted to the chemical evolution of galaxies (Skillman 1997; Cavilán et al. 2013, among many others). A galactic wind can be caused by the injection of energy by multiple, spatially and temporally clustered supernovae in a galaxy undergoing a starburst (De Young & Gallagher 1990; Mac Low & Ferrara 1999). The efficiency of the galactic winds depends on the number of massive stars that are progenitors of supernovae in a star formation event. Lee et al. (2009) found that continuous, steady star formation dominates in the present epoch in dwarf galaxies. Only ∼6 per cent of low-mass galaxies experience strong star formation bursts. The fraction of stars formed in starbursts is ∼23 per cent. However, it is not clear whether a strong star formation burst can occur with equal probability in every galaxy or whether a starburst happens only in a particular subset of galaxies.
Thus, we can interpret our results in the following manner. Irregular galaxies with steep inner profiles do not seem to undergo strong radial mixing of gas at the present epoch and show considerable radial abundance gradients. The radial mixing of gas (through radial flows or galactic fountains) took place in irregular galaxies with flat inner profiles, resulting in shallower (if any) gradients as compared to the galaxies with steep inner profiles. It should be noted that the physical reason for different radial profile types is still a mystery. It is not even clear why there is an exponential drop-off of the brightness profile (Herrmann et al. 2013).
SUMMARY
We determined the abundance distributions traced by H ii regions and compare their shape with the surface brightness profiles of the discs of 14 irregular Sm and Im galaxies (morphological T types 9 and 10). We used the emission line intensities in published spectra of H ii regions from different studies to infer the abundances. The oxygen (O/H)|$_{T_{\rm e}}$| and nitrogen (N/H)|$_{T_{\rm e}}$| abundances in the H ii regions with the detected auroral line [O iii] λ4363 were determined using the equations of the classic Te method. In the other H ii regions, oxygen (O/H)|$_{C_{\rm NS}}$| and nitrogen (N/H)|$_{C_{\rm NS}}$| abundances were obtained through the C method. We then quantified the values of the gradients of the radial abundance profiles.
Moreover, we constructed radial surface brightness profiles in the infrared W1 WISE band and in the SDSS g and r bands using the publicly available photometric maps. The irregular galaxies of our sample can be divided into two types according to the shapes of their surface brightness profiles: those with steep inner profiles, and those with flat inner profiles.
We find that there is a correspondence between the radial abundance gradient in an irregular galaxy and its surface brightness profile with a probability higher than 90 per cent. Irregular galaxies with steep inner profiles usually show a considerable radial abundance gradient. Irregular galaxies with flat inner surface brightness profiles have shallower gradients (if any) as compared to galaxies with steep inner profiles.
Thus, irregular galaxies with steep inner profiles show usually a pronounced radial abundance gradient that resembles that of spiral galaxies. In that sense, those irregular galaxies seem to extend the Hubble sequence of spiral galaxies. In other words, our data suggest that there is no ‘spiral versus irregular dichotomy’ in terms of radial abundance gradients existing only in spiral galaxies, but not in irregulars. While irregulars have long been believed to be chemically homogeneous, our study shows that given enough measurements of nebular abundances of H ii regions across a wide range of galactocentric radii, irregulars may well exhibit radial abundance gradients. This tendency is particularly conspicuous in irregulars with steep surface brightness profiles in their inner regions.
We are grateful to the referee for his/her constructive comments.
LSP, EKG, and IAZ acknowledge support within the framework of Sonderforschungsbereich (SFB 881) on ‘The Milky Way System’ (especially subproject A5), which is funded by the German Research Foundation (DFG).
LSP and IAZ thank the hospitality of the Astronomisches Rechen-Institut at Heidelberg University where part of this investigation was carried out.
This work was partly funded by the subsidy allocated to Kazan Federal University for the state assignment in the sphere of scientific activities (LSP).
We thank R. A. Swaters and M. Balcells for supporting us with the surface brightness profiles of galaxies from their sample in numerical form.
This research made use of montage, funded by the National Aeronautics and Space Administration's Earth Science Technology Office, Computational Technnologies Project, under Cooperative Agreement Number NCC5-626 between NASA and the California Institute of Technology. The code is maintained by the NASA/IPAC Infrared Science Archive.
Funding for the SDSS and SDSS-II has been provided by the Alfred P. Sloan Foundation, the Participating Institutions, the National Science Foundation, the US Department of Energy, the National Aeronautics and Space Administration, the Japanese Monbukagakusho, the Max Planck Society, and the Higher Education Funding Council for England. The SDSS Web Site is http://www.sdss.org/.
The NASA/IPAC Extragalactic Database (NED) is operated by the Jet Propulsion Laboratory, California Institute of Technology, under contract with the National Aeronautics and Space Administration (http://ned.ipac.caltech.edu/).
